Sample Category Title
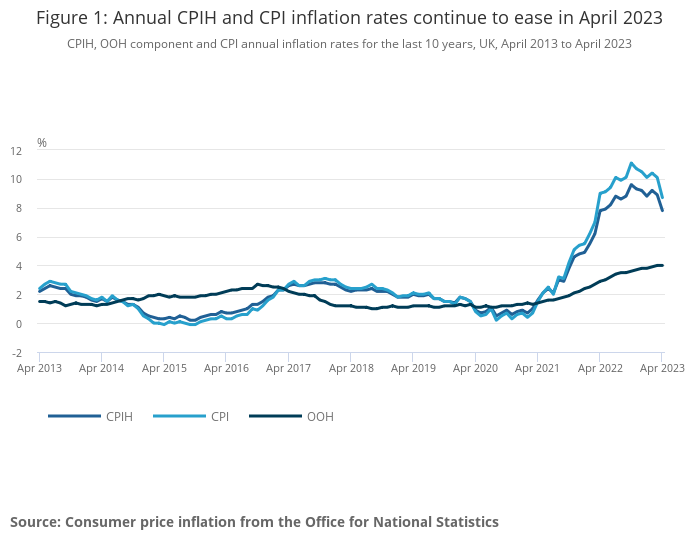
UK CPI slowed to 8.7%, CPI core rose to highest since 1992
UK CPI slowed from 10.1% yoy to 8.7% yoy in April, above expectation of 8.2% yoy. On a monthly basis, CPI rose by 1.2% mom, above expectation of 0.8% mom.
CPI core (excluding energy, food, alcohol and tobacco) rose from 6.2% yoy to 6.8% yoy, above expectation of 6.2% yoy. That's the highest level since March 1992.
CPI goods annual rate eased from 12.8% yoy to 10.0% yoy, while the CPI services annual rate rose from 6.6% yoy to 6.9% yoy.
NZD/USD dives after dovish RBNZ hike
RBNZ raised OCR by 25bps to 5.50% today, reaching the projected peak interest rate. The decision was made by a 5-2 vote, with two committee members voted for no change. The central bank noted that "The OCR will need to remain at a restrictive level for the foreseeable future, to ensure that consumer price inflation returns to the 1% to 3% annual target range, while supporting maximum sustainable employment."
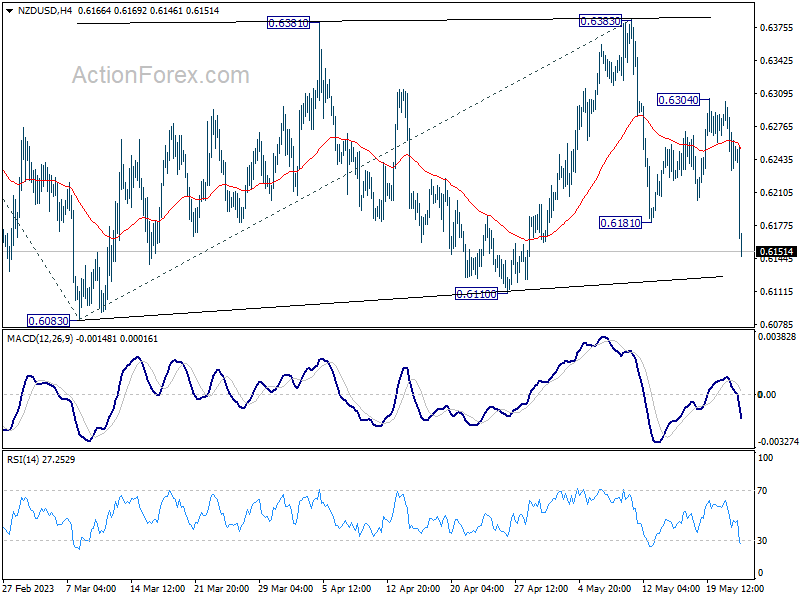
The overall announce was seen as being dovish by the markets, sending New Zealand Dollar broadly lower. NZD/USD's break of 0.6181 support confirms resumption of the decline from 0.6383 for retesting 0.6083/0.6110 support zone.
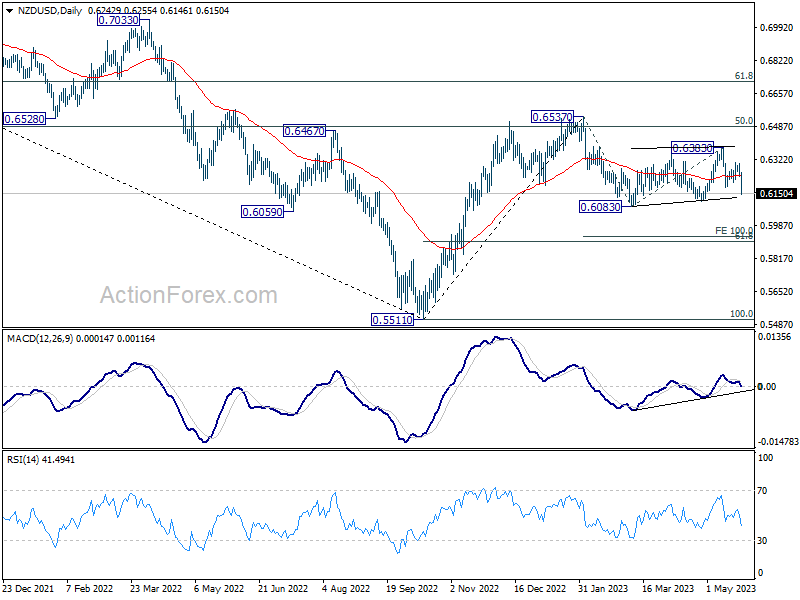
More importantly, the development is inline with the view that corrective pattern from 0.6083 has completed with three waves up to 0.6383. That is, the decline from 0.6537 might be ready to resume too. Firm break of 0.6083 will target 100% projection of 0.6537 to 0.6083 from 0.6383 at 0.5929.
(RBNZ) Official Cash Rate (OCR) set to remain restrictive
The Monetary Policy Committee today voted to raise the Official Cash Rate (OCR) from 5.25% to 5.50%.
The Committee agreed the level of interest rates are constraining spending and inflation pressure. The OCR will need to remain at a restrictive level for the foreseeable future, to ensure that consumer price inflation returns to the 1% to 3% annual target range, while supporting maximum sustainable employment.
Global economic growth remains weak and inflation pressures are easing. This follows a period of significant monetary policy tightening by central banks internationally. International supply chain constraints have also eased following a period of disruption, and shipping costs have declined. The weaker global growth has led to lower export prices for New Zealand's goods.
In New Zealand, inflation is expected to continue to decline from its peak and with it measures of inflation expectations. However, core inflation pressures will remain until capacity constraints ease further. While employment is above its maximum sustainable level, there are now signs of labour shortages easing and vacancies declining.
Consumer spending growth has eased and residential construction activity has declined, while house prices have returned to more sustainable levels. More generally, businesses are reporting slower demand for their goods and services, and weak investment intentions. Businesses report that a lack of demand, rather than labour shortages, is now the main constraint on activity.
There has been a return of net inward migration since international borders reopened. The Committee expects the pace of immigration to ease back toward pre-COVID-19 trend levels over coming quarters. While immigration has assisted to ease labour shortages, its net impact on overall spending is uncertain. The recent recovery in tourism spending, to around three-quarters of its pre-COVID-19 trend level, is also supporting demand.
The repair and rebuild facing significant regions of the North Island — due to the recent severe weather events — will support economic activity, in particular the horizontal construction sector. The timing of this predominantly government investment will be spread over several years. Broader government spending is anticipated to decline in inflation-adjusted terms and in proportion to GDP. The Committee is confident that with interest rates remaining at a restrictive level for some time, consumer price inflation will return to within its target range of 1% to 3% per annum, while supporting maximum sustainable employment.
Read the May 2023 Monetary Policy Statement
Media contact
James Weir
Senior Advisor, External Stakeholders
Phone:021 103 1622
Email: james.weir@rbnz.govt.nz
Summary record of meeting
The Committee discussed recent developments in the New Zealand economy. The Committee agreed that monetary conditions are restricting spending and reducing inflationary pressure. However, current inflation remains high and spending will have to continue to slow to better match the supply capacity of the economy, so that consumer price inflation returns to its target range. While employment indicators reflect easing capacity pressures, they remain elevated.
Global economic growth has slowed below trend for most of our key trading partners. The Committee noted this weakness has been reflected in slowing demand for our goods exports, as seen in lower dairy and meat prices. For a number of years, COVID-19 and the war in Ukraine have constrained global production, disrupted supply chains, and increased shipping costs. These global supply bottlenecks have eased and commodity prices – in particular oil prices – have remained below their peaks in early 2022. Overall, headline inflation is continuing to decline amongst our key trading partners. Nevertheless, core inflation remains elevated in most of our trading partner economies.
Members discussed developments in global financial markets. Recent banking stress in the United States and Europe has been contained by regulators so far but has added to financial market volatility, tighter credit conditions, and uncertainty regarding the global economic outlook. The impacts from these events on domestic financial conditions have been limited to date, and the New Zealand banking system is sound.
The Committee discussed domestic economic developments. Economic activity in New Zealand contracted by 0.6% in the December 2022 quarter. This contraction was unexpected. Business and residential investment and overall government spending contracted in the December 2022 quarter, and domestic spending remained flat. The near-term outlook for activity remains subdued.
In addition, annual CPI inflation was lower than assumed in the February Statement, easing to 6.7% in the March 2023 quarter. Short-term price pressure from recent severe weather events appears to have been less than initially assumed. Both annual non-tradables and tradables inflation were lower than expected, with a reduction in tradables inflation accounting for a larger share of the overall decline in inflation.
Members discussed the evidence that demand is slowing in those parts of the economy that are most sensitive to higher interest rates. The constraining impact of higher interest rates has been most visible in spending and economic activity related to housing. Residential investment has started to ease and falling consent numbers suggest it will continue to slow. Feedback from the industry suggests the pipeline of future building activity is subdued. The rebuild work following the recent floods is assumed to provide a small offset to this decline.
Members also discussed the impact interest rate increases were having on the housing market and household spending. House prices have continued to decline, while first home buyers were accounting for a larger share of new home purchases. Overall, current monetary policy is supporting a moderation in house prices to more sustainable levels. The wealth effects from this decline in house prices have contributed to slowing spending on durable goods since early 2022. In addition, the rate of credit growth for households has declined.
The Committee discussed evidence that elevated interest rates were constraining business activity. Businesses are reporting a general slowing in demand, a weaker outlook for investment, and business credit growth has declined. Businesses are also reporting that orders are now the main constraint on activity – after a period of it being labour availability.
The Committee noted that while the total number of international visitors remains below pre-COVID-19 levels, its recovery since the border was reopened has supported aggregate demand.
Members discussed the recent increase in net inward migration. The projections incorporate a stronger starting point for net inward migration. The Committee discussed what this stronger starting point for migration means for the economy. Overall, it suggests that spending and activity have been subdued, even in an environment of strong population growth. The increase in net inward migration is providing some relief in a very tight labour market, but the net impact on demand – including for housing – is uncertain, as is the impact on inflationary pressure.
Members noted this increase in migration is assumed to be temporary. Migration is assumed to fall back towards the average inflows seen in the years preceding COVID, and settle at an inflow of around 36,000 working age people per year. While the recent increase may partly reflect some pent-up demand to migrate to New Zealand, immigration rules have also been eased to alleviate acute labour shortages in some sectors. The Government recently made it temporarily possible for some migrants on work visas who had already been living in New Zealand for a period to apply for a special resident class visa. Given these new residents would have already been participating in the economy and the housing market as renters, it is expected this change will add only modest pressure to housing demand.
The Committee discussed likely economic impacts of recent severe weather events. Public infrastructure was significantly damaged. Clean-up, repair and rebuild work continues. While estimates are uncertain, the Committee assumes the recovery from these events will add about 1.5 percent to GDP spread out over a number of years.
Members discussed the impact of Budget 2023. Fiscal policy is projected to add to demand over the 2023/24 fiscal year, then dampen demand in subsequent years. Overall, fiscal policy will be contractionary on demand over the projection horizon. This reflects that government consumption, which is the larger share of government spending, is expected to fall as a share of GDP in coming years. Government investment is expected to continue to grow, in part due to the repair and rebuild work in the aftermath of the weather events. Fiscal policy is projected to be less contractionary than the Committee had assumed in February.
The Committee also discussed the functioning of the New Zealand Government bond market. This was particularly in the context of an expansion to the New Zealand Treasury's bond issuance programme, and ongoing sales of bonds in the Large Scale Asset Purchase Programme portfolio. Overall, the market continues to function in line with historic norms. Notably spreads between government bond and swap rates have remained relatively stable.
The Committee discussed the New Zealand labour market. Employment is above its maximum sustainable level. The unemployment rate was 3.4% in the March 2023 quarter, still near record lows. However, same-job wage inflation was weaker than expected. The majority of maximum sustainable employment measures are now pointing to less labour market capacity pressure relative to March last year. Firms are reporting that labour is now less of a constraint to production. In addition, measures of skilled and unskilled labour shortages have eased.
Members discussed inflation expectations. Measures of the inflation expectations of businesses have eased, while household inflation expectations moved higher. It was noted that there was increasing evidence that New Zealand households were putting greater weight on recent past inflation outturns when setting their inflation expectations. This has likely contributed to persistence in domestic inflationary pressure as inflation has risen.
The Committee discussed evidence that monetary conditions are having a contractionary effect on the economy. Members were confident that the interest rates faced by firms and households have constrained spending and investment for some time. This reflects the significant increase in the Official Cash Rate (OCR) that has occurred since late 2021.
The Committee then discussed if monetary conditions were contractionary enough to get inflation back to the 1-3% target in a suitable timeframe. Overall, current mortgage rates and business lending rates were restrictive, supporting a further moderation in inflation. A normalisation in bank funding costs, including increases in retail term deposit rates, is expected to support the maintenance of current mortgage rates. Some households would further limit their spending as they rolled onto higher fixed mortgage rates. Debt servicing costs for households have risen from historically low levels during the pandemic, and are projected to rise further. In addition, the usual lags of monetary policy transmission mean that the full effects of past OCR increases will still take some time to occur.
Members discussed the key economic developments they would need to see in coming quarters to remain confident that lending rates around current levels remained sufficiently contractionary. The Committee noted that the projections incorporate a moderation in inflation and inflation expectations, a continued slowing in household spending growth, and a continued moderation in global inflationary pressure.
Members discussed the key risks to the outlook for activity and inflation. Views on the outlook for the inflationary impact of migration were mixed. Some members saw the risk that strong migration inflows could persist for longer than assumed in current projections and boost spending and inflation. Other members saw the risks as more balanced. In particular, there were not yet obvious signs that high rates of migration were affecting house prices and spending – and there were reasons to believe that current strength reflects pent up demand, and will prove temporary. In addition, migration could further alleviate labour shortages. There has also been a recent change in policy settings in Australia that eases the pathway to citizenship for emigrating New Zealanders. The effect of this on both the quantity and composition of net migration has yet to be seen.
Some members saw upside risk to tourism activity. New Zealand has already experienced a strong recovery in tourism. This has occurred at a time when the arrival of tourists from China has remained weak. A recovery in tourist arrivals from China would add demand in an already supply constrained sector.
The Committee discussed risks around the outlook for inflation expectations, notably the implications of evidence that New Zealand households were putting greater weight on recent past inflation outturns when setting their inflation expectations. Some members noted this could mean inflation expectations fall faster than in past cycles, as headline inflation declines. Others noted this behaviour could be asymmetric on the downside, and core inflation could prove stickier than currently assumed.
Members also discussed risks around the pass-through of past OCR increases to activity and inflation. Some members saw the risk of stronger than expected pass-through. Most notably, a large number of households are still facing the prospect of rolling onto higher fixed rate mortgages. This could constrain spending more than currently projected.
The Committee discussed the reaction to the April monetary policy review decision. The Committee's view in April was that inflationary pressures were still elevated, with little risk of fallout from global bank failures. In addition, the Committee was of the view that rebuild activity following recent weather events would necessitate a rise in government investment. A 50 basis point OCR increase was seen as necessary to support retail interest rates, especially given the fall in wholesale rates that had occurred at the time.
The Committee discussed the stance of policy to be confirmed at this meeting and the outlook for the OCR. The Committee was comfortable with the projected forward path for the OCR. The Committee discussed the suitability of keeping the OCR on hold at 5.25% or increasing it to 5.50%. The Committee agreed that neither decision would cause unnecessary instability in output, interest rates, or the exchange rate.
Raising the OCR to 5.50% is consistent with the projections. This reflects the view that while monetary policy is having a moderating effect on demand at this point in time, a 25 basis point increase in the OCR will increase confidence that inflation falls back to the midpoint of the target band.
The case for keeping the OCR at 5.25% with the same forward projections rested on the recognition that monetary policy is having a sufficiently moderating effect on demand and inflation, and that we are yet to see the full effects of past tightening on the economy. A pause would also allow more time to assess the impact of the significant tightening, and the timing of any further increase that might be needed.
On Wednesday 24 May, the Committee took the decision to vote on the two options. By a majority of five votes to two, the Committee agreed to increase the OCR by 25 basis points from 5.25% to 5.50%.
The Monetary Policy Committee reached a consensus that interest rates will need to remain at a restrictive level for the foreseeable future, to ensure consumer price inflation returns to the 1 to 3% target range while supporting maximum sustainable employment.
Attendees:
Reserve Bank members of MPC: Adrian Orr, Christian Hawkesby, Karen Silk, and Paul Conway.
External MPC members: Bob Buckle, Peter Harris, Caroline Saunders.
Treasury Observer: Dominick Stephens.
MPC Secretary: Adam Richardson.
NZD/USD: RBNZ Less Hawkish Tilt Reinforces USD Bulls
- RBNZ hiked its official cash rate as expected by 25 bps to 5.50%
- It is the first time RB NZ’s monetary policy-setting committee went to a vote today.
- Split vote of 5 to 2 has indicated a high probability 5.50% is the terminal rate after today’s hike.
- USD bulls are playing catch-up against prior NZD’s outperformance.
The New Zealand dollar, NZD is the weakest currency against the US dollar in today’s Asian session as it tumbled by -1.10% at this time of the writing reinforced by post-RBNZ, the New Zealand central bank’s monetary policy decision to hike as expected by 25 basis points (bps) to bring the official cash rate to 5.50%, the highest level since December 2008.
Why did the NZD fall so much since the 25-bps hike by RBNZ is already priced in?
It’s all about positioning and forward guidance. Firstly, today’s monetary policy decision after the prior surprise hawkish vibe, a 50-bps hike in April 2023 has been accompanied by a split vote of 5 to 2 in RBNZ’s monetary policy committee; the first time the committee went to a vote over its decision which has signalled that official cash rate of 5.50% after today’s hike is likely the terminal rate for its current interest rate hiking cycle.
Also, the latest RBNZ’s forecasts show that the probable path of an interest rate cut cycle will only start at the beginning of Q3 2024 which indicates that monetary policy will remain restrictive for the rest of 2023 in New Zealand.
In the recent two weeks, the US dollar strength has started to creep back into the foreign exchange market where the US Dollar Index recorded its best weekly gain of +1.4% since 19 September 2022 for the week of 8 May 2023. However, the NZD was the strongest against the USD versus other major currencies in the past two weeks as seen in the rolling one-month performance cahrt below.
Thus, the sentiment that has driven the prior NZD’s outperformance has been altered easily after today RBNZ’s less hawkish surprise tilt on its forward guidance which led to a possible US dollar bullish momentum trend following systematic trading strategies to target the laggard, NZD that explains its steep movement in today’s Asian session.
NZD is now playing catch-up to the recent US dollar strength renewal
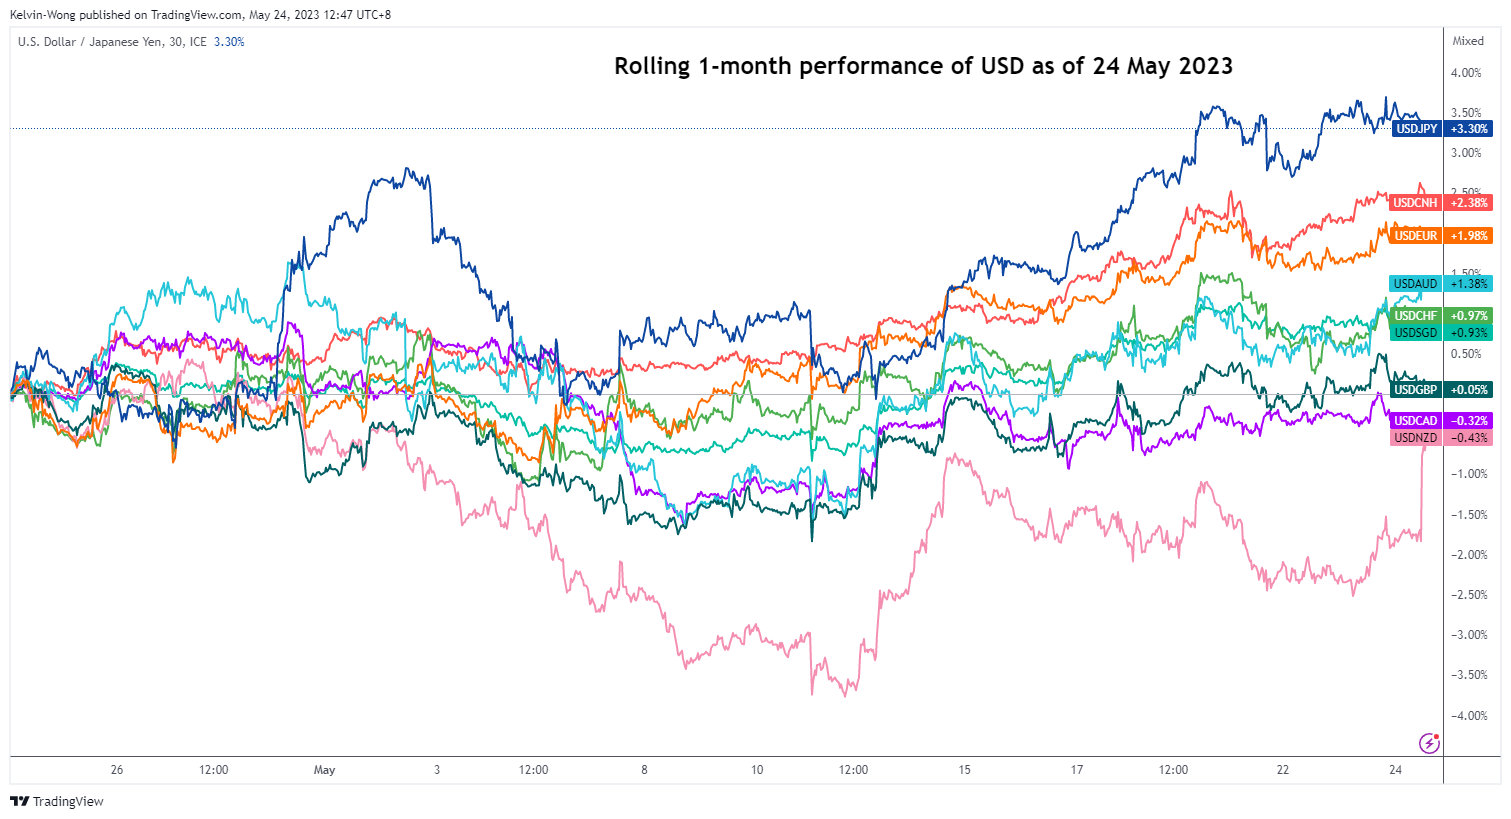
Fig 1: US dollar rolling 1-month performance against other currencies as of 24 May 2023 (Source: TradingView, click to enlarge chart)
NZD/USD Technical Analysis – Risk of a bounce within minor downtrend phase
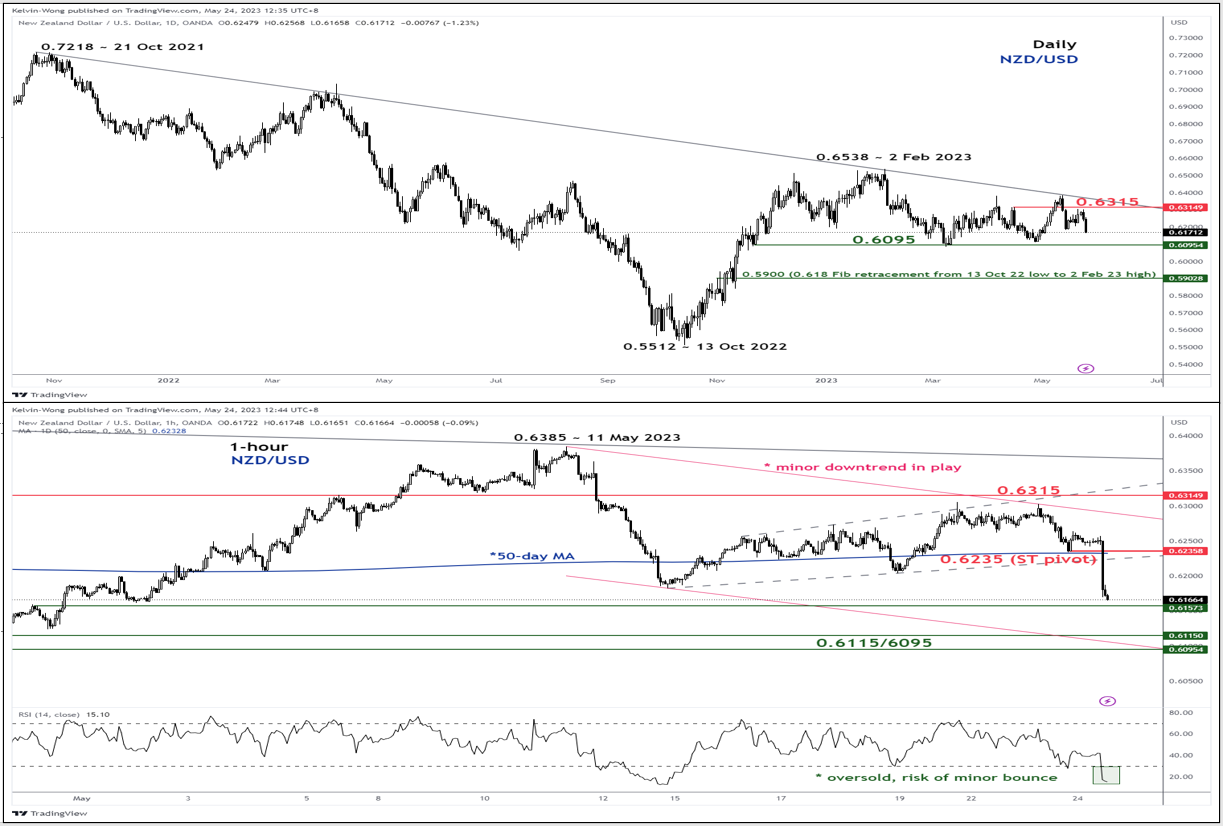
Fig 2: NZD/USD trend as of 24 May 2023 (Source: TradingView, click to enlarge chart)
The medium-term trend of the NZD/USD as highlighted on the daily chart is trapped within a complex range configuration since its 2 February 2023 high of 0.6538 after a failure to stage a breakout above a major descending trendline resistance from its 21 October 2021 swing high of 0.7218 on 11 May 2023. The medium-term range support and resistance are at 0.6095 and 0.6315 respectively.
In the shorter term as depicted on the hourly chart, its price actions have evolved into a minor downtrend (descending channel) from its 11 May 2023 minor swing high of 0.6385. Today’s Asian session’s steep decline post RBNZ’s monetary policy outcome has led the hourly RSI oscillator to hit an extremely oversold level at 15% which suggests an overextended slide where a minor bounce cannot be ruled out at this juncture.
The key short-term pivotal resistance to watch will be at 0.6235 to maintain the minor downtrend phase with the next intermediate support at 0.6115/6095. However, a clearance above 0.6235 negates the bearish tone to see the next resistance coming in at 0.6315.
First Impressions: RBNZ Monetary Policy Statement May 2023
The RBNZ tightened by 25 points to 5.5 percent and expressed confidence that this will be sufficient to bring inflation back to target. We continue to see risks that the large migration surge will ultimately require more action after July.
RBNZ Monetary Policy Statement, May 2023
The RBNZ increased the OCR as expected to 5.5 percent.
However, the big surprise was in the forward profile, in which the RBNZ strongly suggests that it is on hold from here until at least mid-2024. We see some upside risks to the RBNZ’s view, but for now see the RBNZ on hold in July, with some potential of a 25 point rise in the OCR in August.
Migration pressures are acknowledged, but the RBNZ takes a sanguine view on their impact on capacity pressures. The RBNZ’s net migration estimates are higher and imply a net 75,000 net inflow in the year to December. This is only slightly lower than Westpac’s equivalent forecast of a net 83,000 inflow (on a working-age population basis). Despite the upgrade, the RBNZ’s view is that this adds significantly to supply as well as demand. Migration is seen as having some supportive impact on house prices but by not as much as we have taken in our recent Economic Overview.
The RBNZ has upgraded its view on potential output growth, which means it has higher growth but less inflation. Implicitly, migration is adding to the economy’s capacity in tandem with demand on resources, allowing the economy to grow more strongly without adding to inflation pressures.
Government spending is not seen as a significant driver of inflation pressures. The RBNZ has inserted the recent Budget estimates into its projections and takes a sanguine view on any inflation implications. While government is adding somewhat to inflation pressures in the next year, the RBNZ’s view is that the assumed fiscal consolidation in later years will balance out those pressures.
Ongoing emphasis on pipeline tightening pressures seen as sufficient to reduce inflation significantly. There is considerable emphasis on the pipeline of interest rate increases still to be felt by households and businesses. As a result, consumer spending and residential investment are forecast to remain weak.
For the first time the Committee held a vote on the OCR decision, debating between no change and a 25 point hike. Two members voted for no change and the others for the 25 point increase. Some members discussed potential upside risks to house prices and the economy from migration, but on balance the MPC felt sufficiently confident that a 5.5 percent OCR will be sufficient to balance those risks.
The bottom line is that this is a central bank that sees itself on hold for a protracted period. Key risk factors are likely to be around the judgement of the RBNZ that the quite significant boost in population growth will quickly reverse and not add to housing market or inflation pressures. Data on house prices and migration will be important to watch in that regard. Similarly labour market indicators will be important to watch.
We now see the RBNZ on hold in July, but some potential of a 25 point rise in the OCR in August. Should this not eventuate we anticipate the RBNZ to remain on hold until after the election in October. By this time we expect that the housing market and migration pressures will be showing up fairly strongly and require a further adjustment in the OCR to the 5.75-6.00 percent range.
Technical Outlook and Review
DXY:
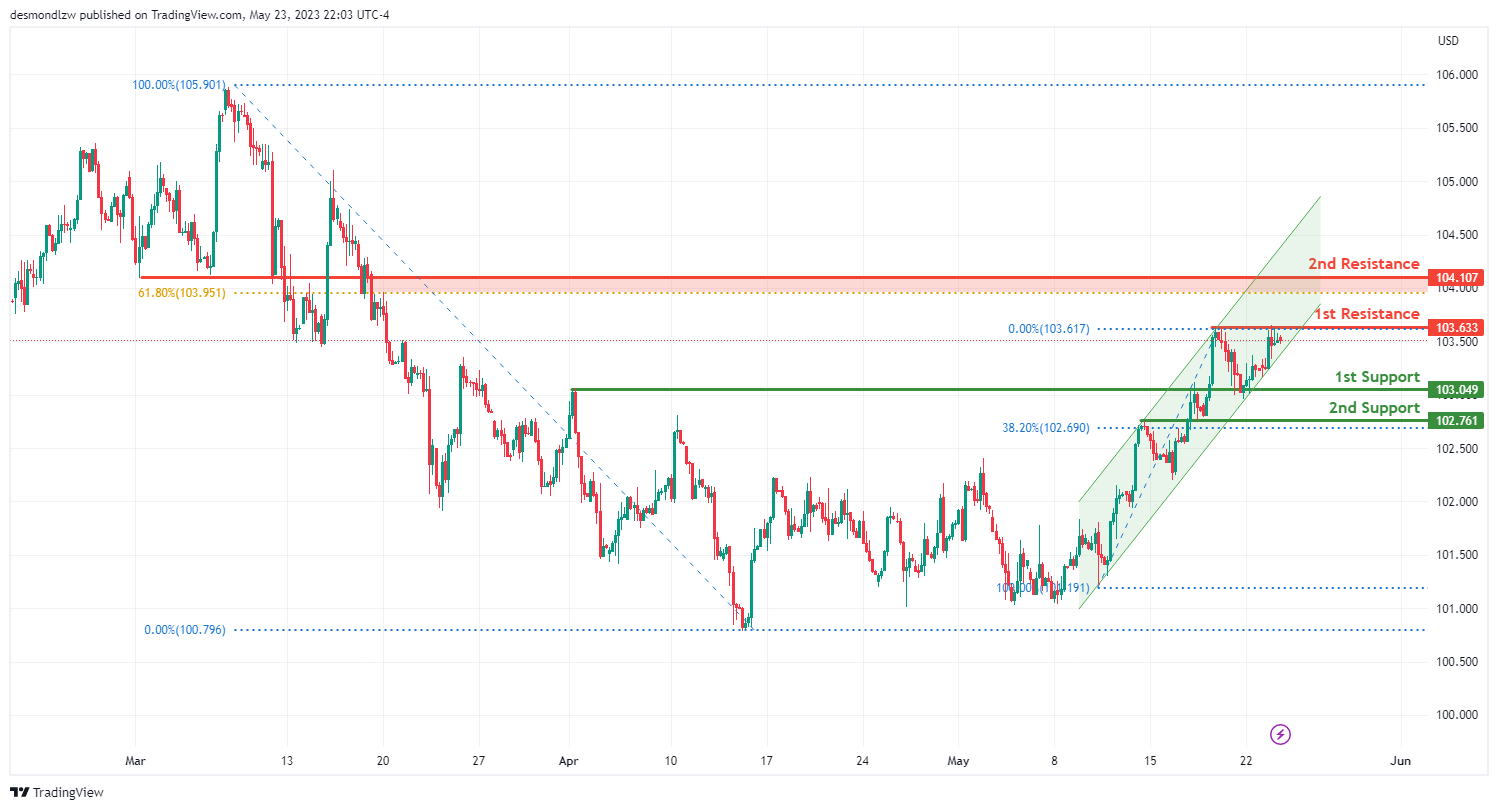
The DXY instrument is currently exhibiting a bullish trend, with the price moving in a bullish ascending channel. This indicates that the momentum is upwards and the price could potentially continue towards the first resistance level.
The first support level is located at 103.04, which acts as an overlap support and corresponds to the 38.20% Fibonacci retracement level. Overlap supports are levels that have historically acted as both support and resistance, and in conjunction with a significant Fibonacci level, this could provide a solid base for the price.
The second support level is at 102.76 and is also considered an overlap support. This could act as another potential floor for the price in the event of a retracement.
On the other hand, if the bullish momentum continues, the price could encounter resistance at 103.63, which represents a multi-swing high resistance level. This means that the price has peaked and reversed at this level on multiple occasions in the past, making it a significant barrier.
The second resistance level is at 104.10 and is characterized as a pullback resistance. This level is significant as it aligns with the 61.80% Fibonacci retracement level, which could act as a critical barrier to price increases. If the price retraces but fails to break through this level, it could signal a continuation of the bullish trend.
EUR/USD:
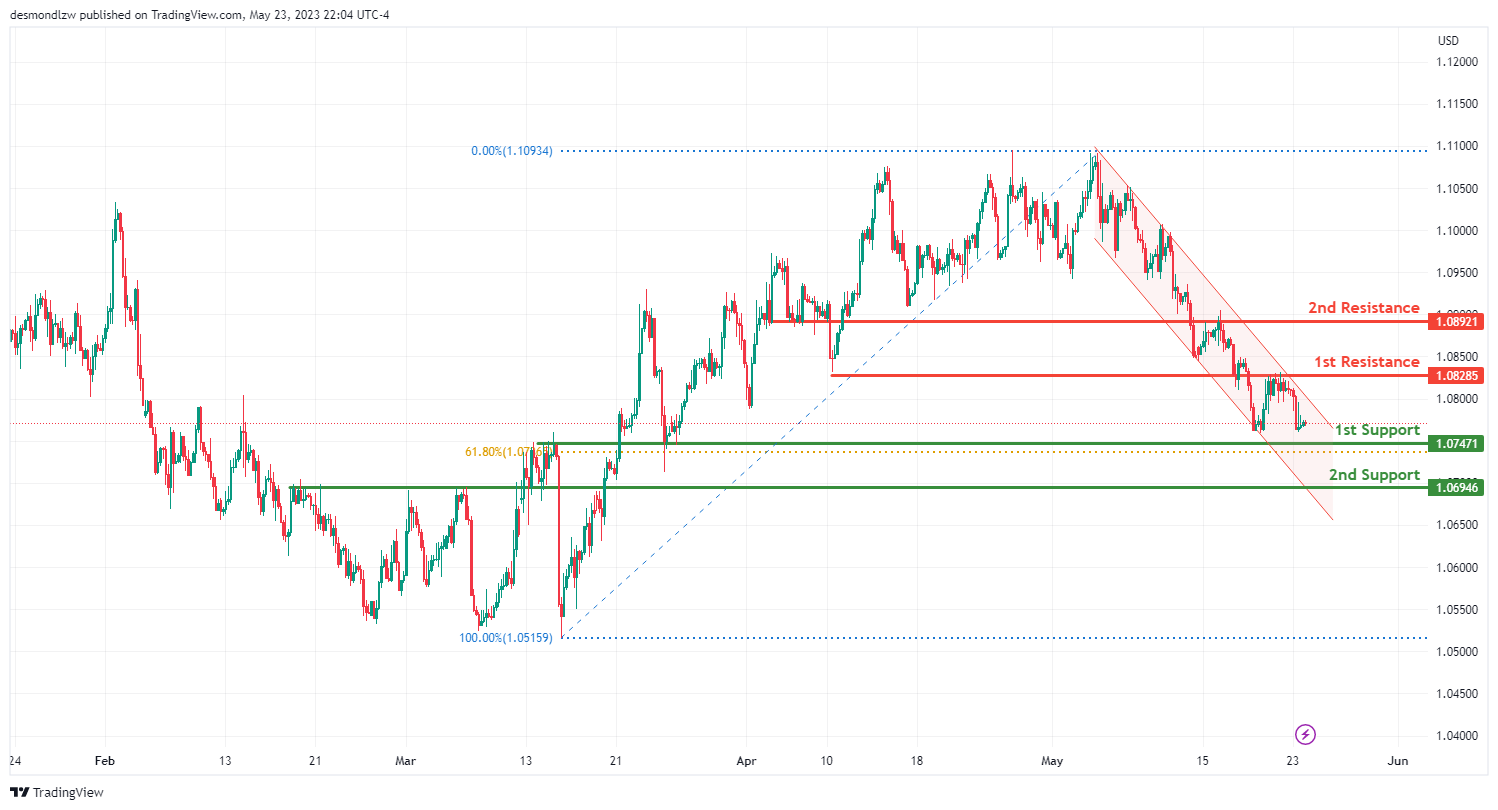
The EUR/USD pair is currently showing a bearish trend, with the price in a bearish descending channel. This suggests that there is potential for a bearish reaction off the first resistance level and a drop towards the first support level.
The first support level is set at 1.0747 and is an overlap support, which means it has historically served as both support and resistance. This could potentially provide a solid base to stop or reverse any further price decline.
The second support level is at 1.0649, which also acts as an overlap support, providing another potential floor for the price in the event of a downward movement.
On the other hand, should the price attempt to reverse its bearish trend, it could face resistance at 1.0828, which acts as an overlap resistance. This level could potentially halt an upward price movement.
The second resistance level is found at 1.0892, serving as another overlap resistance. If the price reaches this level, it might find it challenging to continue its upward trajectory and may instead reverse back towards its support levels.
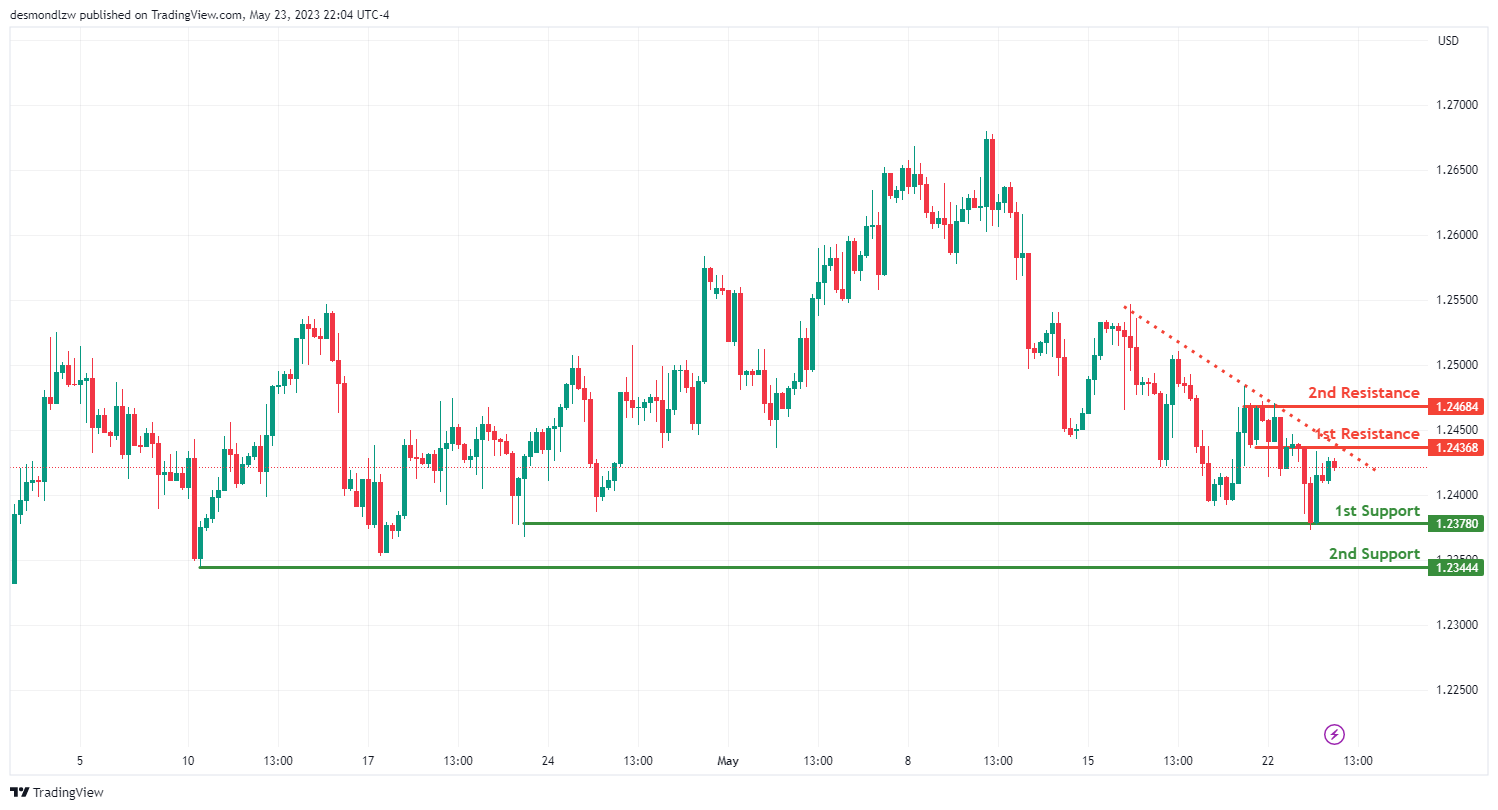
GBP/USD:
The GBP/USD pair is currently in a bearish trend, suggesting that bearish momentum is on the cards due to the price being below a major descending trend line.
The first level of support is at 1.2378, which is a multi-swing low support, indicating it is a point where the price has bottomed out multiple times in the past. This makes it a potentially strong level to halt further price drops.
The second support level is at 1.2344, acting as a swing low support, which is a point where the price has previously bottomed out, indicating its potential as a floor to prevent further declines.
On the other hand, should the price attempt to reverse its current trend, it will face resistance at 1.2436, an overlap resistance level that may potentially halt an upward price movement.
The second resistance level is at 1.2468 and is recognized as a multi-swing high resistance, meaning it has capped price increases multiple times in the past and could potentially do so again in the future.
USD/CHF:
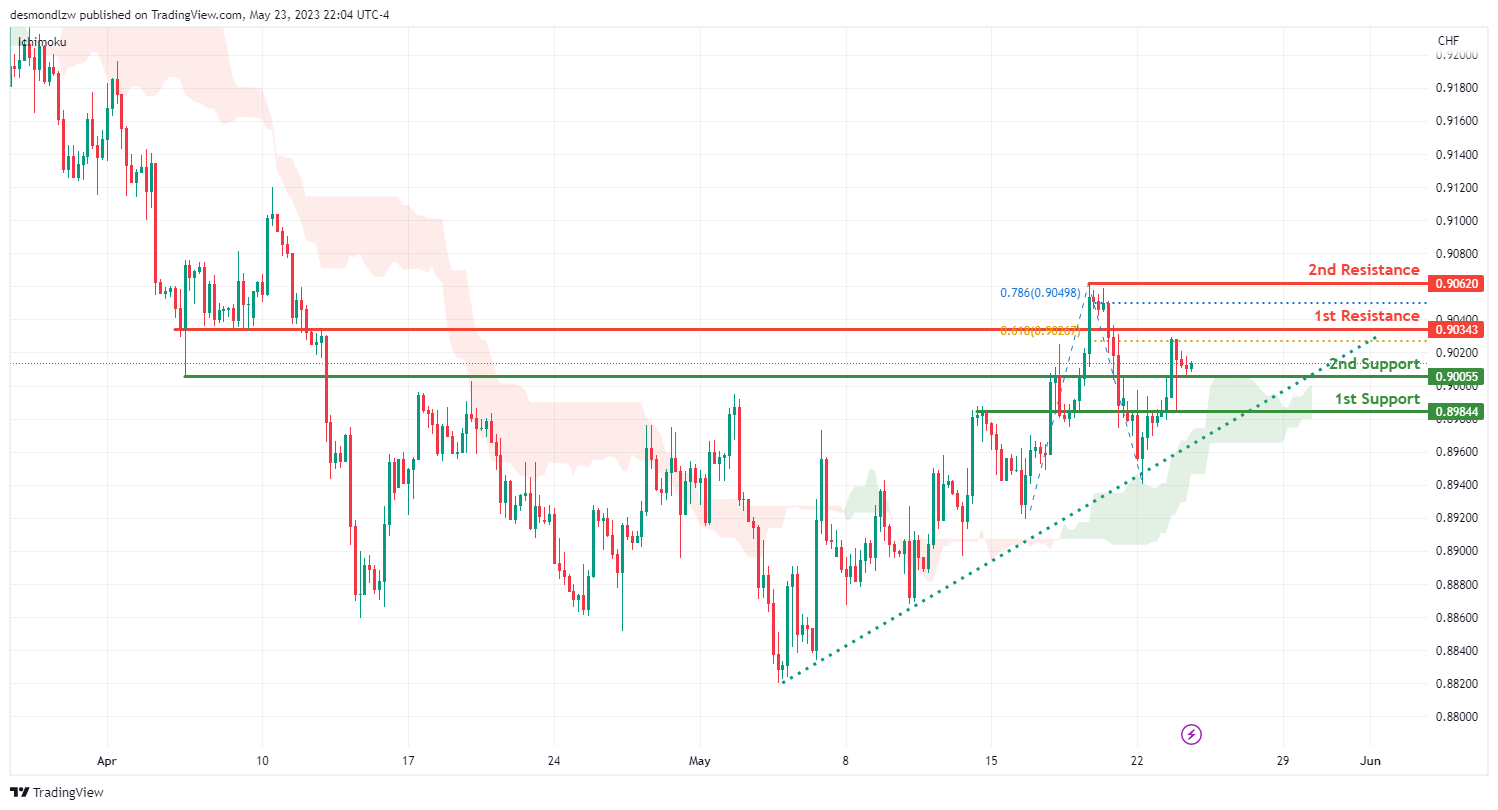
The USD/CHF pair is presently in a bullish trend, suggesting potential further bullish momentum. This is supported by the price being above a major ascending trend line and above the bullish Ichimoku cloud
The first level of support is at 0.9005, identified as an overlap support. This means the level has historically functioned as both support and resistance, potentially stopping any price decline.
The second support level is at 0.8984, also an overlap support, reinforcing its potential as a floor level to halt further drops.
On the upside, the first resistance level stands at 0.9034. This is an overlap resistance and aligns with the 61.8% Fibonacci retracement level, potentially acting as a significant barrier to any price increases.
The second resistance level is at 0.9062, which functions as a multi-swing high resistance. This means the level has historically halted price increases multiple times, potentially indicating a reversal in the future.
USD/JPY:
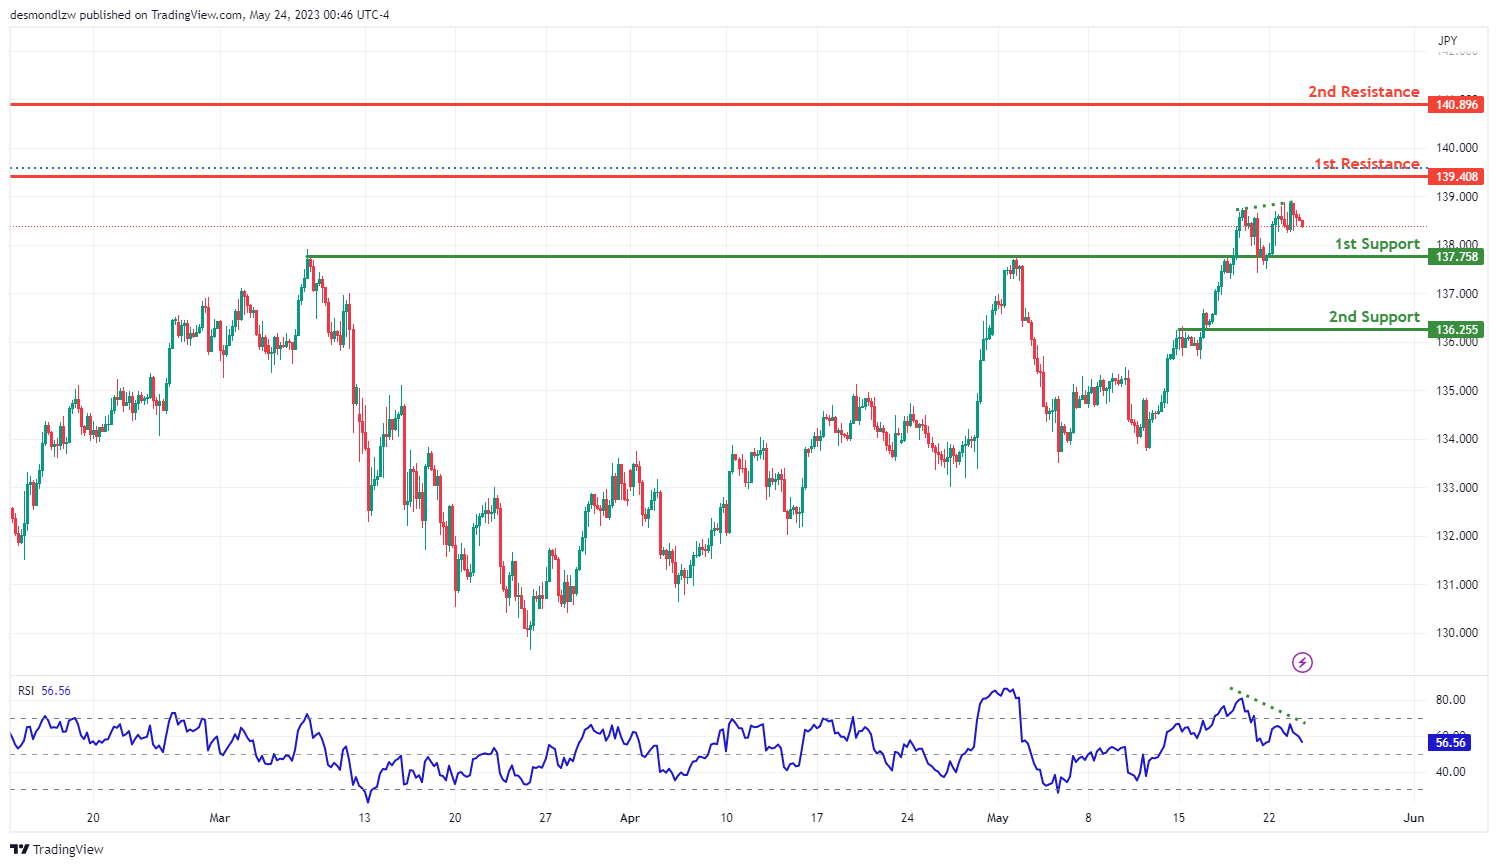
The USD/JPY pair currently shows a bearish trend, suggesting a potential continuation of price decline towards the first support level.
The first level of support is at 137.75, serving as a pullback support. Pullback supports typically signal levels where the price has previously rebounded after a short-term retracement, making it a potential stopping point for further price declines.
The second support level is at 136.25, known as an overlap support. Overlap supports have historically acted as both resistance and support, indicating it could halt or reverse any further downward movement in the pair.
On the other hand, if the price reverses direction, the first resistance level is at 139.40. This level is seen as a swing high resistance, a point at which the price has previously reversed after increasing.
The second resistance level is at 140.89, also a swing high resistance. These levels are significant as they have historically capped price increases.
Furthermore, the Relative Strength Index (RSI) is showing bearish divergence compared to the price, which often suggests a forthcoming rapid decline in price
AUD/USD:
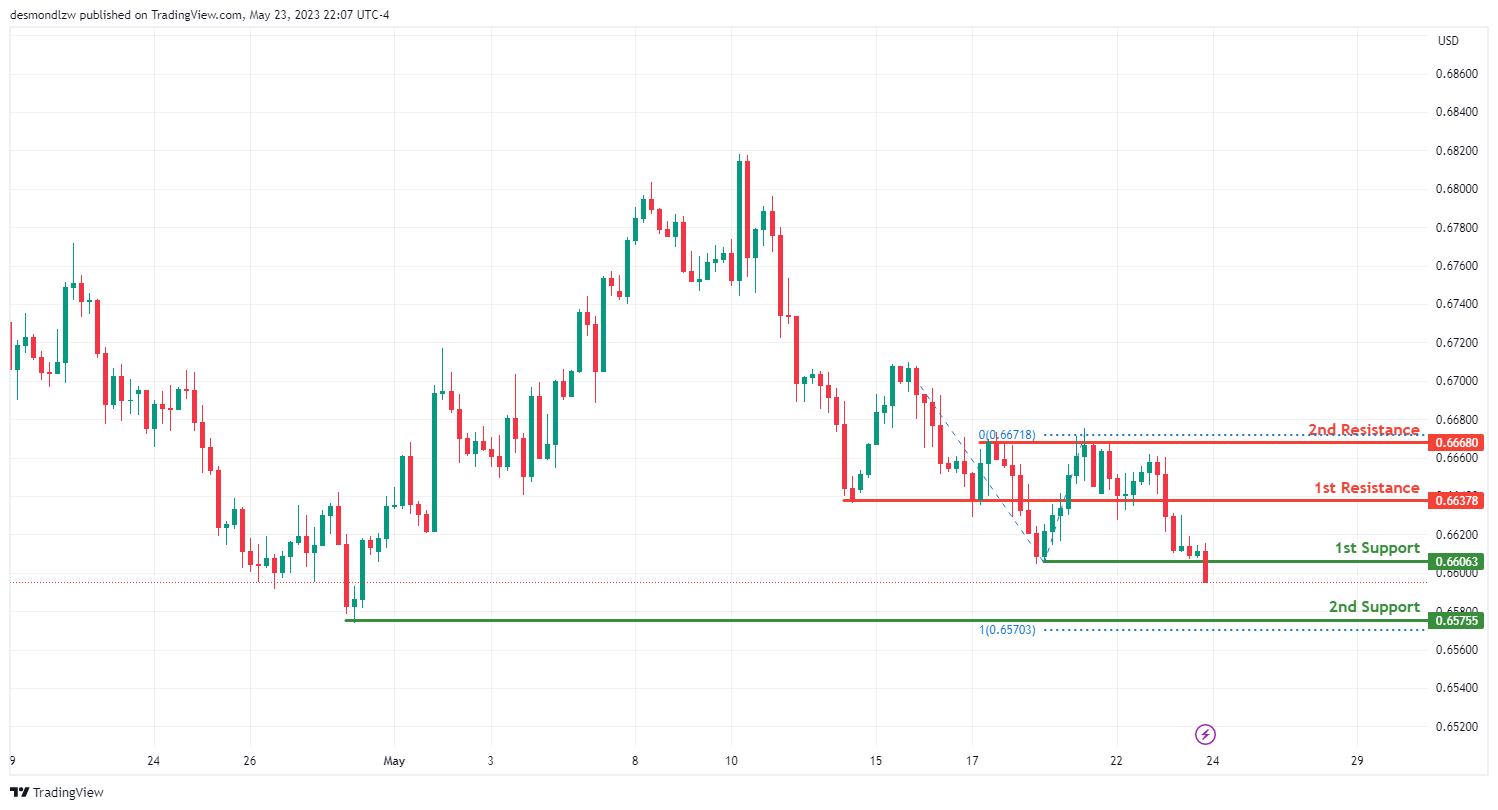
The AUD/USD pair is currently demonstrating a bearish trend, suggesting a potential bearish break off the first support level and a drop towards the second support level.
The first level of support is at 0.6606, representing a multi-swing low support. This suggests that this level has acted as a floor multiple times in the past, making it a strong potential support level.
The second support level is at 0.6575 and is identified as a swing low support. This is a price point where the value has historically bottomed out, making it a potential floor for further price declines.
On the other hand, if the price were to reverse, the first resistance level is at 0.6637, acting as a pullback resistance. This level represents a point where the price has previously stopped and reversed after a retracement.
The second resistance level is located at 0.6668, acting as a multi-swing high resistance and aligning with the 100% Fibonacci projection level. This suggests that it could be a significant barrier to price increases.
NZD/USD
The NZD/USD pair is currently on a bearish trend, suggesting a potential bearish break from the first support level and a drop towards the second support level.
The first support level is at 0.6166, and it’s considered an overlap support. Overlap supports have historically acted as both resistance and support, indicating that this level could potentially halt a price decline.
The second support level is at 0.6124, characterized as a multi-swing low support. This suggests that this level has acted as a floor multiple times in the past, reinforcing its potential as a crucial support level.
On the upside, if the price reverses its trend, the first resistance level is at 0.6265. This level is recognized as an overlap resistance, which could act as a significant barrier to price increases.
The second resistance level is at 0.6302, functioning as a swing high resistance, and it’s also at the 100% Fibonacci projection level. This suggests that it could be a significant point of price reversal.

USD/CAD:
The USD/CAD chart currently exhibits bullish momentum, suggesting the potential for further upward movement.
In the short term, there is a possibility of a bullish continuation towards the first resistance level at 1.3529. This resistance level is identified as an overlap resistance, indicating its significance as a potential price ceiling.
Additionally, there is a second resistance level at 1.3581, recognized as an overlap resistance and coinciding with a 78.60% Fibonacci retracement. This level further reinforces the potential for resistance in case of a price increase.
On the support side, the first support level at 1.3421 is an overlap support, which may provide a price floor and support any potential pullbacks.
Furthermore, there is a second support level at 1.3335, identified as an overlap support, further contributing to the potential for support in case of a price decline.

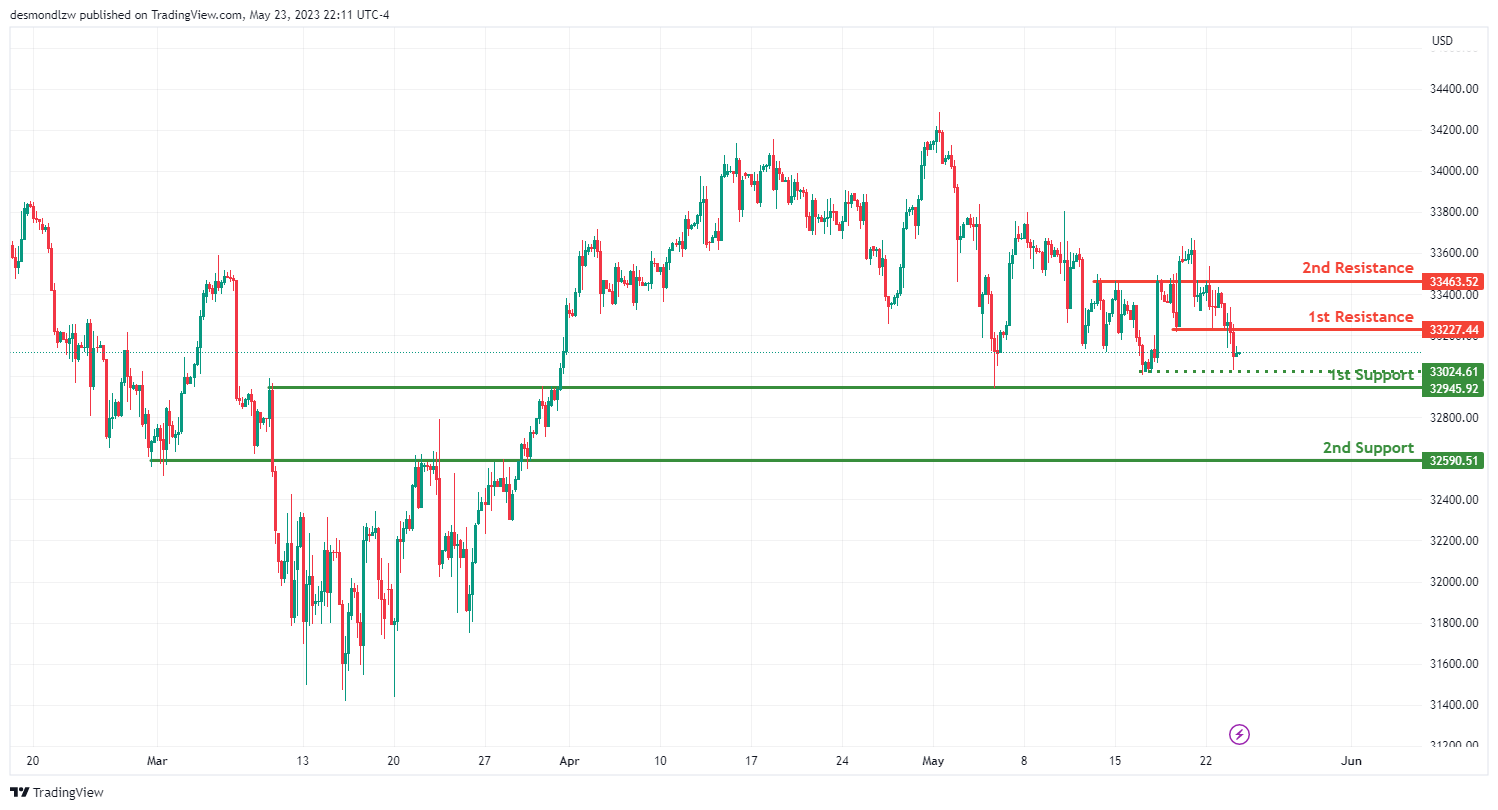
DJ30:
The DJ30 chart currently demonstrates a bearish momentum, indicating the potential for further downward movement.
In the short term, there is a possibility of a bearish continuation towards the first support level at 32945.92.
The first support level at 32945.92 is identified as an overlap support, suggesting it could act as a price floor if the price were to decline.
Additionally, there is a second support level at 32590.51, recognized as an overlap support, providing further support in case of a price decline.
In between, there is an intermediate support level at 33024.61, recognized as an overlap support, which contributes to the potential for providing a price floor.
On the resistance side, the first resistance level at 33227.44 is an overlap resistance, which could pose a barrier if the price attempts to rise.
There is also a second resistance level at 33463.52, identified as an overlap resistance, which adds to its significance in potentially restraining the price’s upward movement.
GER30:
The GER30 chart currently demonstrates a bearish momentum, indicating the potential for further downward movement.
In the short term, there is a possibility of a bearish continuation towards the first support level at 16034.64. This support level is identified as an overlap support and coincides with a 61.80% Fibonacci retracement, adding to its significance as a potential price floor.
Additionally, there is a second support level at 15847.26, recognized as an overlap support, which further reinforces the potential for support in case of a price decline.
On the resistance side, there is an intermediate resistance level at 16199.70, identified as an overlap resistance, which may pose a barrier to any potential upward movement.
Furthermore, the first resistance level at 16293.56 is an overlap resistance, further contributing to its potential significance in restraining the price’s upward movement.

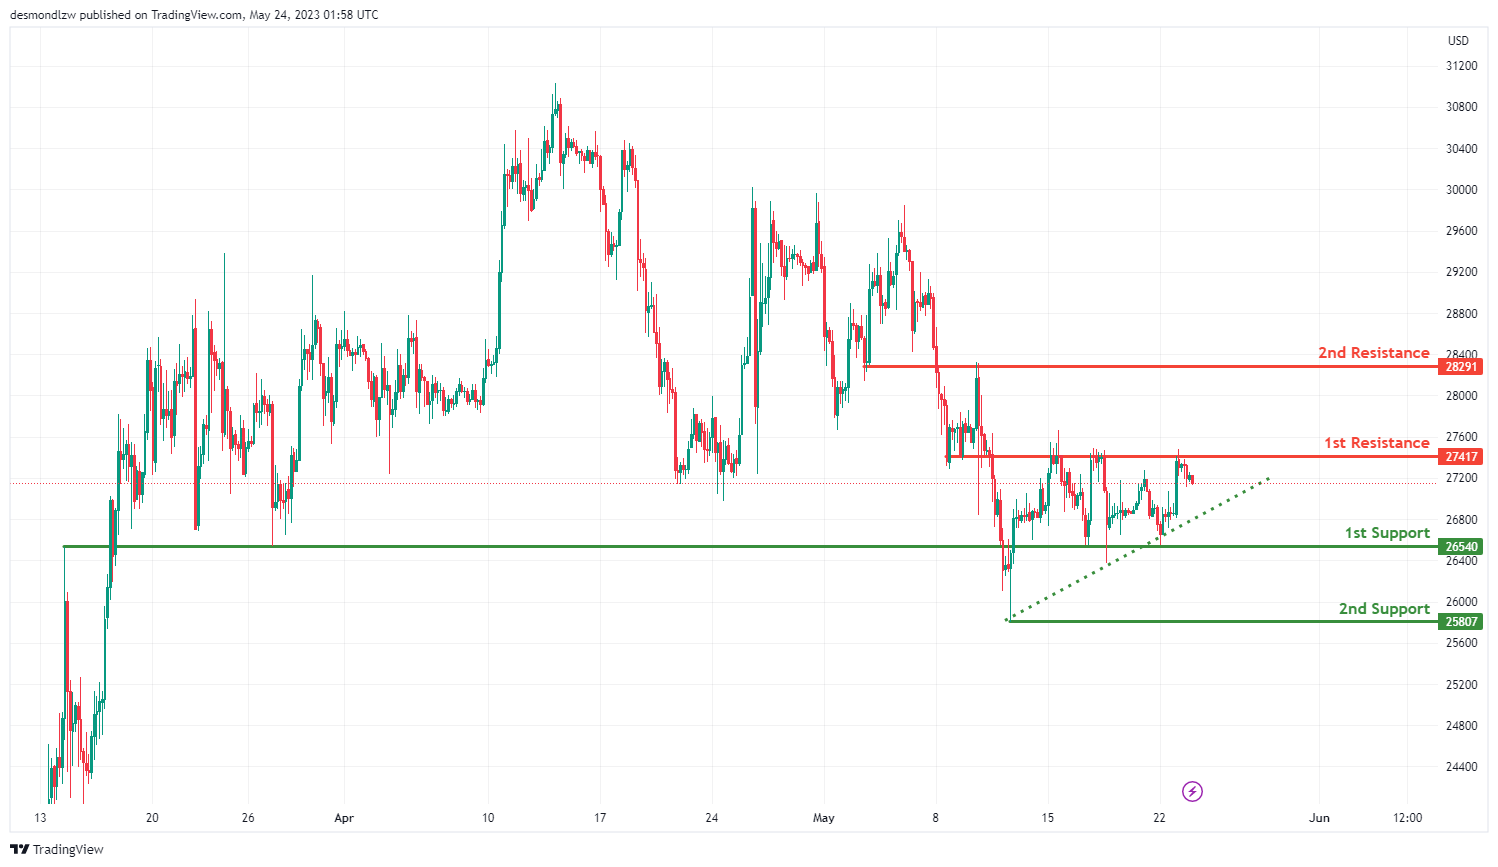
BTC/USD:
The BTC/USD pair is currently on a bullish trend, largely contributed by the price being above a major ascending trend line, suggesting that further bullish momentum is likely.
In the short term, the price might drop further to the first support level at 26450, which is recognized as an overlap support. Overlap supports have historically acted as both resistance and support, and it could potentially halt a price decline.
The second support level stands at 25807 and is identified as a swing low support. Swing low support levels are areas where the price has historically bottomed out, reinforcing its significance as a potential floor for the price.
On the upside, once the price bounces from the first support level, it might rise to the first resistance level at 27417. This level is seen as an overlap resistance and could act as a significant barrier to price increases.
The second resistance level is at 28291, also recognized as an overlap resistance, which could potentially cap price increases, indicating a possible price reversal at this level.
US500
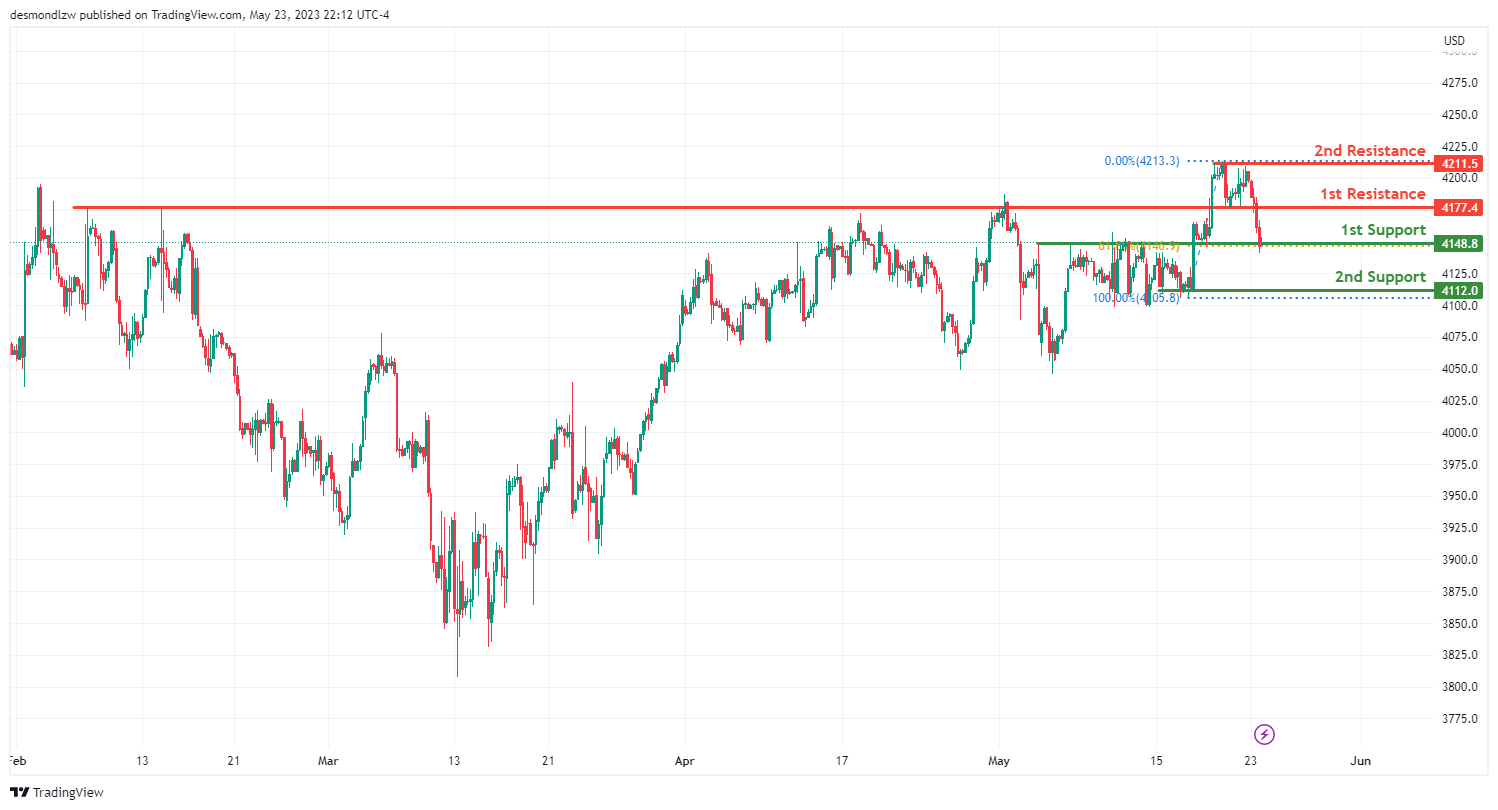
The US500 chart currently exhibits a weak bullish momentum with low confidence, suggesting the potential for limited upward movement.
In the short term, there is a possibility of a bullish bounce off the first support level at 4148.80. This support level is identified as an overlap support and coincides with a 61.80% Fibonacci retracement, indicating its significance as a potential price floor.
Additionally, there is a second support level at 4112.00, recognized as an overlap support, further contributing to the potential for support in case of a price decline.
On the resistance side, the first resistance level at 4177.40 is an overlap resistance, which may pose a barrier to any potential upward movement.
Furthermore, the second resistance level at 4211.50 is identified as an overlap resistance, reinforcing its potential significance in restraining the price’s upward movement.
ETH/USD:
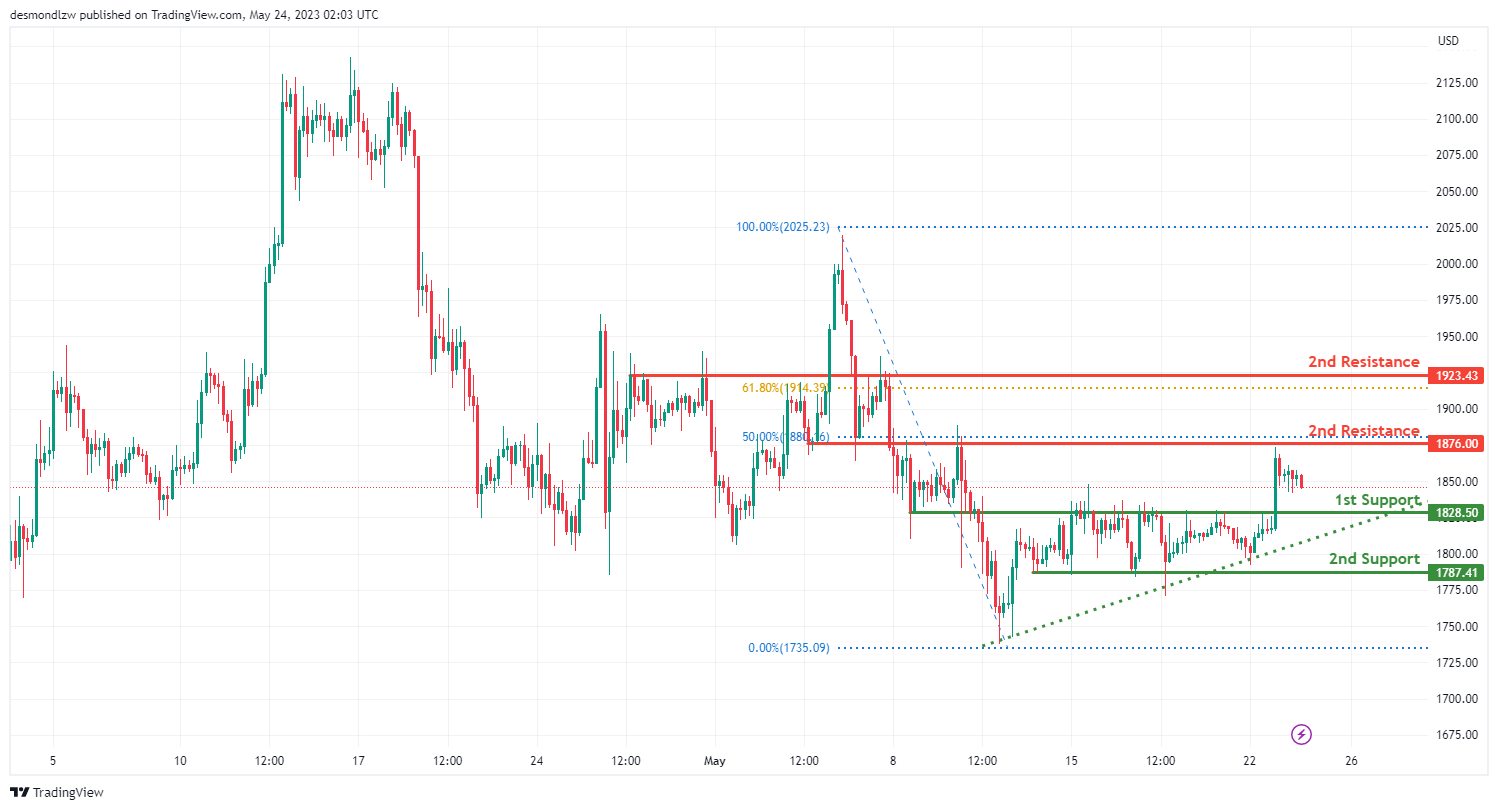
The ETH/USD pair is exhibiting a bullish trend, largely due to the price being above a major ascending trend line. This suggests that further bullish momentum is likely.
In the short term, the price may drop to the first support level at 1828.50, which acts as a pullback support. Pullback support levels are often seen as strong support zones as they have previously halted a downward trend and triggered a price rebound.
The second support level stands at 1787.41, recognized as a multi-swing low support. Multi-swing low support levels have historically acted as a strong floor, where the price has repeatedly bottomed out, increasing their significance as a potential support level.
On the upside, once the price bounces from the first support, it might rise to the first resistance level at 1876.00. This level acts as an overlap resistance and aligns with the 50% Fibonacci retracement level, potentially offering a significant barrier to price increases.
WTI/USD:
The WTI crude oil is currently showing a bullish trend, with the price above a major ascending trend line, suggesting that further bullish momentum could be on the horizon.
In the short term, the price might drop further to the first support level at 70.95, which is considered a swing low support. Swing low support levels have historically acted as a reliable floor, where the price has previously bottomed out.
The second support level is at 69.33, serving as an overlap support. Overlap supports have historically functioned as both resistance and support, suggesting this level could halt a price decline.
If the price bounces off the first support level, it could potentially rise to the first resistance level at 73.85. This level is identified as an overlap resistance, potentially offering a substantial obstacle to price increases.
The second resistance level stands at 76.69, also recognized as an overlap resistance. Overlap resistance levels have often capped price increases in the past, potentially indicating a reversal.

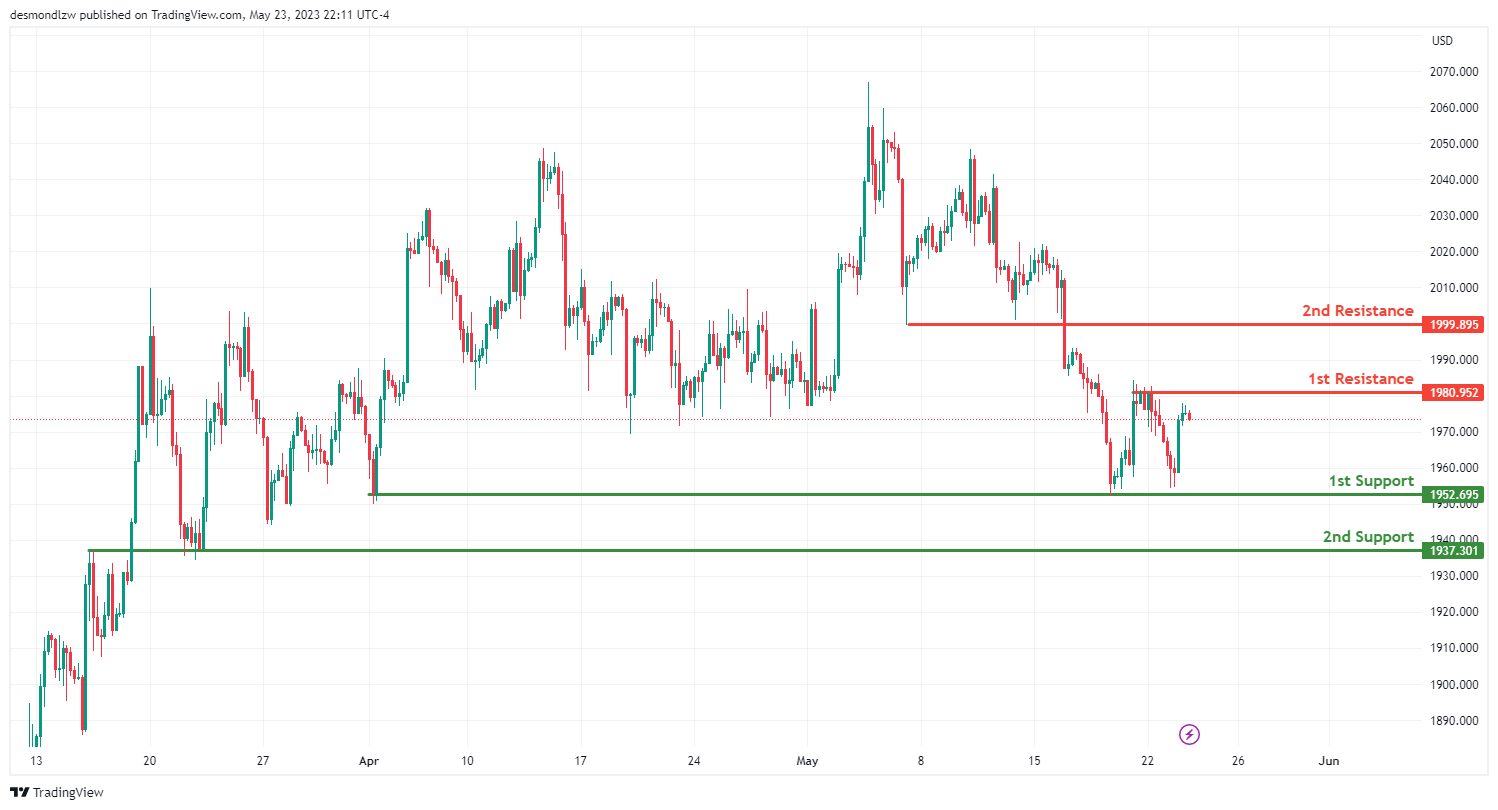
XAU/USD (GOLD):
The XAU/USD pair currently exhibits a bearish trend, suggesting potential continuation towards the first support level.
The first support level is at 1952.69 and serves as a multi-swing low support, a level at which the price has bottomed out multiple times historically, potentially halting further price decline.
The second support level, at 1937.30, is an overlap support. Overlap supports have historically acted as both resistance and support, suggesting that this level could also prevent further price drops.
Conversely, should the price reverse direction, the first resistance level is found at 1980.95. This level acts as a multi-swing high resistance, indicating that it has been a point at which price increases have stopped and reversed historically.
The second resistance level is at 1999.59, serving as a pullback resistance. Pullback resistances are levels where the price has previously experienced a reversal following a brief retracement. This level could potentially cap further price increases.
AUD/USD Could Nosedive Below This Support
Key Highlights
- AUD/USD is showing bearish signs below the 0.6660 resistance.
- It traded below a contracting triangle with support near 0.6610 on the 4-hour chart.
- EUR/USD could extend losses below the 1.0750 level.
- GBP/USD might be volatile as it approaches the UK CPI report.
AUD/USD Technical Analysis
The Aussie dollar started a fresh decline from well above 0.6700 against the US Dollar. AUD/USD traded below the 0.6660 support to move into a bearish zone.
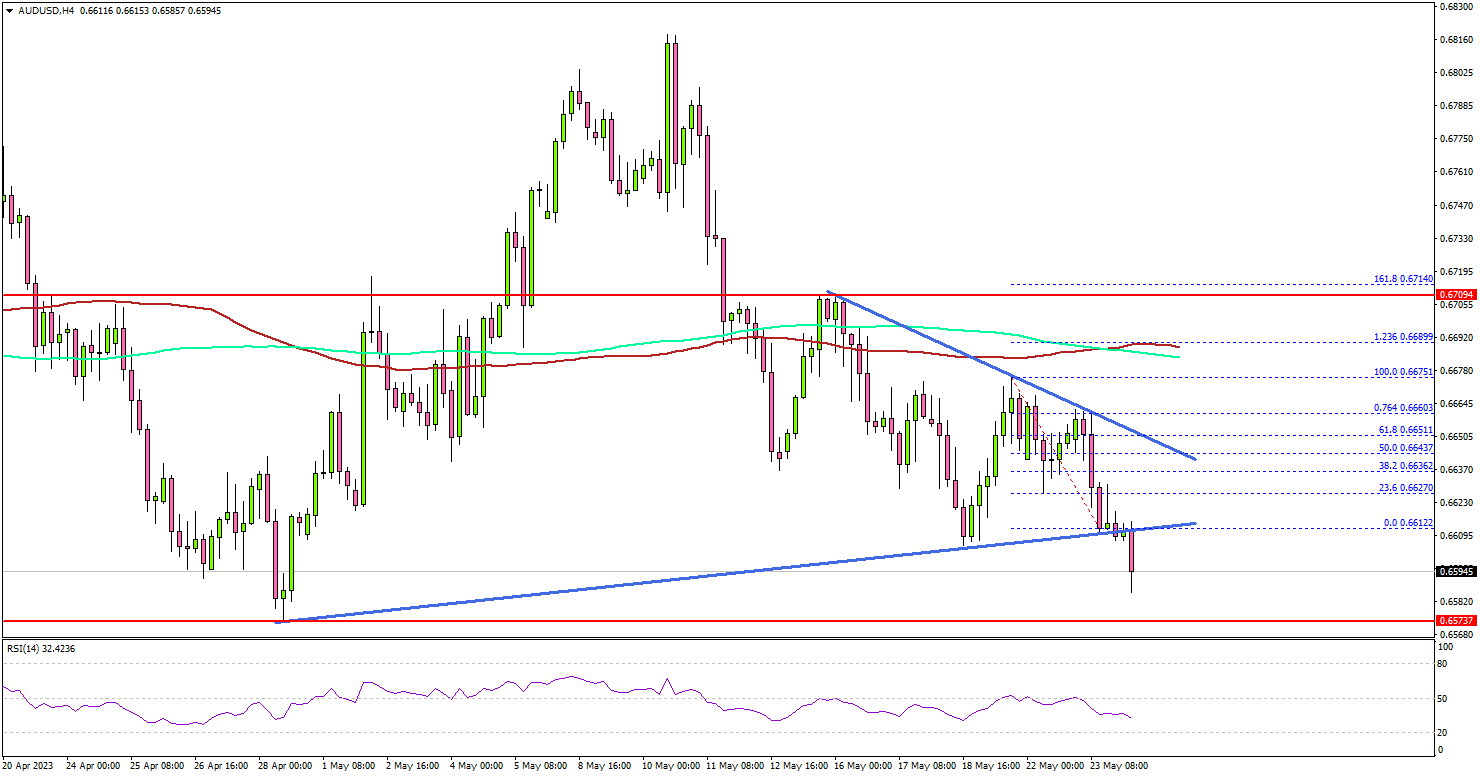
Looking at the 4-hour chart, the pair settled below the 0.6660 level, the 100 simple moving average (red, 4 hours), and the 200 simple moving average (green, 4 hours).
It even traded below the 0.6620 support level. Besides, AUD/USD traded below a contracting triangle with support near 0.6610 on the same chart. A low is formed near 0.6585 and the pair is now consolidating losses.
Immediate resistance is near the 0.6620 level. The next major resistance is near 0.6675 and the 200 simple moving average (green, 4 hours), above which the pair could rise toward the 0.6700 level.
Any more gains might send AUD/USD toward the 0.6750 level. On the downside, the pair might find support near 0.6600. The next major support is near the 0.6580 level.
If there is a downside break below the 0.6580 level, the pair could decline toward the 0.6500 support level. The next major support sits near the 0.6440 level.
Looking at EUR/USD, the pair is still trading in a bearish zone and there is a risk of a move toward the 1.0700 level in the near term.
Economic Releases
- UK Consumer Price Index for April 2023 (YoY) – Forecast +8.2%, versus +10.1% previous.
- UK Core Consumer Price Index for April 2023 (YoY) – Forecast +6.2%, versus +6.2% previous.
- German IFO Business Climate Index for May 2023 – Forecast 93.0, versus 93.6 previous.
EURUSD Close to Ending Elliott Wave Impulse Decline
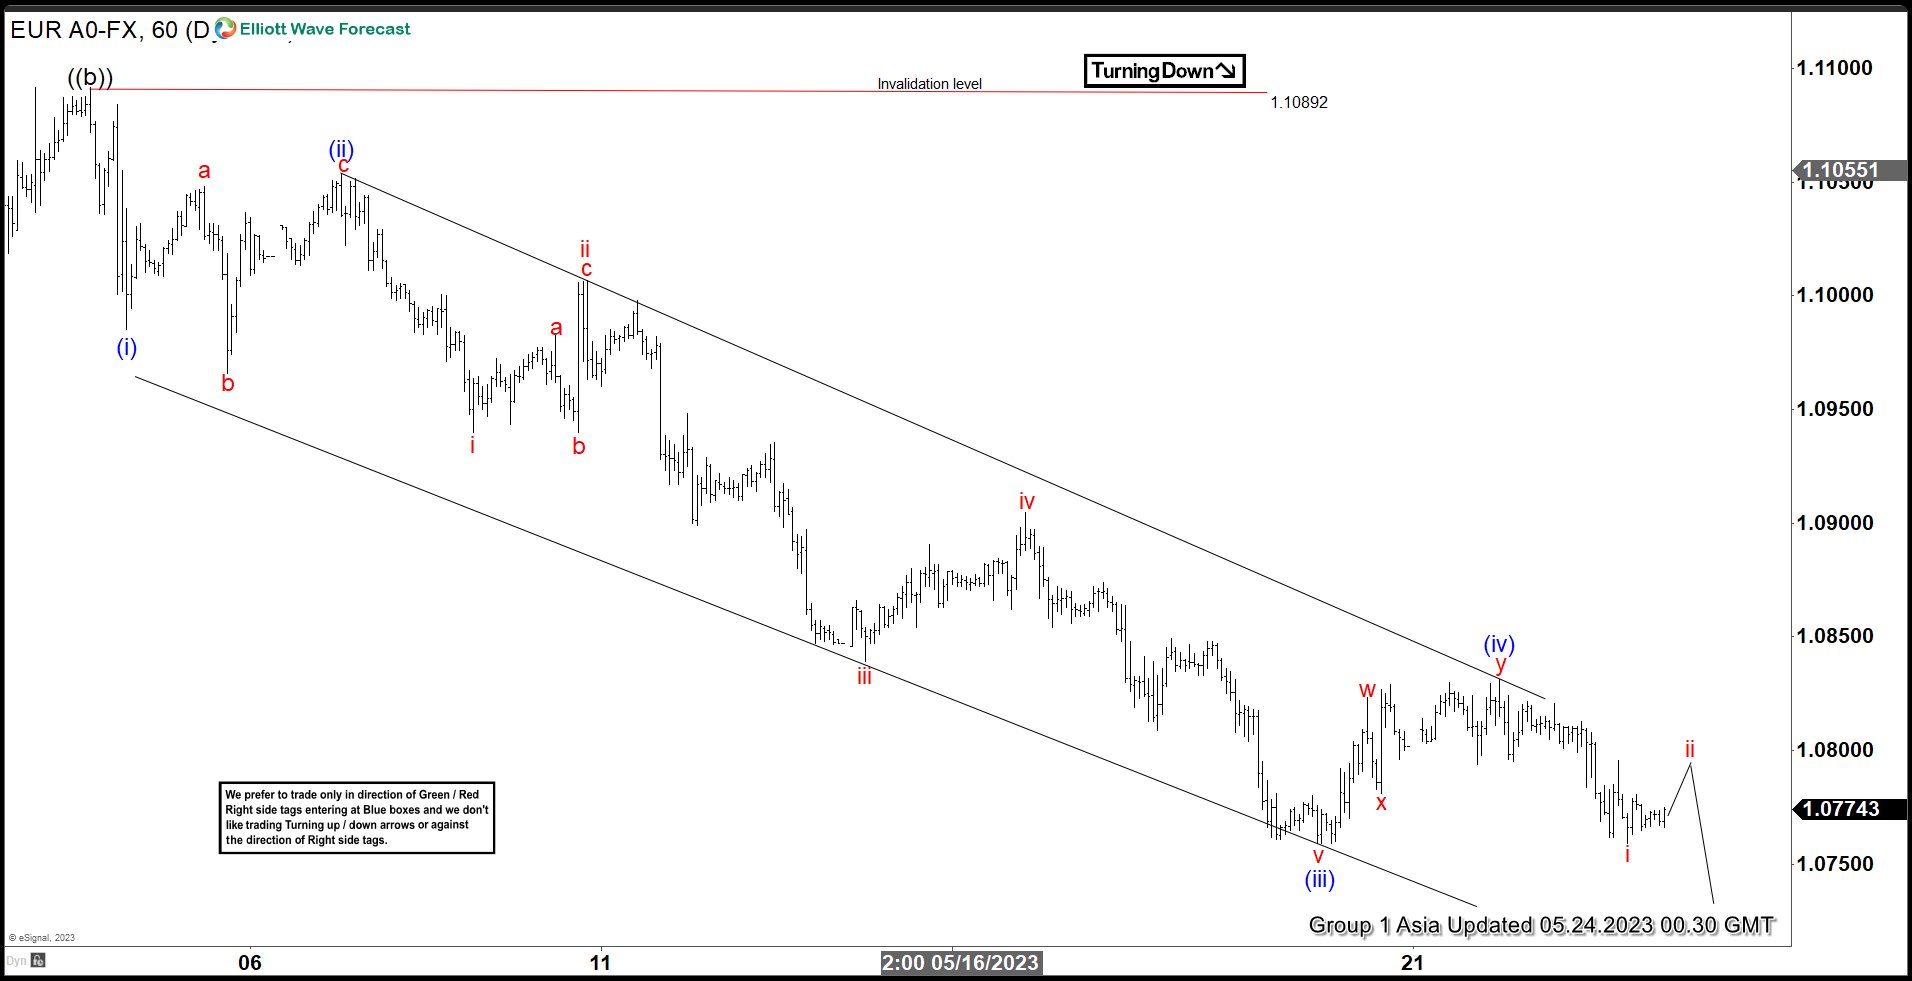
Short term Elliott Wave view in EURUSD suggests pair ended wave ((b)) at 1.1089. Wave ((c)) is currently in progress with internal subdivision as a 5 waves impulse Elliott Wave structure. Down from wave ((b)), wave (i) ended at 1.0985 and rally in wave (ii) ended at 1.1053. Internal subdivision of wave (ii) unfolded as expanded flat where wave a ended at 1.1048, wave b ended at 1.0965, and wave c higher ended at 1.1054.
Down from wave (ii), wave i ended at 1.094 and rally in wave ii ended at 1.10068. Pair resumes lower in wave iii towards 1.0839 and rally in wave iv ended at 1.0904. Final leg lower wave v ended at 1.0759 which completed wave (iii). Rally in wave (iv) ended at 1.0831 with internal subdivision as a double three Elliott Wave. Up from wave (iii), wave w ended at 1.0823, pullback in wave x ended at 1.0781, and wave y ended at 1.0831. Pair resumes lower in wave (v) with internal subdivision as another 5 waves. Down from wave (iv), wave i ended at 1.0759. Expect rally to fail in 3, 7, or 11 swing for further downside while pivot at 1.1089 high stays intact.
EURUSD 60 Minutes Elliott Wave Chart
EURUSD Elliott Wave Video
https://www.youtube.com/watch?v=5ynnhejBgsg
Nikkei 225 Wave Analysis
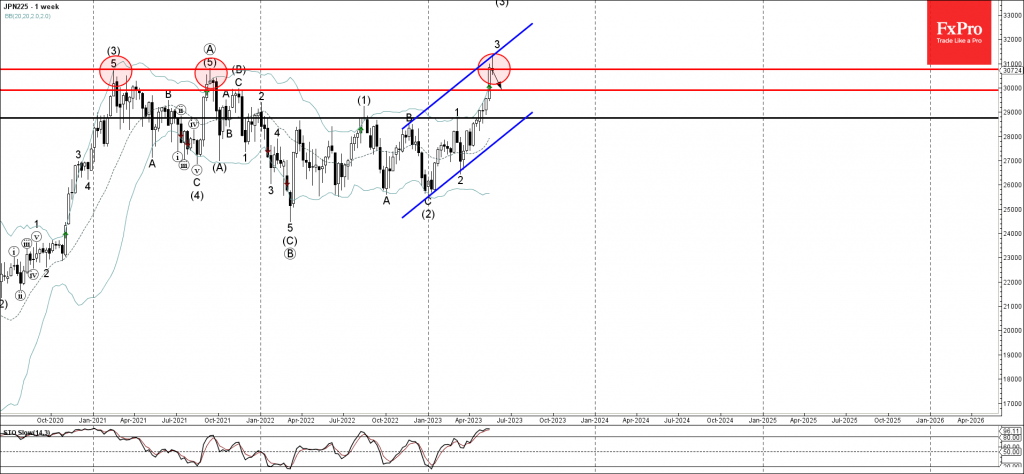
- Nikkei 225 reversed from multiyear resistance level 30750.00
- Likely to test support level 30000.00
Nikkei 225 index recently reversed down from the multiyear resistance level 30750.00 (which reversed the index twice in 2021 as can be seen below).
The resistance level 30750.00 was strengthened by the upper weekly Bollinger Band and by the resistance trendline of the weekly up channel from the end of last year.
Given the overbought weekly Stochastic, Nikkei 225 index can be expected to fall further toward the next round support level 30000.00.
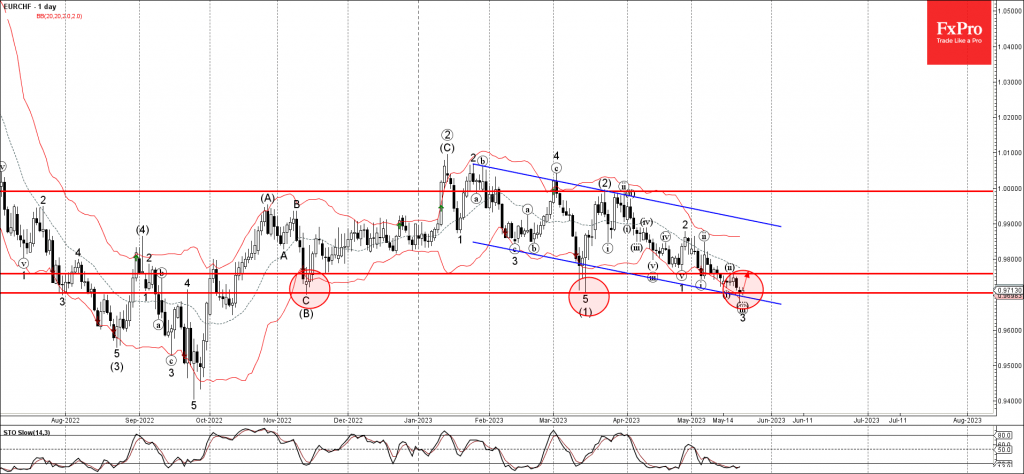
EURCHF Wave Analysis
- EURCHF reversed from support level 0.9705
- Likely to rise to resistance level 0.9760
EURCHF recently reversed up from the major long-term key support level 0.9705 (low of the previous waves (B) and (1) from November and March respectively).
The support level 0.9705 was further strengthened by the lower daily Bollinger Band and by the support trendline of the daily down channel from January.
Given the oversold daily Stochastic, EURCHF can be expected to rise further toward the next resistance level 0.9760 (top of the previous correction (ii)).