

Sample Category Title
Sunset Market Commentary
Markets
At first sight, EMU May PMI’s were close to expectations. The composite measure eased slightly from 54.1 to 53.3 (vs 53.5 expected), but still suggests solid growth. The dichotomy between a further contraction in manufacturing (44.6 from 45.8) and strong services growth continues (55.9 from 56.2). This divergence was also visible in pricing behavior. According to S&P global, average prices for goods and services rose at the slowest pace in 25 months. However, prices rises remain high by historical standards. Especially the services sector continues reporting higher pricing power amid resurgent demand while goods producers see reducing input costs and demand for discounts. Still, service sector input costs continue to rise sharply, often due to higher wage an salary costs. In its comment, HCOB chief economist Cyrus de la Rubia concludes that ‘The European Central Bank will have a headache with the PMI data. This is because selling prices in the services sector actually rose more than in previous month. …. This upward move that can still be observed here is keeping the central bank from taking an interest rate pause’. Companies continue to hire, even in the weakening industrial sector. As said, the EMU PMI’s didn’t provide a spectacular surprise. However, the combination of a healthy labour market and ongoing price pressures in the services sector was enough to further extend recent rise in core European and US bond yields. German yields are trading off the intraday top levels, but still add about 2-3 bps across the curve. US Treasuries underperform with additional yield gains between 5.5 bps (2-y) and 2 bps (30-y). Higher yields and a more inverse yield (US) curve this time triggered a correction on global equity markets (Eurostoxx 50 -0.9%, S&P -0.4%). However, recent highs remain within reach. At the time of finishing this report, the US Composite PMI is released at a stronger than expected 54.50, with services showing solid growth (55.1) while manufacturing drifts below the 50 boom-or-bust level (48.5). Yields in a first reaction gain marginally. The dollar trades little changed.
On FX markets, higher yields and a risk-off favors the dollar, even as the negotiations on raising the debt ceiling didn’t yield any result yet. EUR/USD slipped from the 1.0810 area to trade near 1.078. DXY rebounded nearing the recent top levels in the103.63 area. Despite higher core yields, yen losses remain negligible. Still, USD/JPY (currently 138.5) tries to break above the 138.75 resistance, touching the highest levels in about six months. Sterling showed somewhat of a bumpy intraday pattern. The UK currency was hit around the time of the publication of a weaker than expected UK PMI (composite 53.9 from 54.9). EUR/GBP briefly jumped to the 0.8715 area, but sterling soon recovered the post-PMI loss as UK yields still rose faster than their EMU counterpart. Governor Bailey in a hearing before Parliament mainly repeated the message for the May policy meeting (further tightening is need if inflation persists). EUR/GBP currently again trades in the 0.8695 area, counting down to tomorrow’s key April inflation data.
News & Views
The Saudi energy minister, prince Abdulaziz bin Salman, lashed out at oil short-sellers again. At the Qatar Economic Forum (Doha), bin Salman told speculators they will get burned whilst referring to OPEC’s decision back in April. The oil cartel then delivered a surprise output cut of more than 1m barrels a day. Brent oil prices soared from sub $80/b to around $87 shortly thereafter. But ongoing recessionary worries and tepid Chinese growth following the end of zero-Covid (more than) erased those gains. At the same time there are serious doubts whether some OPEC+ members including Russia are at all abiding by the production cuts. The price of a barrel of Brent ekes out a tiny gain after bin Salman’s comments, selling at around $77/b currently. OPEC+ will meet on June 3-4.
The Hungarian central bank proceed its cutting cycle today by lowering the overnight collateralised lending rate serving as the top of the interest rate corridor by 100 basis points to 19.5 percent. The key decision however was that it also cut the overnight deposit tender (and de facto policy) rate from 18% to 17%. The base rate was left unchanged at 13%, a level which it considers high enough to fight inflation and expects to stay there for a prolonged period. The Hungarian central bank said it is to continue the convergence of both rates, provided the improvement in risk perceptions vis-à-vis Hungarian assets, the forint in particular, persists. The MNB favours a cautious and gradual approach in doing so (a monthly 100 bps reduction through September?!). The forint reacted stoic to today’s decision as markets were already pricing the cut for quite some time. The forint is holding strong near EUR/HUF 374.
Forget Default, is a Debt Ceiling Deal the True Risk for Stocks?
With US lawmakers unable to reach a deal on the debt ceiling, investors are laser-focused on the risk of a catastrophic default. However, the real problem for markets might be what happens after an agreement is found. That's when the Treasury will scramble to raise its cash levels, which can drain liquidity out of the financial system and in the process, inflict damage on riskier assets such as stocks.
Political theater
It's almost certain that US lawmakers will ultimately reach a debt ceiling deal, even if it takes some time. Nobody really wants the US government to default as that would severely damage the nation's credibility, raise borrowing costs and make matters worse for both parties. This showdown is a political game of chicken, and investors are fully aware.
Republicans want the government to slash spending, whereas the Democrats are only prepared to freeze public spending at current levels. Some compromise will eventually be found, hopefully before the X-date that Treasury Secretary Yellen has warned is around early June.
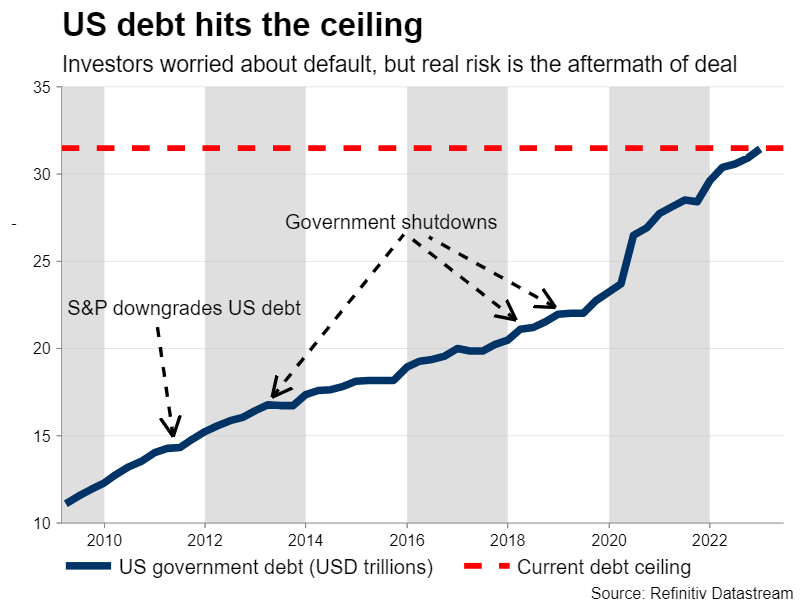
In reality, there are some extraordinary measures the Treasury can take to avert default for a few more weeks, so the real X-date might be closer to late June. Even so, the real question is what will happen in the aftermath of the resolution.
Liquidity drain
Once a deal is found, the Treasury would need to sharply boost its borrowing, in order to replenish its cash levels and be able to honor the spending obligations of the US government. This means a flood of newly-issued bonds will hit the markets in the following weeks, which investors need to absorb.
Let's dig into the numbers. The government's cash account at the Fed, called the Treasury General Account, currently stands at $60 billion. According to the Treasury's own estimates, this cash balance is expected to soar to $550 billion at the end of this quarter and then rise to $600bn by the end of the third quarter.
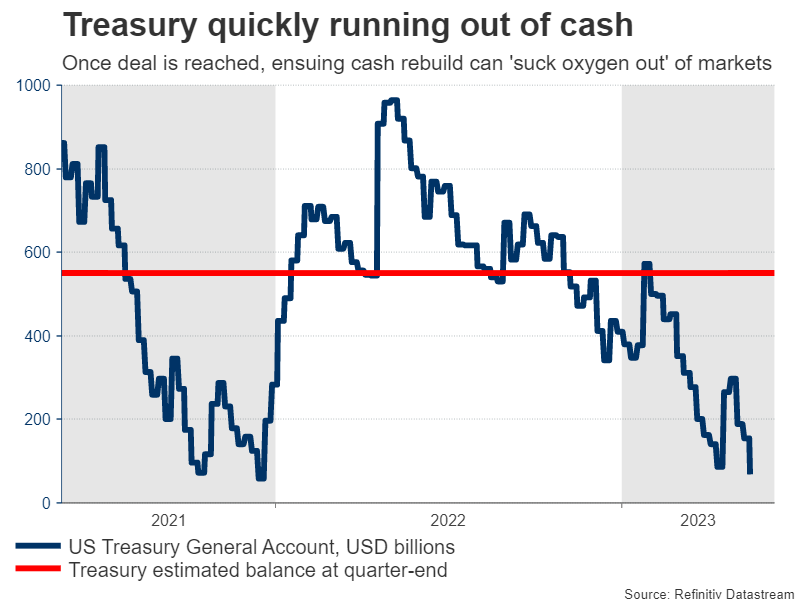
This implies that around half a trillion dollars might be drained from the private sector, reducing bank reserves and in the process siphoning liquidity out of financial markets. Liquidity is the life blood of the financial system, so a sharp reduction would spell bad news for riskier assets such as stocks and cryptocurrencies.
And that's without even considering the Fed's quantitative tightening (QT) program, which is reducing its balance sheet at a steady pace. Hence, it looks like the Fed and the Treasury will be simultaneously pulling liquidity out of US markets this summer, effectively 'sucking the oxygen' out of the room.
QT kicks into overdrive
Markets have essentially taken a break from quantitative tightening since last October. Since then, the Fed has shrunk its balance sheet by only $300bn, but the Bank of Japan and the People's Bank of China have jointly injected around $1.2 trillion into their own financial systems.
Liquidity is a global phenomenon, so the tremendous expansions in China and Japan have more than eclipsed the Fed's cautious efforts to remove liquidity. It is probably not a coincidence that stock markets bottomed in early October, exactly when these foreign liquidity injections started.
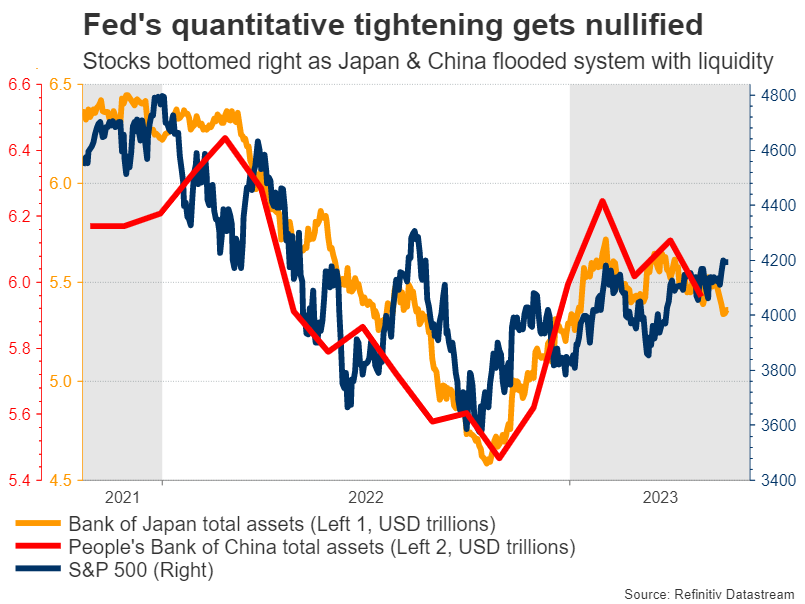
But this liquidity effect seems to be going into reverse now. The balance sheets of the Japanese and Chinese central banks have been falling in recent weeks, the Fed is still reducing its own, and the Treasury is about to turbocharge this process.
Market effects
Blending everything together, investors are staring down the barrel of a dramatic liquidity extraction in the coming months, just as the real economy starts to feel the lagged impact of all the previous rate increases.
This is important because it could mark the end of the stunning rally in risk assets. Long duration plays such as tech stocks or shares of speculative profitless companies would likely get hit the hardest, alongside cryptocurrencies. The riskier the investment, the more vulnerable it is in an environment of evaporating liquidity.
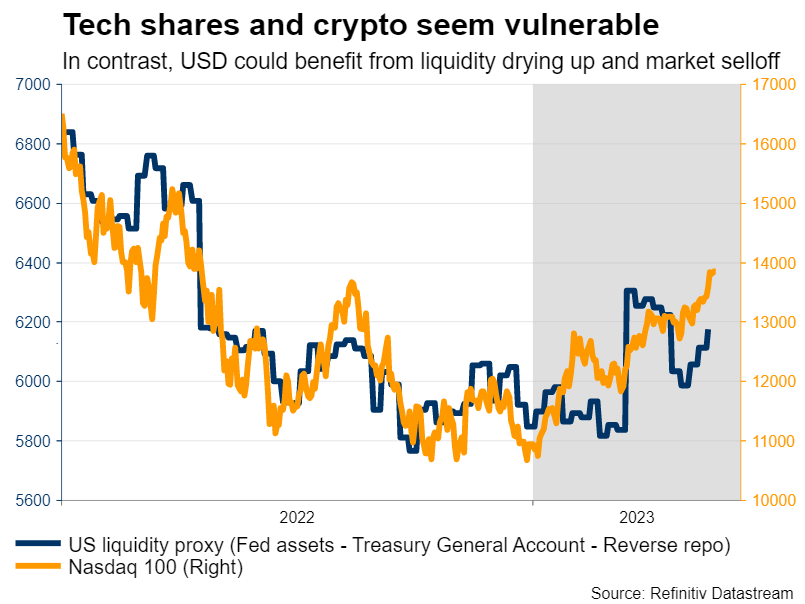
With the tech-heavy Nasdaq 100 index rising by nearly 27% so far this year and Bitcoin rallying 64% over the same timeframe, these instruments already seem overextended and susceptible to a deep correction. In contrast, the main beneficiary in the FX arena might be the US dollar, which tends to perform well when liquidity dries up and markets sell off.
In conclusion, investors seem to be focusing on the wrong risk. Even if the US government shuts down next month, the politicians will eventually strike a deal. What's most important is what happens afterwards once the Treasury unleashes a tsunami of bond issuance, amplifying the effects of quantitative tightening.
It could be a tough summer for riskier investments, which have been flying high this year.
Short-term Negatives from PMIs Do Not Cause ECB to Change Course
Preliminary readings of the PMIs for business activity in the euro area generally revealed a worse-than-expected deterioration. According to the composite index, the last time the euro area industry suffered this badly was in 2008-2009, when the economy was in a sharp downturn.
The persistent decline in manufacturing activity since the beginning of the year has already impacted the services sector, where a reversal from growth to contraction may have occurred after the annual highs in April.

The principal destabilising factor was the collapse in German manufacturing activity, where the corresponding index fell from 44.5 to 42.9, against expectations for a rise to 44.9. The surprise in this collapse was the sharp fall in gas prices in recent months, which should have boosted activity.
The services sector has been solid, especially in Germany. The gaps between the indices have not existed since 2009, and at least they were moving in the same direction, with manufacturing falling faster. However, services are gaining ground as they can pass higher costs to buyers.
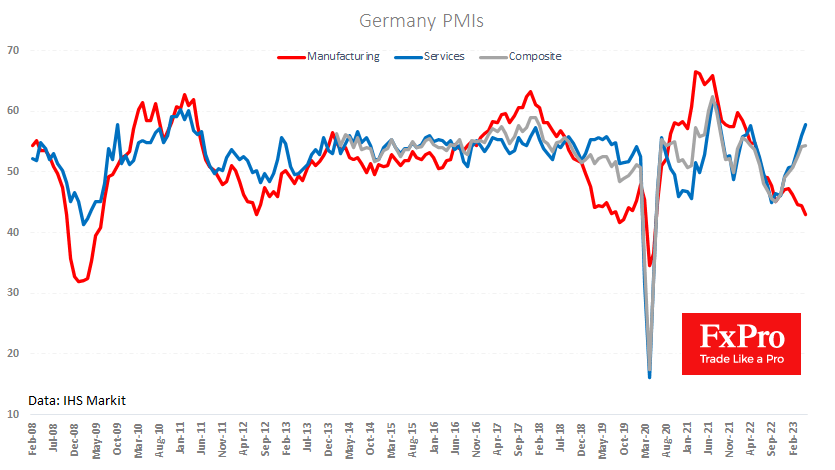
This is a very uncomfortable picture for the central bank. A contraction in output is a strong argument for a softer monetary policy. This is also reflected in employment trends, which are already showing a reversal. However, price developments in the services sector point to secondary inflationary effects – the central bank’s worst enemy.
The ECB faces a difficult choice between inflation and recession. The signals we have received at the last two rate-setting meetings indicate a willingness to sacrifice growth temporarily in favour of a quicker victory over inflation. And this choice is in line with the historical behaviour of continental Europe.
Overall, the weak PMI data for May could put some pressure on the Euro in the short term. However, investors and traders should remember that there has been no sign of a pause in interest rate hikes from the ECB, and the new data strengthens the case for a continued fight against inflation.
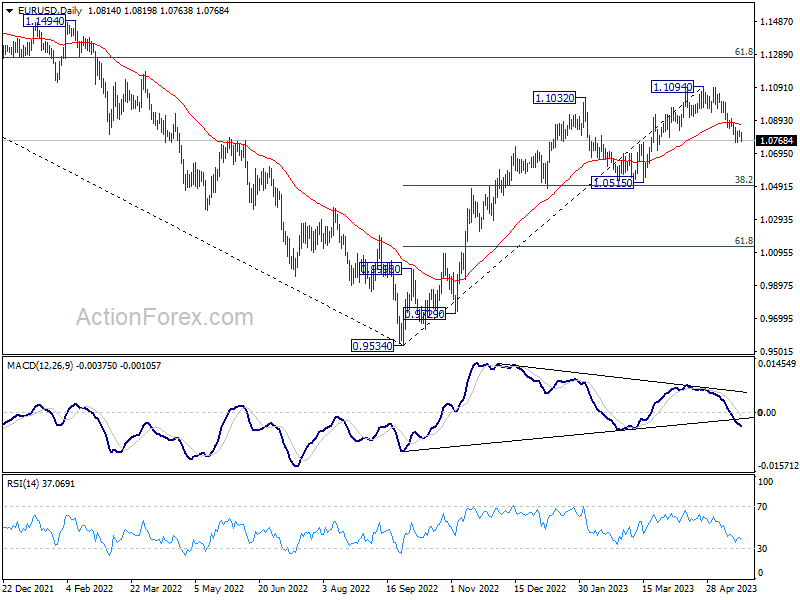
Technically, the EURUSD is in bearish territory, below the 50-day MA and testing a two-month low at 1.0780. There is also a key support area for the pair in 2020 and from 2015 to 2017. The pullback in the EURUSD over the past four weeks looks like a correction from the accumulated overbought area from the 16% rise in the pair from last October’s lows.

BTCUSD Analysis: Bullish Harami Pattern Above $26,394
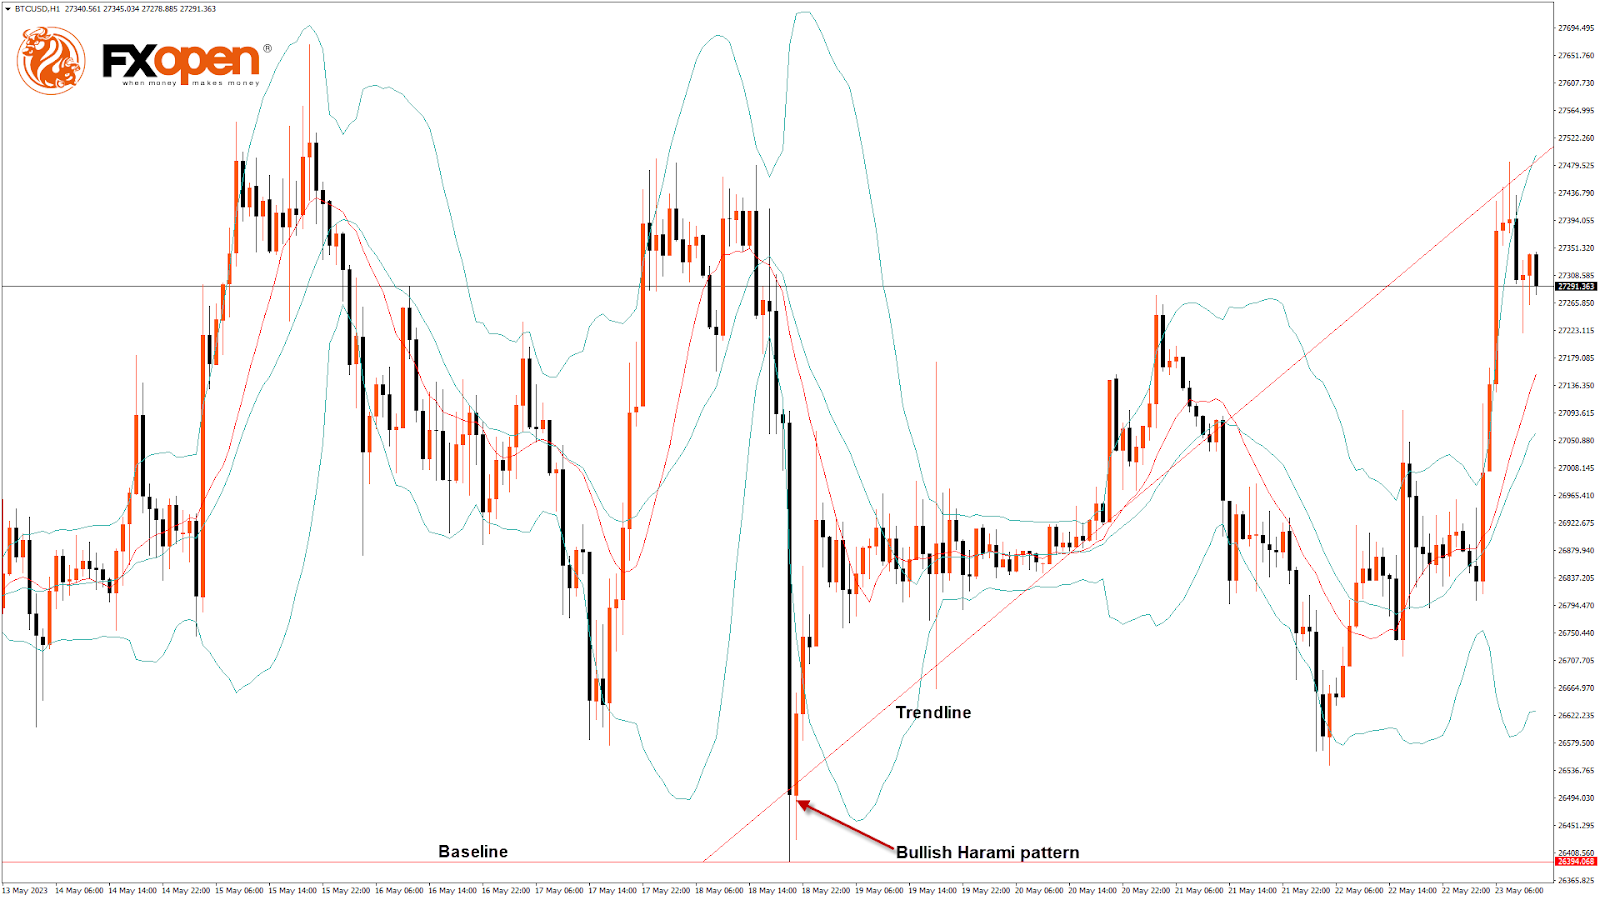
Bitcoin’s price continues its bullish momentum from last week, and after touching a low of USD 26,394 on May 18, we can see a move towards a consolidation phase, after which we are expecting upsides in the range of USD 28500 and USD 29000.
On the hourly chart:
- We can clearly see a bullish Harami pattern above the USD 26,394 handle.
- Both the STOCH and Williams’s percent range indicate overbought levels, which means that in the immediate short term, a decline in the price is expected.
- The resistance of the channel is broken.
- The relative strength index is at 63.84, indicating a strong demand for Bitcoin and the continuation of the buying phase in the markets.
- Most of the major technical indicators are giving a bullish signal, which means that in the immediate short term, we are expecting targets of USD 28,000 and USD 28,500.
- Bitcoin’s price is now moving above its 100-hour simple moving average and its 100-hour exponential moving average.
- The average true range indicates low market volatility with mild bullish momentum.
Bitcoin: Bullish Continuation Seen Above $26,394
The Bitcoin-to-USD exchange rate entered into a consolidation zone above the USD 26,000 handle after which we can see the start of the bullish moves.
On the daily chart:
- Bitcoin’s price bullish continuation is seen above USD 26,394.
- The RSI remains above 50, indicating a bullish market.
- The Bitcoin price is now trading below its pivot level of USD 27,337.
- The short-term range is mildly bullish.
- MACD crosses up its moving average.
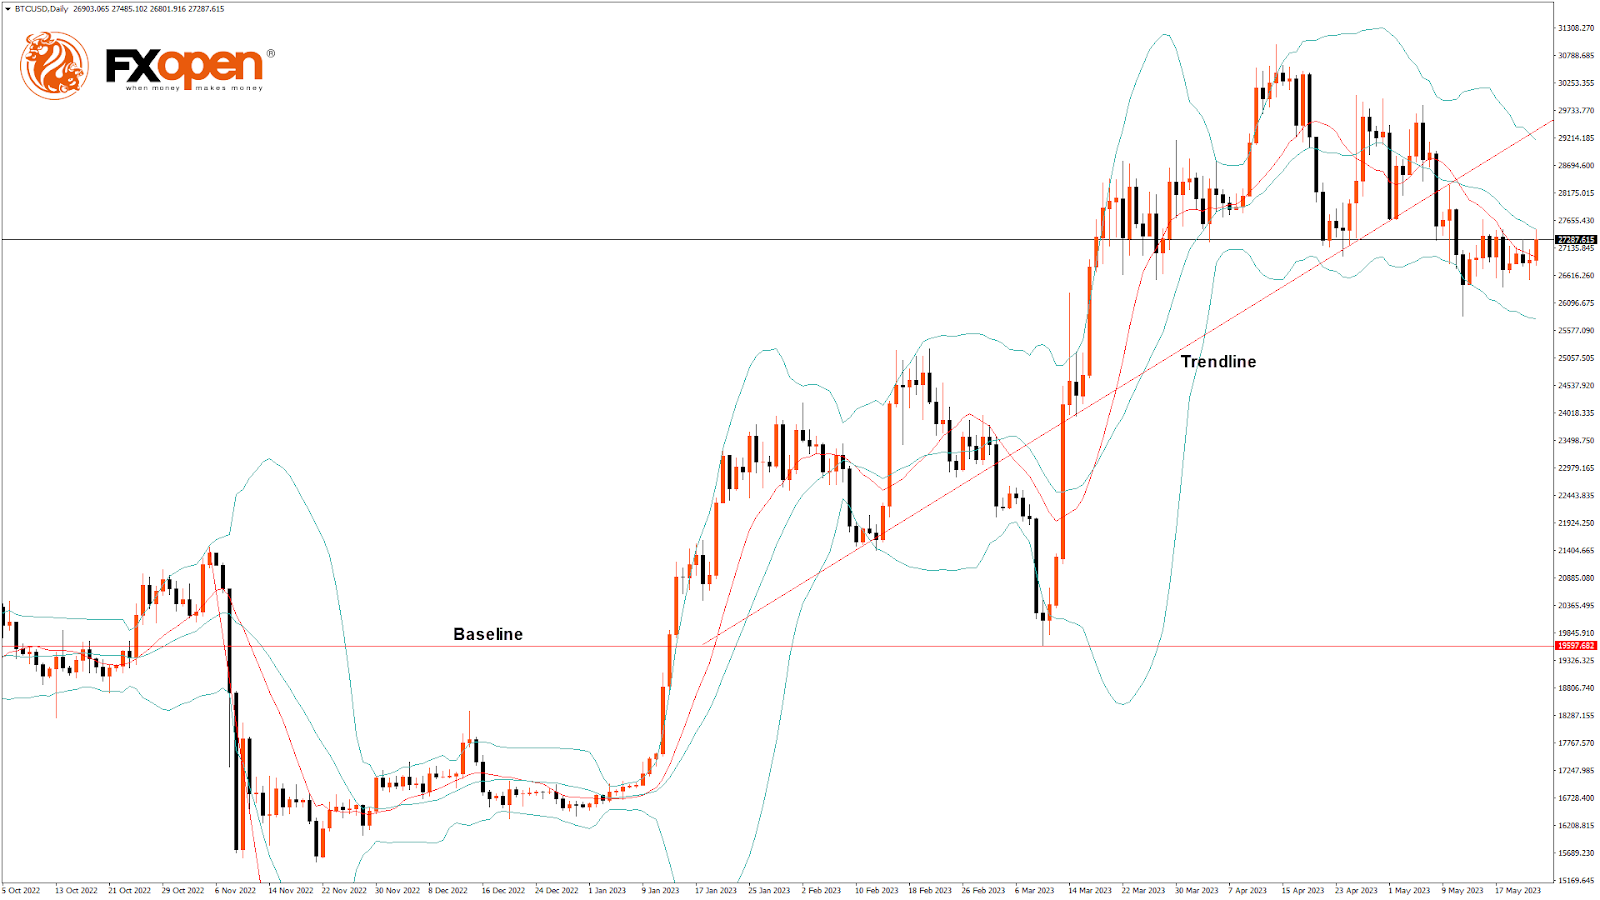
A support zone is located at USD 25,881, which is a 1-month low, and at USD 26,624, which is a 38.2% retracement from 13-week high.
BTCUSD is now facing its classic resistance level of USD 27,383 and Fibonacci resistance level of USD 27406, breaking which the price will be able to move to USD 28,000.
The short-term outlook for Bitcoin is mildly bullish, the medium-term outlook has turned bullish, and the long-term outlook remains neutral under present market conditions.
The Week Ahead
We can see that the Bitcoin chart on D1 timeframe remains well supported above the USD 26,000 handle, and the medium term continuation pattern is seen, with the current support at USD 25,817, which is a pivot point 3rd support point.
The immediate expected target is USD 28,000, after which we may see some consolidation in the zone of the USD 28,500 level.
The monthly RSI is at 49.54, which indicates a neutral market and the shift towards the consolidation zone in the medium-term range.
We can see the formation of a bullish trend line from USD 26,394 to USD 27,489.
The BTCUSD is now facing resistance at USD 27,448, which is a 38.2% retracement from 4 week low, and at USD 27,879 at which the price crosses 9-day moving average stalls.
The weekly outlook for Bitcoin’s price is projected at USD 29,000 with a consolidation zone of USD 28,500.
USD/JPY Mid-Day Outlook
Daily Pivots: (S1) 137.83; (P) 138.26; (R1) 139.02; More...
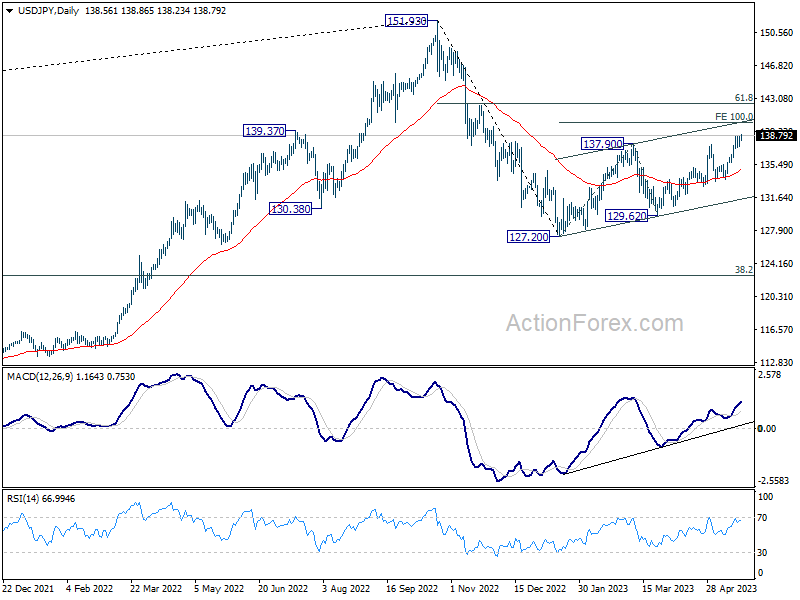
Intraday bias in USD/JPY stays on the upside despite some loss of upside momentum. Current rally from 127.20 should target 100% projection of 127.20 to 137.90 from 129.62 at 140.32. Break there will target 142.48 fibonacci level. On the downside, break of 137.41 minor support will turn intraday bias neutral again first, and bring more consolidation before staging another rise.
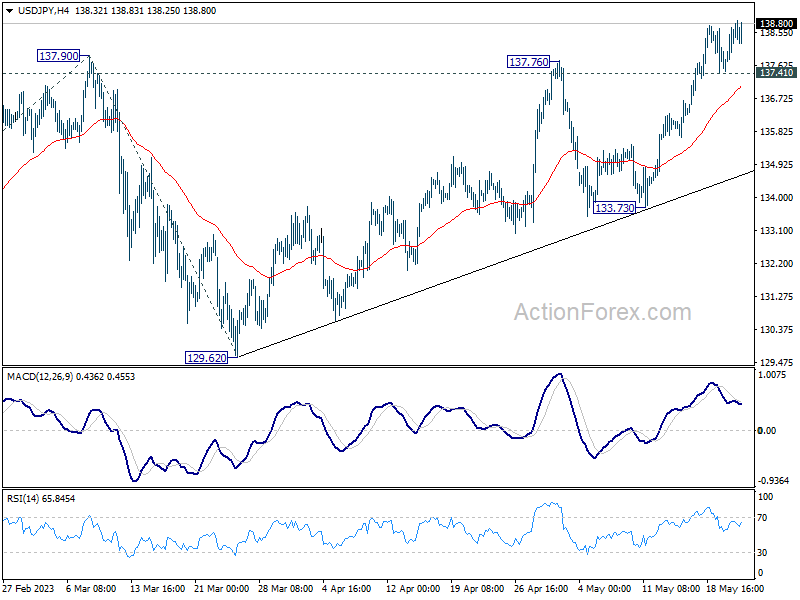
In the bigger picture, rise from 127.20 is seen as the second leg of the corrective pattern from 151.93 high. Stronger rally would be seen to 61.8% retracement of 151.93 to 127.20 at 136.34. Sustained break there will pave the way back to retest 151.93. On the downside, however, break of 133.73 support will argue that the pattern could have started the third leg through 127.20 low.
USD/CHF Mid-Day Outlook
Daily Pivots: (S1) 0.8947; (P) 0.8972; (R1) 0.9004; More...
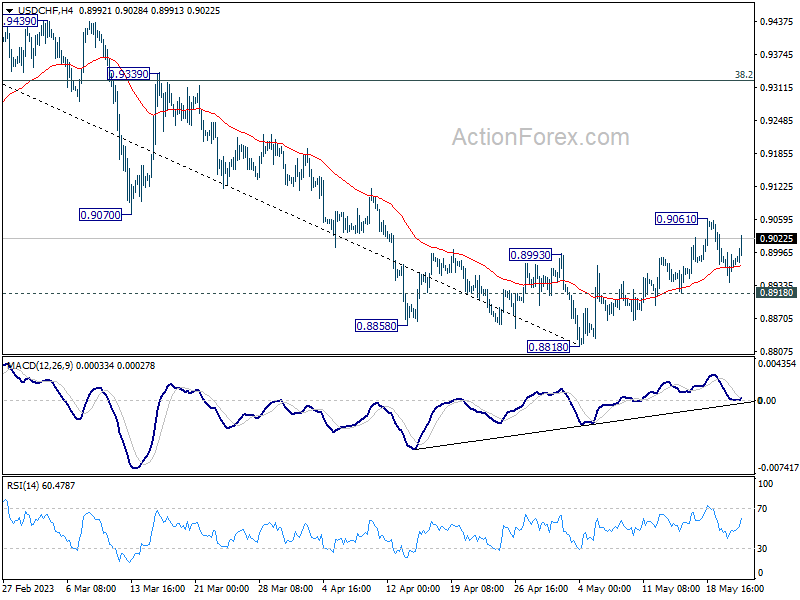
Intraday bias in USD/CHF stays neutral for the moment. Rebound from 0.8818 short term bottom is expected to continue as long as 0.8918 minor support holds. On the upside, sustained trading above 55 D EMA (now at 0.9039) should confirm that current rally is at least correcting whole down trend from 1.0146. Further rise should then be seen to 38.2% retracement of 1.0146 to 0.8818 at 0.9325. On the downside, though, break of 0.8918 will bring retest of 0.8818 low instead.
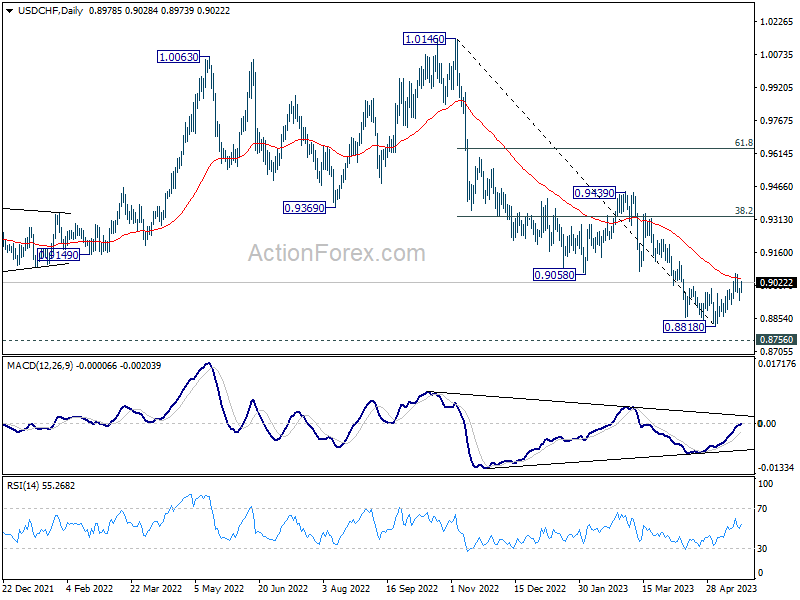
In the bigger picture, fall from 1.1046 (2022 high) is seen as a leg in the long term range pattern from 1.0342 (2016 high). So, downside should be contained by 0.8756 to bring reversal. Sustained break of 0.9058 support turned resistance will be the first sign of medium term bottoming. However, decisive break of 0.8756 will carry larger bearish implications.
EUR/USD Mid-Day Outlook
Daily Pivots: (S1) 1.0768; (P) 1.0798; (R1) 1.0837; More...
Intraday bias in EUR/USD stays neutral and outlook is unchanged. Deeper decline is expected as long as 1.0903 resistance holds. Fall from 1.1094 is seen as correcting whole up trend from 0.9534. Below 1.0759 will target 1.0515 cluster support, 38.2% retracement of 0.9534 to 1.1094 at 1.0498. On the upside, though, firm break of 1.0903 will bring stronger rebound back to retest 1.1094 high instead.
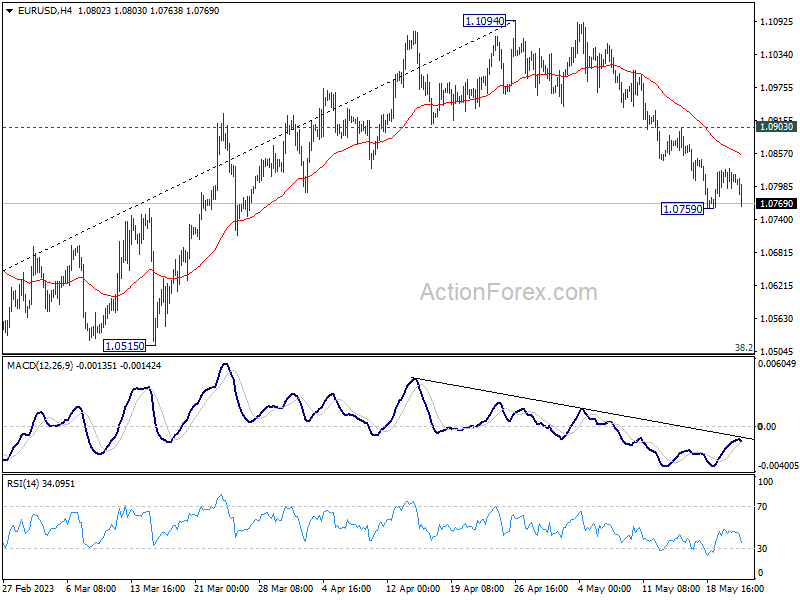
In the bigger picture, as long as 1.0515 support holds, rise from 0.9534 (2022 low) would still extend higher. Sustained break of 61.8% retracement of 1.2348 (2021 high) to 0.9534 at 1.1273 will solidify the case of bullish trend reversal and target 1.2348 resistance next (2021 high).
GBP/USD Mid-Day Outlook
Daily Pivots: (S1) 1.2410; (P) 1.2441; (R1) 1.2469; More...
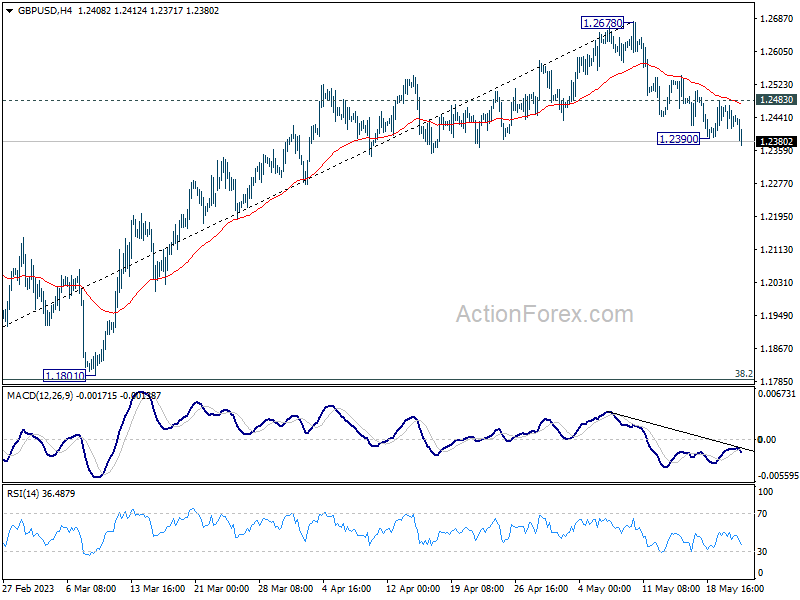
GBP/USD's decline from 1.2678 resumed by taking out 1.2390 temporary low and intraday bias is back on the downside. Current fall is seen as a correction to whole up trend form 1.0351. Deeper fall should then be seen to 1.1801 cluster support (38.2% retracement of 1.0351 to 1.2678 at 1.1789). On the upside, however, break of 1.2483 resistance will bring stronger rebound back to retest 1.2678 high instead.
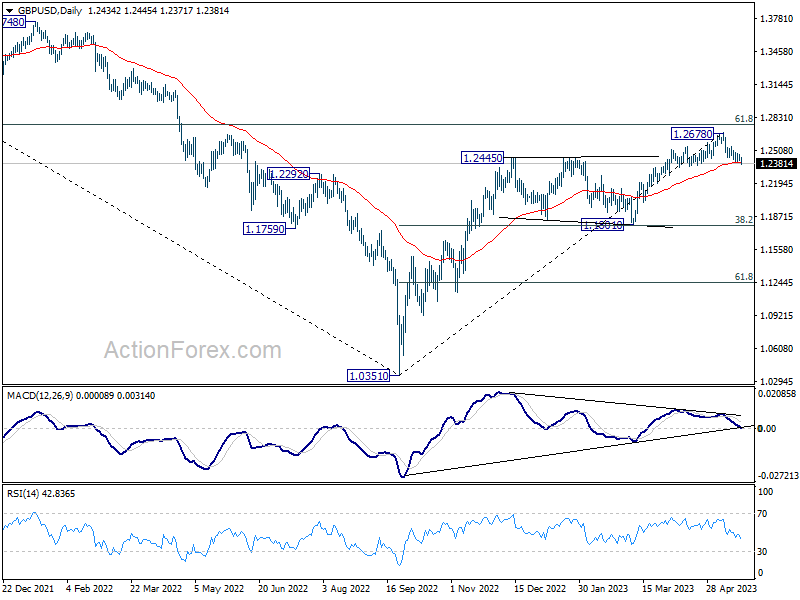
In the bigger picture, as long as 1.1801 support holds, rise from 1.0351 medium term bottom (2022 low) is expected to extend further. Sustained break of 61.8% retracement of 1.4248 (2021 high) to 1.0351 at 1.2759 will add to the case of long term bullish trend reversal. However, firm break of 1.1801 will indicate rejection by 1.2759, and bring deeper decline, even as a correction.
Forex Markets Turn Risk-Averse, Sterling Lower after PMI
Forex markets have turned noticeably risk-off today, with Aussie and Kiwi showing broad-based declines. Despite Loonie holding strong, it is being outperformed by both Dollar and Yen. Meanwhile, European majors present a mixed picture, with Sterling lagging behind Euro and Swiss Franc.
Today's PMI data illustrated a 'two-track' economy in Europe, marked by robust services and weak manufacturing. Despite the resilience of services sector helping to stave off recession, questions linger about the longevity of this support given the prevailing high inflation. Furthermore, in countries like UK where services sector is a large portion of the economy, it is likely that BoE will be compelled to persist with tightening measures in order to suppress demand.
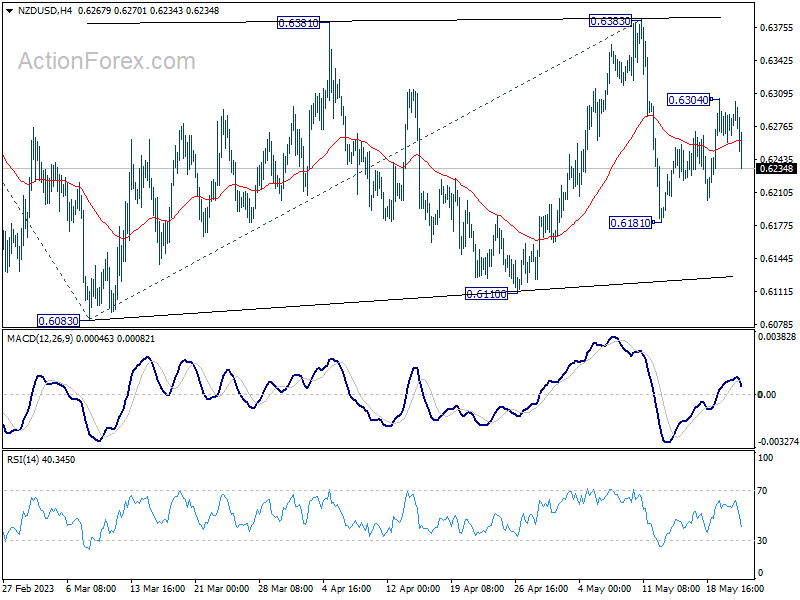
Attention now turns to the upcoming Asian session featuring an anticipated rate hike by RBNZ, placing NZD/USD in the spotlight. Recovery of NZD/USD from 0.6181 appears to be corrective so far, suggesting potential for further downside. Break below 0.6181 could trigger a rapid descent towards 0.6083 low. While a break above the 0.6304 resistance would extend the recovery, near-term outlook will continue to be bearish as long as 0.6383 resistance holds, just that downside breakout is delayed.
In Europe, at the time of writing, FTSE is up 0.31%. DAX is down -0.33%. CAC is down -0.97%, Germany 10-year yield is up 0.0328 at 2.492. Earlier in Asia, Nikkei dropped -0.42%. Hong Kong HSI dropped -1.25%. China Shanghai SSE dropped -1.52%. Singapore Strait Times rose 0.22%. Japan 10-year JGB yield rose 0.0167 to 0.404.
UK PMI composite dropped to 53.9, but BoE has more work to do
UK PMI Manufacturing dropped from 47.8 to 46.9 in May, a 5-month low. PMI Services dropped from 55.9 to 55.1. PMI Composite dropped from 54.9 to 53.9.
Chris Williamson, Chief Business Economist at S&P Global Market Intelligence said:
"The UK economy enjoyed another month of strong growth in May, with the expansion continuing to be driven by surging post-pandemic demand in the service sector, notably from consumers and for financial services, with hospitality activities buoyed further by the Coronation. The surveys are consistent with GDP rising 0.4% in the second quarter after a 0.1% rise in the first quarter...
"The UK is therefore seeing a tale of two economies, with the divergence between manufacturing and services posing difficulties for policymakers. However, it's the far larger service sector that will typically dictate policy, meaning these survey results are nothing but hawkish in suggesting the Bank of England has more work to do to quash stubbornly high inflationary pressures in the services economy."
Eurozone PMI manufacturing fell to 36-mth low, services dipped
Eurozone PMI Manufacturing fell from 45.8 to 44.6 in May, a 36-month low. PMI Services fell from 56.2 to 55.9. PMI Composite decreased from 54.1 to 53.3.
Cyrus de la Rubia, Chief Economist at Hamburg Commercial Bank said: Eurozone GDP is likely to have grown in the second quarter thanks to the healthy state of the services sector. However, the manufacturing sector is a powerful drag on the momentum of the economy as a whole.
He added that ECB will have a "headache" with the PMI price data, as "selling prices in the services sector actually rose more than in the previous month".
Also released, Germany PMI manufacturing dropped from 44.5 to 42.9 in May, a 36-month low. PMI Services rose from 56.0 to 57.8, a 21-month high. PMI Composite rose from 54.2 to 54.3, a 13-month high.
France PMI Manufacturing rose from 45.6 to 46.1. PMI Services dropped from 54.6 to 52.8. PMI Composite dropped from 52.4 to 51.4.
Australia PMI composite dropped to 51.2, still early to call an end to RBA tightening
Australia's PMI Manufacturing index stayed put at 48.0 in May, marking the joint-lowest reading since May 2020. On the other hand, PMI Services fell from 53.7 to 51.8, causing Composite PMI to decrease from 53.0 to 51.2.
Warren Hogan, Chief Economic Advisor at Judo Bank, said, "The May Flash result shows a small retracement from the strong April outcome reinforcing the view that overall economic activity in Australia is holding up well as we enter the winter months."
Despite the manufacturing sector's continuous slowdown, Hogan emphasized that this does not signal a recession. In contrast to manufacturing, the services sector has shown recent strength, and was "far from the risk of recession:.
However, he warned of the implications of better economic conditions in terms of inflation. "The RBA is trying to engineer a soft landing to rid the economy of inflation. But if they don't lean hard enough on monetary policy, we could see a more stubborn inflation emerge which will ultimately require a bigger lift in interest rates," Hogan cautioned.
Highlighting the strong correlation between the pick-up in the services PMI, housing market, rising population growth, and job advertising, he concluded, "Last week's labour market data on employment and wages have bought the RBA some time, but the Flash PMIs highlight that it is still too early to call an end to the monetary policy tightening cycle."
Japan PMI manufacturing rose to 50.8, services rose to 56.3
Japan PMI Manufacturing rose from 49.5 to 50.8 in April, signalling the first improvement in operating conditions since October 2022. PMI Manufacturing Output rose from 47.9 to 51.9. PMI Services rose from 55.4 to 56.3. PMI Composite Output rose from 52.9 to 54.9.
Usamah Bhatti, Economist at S&P Global Market Intelligence, said:
"The Japanese private sector economy continued on an upward trajectory, as signalled by a further expansion in May. The rate of growth quickened from April to reach the strongest since October 2013 and the second-strongest in the survey history (since September 2007).
"Service providers continued to report strong growth momentum with a renewed record increase in business activity, while manufacturers indicated an improvement in operating conditions for the first time in seven months, with output and new orders returning to expansion territory for the first time since last June."
GBP/USD Mid-Day Outlook
Daily Pivots: (S1) 1.2410; (P) 1.2441; (R1) 1.2469; More...
GBP/USD's decline from 1.2678 resumed by taking out 1.2390 temporary low and intraday bias is back on the downside. Current fall is seen as a correction to whole up trend form 1.0351. Deeper fall should then be seen to 1.1801 cluster support (38.2% retracement of 1.0351 to 1.2678 at 1.1789). On the upside, however, break of 1.2483 resistance will bring stronger rebound back to retest 1.2678 high instead.
In the bigger picture, as long as 1.1801 support holds, rise from 1.0351 medium term bottom (2022 low) is expected to extend further. Sustained break of 61.8% retracement of 1.4248 (2021 high) to 1.0351 at 1.2759 will add to the case of long term bullish trend reversal. However, firm break of 1.1801 will indicate rejection by 1.2759, and bring deeper decline, even as a correction.
Economic Indicators Update
| GMT | Ccy | Events | Actual | Forecast | Previous | Revised |
|---|---|---|---|---|---|---|
| 23:00 | AUD | Manufacturing PMI May P | 48 | 48 | ||
| 23:00 | AUD | Services PMI May P | 51.8 | 53.7 | ||
| 00:30 | JPY | Manufacturing PMI May P | 50.8 | 49.5 | ||
| 06:00 | GBP | Public Sector Net Borrowing (GBP) Apr | 24.7B | 17.5B | 20.7B | 20.0B |
| 07:15 | EUR | France Manufacturing PMI May P | 46.1 | 46.1 | 45.6 | |
| 07:15 | EUR | France Services PMI May P | 52.8 | 54.3 | 54.6 | |
| 07:30 | EUR | Germany Manufacturing PMI May P | 42.9 | 45.2 | 44.5 | |
| 07:30 | EUR | Germany Services PMI May P | 57.8 | 55.5 | 56 | |
| 08:00 | EUR | Eurozone Manufacturing PMI May P | 44.6 | 46.2 | 45.8 | |
| 08:00 | EUR | Eurozone Services PMI May P | 55.9 | 55.6 | 56.2 | |
| 08:00 | EUR | Current Account (EUR) Mar | 31.2B | 20.2B | 24.3B | |
| 08:30 | GBP | Manufacturing PMI May P | 46.9 | 48.2 | 47.8 | |
| 08:30 | GBP | Services PMI May P | 55.1 | 55.5 | 55.9 | |
| 12:30 | CAD | Industrial Product Price M/M Apr | -0.20% | 0.20% | 0.10% | |
| 12:30 | CAD | Raw Material Price Index Apr | 2.90% | 0.70% | -1.70% | |
| 13:45 | USD | Manufacturing PMI May P | 50 | 50.2 | ||
| 13:45 | USD | Services PMI May P | 53.6 | 53.6 | ||
| 14:00 | USD | New Home Sales Apr | 665K | 683K |