

Sample Category Title
AUD/USD Daily Report
Daily Pivots: (S1) 0.6630; (P) 0.6649; (R1) 0.6671; More...
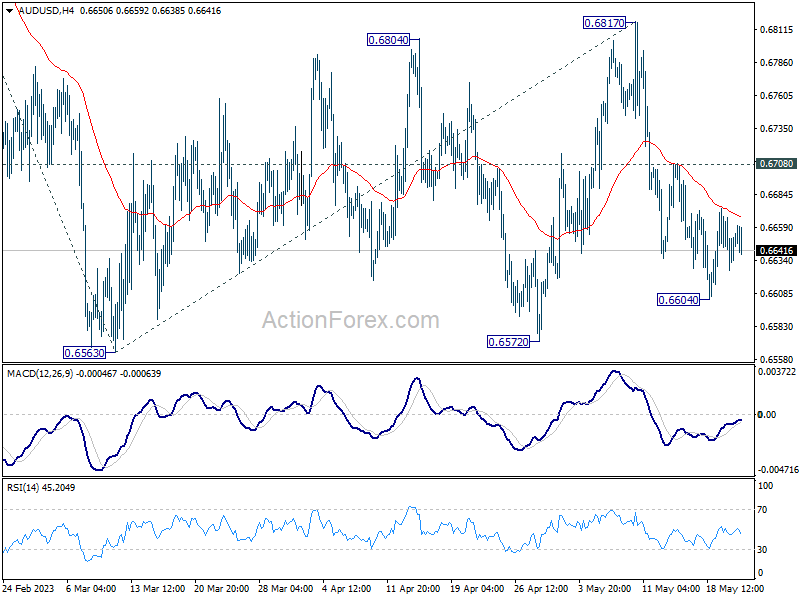
Intraday bias AUD/USD stays neutral at this point. Further decline is in favor as long as 0.6708 resistance holds. Below 0.6604 will bring retest of 0.6563 low first. Decisive break there will resume larger decline from 0.7156 to 61.8% projection of 0.7156 to 0.6563 from 0.6817 at 0.6451. On the upside, above 0.6708 minor resistance will delay the bearish case, and extend the corrective pattern from 0.6563 with another rising leg.
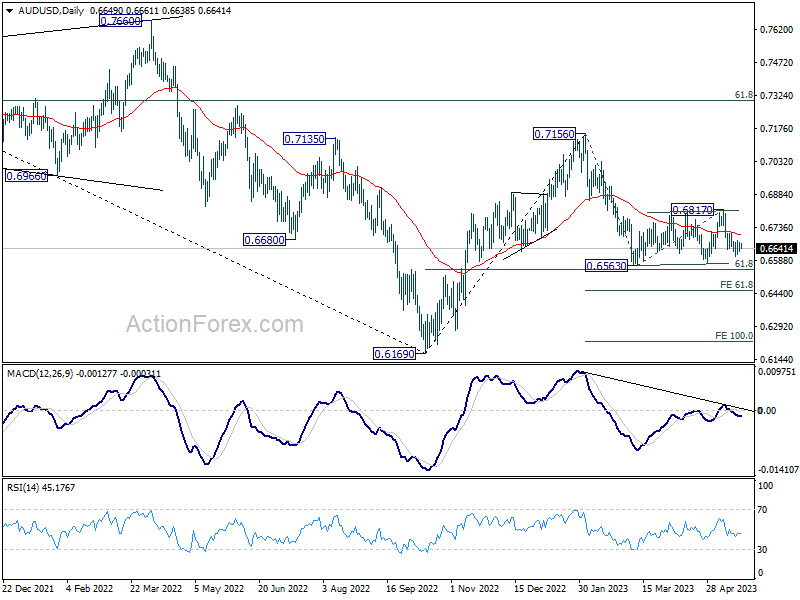
In the bigger picture, the failure to break through 55 W EMA (now at 0.6822) keeps medium term outlook bearish. Firm break of 61.8% retracement of 0.6169 to 0.7156 at 0.6546 will raise the chance of long term down trend resumption through 0.6169 low. This will now be the favored case as long as 0.6817 resistance holds.
EUR/USD Daily Outlook
Daily Pivots: (S1) 1.0795; (P) 1.0813; (R1) 1.0830; More...
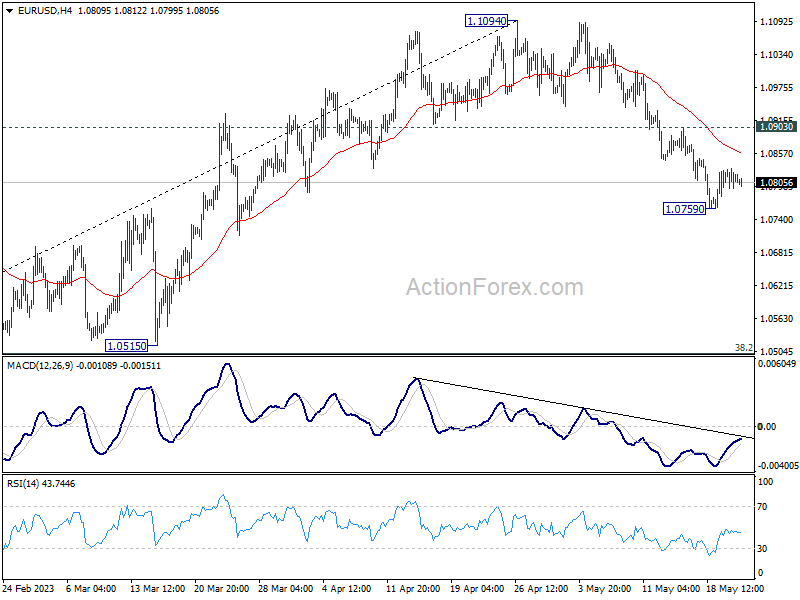
No change in EUR/USD's outlook as consolidation continues above 1.0759. Deeper decline is expected as long as 1.0903 resistance holds. Fall from 1.1094 is seen as correcting whole up trend from 0.9534. Below 1.0759 will target 1.0515 cluster support, 38.2% retracement of 0.9534 to 1.1094 at 1.0498. On the upside, though, firm break of 1.0903 will bring stronger rebound back to retest 1.1094 high instead.
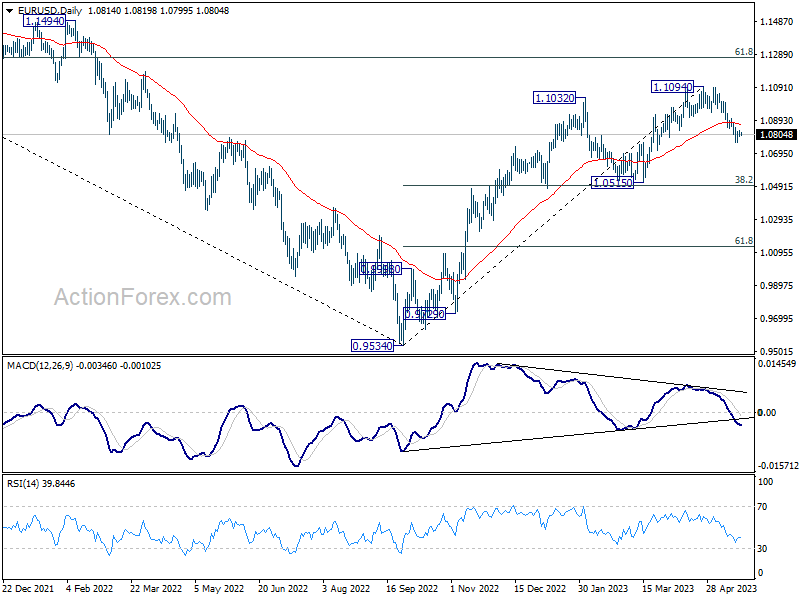
In the bigger picture, as long as 1.0515 support holds, rise from 0.9534 (2022 low) would still extend higher. Sustained break of 61.8% retracement of 1.2348 (2021 high) to 0.9534 at 1.1273 will solidify the case of bullish trend reversal and target 1.2348 resistance next (2021 high).
GBP/USD Daily Outlook
Daily Pivots: (S1) 1.2410; (P) 1.2441; (R1) 1.2469; More...
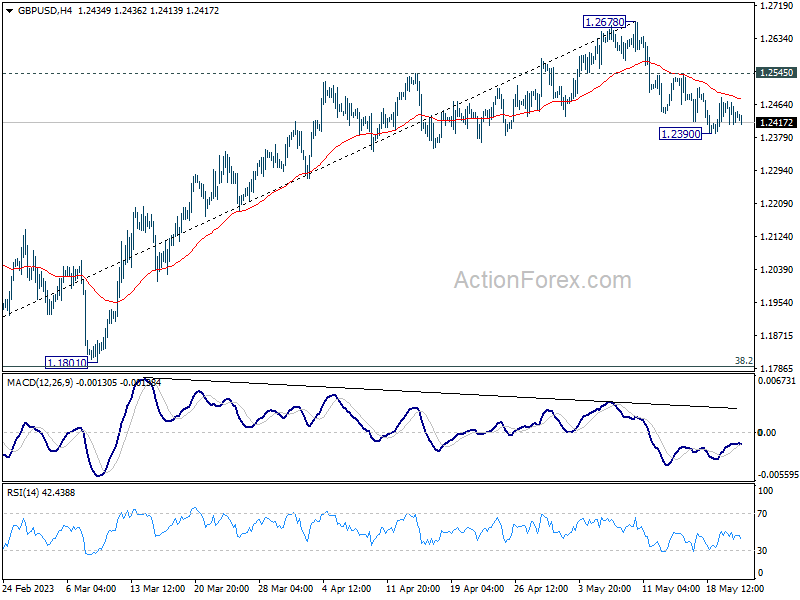
Intraday bias in GBP/USD remains neutral and fall from 1.2678 short term top is expected to continue as long as 1.2545 resistance holds. On the downside, sustained trading below 55 D EMA (now at 1.2395) should confirm that it's already in correction to whole up trend form 1.0351. Deeper fall should then be seen to 1.1801 cluster support (38.2% retracement of 1.0351 to 1.2678 at 1.1789). On the upside, however, break of 1.2545 will bring stronger rebound back to retest 1.2678 high.
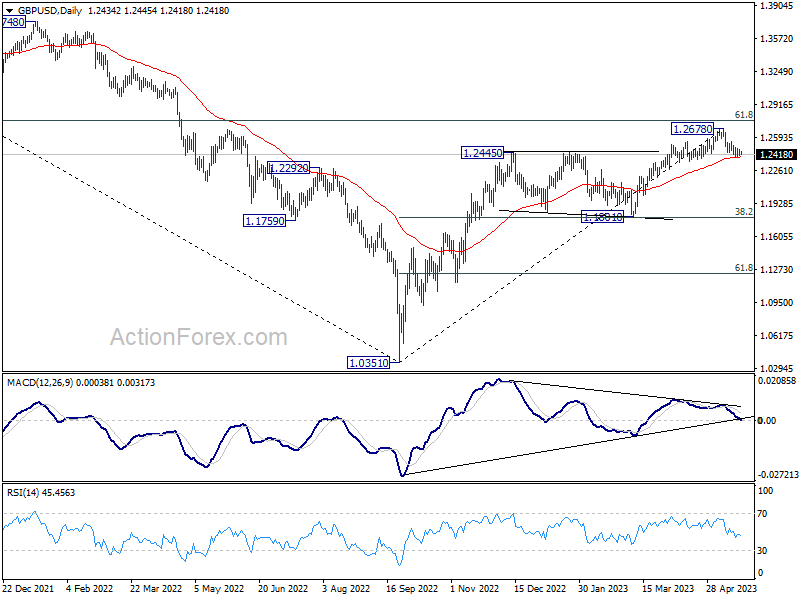
In the bigger picture, as long as 1.1801 support holds, rise from 1.0351 medium term bottom (2022 low) is expected to extend further. Sustained break of 61.8% retracement of 1.4248 (2021 high) to 1.0351 at 1.2759 will add to the case of long term bullish trend reversal. However, firm break of 1.1801 will indicate rejection by 1.2759, and bring deeper decline, even as a correction.
USD/CHF Daily Outlook
Daily Pivots: (S1) 0.8947; (P) 0.8972; (R1) 0.9004; More...
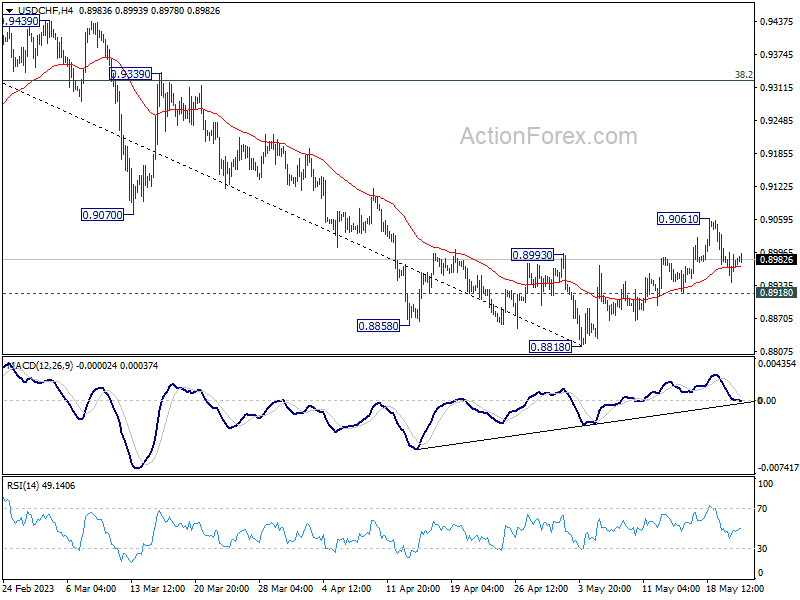
Intraday bias in USD/CHF remains neutral at this point, and outlook is unchanged. Rebound from 0.8818 short term bottom is expected to continue as long as 0.8918 minor support holds. On the upside, sustained trading above 55 D EMA (now at 0.9039) should confirm that current rally is at least correcting whole down trend from 1.0146. Further rise should then be seen to 38.2% retracement of 1.0146 to 0.8818 at 0.9325. On the downside, though, break of 0.8918 will bring retest of 0.8818 low instead.
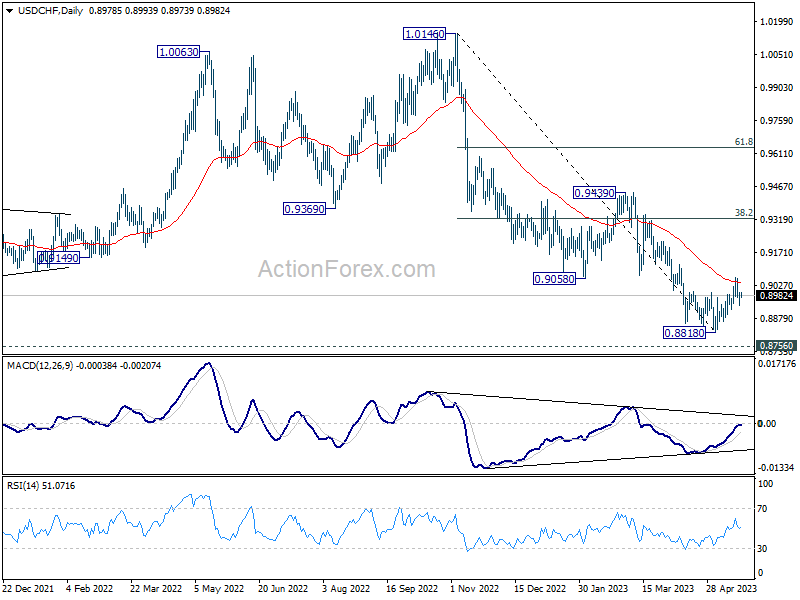
In the bigger picture, fall from 1.1046 (2022 high) is seen as a leg in the long term range pattern from 1.0342 (2016 high). So, downside should be contained by 0.8756 to bring reversal. Sustained break of 0.9058 support turned resistance will be the first sign of medium term bottoming. However, decisive break of 0.8756 will carry larger bearish implications.
Fed’s Two Biggest Hawks Yesterday Coloured Trading
Markets
The Fed’s two biggest hawks yesterday coloured trading which until then turned out to be non-directional. Kashkari from the Minneapolis Fed said it’s a close call between a pause and a hike in June, adding that the former wouldn’t mean tightening is over per se. St. Louis Fed president Bullard called US recession worries overstated and expects some 50 bps more rate hikes sooner rather than later this year. SF’s Daly and Atlanta’s Bostic argued for caution but their comments were largely dismissed. US yields went from losing almost 5 bps to similar-sized gains at the front end of the curve. Longer tenors also added between 3.8-4.2 bps. German yields followed suit, adding 3.1-5.2 bps with the front underperforming. ECB’s Villeroy warned about persistent underlying price pressures. Especially services inflation needs to be monitored as it is likely to become the dominant inflation source. Peripheral spreads narrowed with Greece hugely outperforming (-17 bps, to the lowest since Nov 2021) following incumbent PM Mitsotakis’s election victory last Sunday. FX markets were stoic. EUR/USD (barely) held above 1.08 and EUR/GBP (0.869) tried to leave the recent lows behind. Stocks finished slightly lower in Europe. Wall Street closed mixed as investors awaited the outcome of another round of debt ceiling talks. Those concluded during Asian trading on a more upbeat note, even though there is no deal yet. Catching the eye this morning is excess volatility in the Turkish lira for a second day straight (see below). USD/TRY surged yesterday and this morning past 20 before paring gains back below in a sign how authorities are struggling to keep TRY-depreciation in check. The Japanese yen ekes out a tiny gain following strong May PMI business confidence (cf. infra). The US dollar in general trades a tad stronger.
PMIs are going from Japan this morning to Europe, the UK and US later today. Expectations are for a slight easing in all of the three areas, mostly on the account of the services sector. At 53 (composite) or more that would, all in all, still mean solid economic growth. The May edition will capture the effect, if any, of the March financial turbulence in full, suggesting risks today are tilted to the downside. In this case it could temporarily mark an end to the core bond yield rebound over the past few days, especially in the US. The picture is more nuanced in Europe. As such it may also help EUR/USD find a bottom after the May decline. If, however, such a downward surprise doesn’t materialize, we expect the turmoil and (credit crunch) worries related to it to move to the background, at least in the short run, allowing core bond yields and the USD to extend gains.
News Headlines
The Jibun Japan May PMI’s indicated that growth in the economy continued at the fastest pace since October 2013. The composite PMI, compiled by S&P, rose to 54.9 from 52.9 in April. It was the fifth consecutive reading above the 50 mark that separates growth from contraction. Growth still was mainly driven by activity in the services sector. The services PMI rose to a record rate for survey (56.3 from 55.4) reflecting sustained improvements in private consumption and international tourism post COVID-19. PMI data also indicates that service activity continues to fare strongly and has yet to reach the end of the current boom cycle. Employment levels within Japan's service sector also expanded at the second fastest pace on record. Manufacturing output expanded at a slower pace, but, but also returned in positive territory (50.8 from 49.5). The Flash PMI suggests that inflationary pressures eased from April, but stay elevated. Input cost inflation rose at its slowest rate for 17 months, but is still running well above the average level in May. Output price inflation eased to its 12-month average but remained consistent with Japan's CPI staying elevated in mid-year. The yen this morning rebounds marginally after touching the lowest levels since end November (USD/JPY 138.5 area).
It’s Like Watching an American Film
Yesterday was just another day with the same topics. The US debt ceiling talks continued; US President Joe Biden expressed optimism about reaching a deal. US Treasury Secretary Janet Yellen said that the Treasury will soon be running out of money and won’t be able to service its debt.
The US 2-year yield pushed higher to above 4.30%, the S&P500 was little changed near levels last seen last summer, while Nasdaq 100 advanced to levels above last summer peaks and is now trading at the highest levels since April 2021.
Interestingly however, gold doesn’t see much demand despite the looming debt ceiling talks. Inflows remain limited and the price pressures are to the downside. The stronger US dollar and higher yields weigh on gold appetite at a time investors would be ready to take on higher opportunity costs due to rising default risk.
But the fact that equities remain strong despite the rising yields, and that gold sees limited safe-haven inflows point that investors watch the US debt ceiling saga as an American film knowing that there will eventually be a happy ending…
Two more hikes?
Federal Reserve (Fed) officials remain surprisingly hawkish. It’s just yesterday that St Louis Fed President Bullard – who is happily not a voting member this year – said he would back two more rate hikes in 2023. Minneapolis Fed’s Kashkari said that even if the Fed decided to bypass a rate hike in June, it should make sure to investors that tightening is not over.
That, with the fact that the US Treasury will be refilling its General Account as soon as a debt ceiling deal is reached, means that the financial and liquidity conditions will tighten in the next few months, rather than the contrary.
And that’s not necessarily good news for stocks.
In the short run, however, a resolution to the debt ceiling saga will likely trigger a further positive push in stocks before the liquidity headache kicks in. In this context, we will likely see the S&P500 clear the 4200 resistance with the news of an eventual debt ceiling deal, before the winds turn south.
Flash PMIs
In Japan, the flash PMI data showed that services expanded faster in May, while manufacturing unexpectedly turned to expansion. With such a massive support from the Bank of Japan (BoJ), it’s good news that the Japanese manufacturers are feeling better despite the soft yen which makes the cost of raw material more expensive by the day. The USDJPY is approaching the 139 level. Softer yen means that inflation in Japan will only get worse if the BoJ doesn’t step in. But until then, the widening spread between the Japanese and US rates support a further advance in USDJPY toward the 140 psychological mark.
Elsewhere, the EURUSD remains bid around the 1.08 mark, with manufacturing PMI seen slightly less in contraction than the previous month. A better-than-expected set of data could help fuel the European Central Bank (ECB) hawks and give a positive spin to the euro at the current levels. The ECB Chief Lagarde and Spanish central bank head de Cos reiterated their hawkish stance over the past couple of days saying that the ECB is already at an advanced tightening level, but that the bank will continue raising rates and will keep them at restrictive levels to bring inflation back to the 2% policy target. Given that the ECB doesn’t deal with a banking crisis and political shenanigans, the hawkish call from its members is more credible than their colleagues across the Atlantic Ocean. Therefore, the medium-term outlook for the euro remains positive, yet the short-term direction will mostly depend on the US dollar appetite into the US debt ceiling deadline. The rising US yields and safe haven demand support the US dollar in the actual context of uncertainty, and the dollar could hold on to its gains in the coming days.
In energy
US crude remains in a tight range above the $70pb level. Bulls are skeptical as the looming debt ceiling talks in the US are not ideal for appetite, but bears are rare below the $70pb level as the lower the price the higher the risk of another OPEC intervention at the next meeting which will take place at the beginning of next month.
Until then, we will likely see strong resistance into the 50-DMA, which stands around $74.50 mark, and into the 100-DMA, which is just shy of $76pb.
Focus on flash PMIs
Market movers today
Today is PMI day. Euro area PMIs will be scrutinised for clues on whether the service sector continues to be the key driver for growth and inflation. In the US, it will be interesting to see if PMIs continue to paint a significantly rosier picture of both the manufacturing sector and service compared to e.g. ISM data.
The Central Bank of Hungary concludes a meeting where we expect them to keep the base rate unchanged at 13.0%.
Overnight, we expect the Reserve Bank of New Zealand to hike the cash rate by 25bp to 5.50%. Markets are divided with around 37bp priced in.
The 60 second overview
Debt ceiling: Biden and McCarthy failed to find an agreement in the debt ceiling talks overnight, but reassured the negotiations would continue. Republican negotiator Patrick McHenry called the tone in the meeting 'the most positive yet'. Parties have not yet found common ground on the budget outlook, as democrats have offered to limit next year's spending to this year's levels, but republicans have demanded freezing spending to 2022 levels for 10 years. Furthermore, other unresolved issues seem to include democrats' push to reduce deficit with tax hikes and republicans' proposed subsidies to oil & gas industry. With the X-date looming in early June, the parties most likely still have around two weeks left for the talks. While we do expect a deal to be eventually reached, we also think the discussions are once again likely to go down to the wire.
PMIs: Preliminary PMI data from Japan and Australia was mixed ahead of the euro area and US releases later today. In Japan, activity picked up both in manufacturing and services, with the latter index reaching an all-time high at 56.3 (from 55.4). Output price indices eased modestly on both sectors, although especially service sector inflation pressures still appear clearly elevated in a historical context. In Australia, growth weakened in the services sector, while the manufacturing index remained stable in contractionary territory.
Geopolitical radar: Yesterday Russia reported that a Ukrainian group had attacked a Russian town of Belgorod, close to the border with northeast Ukraine. Kyiv authorities denied that Ukrainian army was involved in the situation, and Ukrainian media reported that Russian opposition groups were responsible for the attack.
Equities: Wait and see-mode in equities yesterday. Sectors and styles were tightly bunched, with both S&P and Stoxx closing unchanged. As said, there were little direction but if any, a slight preference for defensives, FANMAG and quality. One thing to keep an eye on is small caps, which begun to outperform in the US last week. This outperformance extended into Monday's session, with Russell 2000 up 1.2%. Of course, the rebound in the regional banking index holds a part of the answer, but this macro environment is typically when small caps would start to outperform again from a stylistic perspective. US futures are a tad higher this morning.
FI: An early morning rally in EGBs was replaced by a gradual move higher in yields across the board throughout the rest of the day in a curve flattening move, on the back of hawkish Fed comments where Bullard sees additionally two hikes this year while Kashkari said the June meeting is a close call (for pause or another hike). Spreads were generally mixed while markets also recorded a strong performance by Greece after the national elections on Sunday seemingly gives PM Mitsotakis another term. The 10y Greek bond dropped 17bp vs 10y Bunds.
FX: Most G10 currency pairs were rangy on Monday. This included EUR/SEK for most part of the European session, but US opening sparked a mini rally in the cross which now eyes the April high at 11.43. Meanwhile, EUR/NOK is challenging 11.80 and the highs from early May.
Nordic macro
Sweden: In Sweden, today's focus is on a speech (12:30 CET) by Erik Thedéen on "The mutual dependence between monetary, financial market and fiscal policy". There are actually several Riksbank speakers who will discuss the economy this week: Per Jansson (hawk) and Flodén (dove) on Wednesday, Thedéen (hawk) again on Thursday and Breman (dove) on Friday, all of which might be important money-market and SEK drivers.
Norway: Norges Bank's Q2 expectations survey will be important given the current situation. Expectations for this year are likely to be at least as high as they were last time around, but we are excited to see where expectations for next year land, for both wages and prices. Signs that expectations will peak this year and fall next year are important for the risk of price-wage spirals.
Technical Outlook and Review
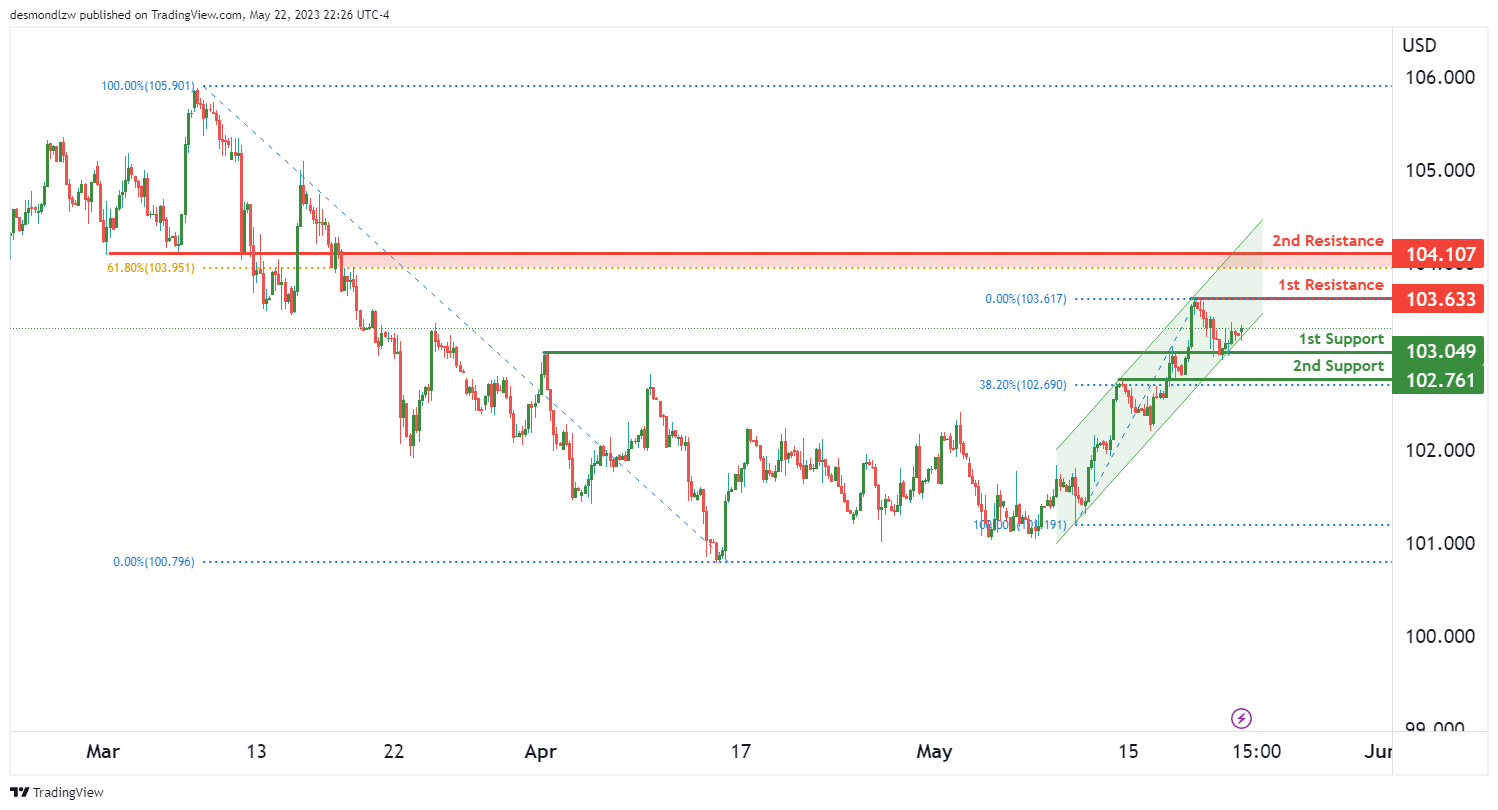
DXY:
The DXY is currently showing a bullish trend, with the price movement in a bullish ascending channel contributing to this momentum.
The price could potentially continue its upward movement towards the first resistance level.
The first support level is at 103.04 and is considered an overlap support, a price level that has previously acted as both support and resistance.
The second support level is located at 102.76. This level also serves as an overlap support and aligns with the 38.20% Fibonacci retracement level, highlighting its significance in the current market conditions.
On the upside, the first resistance level is at 103.63, which has historically acted as a multi-swing high resistance, where the price has touched and retreated several times in the past.
The second resistance level is at 104.10 and functions as an overlap resistance, indicating its previous role as both support and resistance. This level also corresponds with the 61.80% Fibonacci retracement, suggesting it may present a significant hurdle for further price increases.
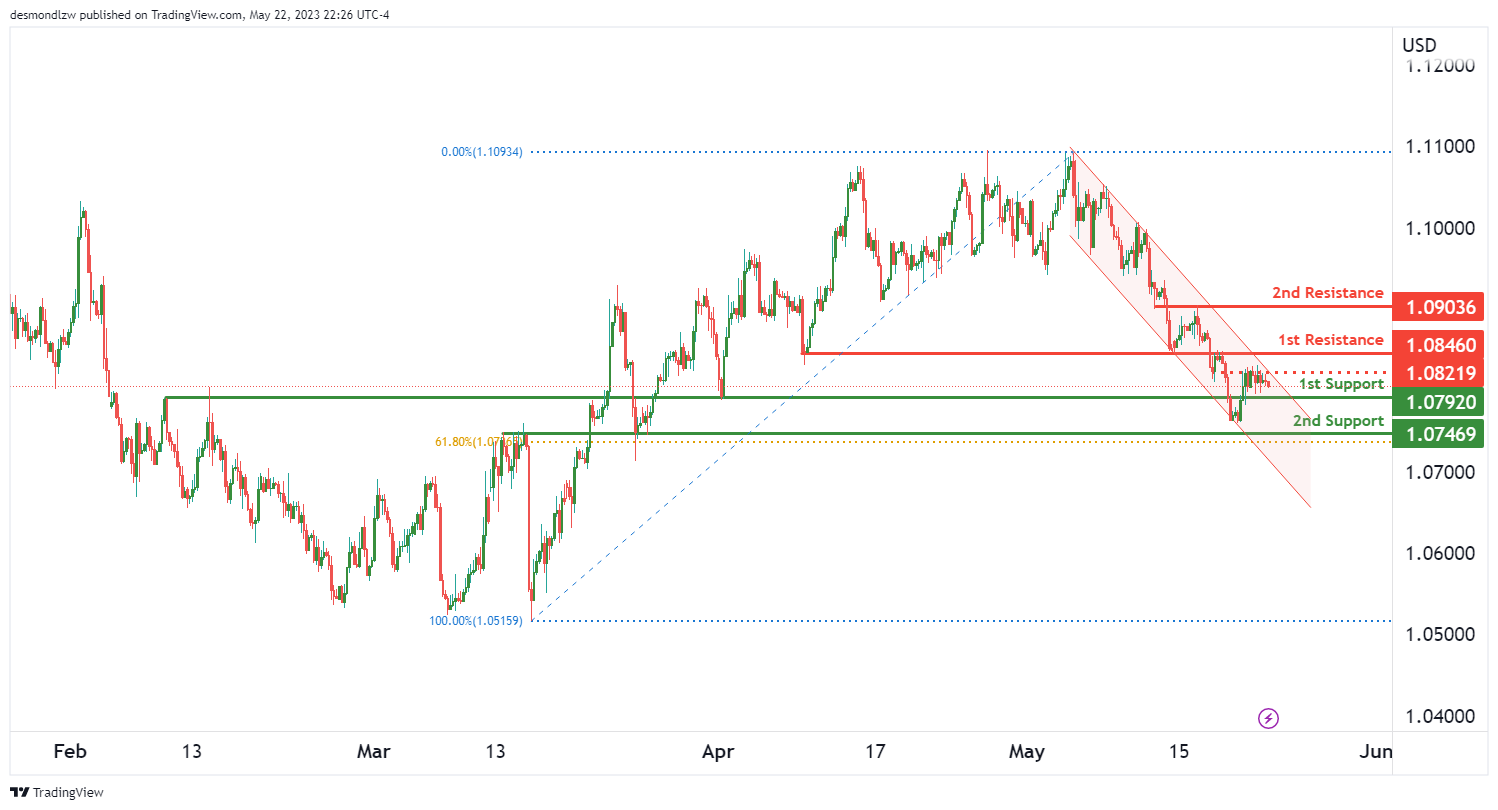
EUR/USD:
The EUR/USD pair currently exhibits a bearish trend, with the price moving in a bearish descending channel.
Given this trend, there is potential for continued bearish movement towards the initial support level.
The first support level is identified at 1.0792 and acts as an overlap support, indicating it has previously served as both support and resistance.
The second support level, at 1.0746, also functions as an overlap support and coincides with the 38.20% Fibonacci retracement level, reinforcing its significance in the current market scenario.
If the price were to reverse direction, the first resistance level is situated at 103.63. This level has historically acted as a multi-swing high resistance, suggesting the price has struggled to break above this level on multiple occasions.
The second resistance level stands at 104.10, serving as an overlap resistance. This level aligns with the 61.80% Fibonacci retracement level, indicating it could act as a significant barrier to upward price movements.
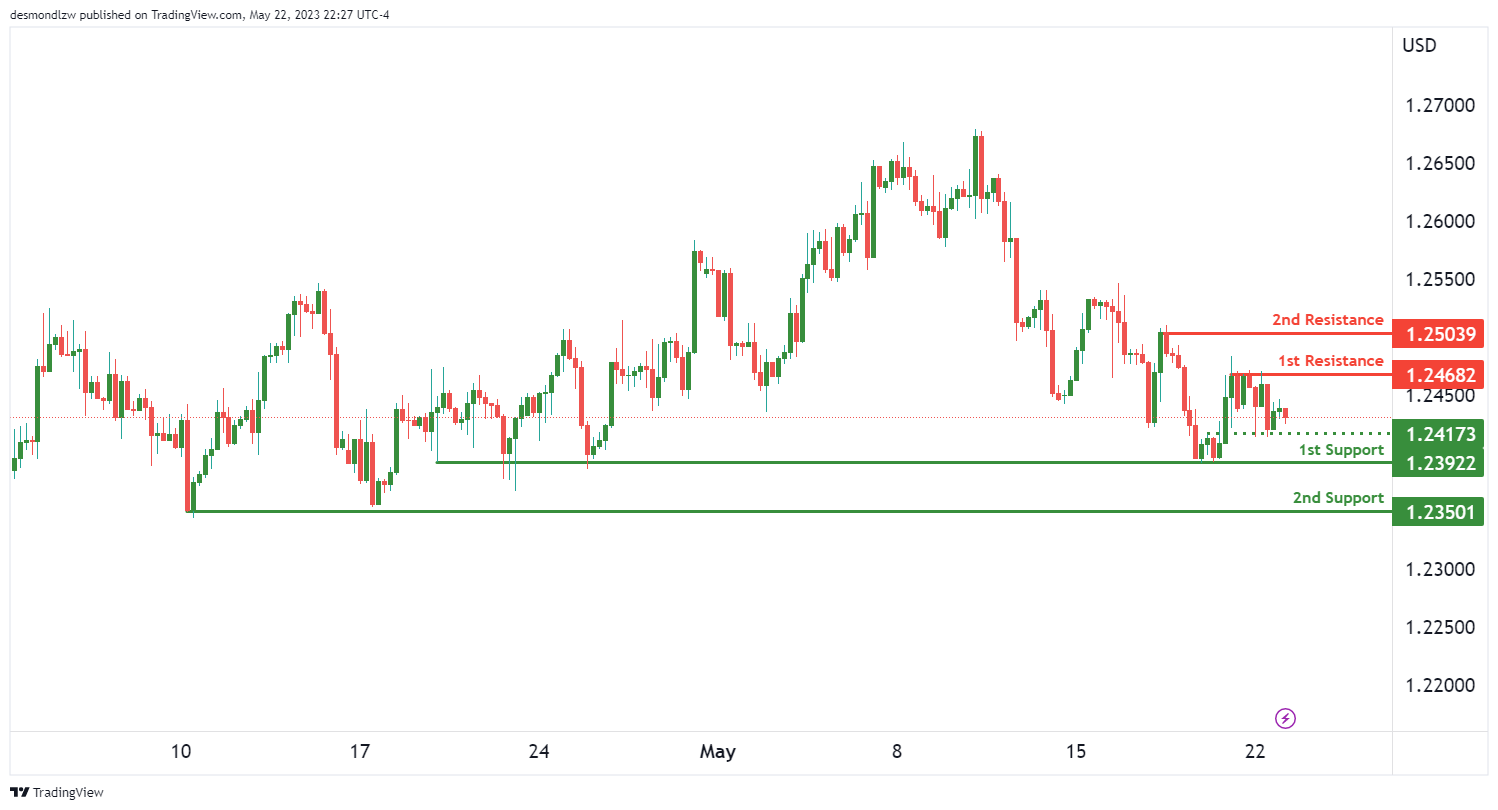
GBP/USD:
The GBP/USD pair currently demonstrates a bearish trend, suggesting potential for further downward price movement towards the primary support level.
The initial support level is situated at 1.2392 and has historically functioned as a multi-swing low support, indicating its significance as a point of demand in the market.
A secondary support level at 1.2340 acts similarly as a multi-swing low support, further emphasizing its role in potentially halting further price declines.
Contrarily, if the price reverses upwards, the first resistance level can be found at 1.2468. This level has previously acted as a multi-swing high resistance, suggesting the price has encountered difficulties breaking above this point on multiple attempts.
A second resistance level at 1.2503 serves as a swing high resistance, indicating its potential to act as a barrier to upward price movements.
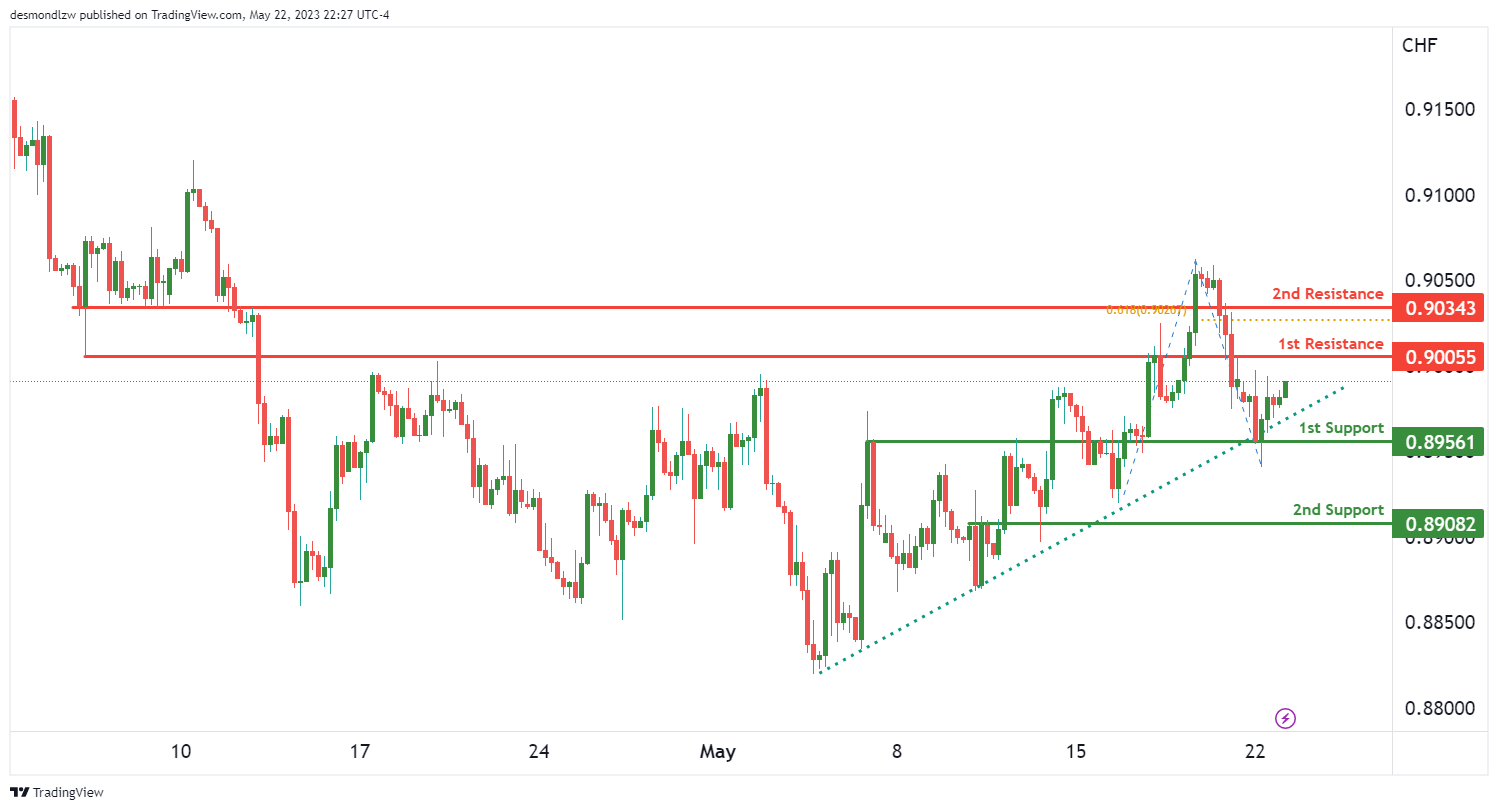
USD/CHF:
The USD/CHF pair is currently showing a bullish trend, with the price staying above a significant ascending trend line, indicating the possibility for continued bullish momentum.
In light of this trend, the price could potentially continue its bullish ascent towards the first resistance level.
The initial support level is at 0.8956 and acts as an overlap support, a level that has historically served both as support and resistance, indicating its potential as a significant floor level.
A secondary support level can be found at 0.8908, serving also as an overlap support, further emphasizing its role as a potential floor level for the price.
On the other hand, if the price continues to rise, the first resistance level is located at 0.9005. This level has served as an overlap resistance, indicating its previous role as both support and resistance.
The second resistance level stands at 0.9034, acting as a pullback resistance. Additionally, this level coincides with the 61.8% Fibonacci projection, suggesting its potential to act as a significant ceiling level for price movements.
USD/JPY:
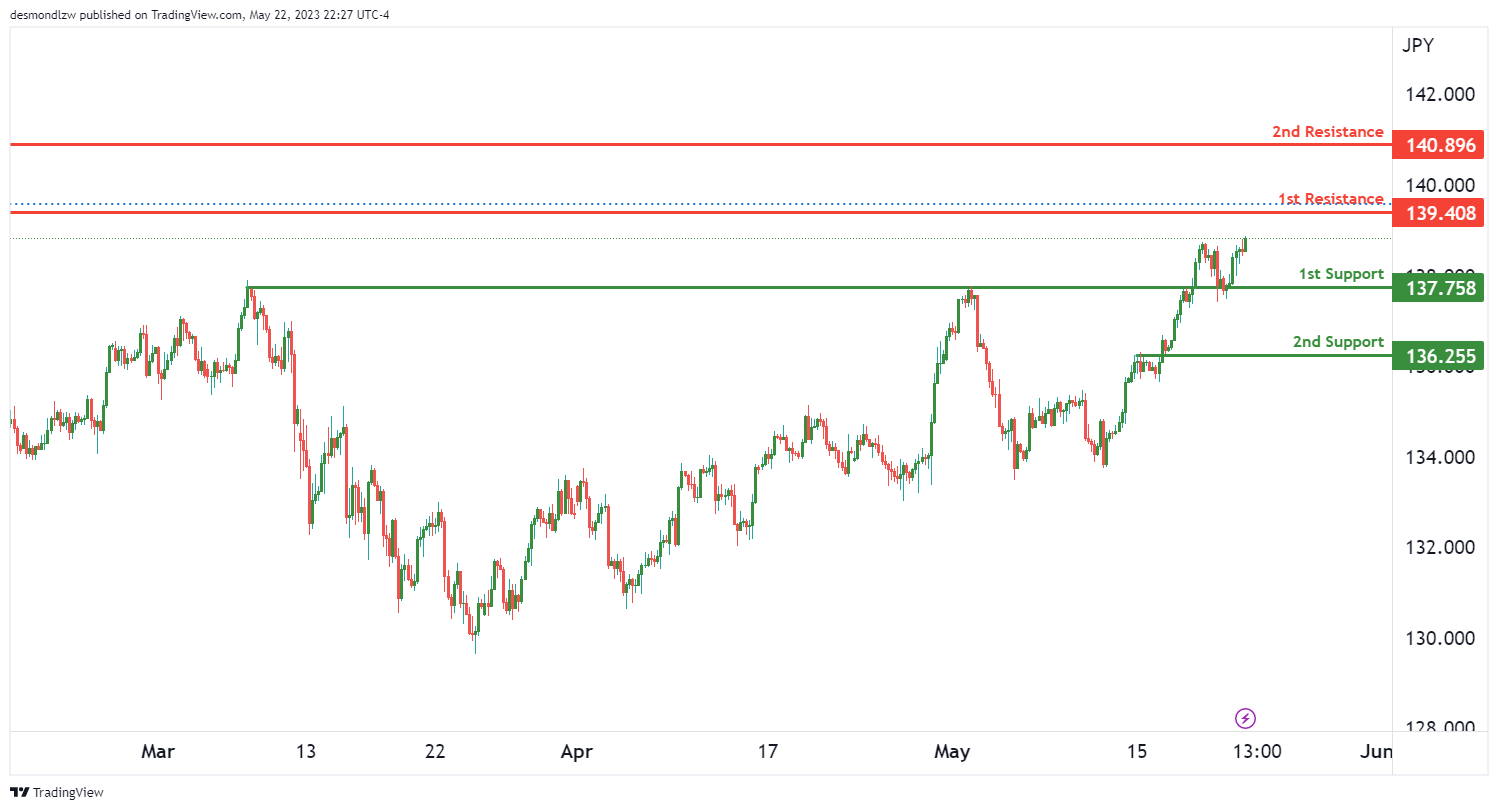
The USD/JPY pair is currently on a bullish trend, suggesting that the pair could continue its upward trajectory towards the first resistance level.
The first level of support is at 137.75, functioning as an overlap support, which is a level that has historically acted as both resistance and support. This could potentially halt or reverse any downward movement in the pair.
A second support level can be found at 136.25. This level also acts as an overlap support, reinforcing its potential as a crucial floor level for the pair.
On the upside, if the bullish trend continues, the first level of resistance is at 139.40. This level acts as a swing high resistance, indicating it has been a point at which upward price momentum has historically stopped and reversed.
The second resistance level is located at 140.89. This level serves as a pullback resistance, indicating it is a price level at which the currency pair has previously experienced a reversal following a brief retracement
AUD/USD:
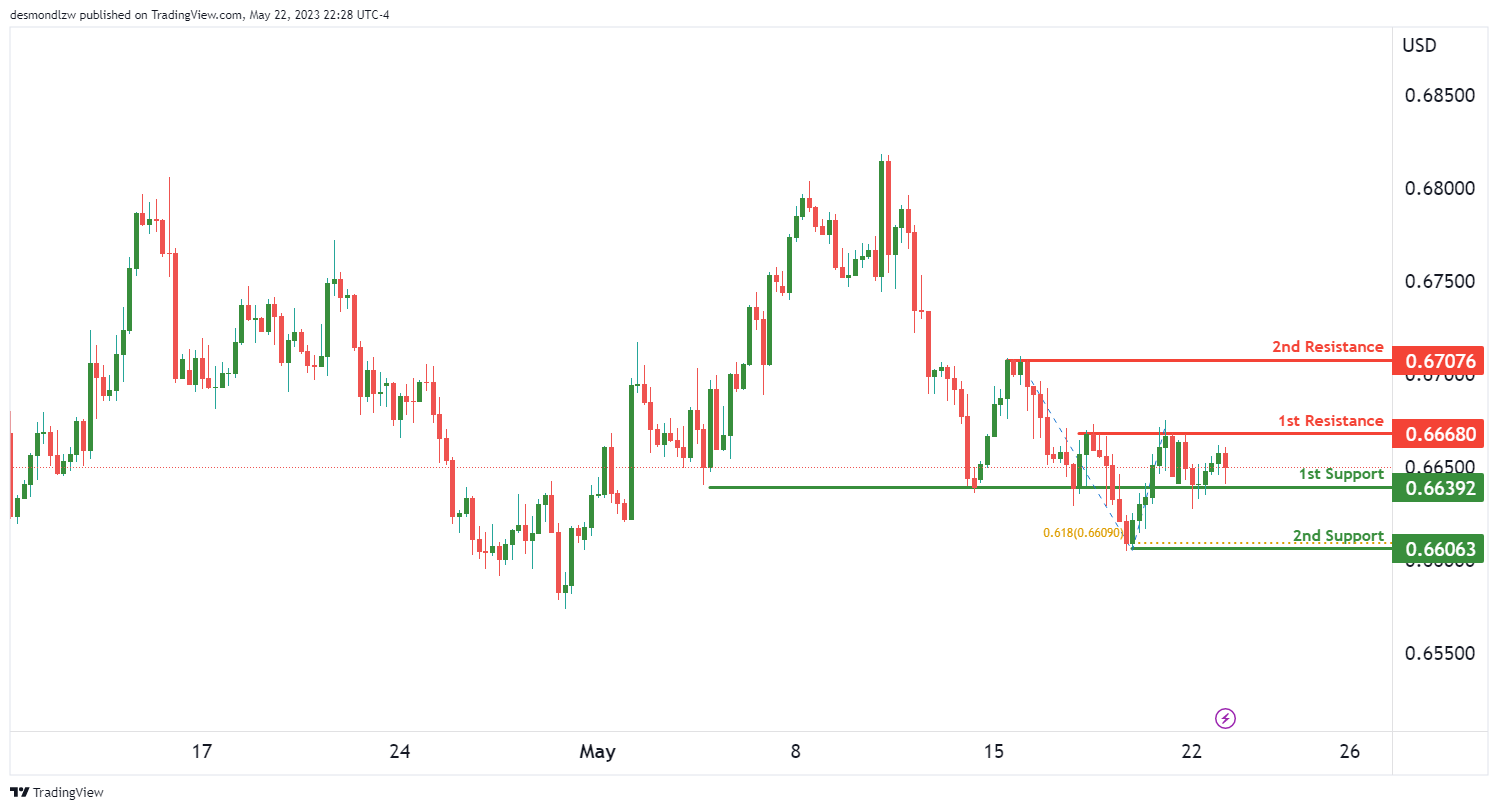
The AUD/USD pair currently shows a neutral trend, indicating that the pair could oscillate between the first resistance and first support level.
The first support level is at 0.6639, acting as an overlap support, which is a price level that has historically functioned as both resistance and support. This might be a region where the price can pause or rebound.
The second support level lies at 0.6606. This level is considered a swing low support, which means it’s a price level where the pair has historically bottomed out. Additionally, it aligns with the 61.8% Fibonacci projection, further strengthening its significance.
On the other hand, if the price sees an upward move, the first resistance level is found at 0.6668. This level has acted as a multi-swing high resistance in the past, indicating that it could be a challenging point for the pair to surpass.
The second resistance level is at 0.6707, which also serves as a multi-swing high resistance, suggesting that it’s a level where the price has historically found difficulty in breaking through.
NZD/USD
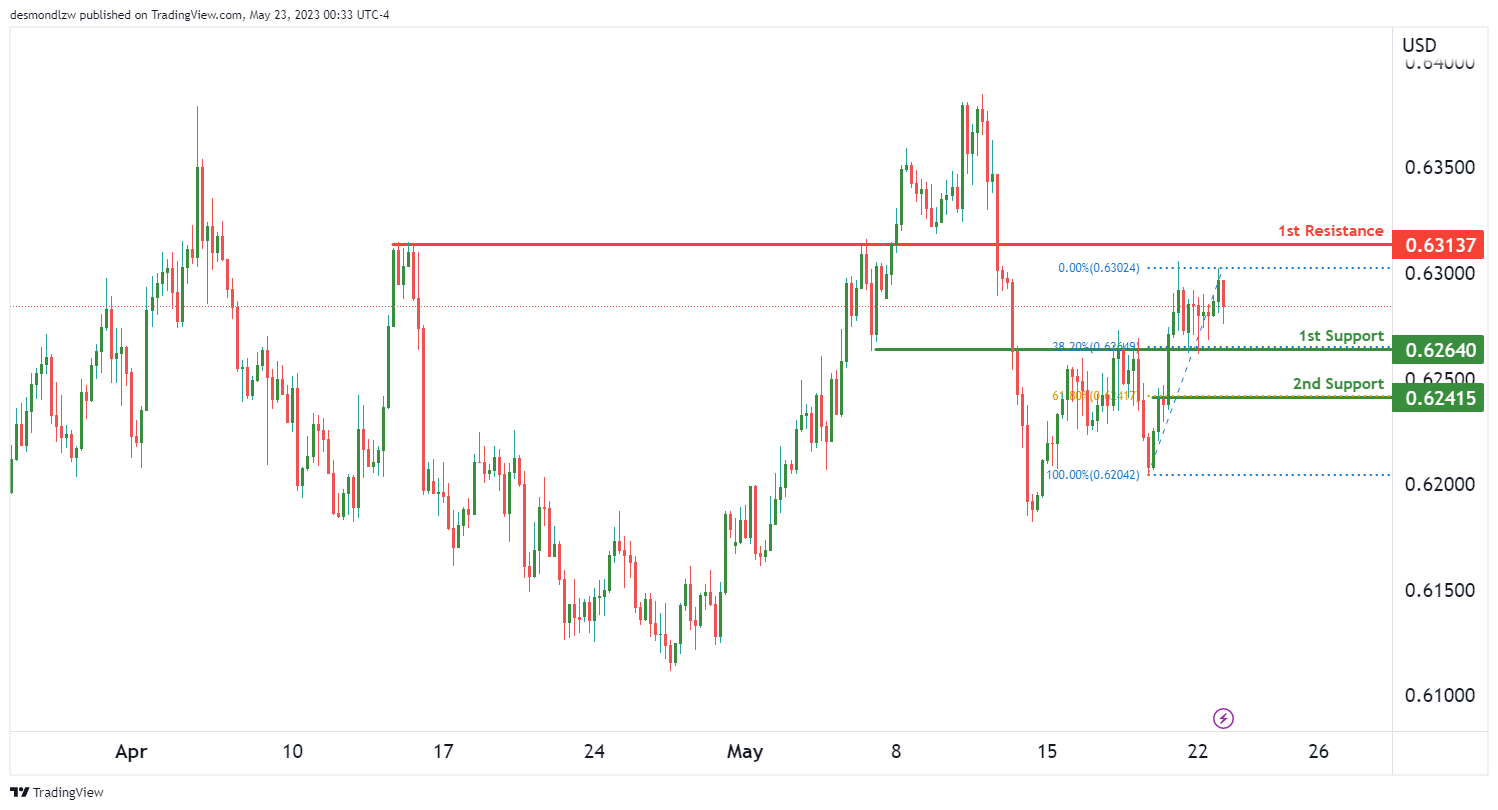
The NZD/USD pair currently exhibits a neutral trend, suggesting that the price might oscillate between the first resistance and first support levels.
The first support level is identified at 0.6264, which acts as an overlap support. This level has historical significance, acting as both resistance and support in the past. It also aligns with the 38.2% Fibonacci retracement level, adding further credibility to its potential as a support level.
The second support level is positioned at 0.6241, which aligns with the 61.8% Fibonacci retracement level. This is often considered a key level in market retracements and may be significant in halting further price decline.
On the upside, if the price experiences an upward movement, the first resistance level is at 0.6313. This level serves as a pullback resistance, indicating that it’s a point where the price has previously rebounded after a brief retracement.
USD/CAD:
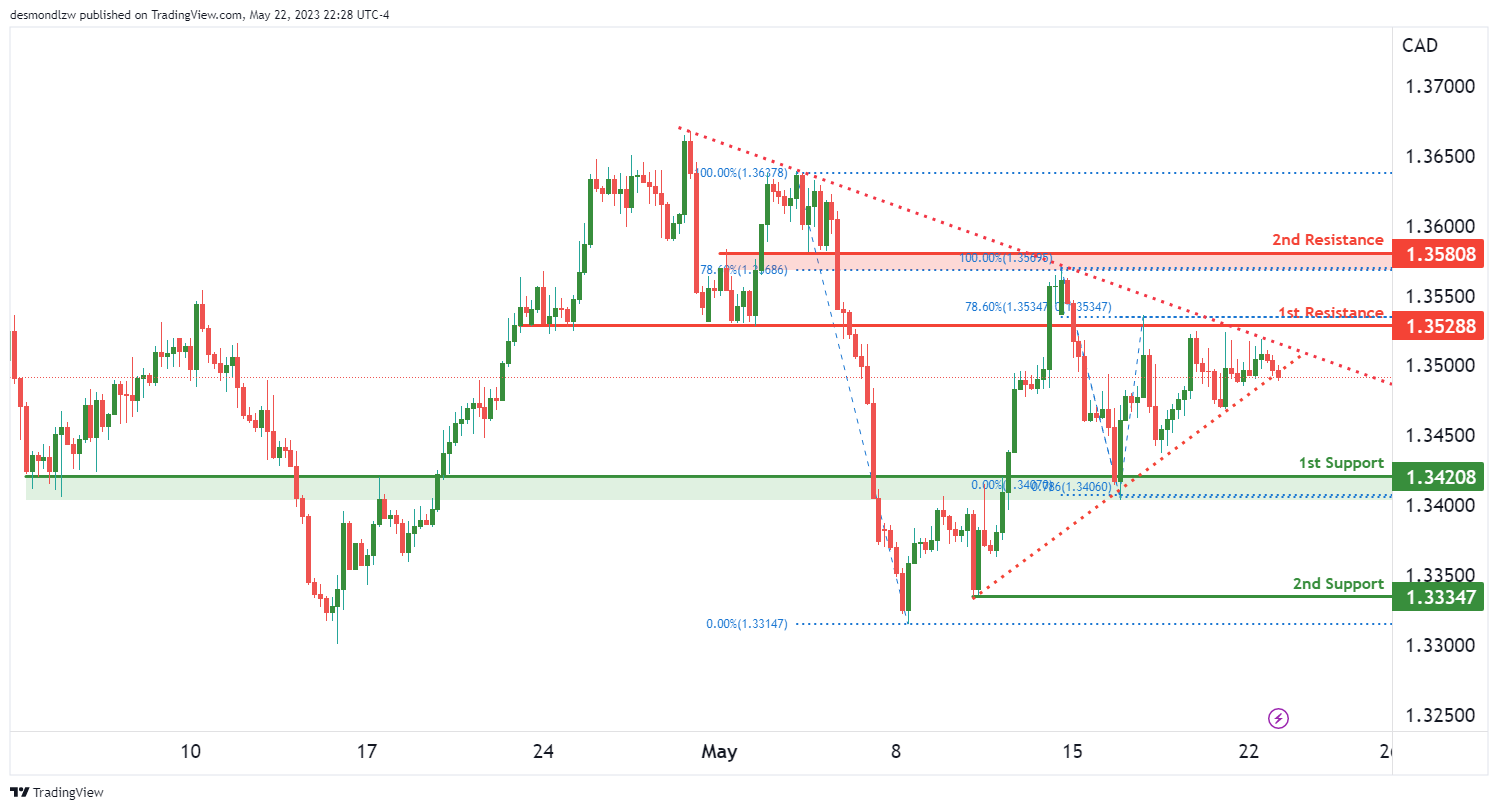
The USDCAD pair currently shows a neutral trend, with the possibility of price fluctuations between the first resistance and first support levels.
The first support level is found at 1.3420 and is considered an overlap support. Overlap supports have historically acted as both resistance and support, suggesting that this level could halt a price decline.
The second support level is at 1.3334, although the specific factors contributing to its significance have not been provided.
On the other hand, should the price increase, the first resistance level is at 1.3528. This level is recognized as an overlap resistance and aligns with the 78.6% Fibonacci retracement level, which could act as a significant barrier to price increases.
The second resistance level is at 1.3580, functioning as a swing high resistance and corresponding with the 78.6% Fibonacci retracement level. Swing high resistance levels are those that have capped price increases in the past, potentially indicating a reversal.
The chart presents a symmetrical triangle pattern, representing a period of consolidation before a breakout or breakdown occurs. A break above the upper trendline could signal a bullish breakout, whereas a break below the lower trendline might indicate a bearish breakdown.
DJ30:
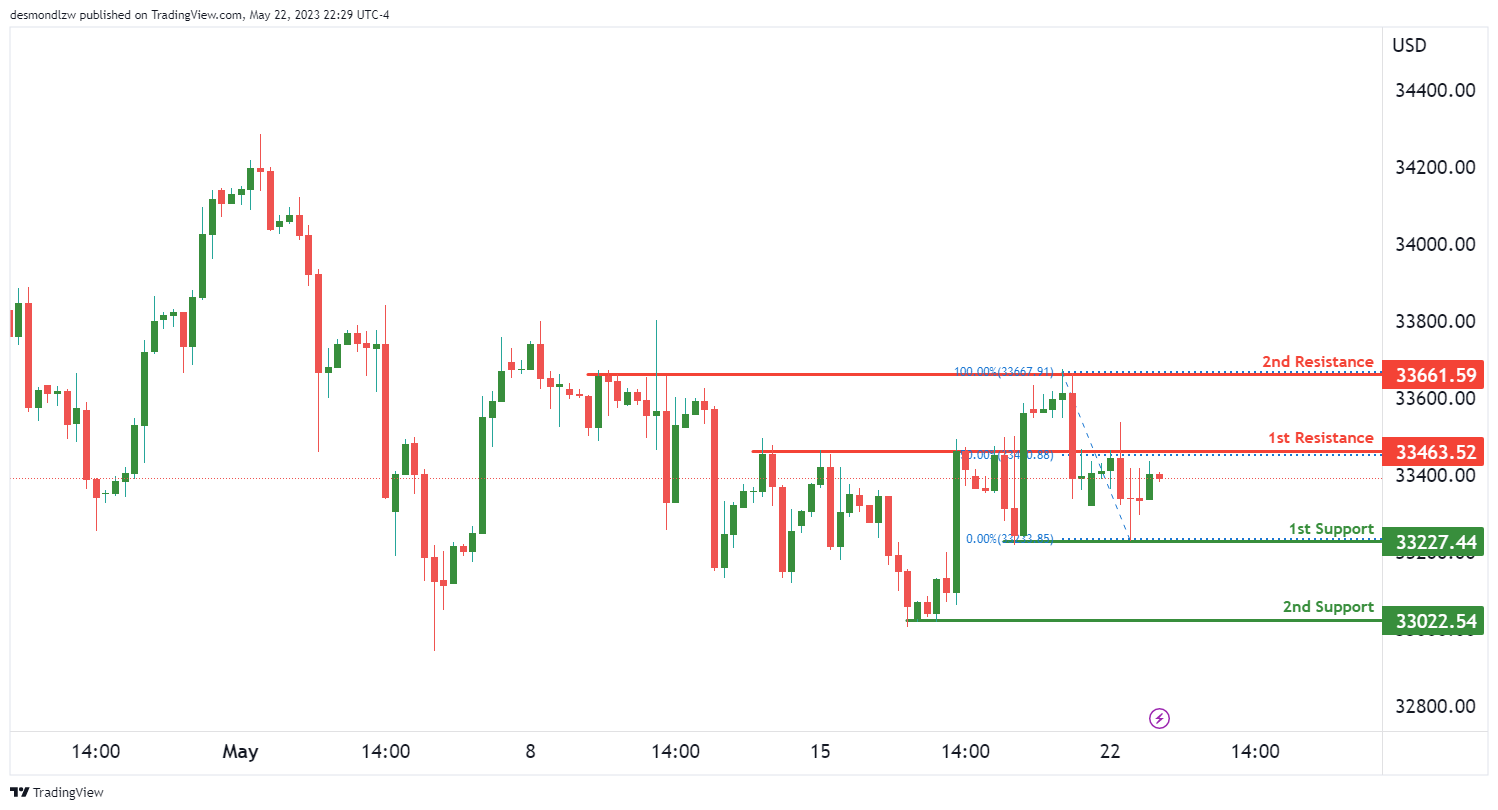
The DJ30 chart currently exhibits a weak bullish momentum with low confidence, indicating the potential for limited upward movement.
In the short term, there is a possibility of a bullish continuation towards the first resistance level at 33463.52.
The first support level at 33227.44 is identified as an overlap support, suggesting it could act as a price floor if the price were to decline.
Additionally, there is a second support level at 33022.54, recognized as an overlap support, providing further support in case of a price decline.
On the resistance side, the first resistance level at 33463.52 is an overlap resistance, which could present a barrier if the price attempts to rise.
There is also a second resistance level at 33661.59, identified as an overlap resistance, which adds to its significance in potentially restraining the price’s upward movement.
GER30:
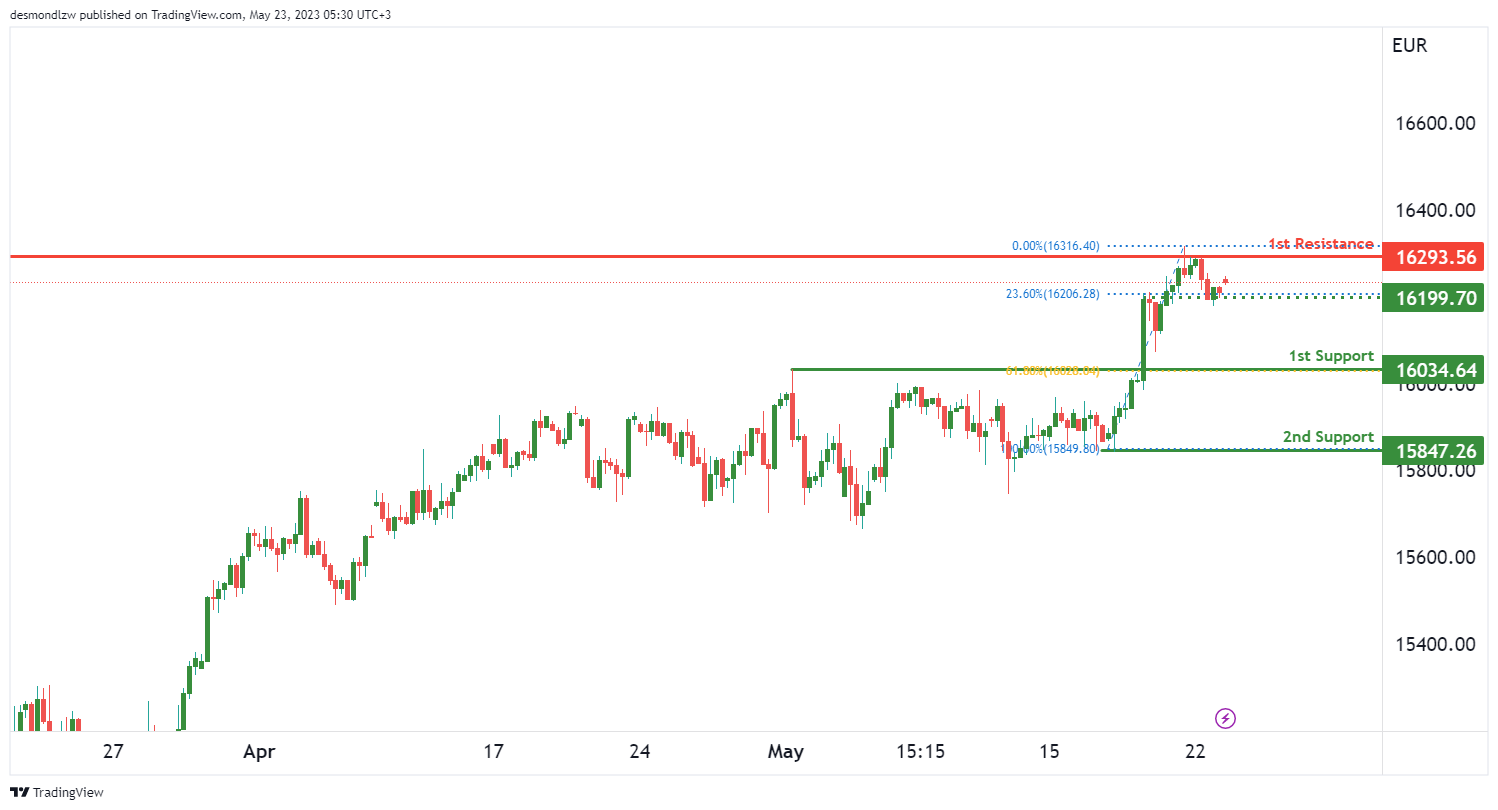
The GER30 chart currently shows a weak bullish momentum with low confidence, indicating the potential for limited upward movement.
In the short term, there is a possibility of a bullish continuation towards the first resistance level at 16293.56.
The first support level at 16034.64 is identified as an overlap support, suggesting it could act as a price floor if the price were to decline.
Additionally, there is a second support level at 15847.26, recognized as an overlap support, providing further support in case of a price decline.
There is also an intermediate support level at 16199.70, identified as an overlap support, which adds to its significance in providing potential price support.
On the resistance side, the first resistance level at 16293.56 is an overlap resistance, which could present a barrier if the price attempts to rise.
BTC/USD:
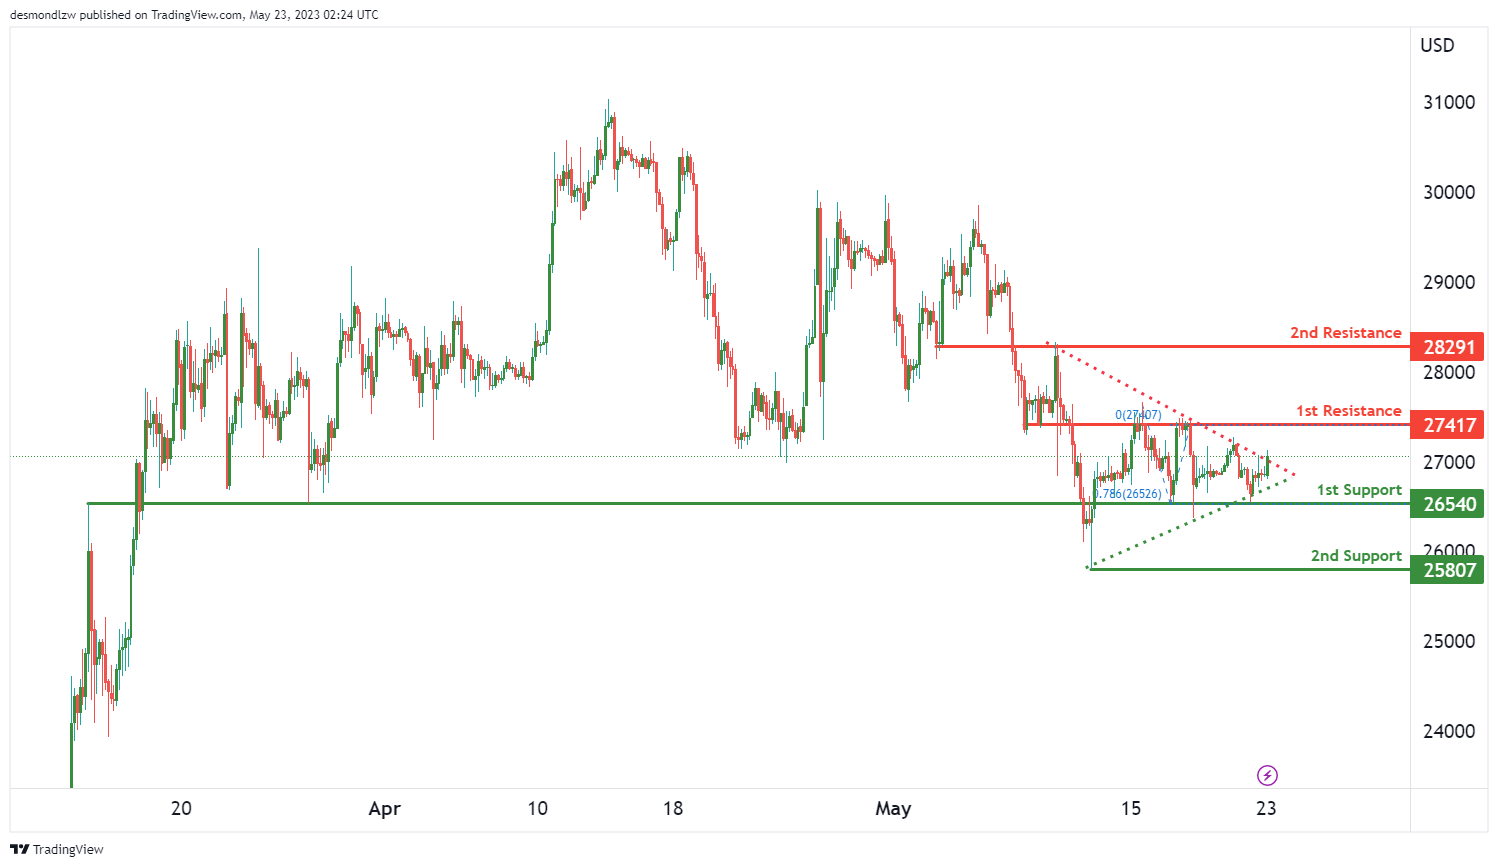
The BTC/USD pair is currently exhibiting a neutral trend, suggesting that price could oscillate between the first resistance and first support levels.
The first support level is established at 26540, and is classified as an overlap support, indicating it has served as both a resistance and support level in the past, which could halt a price drop.
The second support level is at 25807, serving as a swing low support. This is a price point where the price has historically rebounded, signifying it could potentially stop further price decline.
On the contrary, if the price increases, the first resistance level is located at 27417. This level is known as an overlap resistance, suggesting that it could act as a significant barrier to price increases.
The second resistance level stands at 28291 and is also an overlap resistance, implying it could resist further price ascension.
The chart also displays a symmetrical triangle pattern, which represents a period of consolidation before a breakout or breakdown. A break above the upper trendline could indicate a bullish breakout, while a break below the lower trendline might signal a bearish breakdown.
US500
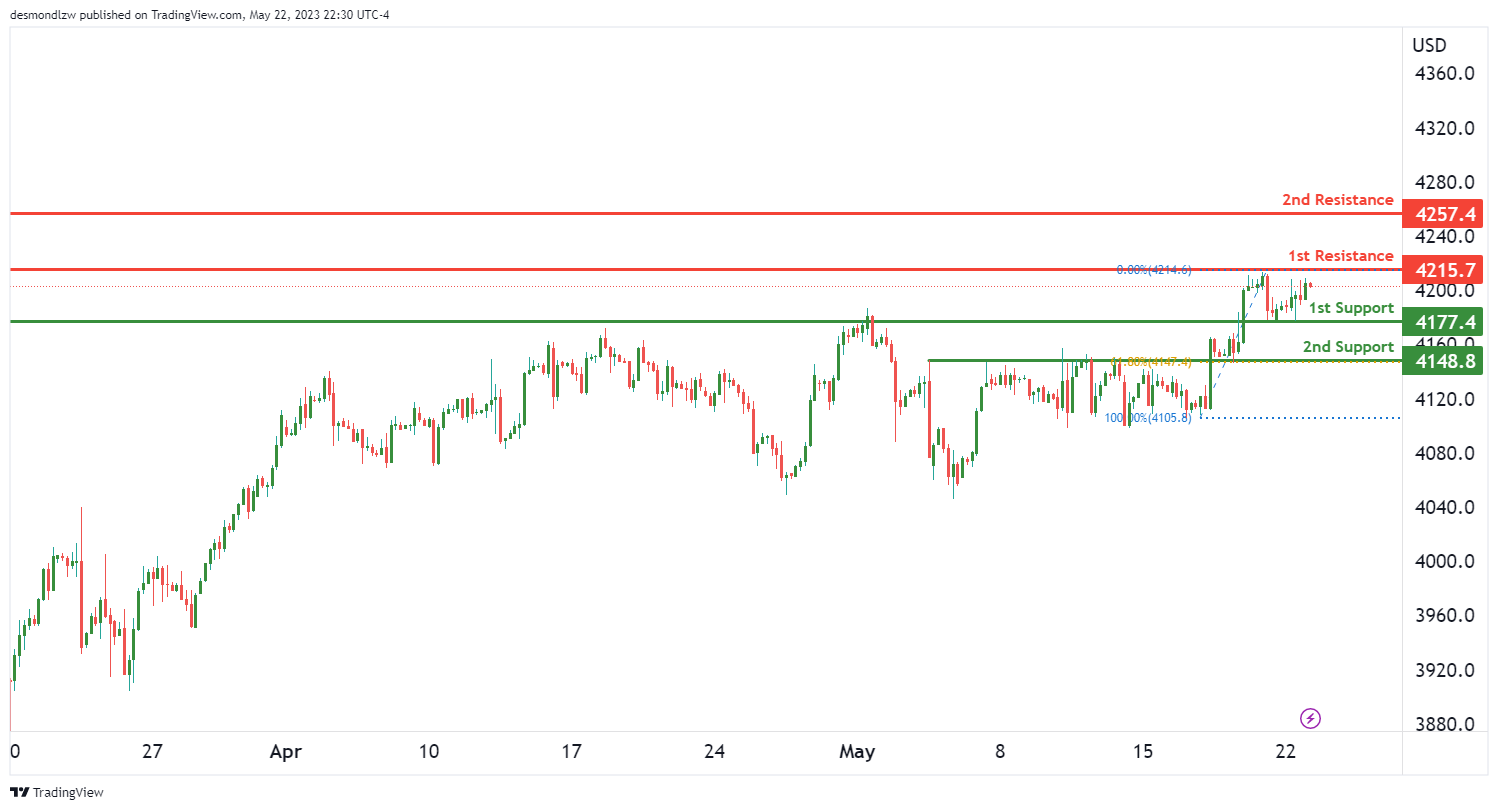
The US500 chart currently shows a weak bullish momentum with low confidence, suggesting the potential for limited upward movement.
In the short term, there is a possibility of a bullish continuation towards the first resistance level at 4215.70.
The first support level at 4177.40 is identified as an overlap support, indicating its significance as a potential price floor.
Additionally, there is a second support level at 4148.80, recognized as an overlap support, providing further support if the price were to decline.
On the resistance side, the first resistance level at 4215.70 is an overlap resistance, which could act as a barrier if the price attempts to rise.
There is also a second resistance level at 4257.40, identified as an overlap resistance.
ETH/USD:
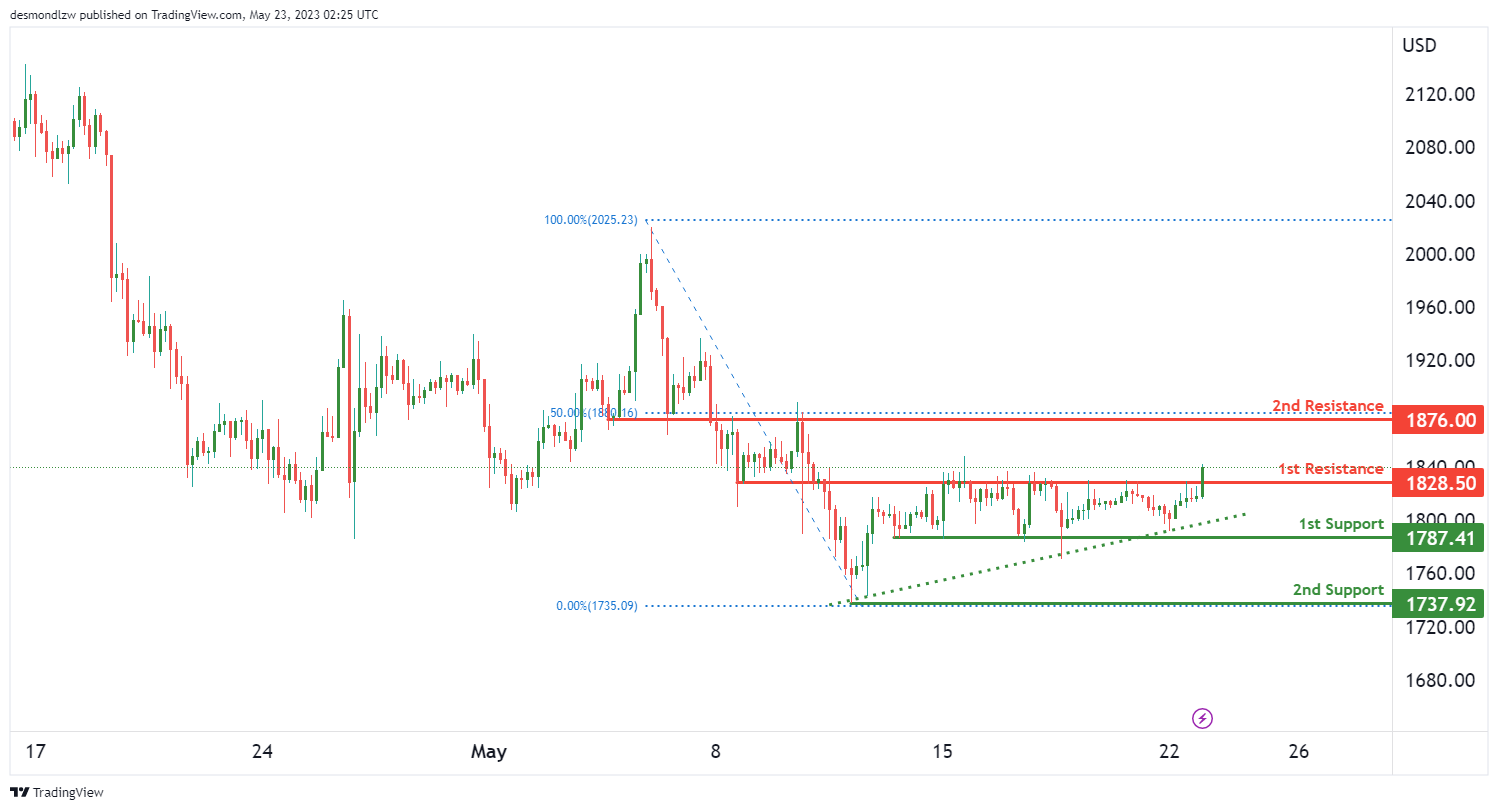
The ETH/USD pair is currently exhibiting a bullish trend, indicating that the price may continue to rise, potentially breaking through the first resistance level and advancing towards the second resistance level.
The first support level is situated at 1787.41, and is classified as an overlap support, demonstrating its previous role as both resistance and support, and its potential to halt a price drop.
The second support level is at 1737.92 and serves as a swing low support, a point where the price has historically rebounded, indicating it could potentially stop further price decline.
Conversely, if the price increases, the first resistance level stands at 1828.50. This level is an overlap resistance, suggesting it could act as a significant barrier to price increases.
The second resistance level is located at 1876.00 and is also classified as an overlap resistance, further supported by its alignment with the 50% Fibonacci retracement level, emphasizing its potential to impede further price ascension.
WTI/USD:
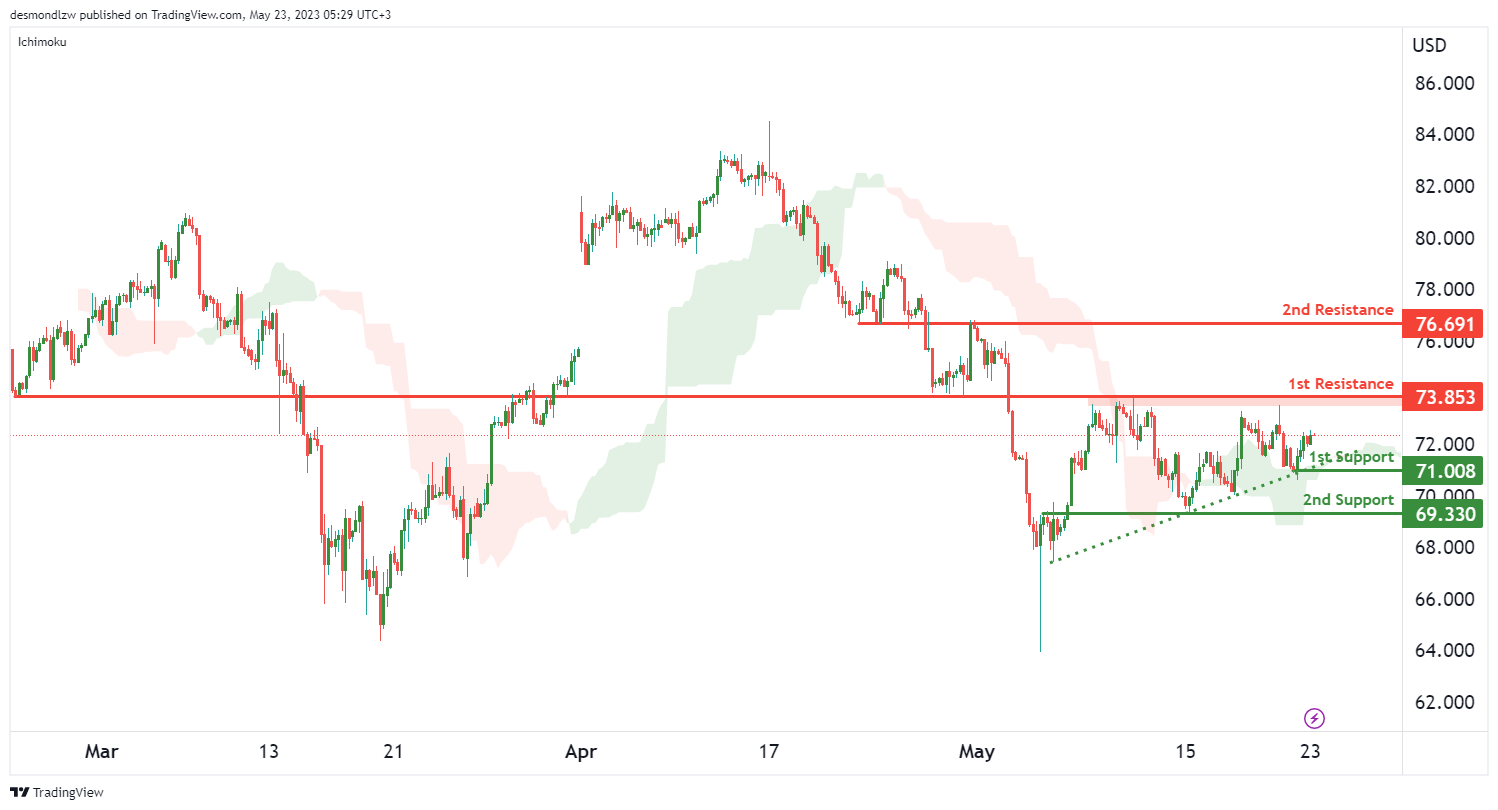
The WIT pair is currently displaying a bullish trend, suggesting that the price could potentially continue its upward trajectory towards the first resistance level. This bullish momentum is reinforced by the price being above a major ascending trend line and above the bullish Ichimoku cloud, two strong indicators of a possible continued upward movement.
The first support level is set at 71.00, acting as an overlap support, a price level that has functioned as both resistance and support in the past, and therefore may provide significant support to the price.
The second support level is located at 69.33, which is also classified as an overlap support, indicating it may serve as a robust barrier to a price decline.
Conversely, if the price continues to rise, the first resistance level stands at 73.85. This level functions as an overlap resistance, suggesting it could pose a challenge for the price to surpass.
Furthermore, the second resistance level is positioned at 76.69, which is also identified as an overlap resistance, emphasizing its potential to halt further price increases.
XAU/USD (GOLD):
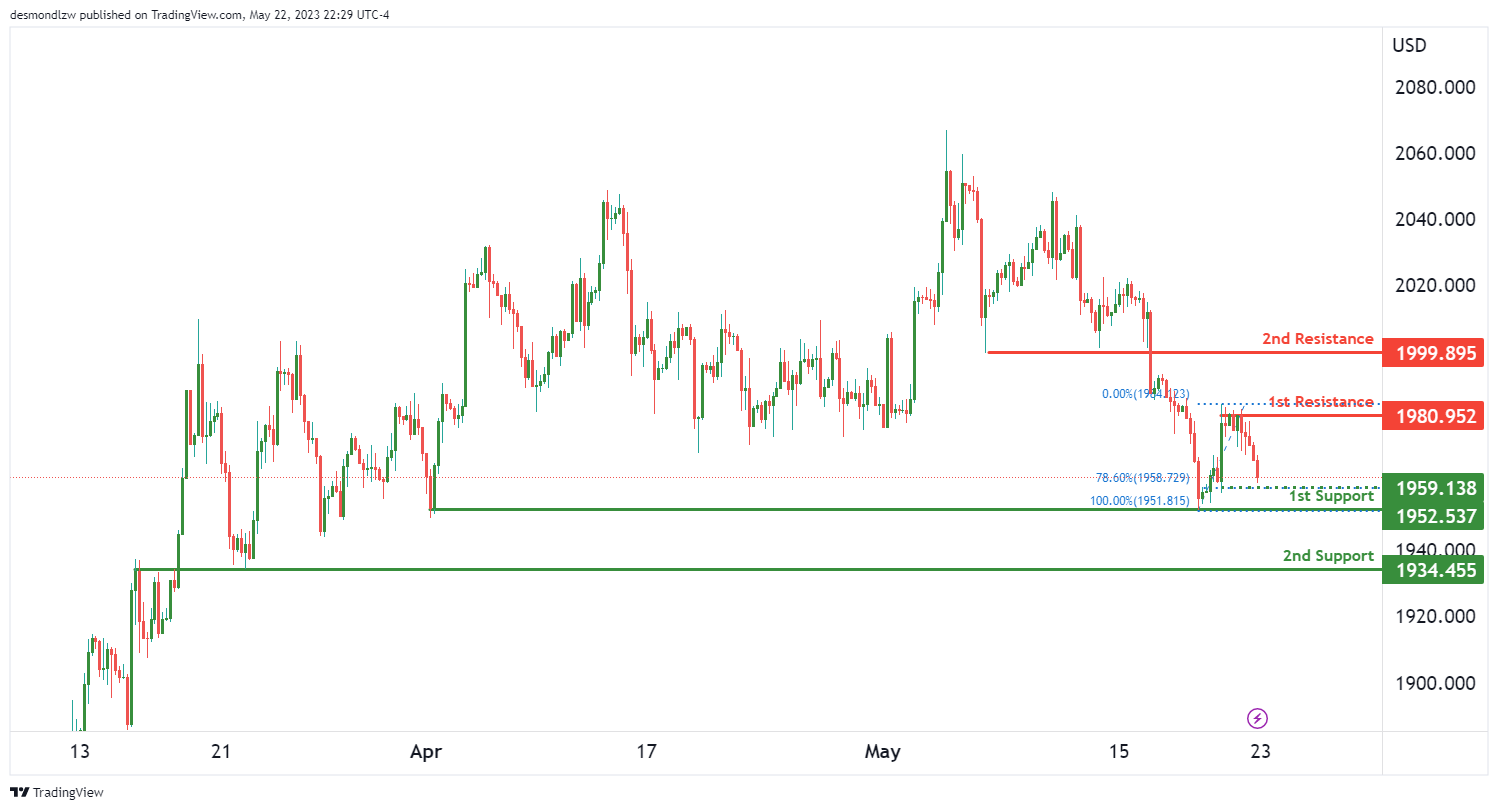
The XAU/USD pair is currently on a bearish trend, suggesting a potential further decline towards the first level of support.
The first support level is at 1952.53 and represents a multi-swing low support, indicating that it is a price point where the value has historically bottomed out multiple times, making it a strong potential support.
The second support level, located at 1934.45, is an overlap support, a level that has historically served as both resistance and support, providing a reliable cushion against further price drops.
Conversely, if the price reverses direction, the first resistance level stands at 1980.95, acting as a pullback resistance, a level where the price has previously rebounded following a brief retracement.
The second resistance level is at 1999.89 and is also identified as a pullback resistance, indicating its potential to halt further price increases.
In addition, there is an intermediate resistance level at 1959.13, which is significant due to its alignment with the 78.6% Fibonacci retracement level, a key level in market retracements.
USD/JPY Daily Outlook
Daily Pivots: (S1) 137.83; (P) 138.26; (R1) 139.02; More...
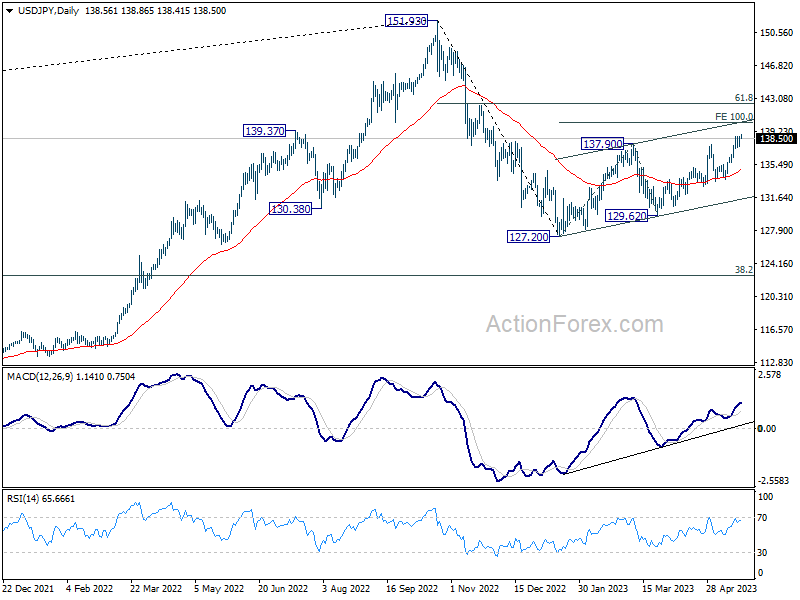
USD/JPY's rally is trying to resume with breach of 138.73 temporary top and intraday bias is back on the upside. Current rally from 127.20 should target 100% projection of 127.20 to 137.90 from 129.62 at 140.32. Break there will target 142.48 fibonacci level. On the downside, break of 137.41 minor support will turn intraday bias neutral again first, and bring more consolidation before staging another rise.
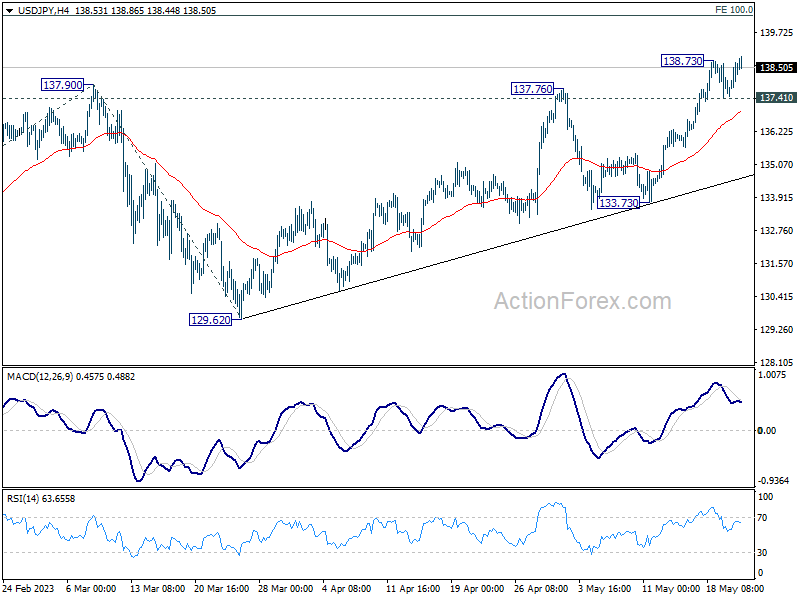
In the bigger picture, rise from 127.20 is seen as the second leg of the corrective pattern from 151.93 high. Stronger rally would be seen to 61.8% retracement of 151.93 to 127.20 at 136.34. Sustained break there will pave the way back to retest 151.93. On the downside, however, break of 133.73 support will argue that the pattern could have started the third leg through 127.20 low.
Forex Markets Stable, Focus Turns to Global PMI Data
In today's quiet Asian session, forex markets have largely stayed within a narrow range, with minimal response to positive PMI data from Australia and Japan. Yen has seen a slight recovery but continues to be the weakest performer of the week, followed closely by Sterling and Dollar. On the flip side, New Zealand Dollar remains the leader, with Swiss Franc and Aussie following, while Canadian and Euro are mixed.
Attention is now shifting to PMI data from Eurozone, UK, and US, set to be released later today. Even though these figures may not trigger significant market reactions, they will still offer some insights into how these economies are faring amidst prolonged global monetary policy tightening.
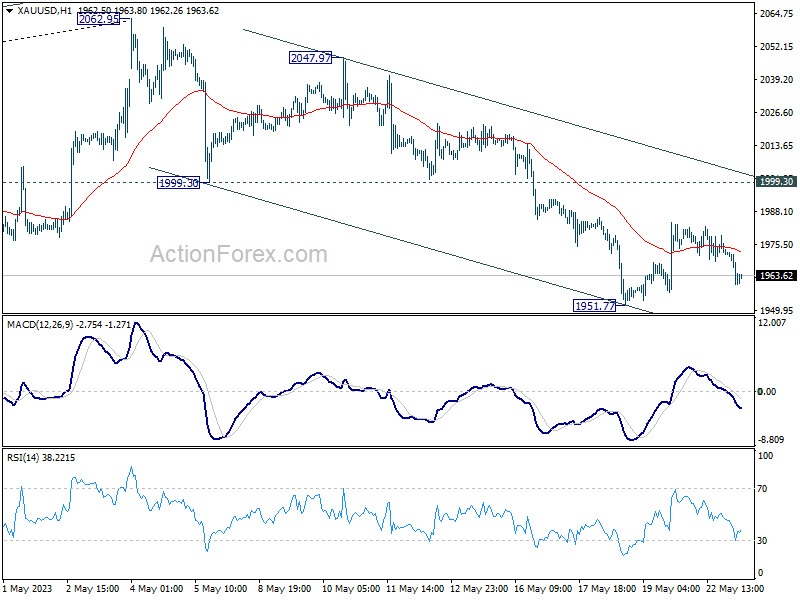
On the technical front, Gold has dipped notably in the Asian session, but it remains to be seen if the corrective recovery from 1951.77 has completed. Nevertheless, near-term outlook remains cautiously bearish, as long as 1999.30 support-turned-resistance continues to hold. Break below 1951.77 would resume the overall decline from 2062.95. If this occurs, a downside breakout in Gold could coincide with a drop below 1.0759 temporary low in Euro, signaling potential upside momentum in the greenback.
In Asia, at the time of writing, Nikkei is down -0.67%. Hong Kong HSI is down -0.58%. China Shanghai SSE is down -0.58%. Singapore Strait Times is up 0.35%. Japan 10-eyar JGB yield is up 0.0060 at 0.393. Overnight, DOW dropped -0.42%. S&P 500 rose 0.02%. NASDAQ rose 0.50%. 10-year yield rose 0.027 to 3.719.
Some Fed officials not prejudging June meeting
Fed Presidents Thomas Barkin of Richmond and Raphael Bostic of Atlanta shared their perspectives during an event hosted by the Richmond Fed.
Barkin didn't provide any conclusive hints about the June meeting, stating, "I'm not going to prejudge June. I'd like to be convinced of that and I'm still looking to be convinced of that."
Bostic emphasized the lag effect of the policy, adding, "Our policy works with a lag. And we're just at the very beginning of this time when that lag is starting to play out and you're starting to see tightness emerge. Right now, absent a big change, I think I will be comfortable saying let's just look and see how things play out."
Separately, San Francisco Fed President Mary Daly shared a similar sentiment of cautious observation, saying, "I really think, at this point in our tightening cycle, it is prudent to resist the temptation to say what we are going to do for the rest of the year."
The collective view indicates an element of uncertainty and data-dependency in Fed's next moves.
ECB's De Cos: Monetary tightening process well advanced but still have some way to go
During an event in Barcelona yesterday, ECB Governing Council Pablo Hernandez de Cos, said, "The process of monetary tightening is already well advanced, although, with the information currently available to us, we still have some way to go."
He further explained, "We also anticipate that interest rates will have to remain in restrictive territory for a long time to reach our target in a sustained manner."
Acknowledging the potential impact of this strategy on economic activity, de Cos pointed out, "The tightening process is having and will have short-term costs in terms of lower economic activity."
However, he underscored the necessity of this process in maintaining price stability, which he deemed crucial for promoting long-term economic growth.
"Keeping price stability is the main contribution that the central bank can make to ensure economic growth solid long term," he concluded.
Australia PMI composite dropped to 51.2, still early to call an end to RBA tightening
Australia's PMI Manufacturing index stayed put at 48.0 in May, marking the joint-lowest reading since May 2020. On the other hand, PMI Services fell from 53.7 to 51.8, causing Composite PMI to decrease from 53.0 to 51.2.
Warren Hogan, Chief Economic Advisor at Judo Bank, said, "The May Flash result shows a small retracement from the strong April outcome reinforcing the view that overall economic activity in Australia is holding up well as we enter the winter months."
Despite the manufacturing sector's continuous slowdown, Hogan emphasized that this does not signal a recession. In contrast to manufacturing, the services sector has shown recent strength, and was "far from the risk of recession:.
However, he warned of the implications of better economic conditions in terms of inflation. "The RBA is trying to engineer a soft landing to rid the economy of inflation. But if they don't lean hard enough on monetary policy, we could see a more stubborn inflation emerge which will ultimately require a bigger lift in interest rates," Hogan cautioned.
Highlighting the strong correlation between the pick-up in the services PMI, housing market, rising population growth, and job advertising, he concluded, "Last week's labour market data on employment and wages have bought the RBA some time, but the Flash PMIs highlight that it is still too early to call an end to the monetary policy tightening cycle."
Japan PMI manufacturing rose to 50.8, services rose to 56.3
Japan PMI Manufacturing rose from 49.5 to 50.8 in April, signalling the first improvement in operating conditions since October 2022. PMI Manufacturing Output rose from 47.9 to 51.9. PMI Services rose from 55.4 to 56.3. PMI Composite Output rose from 52.9 to 54.9.
Usamah Bhatti, Economist at S&P Global Market Intelligence, said:
"The Japanese private sector economy continued on an upward trajectory, as signalled by a further expansion in May. The rate of growth quickened from April to reach the strongest since October 2013 and the second-strongest in the survey history (since September 2007).
"Service providers continued to report strong growth momentum with a renewed record increase in business activity, while manufacturers indicated an improvement in operating conditions for the first time in seven months, with output and new orders returning to expansion territory for the first time since last June."
Looking ahead
Eurozone PMIs and UK PMIs are the main focuses in European session. Later in the day, Canada will release IPPI and RMPI. US will release PMIs and new homes sales.
USD/JPY Daily Outlook
Daily Pivots: (S1) 137.83; (P) 138.26; (R1) 139.02; More...
USD/JPY's rally is trying to resume with breach of 138.73 temporary top and intraday bias is back on the upside. Current rally from 127.20 should target 100% projection of 127.20 to 137.90 from 129.62 at 140.32. Break there will target 142.48 fibonacci level. On the downside, break of 137.41 minor support will turn intraday bias neutral again first, and bring more consolidation before staging another rise.
In the bigger picture, rise from 127.20 is seen as the second leg of the corrective pattern from 151.93 high. Stronger rally would be seen to 61.8% retracement of 151.93 to 127.20 at 136.34. Sustained break there will pave the way back to retest 151.93. On the downside, however, break of 133.73 support will argue that the pattern could have started the third leg through 127.20 low.
Economic Indicators Update
| GMT | Ccy | Events | Actual | Forecast | Previous | Revised |
|---|---|---|---|---|---|---|
| 23:00 | AUD | Manufacturing PMI May P | 48 | 48 | ||
| 23:00 | AUD | Services PMI May P | 51.8 | 53.7 | ||
| 00:30 | JPY | Manufacturing PMI May P | 50.8 | 49.5 | ||
| 06:00 | GBP | Public Sector Net Borrowing (GBP) Apr | 17.5B | 20.7B | ||
| 07:15 | EUR | France Manufacturing PMI May P | 46.1 | 45.6 | ||
| 07:15 | EUR | France Services PMI May P | 54.3 | 54.6 | ||
| 07:30 | EUR | Germany Manufacturing PMI May P | 45.2 | 44.5 | ||
| 07:30 | EUR | Germany Services PMI May P | 55.5 | 56 | ||
| 08:00 | EUR | Eurozone Manufacturing PMI May P | 46.2 | 45.8 | ||
| 08:00 | EUR | Eurozone Services PMI May P | 55.6 | 56.2 | ||
| 08:00 | EUR | Current Account (EUR) Mar | 20.2B | 24.3B | ||
| 08:30 | GBP | Manufacturing PMI May P | 48.2 | 47.8 | ||
| 08:30 | GBP | Services PMI May P | 55.5 | 55.9 | ||
| 12:30 | CAD | Industrial Product Price M/M Apr | 0.20% | 0.10% | ||
| 12:30 | CAD | Raw Material Price Index Apr | 0.70% | -1.70% | ||
| 13:45 | USD | Manufacturing PMI May P | 50 | 50.2 | ||
| 13:45 | USD | Services PMI May P | 53.6 | 53.6 | ||
| 14:00 | USD | New Home Sales Apr | 665K | 683K |