Sample Category Title
USD Continues to Bounce
EUR/USD struggles for bids
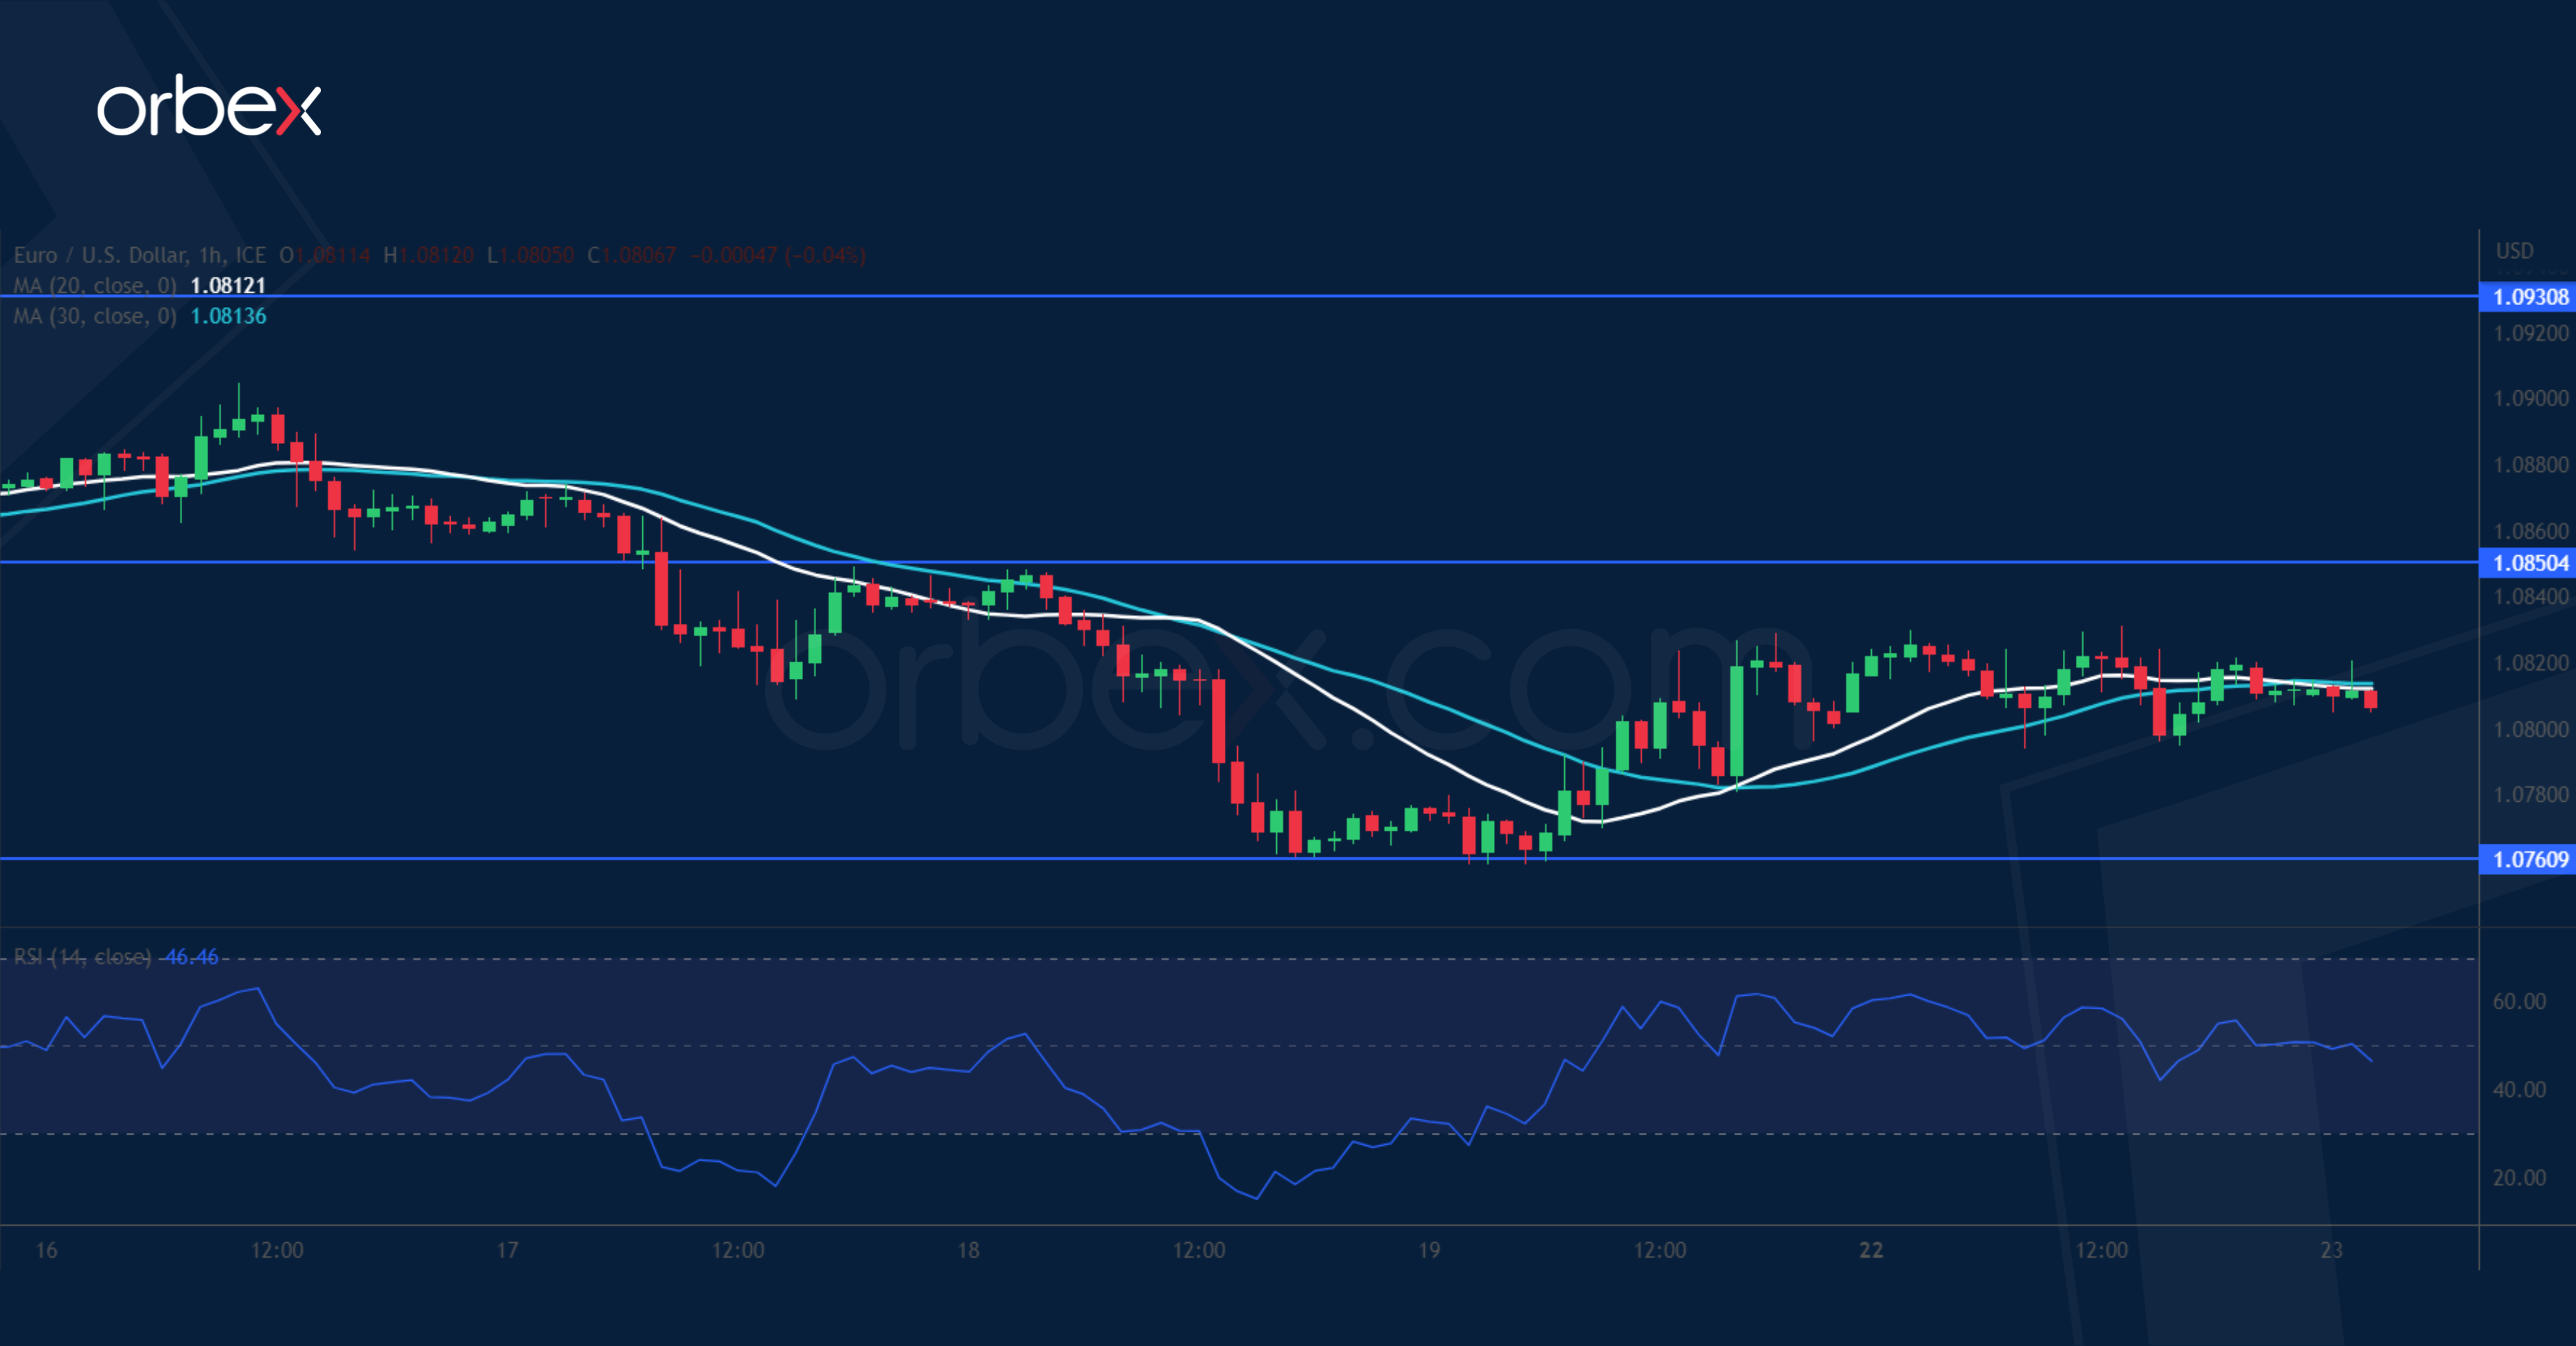
The US dollar inched higher after the St. Louis Fed president called for another half-point hike. A bearish MA cross on the daily chart indicates waning buying pressure as the euro strives to preserve its gains from the past two months. A break below 1.0850 may have prompted more buyers to bail and sit on the sidelines, turning it into a fresh resistance. The RSI’s oversold situation attracted some bottom buyers with 1.0760 as an immediate support, its breach may trigger a new round of sell-off, sending the exchange rate to 1.0700.
US Oil awaits breakout
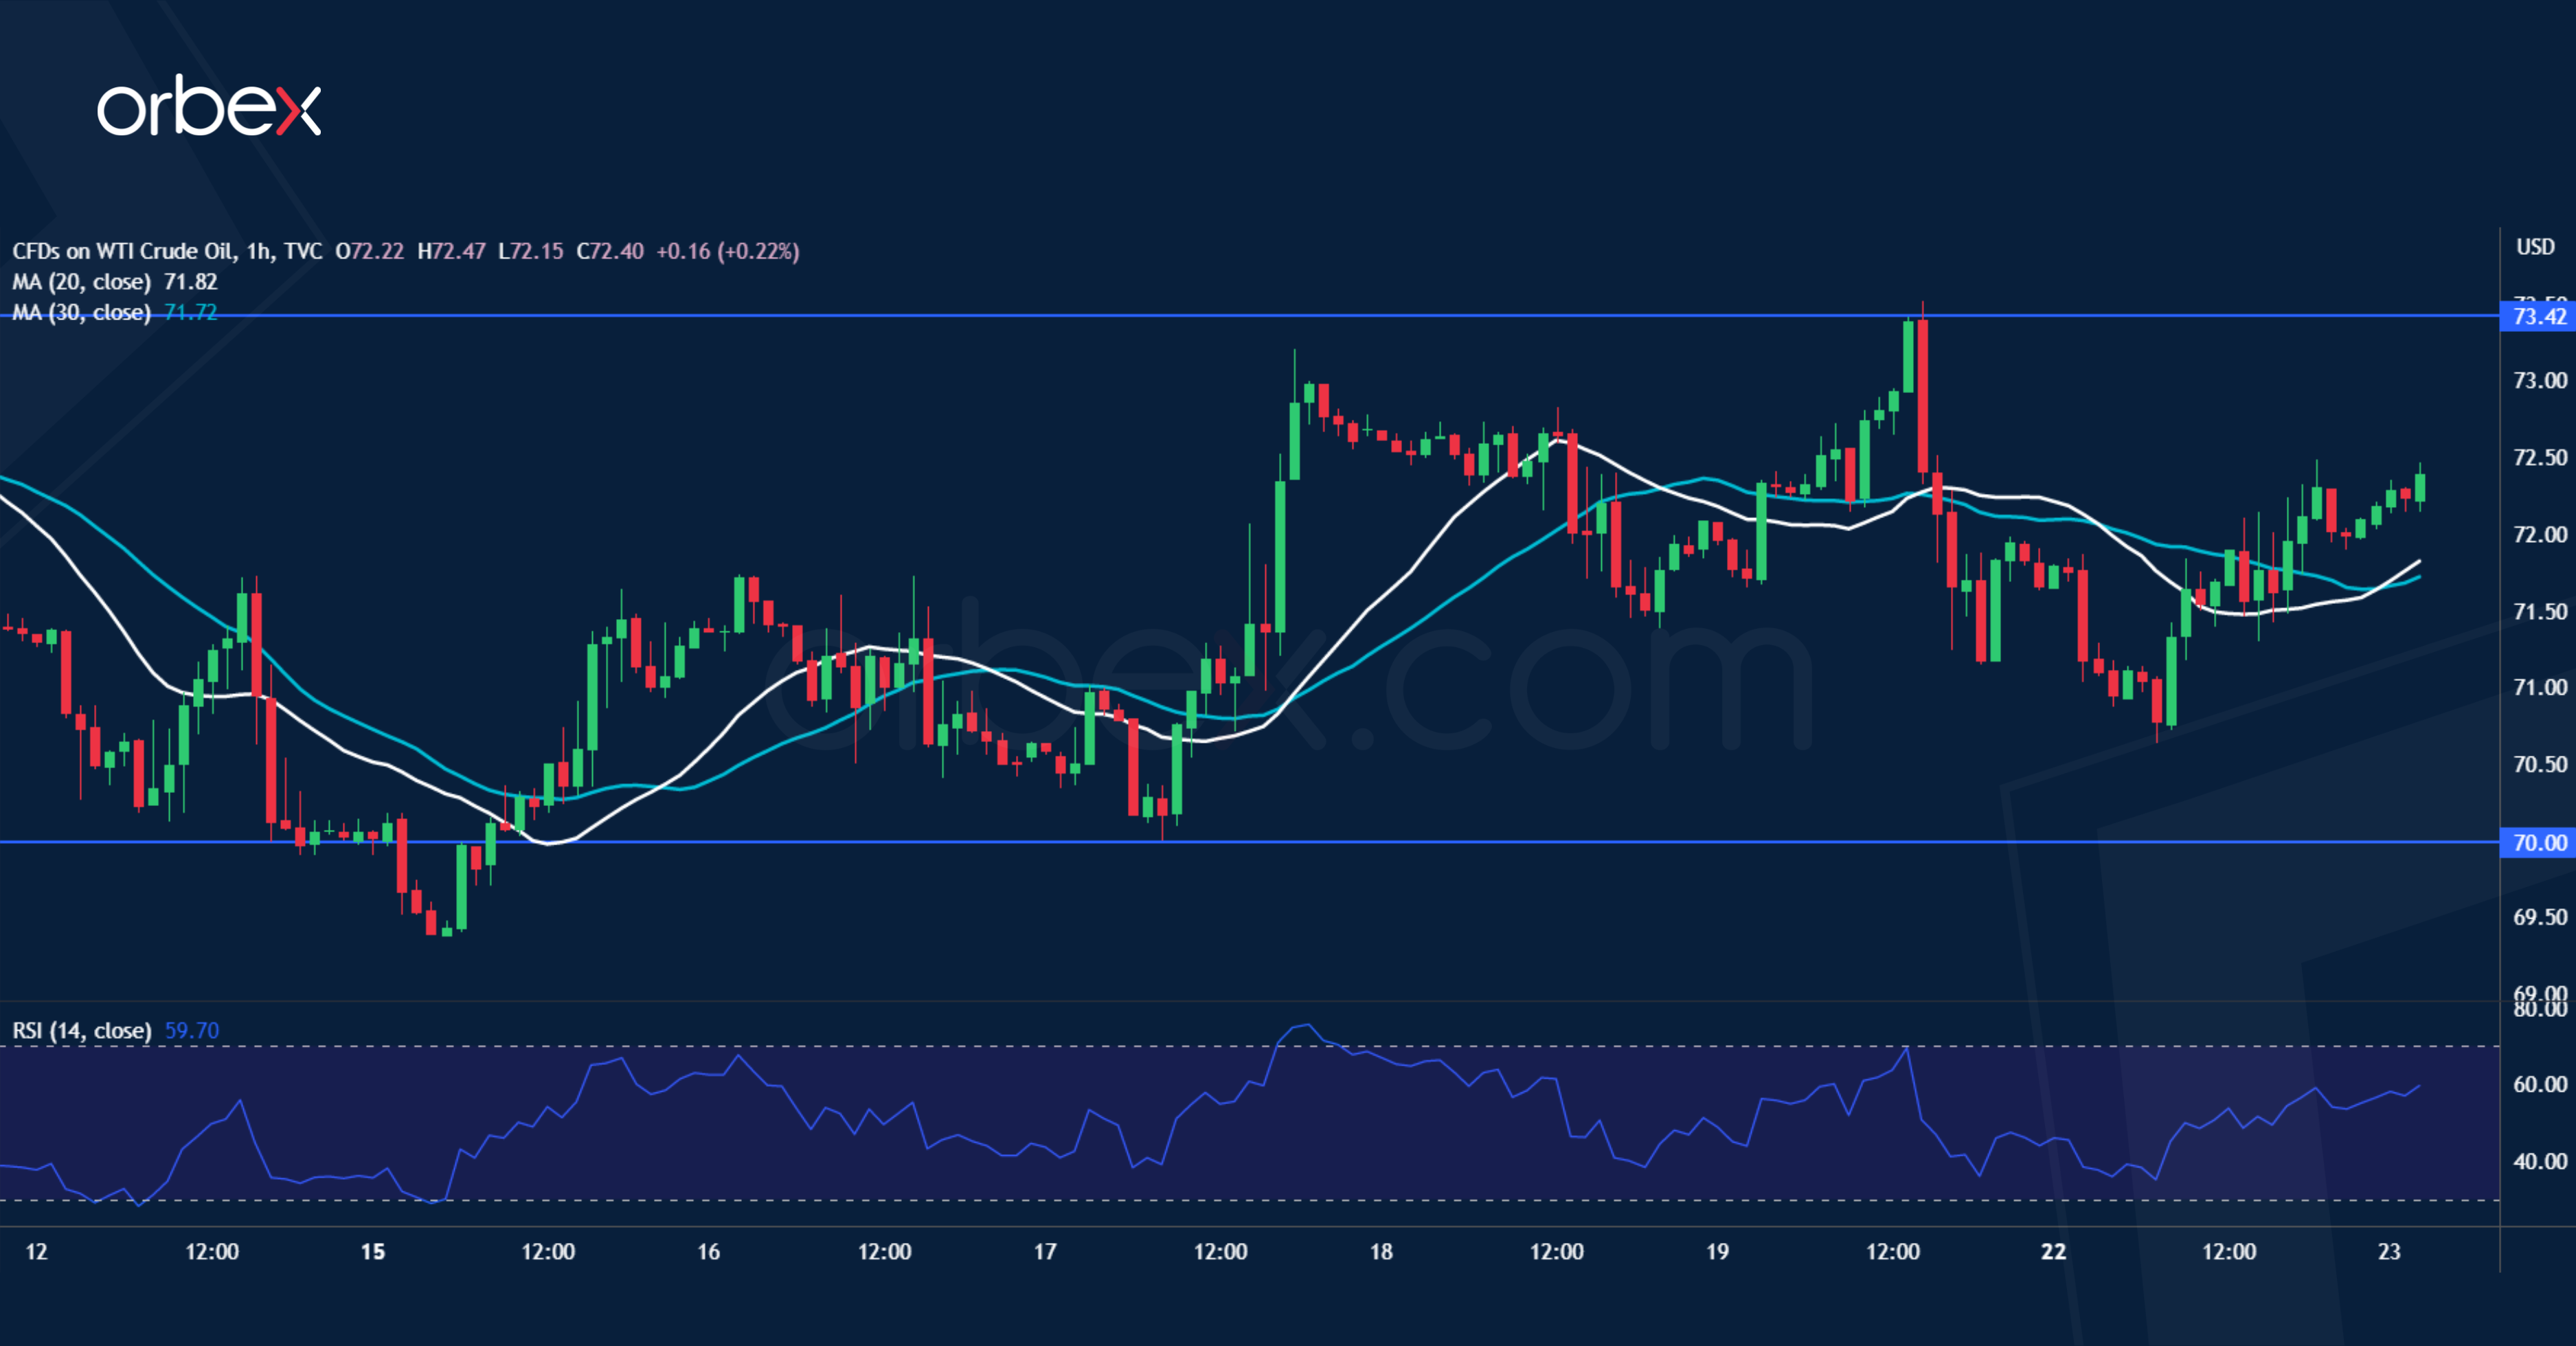
WTI crude rebounds as supply tightens with the OPEC+ production cuts going into effect this month. The bulls are still trying to keep the latest bounce off 66.00 valid and the sideways action is a sign of hesitation as both sides look to regain control. 73.40 on the 20-day SMA is the first resistance and a bullish breakout would lead to a test of 76.00 which coincides with the 30-day SMA, foreshadowing a potential recovery. On the downside, a slip below 70.00 would flush out buyers and expose the recent bottom at 66.00.
US 30 attempts to rebound
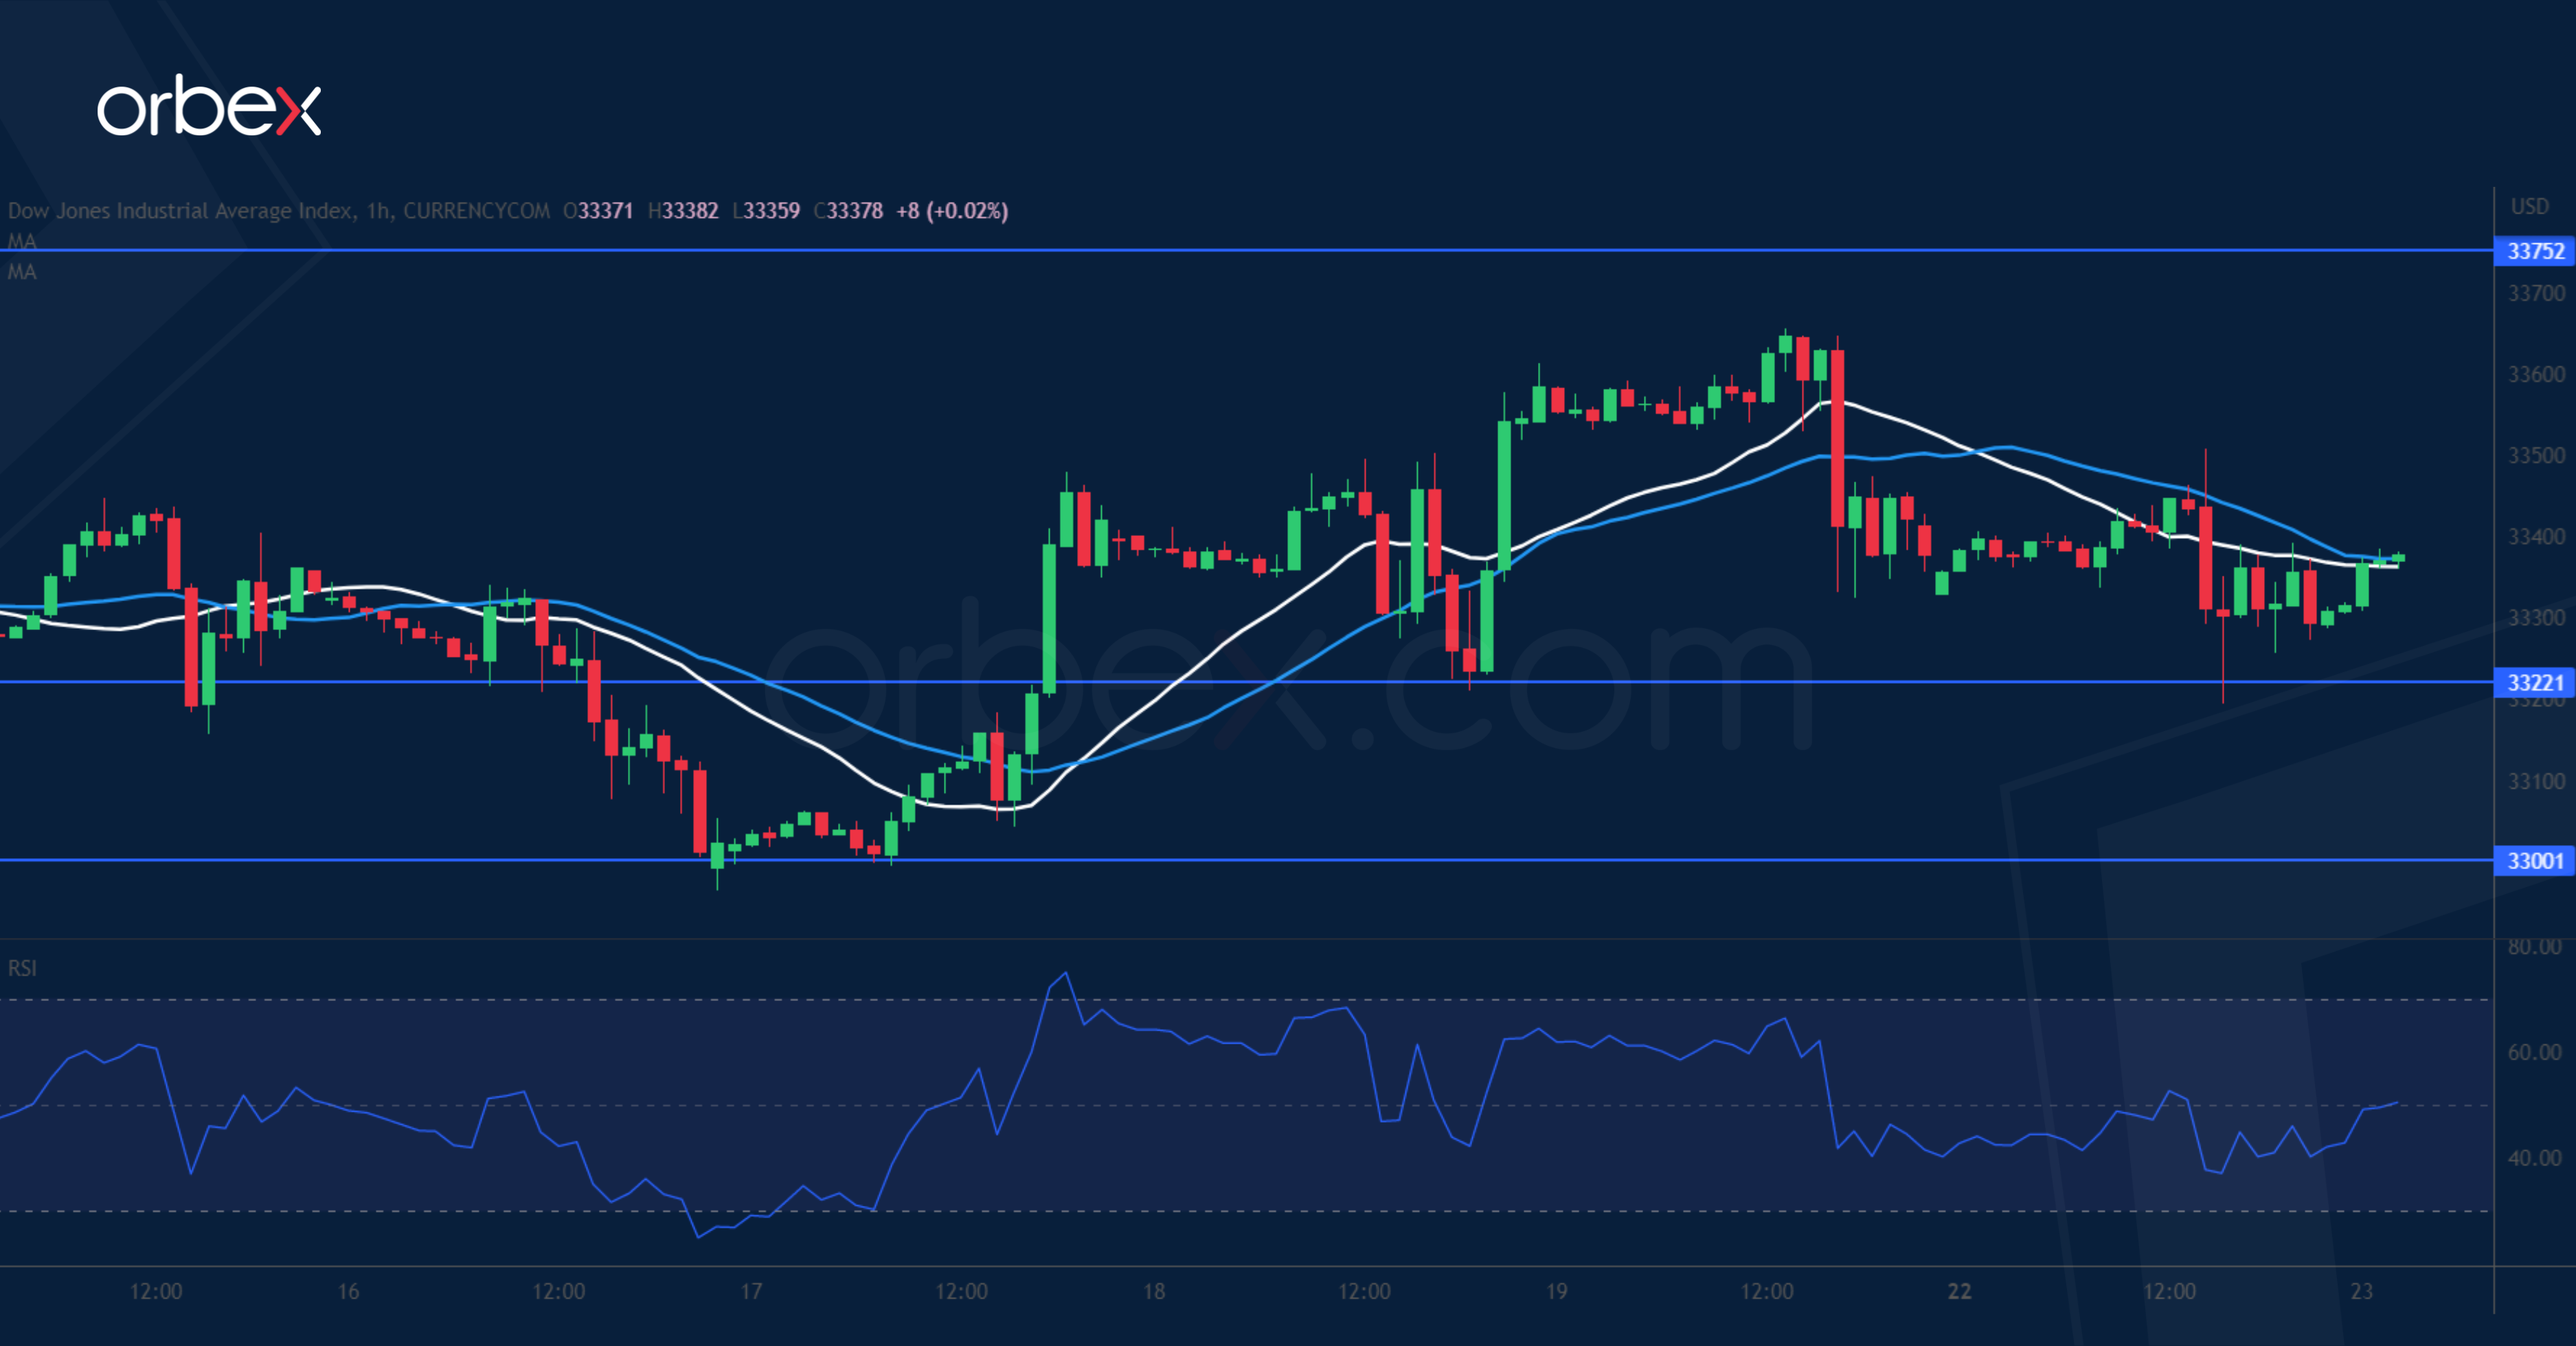
The Dow Jones 30 weakened after a slew of hawkish comments from Fed officials. The index is struggling to secure a solid footing after bouncing off the psychological level of 33000. While successive breaks above 33450 and 33600 had led short-term sellers to cover and eased the downward pressure, the failure to lift offers around the triple-tested 33750 is a sign of weakness as only its breach would signal a turnaround. A tentative break below 33220 would cause a retest of 30000, potentially triggering a deeper correction.
Markets Gripped by US Debt Ceiling Talks
Asian markets gave up earlier gains on Tuesday as investors adopted a cautious stance after US debt ceiling negotiations ended "productive talks" without a deal. However, President Joe Biden and House Speaker Kevin McCarthy both expressed optimism about reaching a breakthrough to avoid a default. European futures are pointing to a positive open ahead of the preliminary PMI figures for the eurozone in May. Wall Street closed mixed and remains influenced by the US debt ceiling developments. In the currency space, the dollar crept higher drawing strength from hawkish Federal officials while gold fell for a second day amid hints of progress towards avoiding a US default.
Big week for USD
The dollar could be injected with fresh volatility this week due to the US debt limit negotiations, Fed minutes, and top-tier US economic data.
Dollar bulls were able to draw support in the previous session from the productive US debt limit talks and hawkish comments from Fed officials. Midweek, all eyes will be on the minutes from the May FOMC meeting which could offer more clues about the central bank's next move. After proceeding with a 25-basis point hike in May, the Fed signalled a potential pause. It will be interesting to see what the minutes show in regard to the thinking of policymakers and how united they were around the idea of 5.25% being the peak level of rates. Of course, we have heard from a slew of Fed officials since the meeting which could make the minutes relatively stale.
On the data front, much focus will be on the Fed’s preferred inflation gauge, the Core Personal Consumption Expenditure (PCE) scheduled to be released on Friday. The April PCE report is forecast to show headline prices rising 0.3% month-over-month after March’s 0.1% increase, while the core PCE deflator is projected to rise 0.3%, the same as March. The core personal consumption expenditures price index is seen rising 4.6% year-over-year, the same as seen in March. Any further evidence of cooling inflationary pressures may reinforce the argument around the Fed pausing and eventually cutting interest rates later in 2023.
Currency spotlight – GBP/USD
GBPUSD could see more weakness if the pending UK inflation data on Wednesday shows signs of cooling inflationary pressures. Markets forecast inflation cooling to 8.2% in April, down from the 10.1% in March. If expectations match reality, this would be the sharpest decline in more than 30 years, bringing an end to seven consecutive months of double-digit inflation. Looking at the technical picture, GBPUSD may slip towards 1.2370 on expectations around the BoE potentially pausing rate hikes. A solid breakdown below 1.2370 could signal a further selloff towards 1.2280. If prices push back above 1.2450, bulls may target 1.2550.
Commodity spotlight – Gold
Gold prices got no love on Tuesday morning, shedding 0.5% as optimism over the US debt ceiling developments dampened its allure. This promises to be another volatile week for the precious metal thanks to the cocktail of risk events and economic releases. If US debt talks continue to head in the right direction and hopes continue to rise over a deal reached, this could drag prices lower as risk appetite returns. Expect gold to also be influenced by the Fed minutes and key US data including the inflation report on Friday. Focusing on the technicals, sustained weakness below $1970 may open a path toward $1945 and $1900 respectively. Bulls need to claw their way back above $2000 to get back into the game.
GBP/JPY Daily Outlook
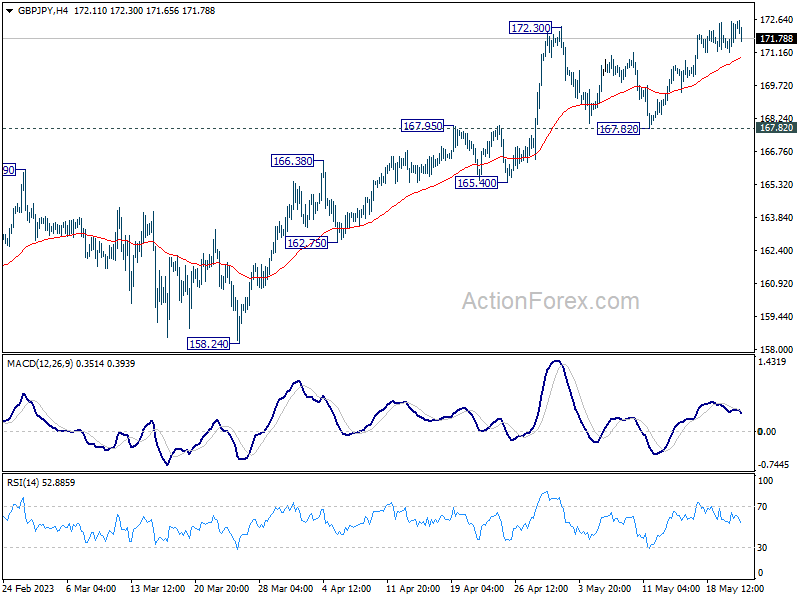
Daily Pivots: (S1) 171.52; (P) 172.05; (R1) 172.90; More...
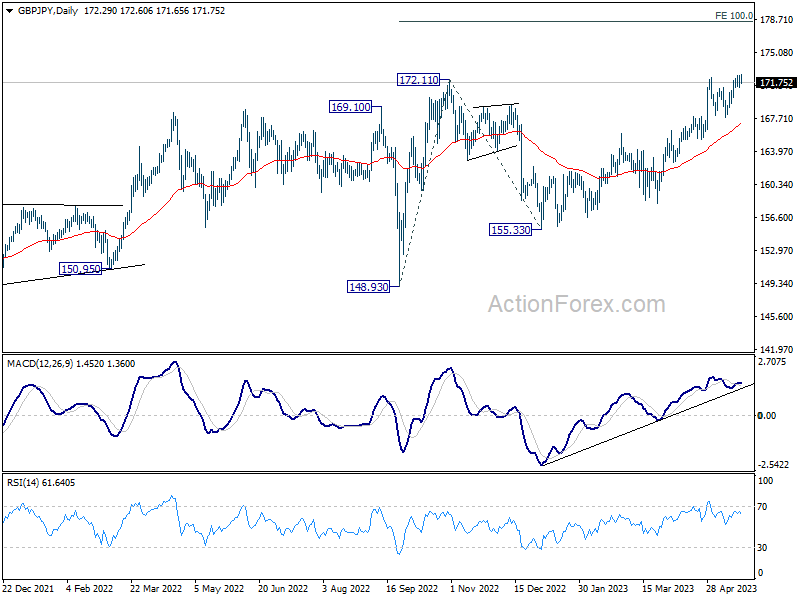
GBP/JPY's rally is still in progress, as part of the larger up trend, and should target 100% projection of 148.93 to 172.11 from 155.33 at 178.51. Nevertheless, firm break of 167.82 support should confirm short term topping, and turn bias back to the downside for deeper pull back to 165.40 support and possible below instead.
In the bigger picture, focus stays on 172.11 resistance (2022 high). Decisive break there will resume whole up trend from 123.94 (2020 low). Next target will be 161.8% projection of 122.75 (2016 low) to 156.59 (2018 high) from 123.94 at 178.69. Nevertheless, firm break of 165.40 support will indicate rejection by 172.11 and extend the corrective pattern from there with another falling leg.
EUR/JPY Daily Outlook
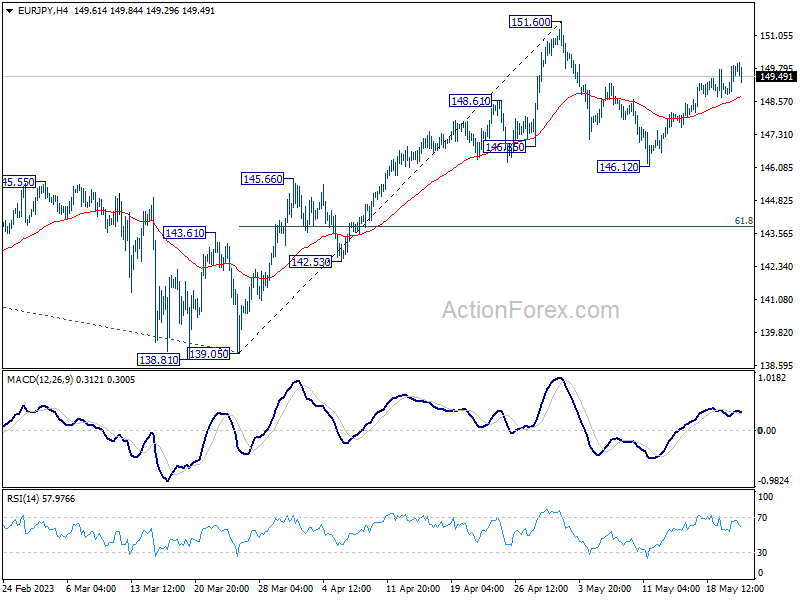
Daily Pivots: (S1) 149.15; (P) 149.54; (R1) 150.23; More....
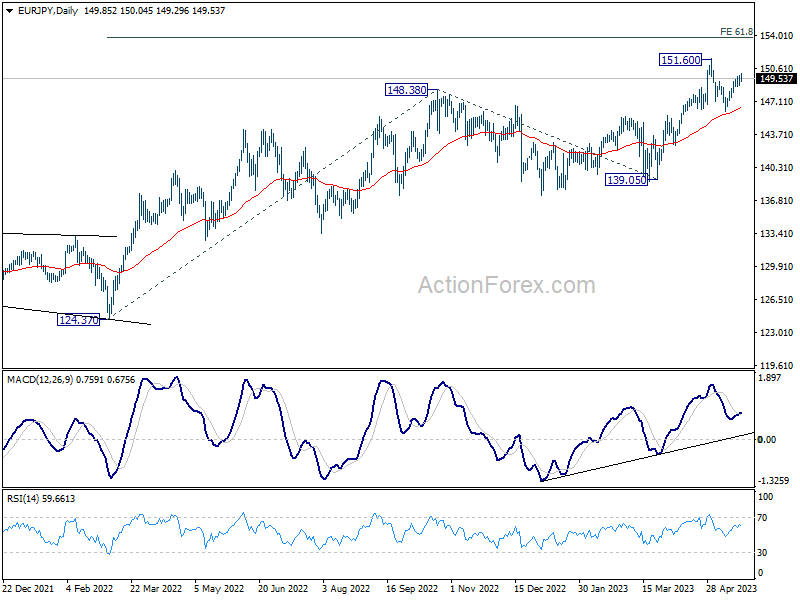
EUR/JPY's rebound from 146.12 is still in progress. Further rise could be seen for retesting 151.60 high. Decisive break there will resume larger up trend. On the downside, however, break of 146.12 will resume the fall to 61.8% retracement of 139.05 to 151.60 at 143.84.
In the bigger picture, rise from 114.42 (2020 low) is in progress. Next target is 61.8% projection of 124.37 to 148.38 from 138.81 at 153.64. Sustained break there will pave the way to 100% projection at 162.82. For now, medium term outlook will remain bullish as long as 139.05 support holds, even in case of deep pull back.
EUR/GBP Daily Outlook
Daily Pivots: (S1) 0.8681; (P) 0.8692; (R1) 0.8706; More...
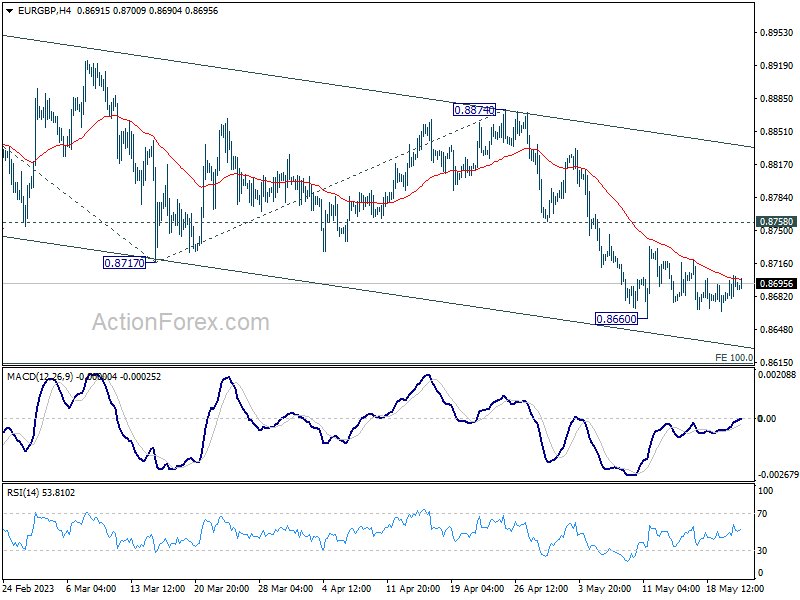
EUR/GBP is staying in consolidation from 0.8660 and intraday bias remains neutral. Further decline is expected as long as 0.8758 resistance holds. On the downside, break of 0.8660 will resume recent decline from 0.8977 to 100% projection of 0.8977 to 0.8717 from 0.8874 at 0.8614. Nevertheless, break of 0.8758 minor resistance will turn bias back to the upside for stronger rebound.
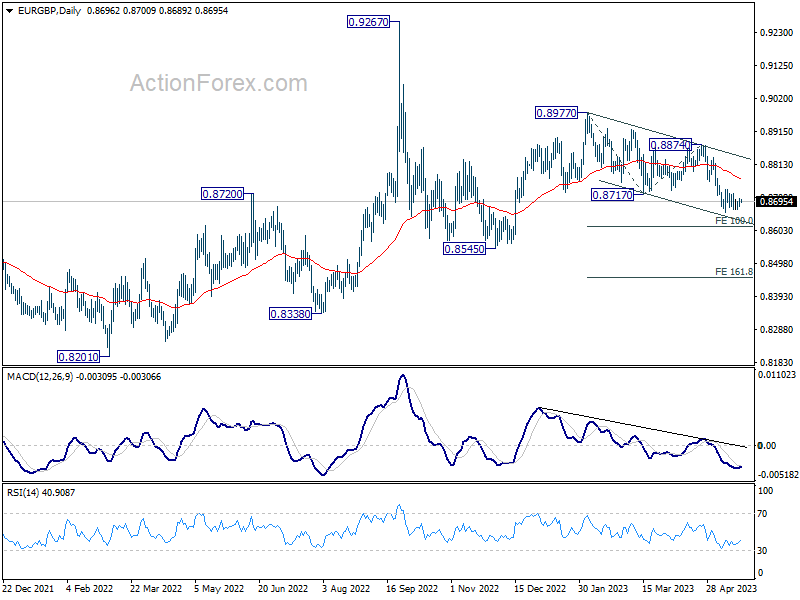
In the bigger picture, current development argues that whole decline from 0.9267 (2022 high) is still in progress. This is part of the long term range pattern from 0.9499 (2020 high). Deeper fall would be seen through 0.8545 support. This will now remain the favored case as long as 0.8874 resistance holds.
EUR/AUD Daily Outlook
Daily Pivots: (S1) 1.6224; (P) 1.6268; (R1) 1.6299; More...
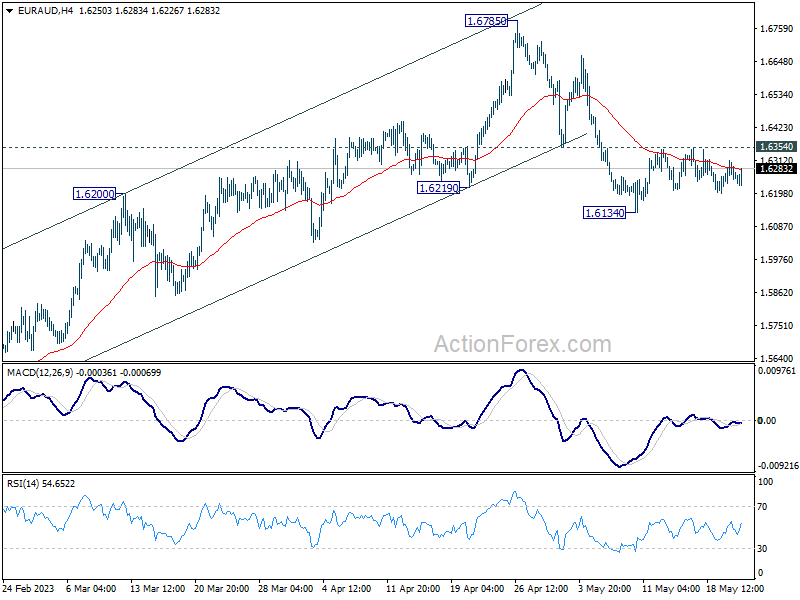
Range trading continues in EUR/AUD and intraday bias remains neutral. Fall from 1.6785 might be a correction to whole up trend from 1.4281. Break of 1.6134 will target 38.2 retracement of 1.4281 to 1.6785 at 1.5828, which is inside 1.5254/5976 support zone. Nevertheless, sustained break of 1.6354 minor resistance will turn bias back to the upside for retesting 1.6785 high instead.
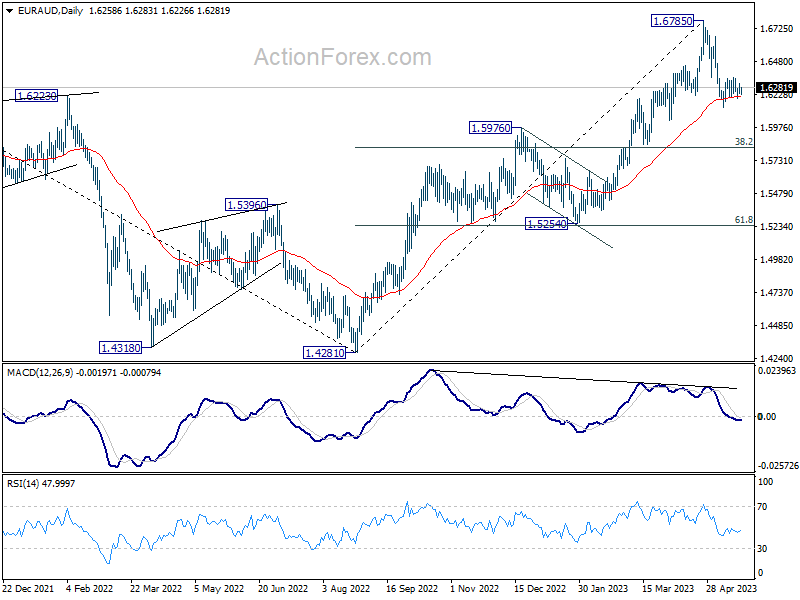
In the bigger picture, whole down trend from 1.9799 (2020 high) should have completed at 1.4281 (2022 low). Further rise should be seen to 61.8% retracement of 1.9799 to 1.4281 at 1.7691 next. For now, outlook will stay bullish as long as 1.5976 resistance turned support holds, even in case of deep pull back.
EUR/CHF Daily Outlook
Daily Pivots: (S1) 0.9681; (P) 0.9703; (R1) 0.9729; More...
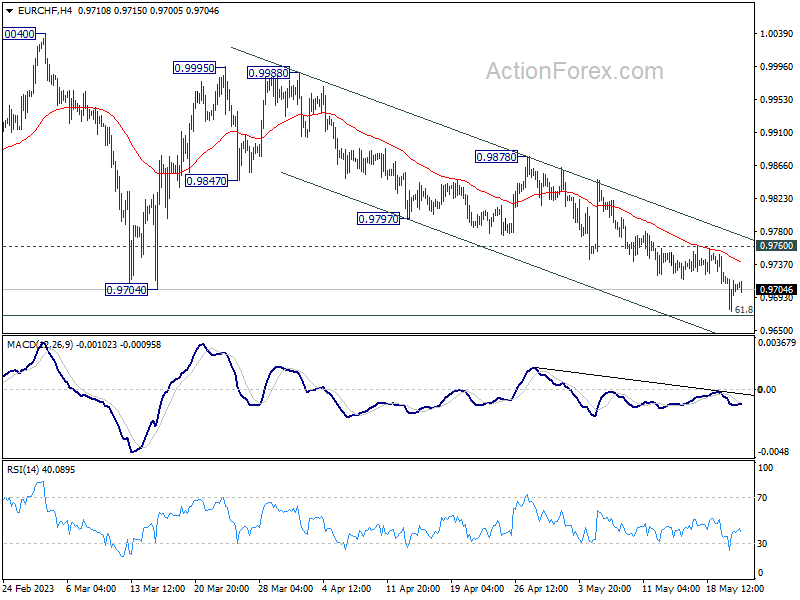
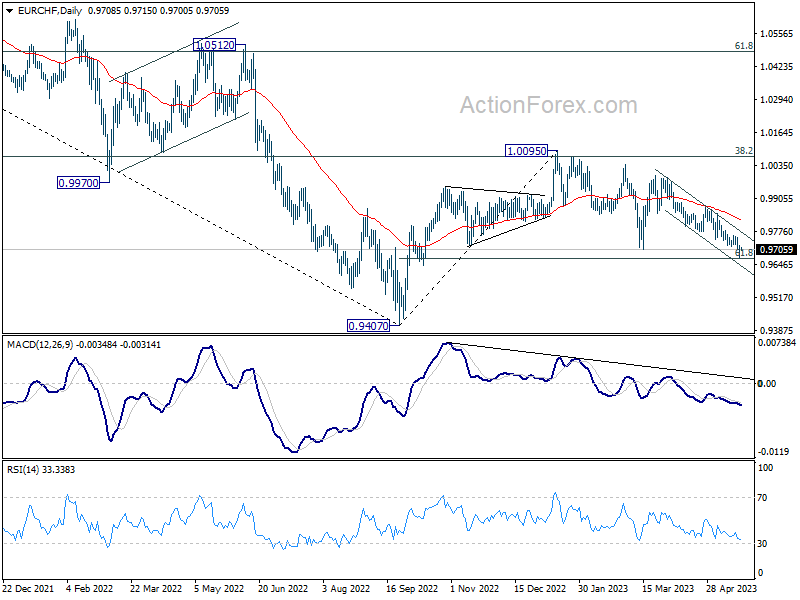
Outlook in EUR/CHF is staying unchanged. The corrective pattern from 1.0095 could be contained by 61.8% retracement of 0.9407 to 1.0095 at 0.9670. On the upside, break of 0.9760 resistance should confirm short term bottoming and turn bias back to the upside for stronger rebound. However, sustained break of 0.9670 will pave the way back to 0.9407 low.
In the bigger picture, prior rejection by 38.2% retracement of 1.1149 to 0.9407 at 1.0072 suggests that medium term outlook is staying bearish. The pair is also capped below 55 W EMA (now at 0.9963). Down trend from 1.2004 is not completed yet and is in favor to resume through 0.9407 at a later stage. However, decisive break of 1.0095 resistance will raise the chance of bullish trend reversal. Rise from 0.9407 should then target 1.0505 cluster resistance (2020 low at 1.0505, 61.8% retracement of 1.1149 to 0.9407 at 1.1484).
GBPUSD Moves With Weak Momentum Within SMAs
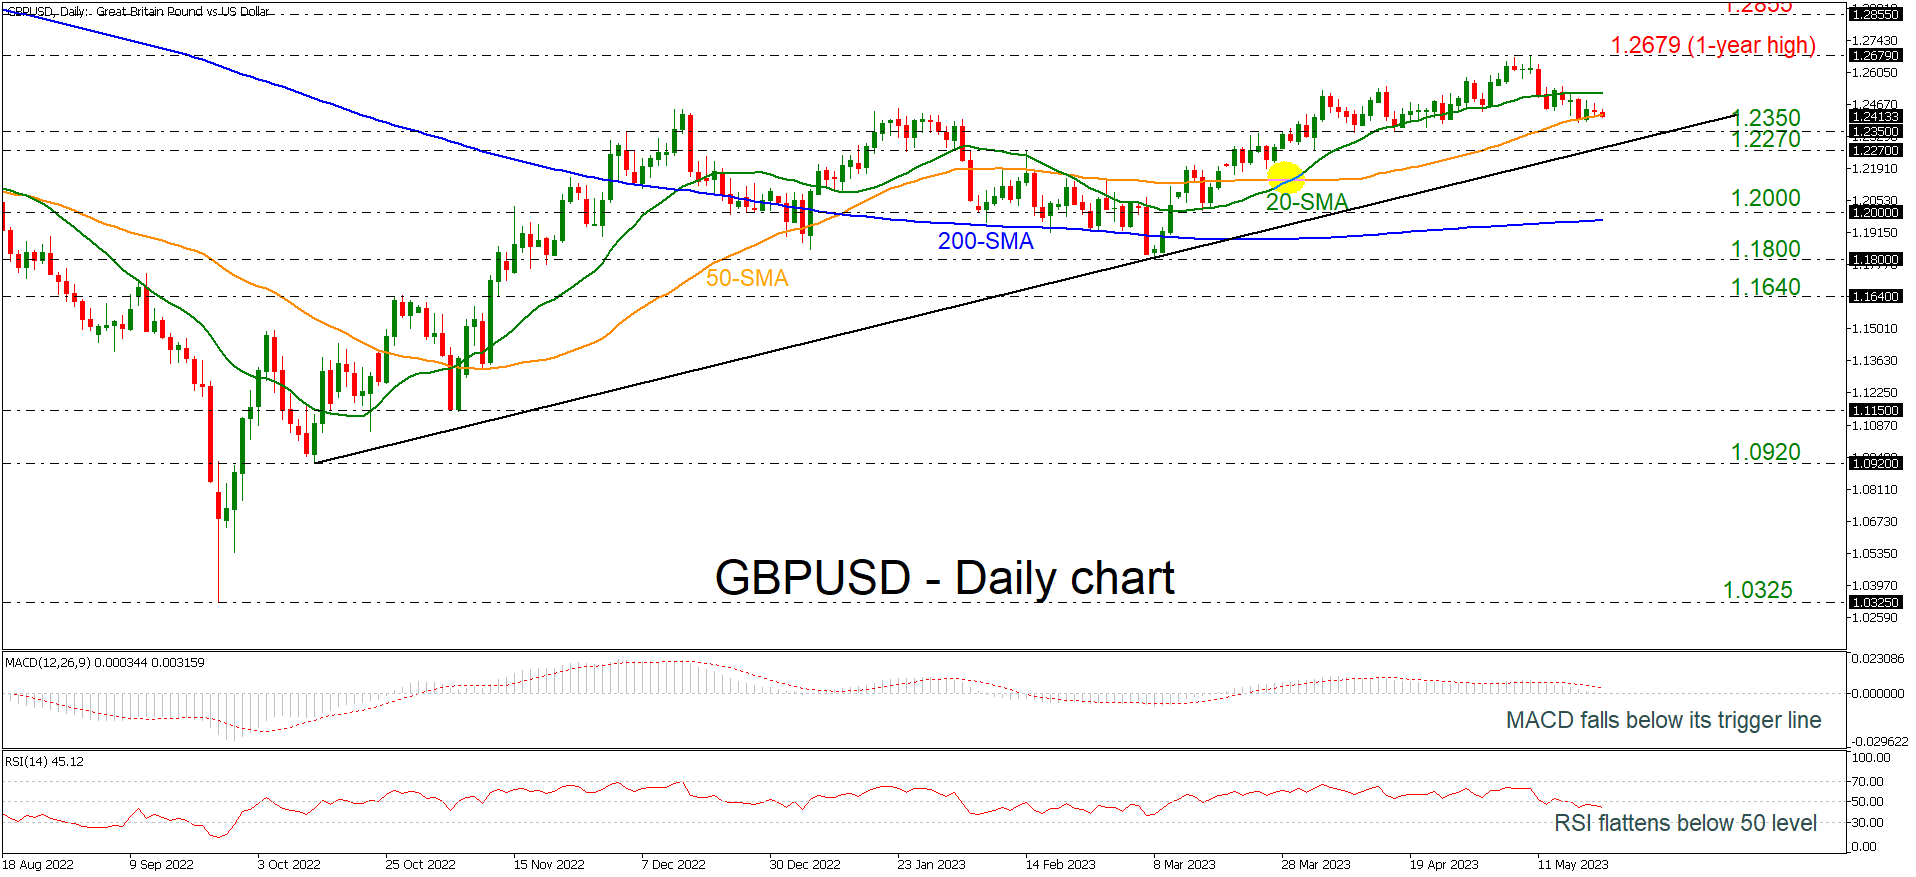
GBPUSD is moving with weak momentum within the 20- and the 50-day simple moving averages (SMAs), indicating that a sideways move may be on the cards in the short-term timeframe. The recent outlook is also confirmed by the technical oscillators as the MACD is standing below its trigger line and near the zero level, while the RSI is flattening beneath the neutral threshold of 50.
Any bullish actions above the 20-day SMA could open the way for the next key levels such as the one-year peak of 1.2679, registered on May 10, before resting near the 1.2855 barrier, which is overlapping with the 200-weekly SMA.
In the negative scenario, a successful decline beneath the 50-day SMA could reach the 1.2350 support and even lower the 1.2270 barrier, which is also near the long-term ascending trend line. If the bears drive the market below the aforementioned line, they would test the 1.2000 psychological mark and the 200-day SMA around 1.1970.
All in all, GBPUSD is still positive in the long-term view, but in the short-term the view is currently neutral after the drop within the SMAs.
Gold Has Not Lost Its Glitter (Part 2)
- Gold (XAU/USD) has dropped by -5.6% from its recent 52-week high of US$2,067.
- Recent price weakness of gold (XAU/USD) is due to the unwinding of potential long hedges and large speculators’ positions ahead of a potentially positive outcome of the US debt ceiling extension negotiations.
- Longer-term factors such as global stagflation risk and technical analysis are still in favour of a potential multi-month bullish scenario for gold.
The bullish momentum of the shiny metal, gold (XAU/USD) seems to have dissipated in the recent weeks after it printed a fresh 52-week high of US$2,067 on 4 May 2023 and thereafter staged a decline of -5.6% to hit a low of US$1,952 on last Thursday, 18 May. Click here to read Part 1 of the previous analysis.
Even though last Friday, 19 May, the price actions of gold managed to stage a rebound of +1% to close the US session at US$1,977.90 but still below its 20 and 50-day moving averages that are acting as resistances at around US$2,008 and USS$1,990 respectively.
What are the factors that are driving this bout of ongoing weakness for gold?
Firstly, it is the drama that is playing out from Washington that is centered on the soon-to-be “X-date” US debt ceiling extension deadline that falls on 1 June 2023 where the US government is at high risk of running out of cash to meet its obligations if the current debt ceiling of US$31.4 trillion is not raised on 1 June.
The aftermath is a technical default that will likely see a credit downgrade on US sovereign bonds by credit rating agencies and triggered havoc in the global markets via a significant spike in US Treasury yields that may cause global liquidity conditions to tighten and even though such an occurrence happen for a short period before brinkmanship dissipates, its adverse impact can still spark a severe risk-off behaviour among market participants.
Hence, in anticipation of such a US government debt obligation default scenario that may occur on 1 June, long hedges and speculative positions have started to build up in the past two months in safe-haven assets such as gold.
Large speculators’ net open position in gold futures hit close to 1-year high
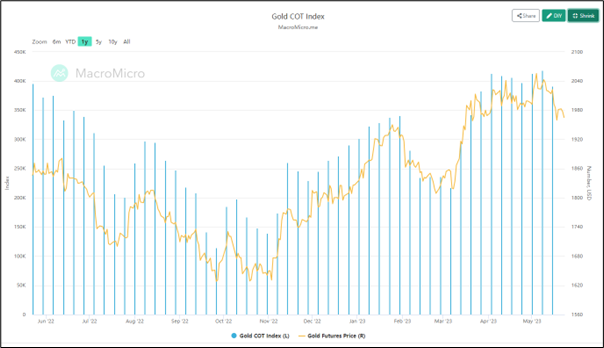
Fig 1: Gold futures net positioning trend as of 15 May 2023 (Source: MacroMicro, click to enlarge chart)
Based on the latest CFTC’s Commitments of Traders weekly report, the net open positions of large speculators in the gold futures market have increased steadily since the week of 31 October 2022. From the week of 3 April to 15 May 2023, these large speculators’ net long open positions have hovered close to a one-year high at around 395,000 contracts.
Thus, this observation on the net long open positioning of large speculators on leveraged gold-related instruments such as futures indicates a slight hint of medium-term over-optimism on the price of gold to march higher in the event of a US government default scenario.
Also in the past week, there were news reports that stated there were potential breakthroughs in the US debt ceiling limit extension negotiation talks between the Biden Administration and the House Republicans that may lead to some form of middle-ground trade-offs to agree to an extension on or before 1 June that has likely triggered some form unwinding of long hedges and speculation positions that dampen the prior bullish sentiment on gold.
Recent short-term bullish strength seen in the US dollar has reinforced gold’s weakness
In addition, the movement of the US dollar in general will tend to have an indirect correlation with gold. In the past two weeks, the US dollar has shown signs of a short-term bullish resurgence, measured by the US Dollar Index that has recorded a weekly gain of +1.4% for the week of 8 May 2023, its highest return since 19 September 2022 supported by a less dovish Fed Speak where the latest public speeches from several Federal Reserve officials have indicated a “not in favor consensus” to kickstart a fresh interest rate cut cycle in the second half of 2023.
On the contrary, there are still several long-term supporting factors that may spark another fresh round of rally in gold.
Global stagflation risk cannot be ruled out
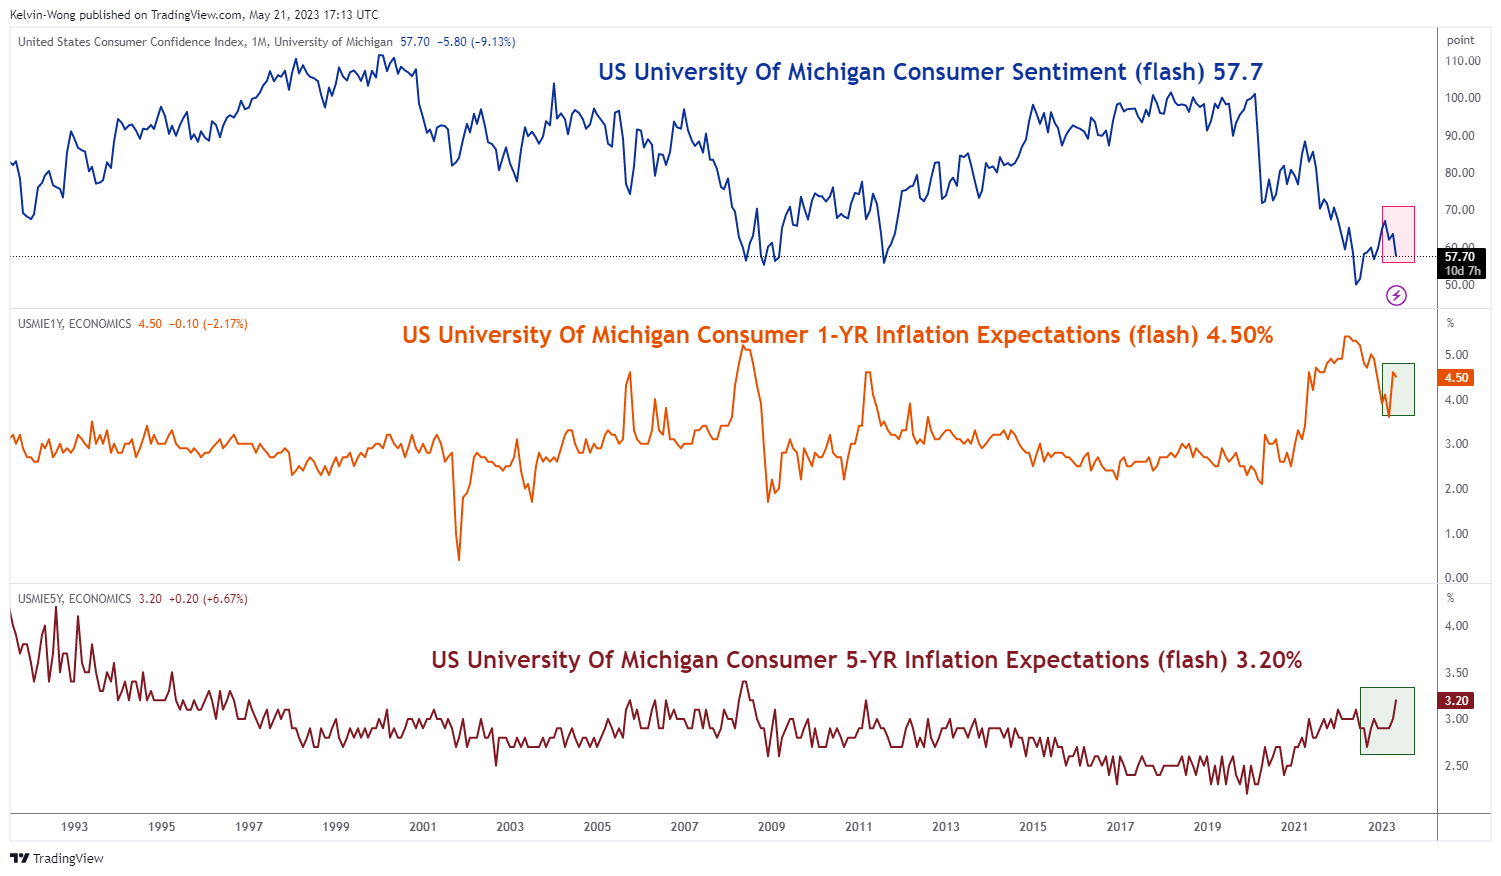
Fig 2: Preliminary University of Michigan US consumer sentiment & inflationary expectations for May
(Source: TradingView, click to enlarge chart)
Recent soft key leading economic data from the two largest economies, the US and China such as the Purchasing Managers’ Index (PMI) survey-based reports for April and the preliminary University of Michigan US consumer sentiment index for May have increased the odds of an impending global recession in the second half of the year.
Also, forward-looking inflationary pressures have appeared to be getting stickier; the preliminary University of Michigan US consumer 1-year inflation expectations reading for May have rebounded since March and remained elevated at 4.50%. In addition, the longer-term 5-year inflation expectations reading has spiked up to 3.20%, its highest level since March 2011.
Slower global growth and elevated sticky inflation is a toxic concoction that led to a stagflation environment where gold tends to outperform other asset classes in the past.
Technical analysis is still indicating a potential major uptrend in the making since September 2022 low
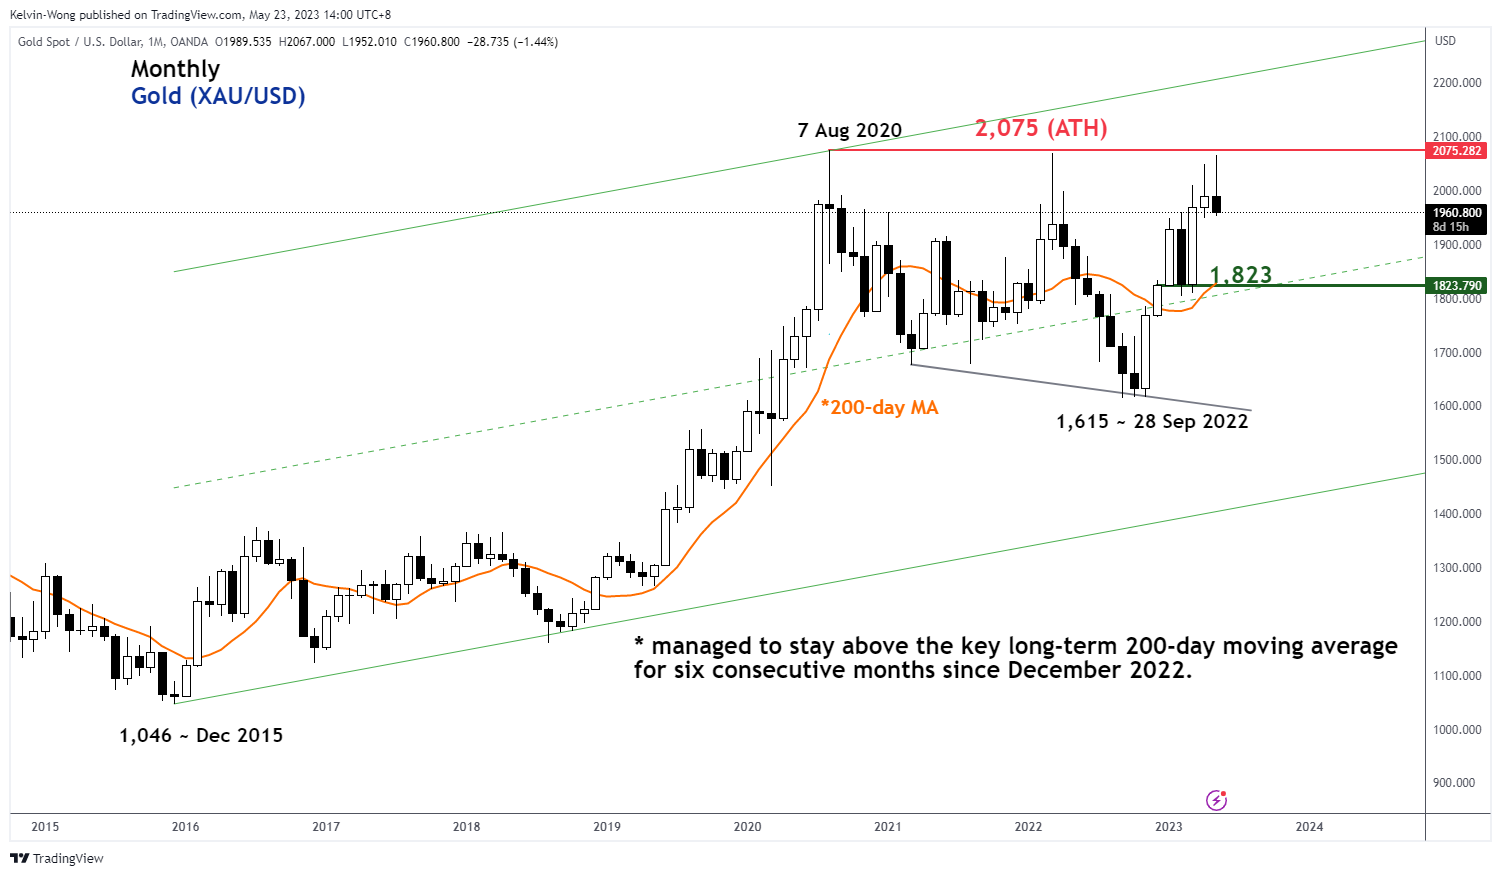
Fig 2: Gold (XAU/USD) trend as of 23 May 2023 (Source: TradingView, click to enlarge chart)
Even though the recent price actions of gold (XAU/USD) have failed to break above its current all-time high of US$2,075 printed in August 2020 on its second attempt in May 2023 with the first being in March 2022, it has managed to stay above the key long-term 200-day moving average for six consecutive months since December 2022.
This positive observation of its consecutive price actions’ duration above the 200-day moving average is the longest period recorded so far since a two-year plus consolidation from its August 2020 all-time high.
It indicates that a potential major uptrend phase is still evolving for gold since the September 2022 low of US$1,615 which may support further potential upside going forward.
USD/CAD Daily Outlook
Daily Pivots: (S1) 1.3488; (P) 1.3504; (R1) 1.3521; More....
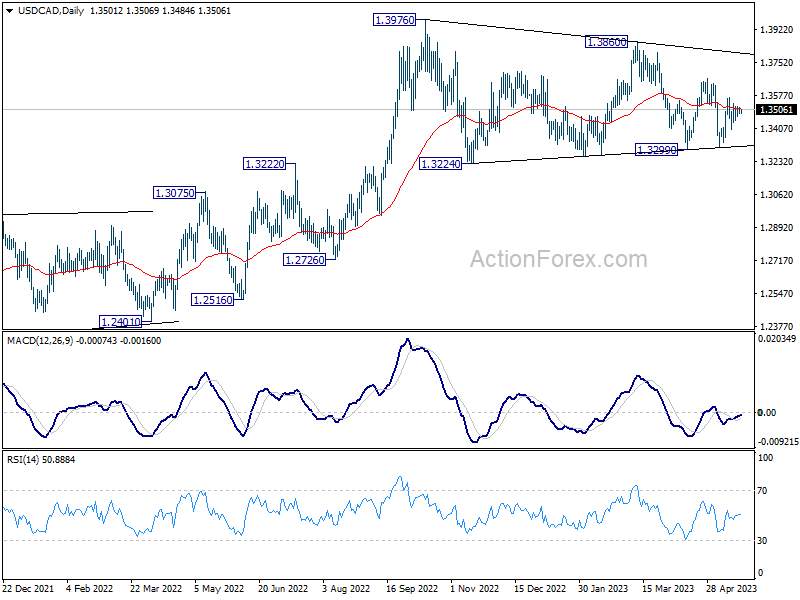
Intraday bias in USD/CAD remains neutral and outlook is unchanged. Overall, the pair is seen as extending the triangle consolidation pattern from 1.3976. Above 1.3566 will resume the rebound from 1.3313 towards 1.3666 resistance and then 1.3860. However, firm break of 1.3313 support will invalidate this view and indicate that deeper correction is underway.
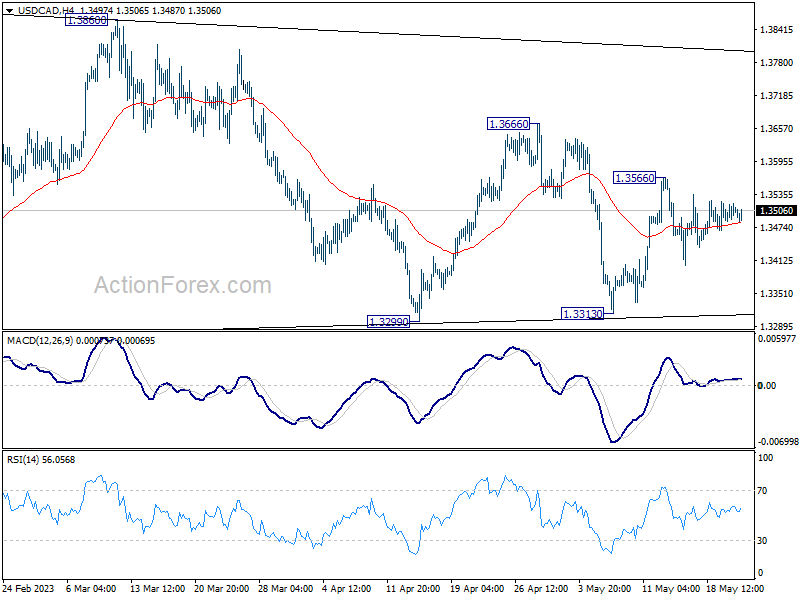
In the bigger picture, as long as 55 W EMA (now at 1.3333) holds, up trend from 1.2005 (2021 low) is still in favor to resume through 1.3976 at a later stage. However, sustained trading below the EMA and 38.2% retracement of 1.2005 to 1.3976 at 1.3233 will raise the chance of bearish reversal. Deeper should then be seen to 61.8% retracement at 1.2758 next.