Sample Category Title
USD/CAD Mid-Day Outlook
Daily Pivots: (S1) 1.3504; (P) 1.3534; (R1) 1.3589; More....
USD/CAD's fall from 1.3566 extends lower today but stays well above 1.3313 support. Intraday bias remains neutral first. Overall, it's seen as extending the triangle consolidation pattern from 1.3976. Above 1.3566 will resume the rebound towards 1.3666 resistance and then 1.3860. However, firm break of 1.3313 support will invalidate this view and indicate that deeper correction is underway.
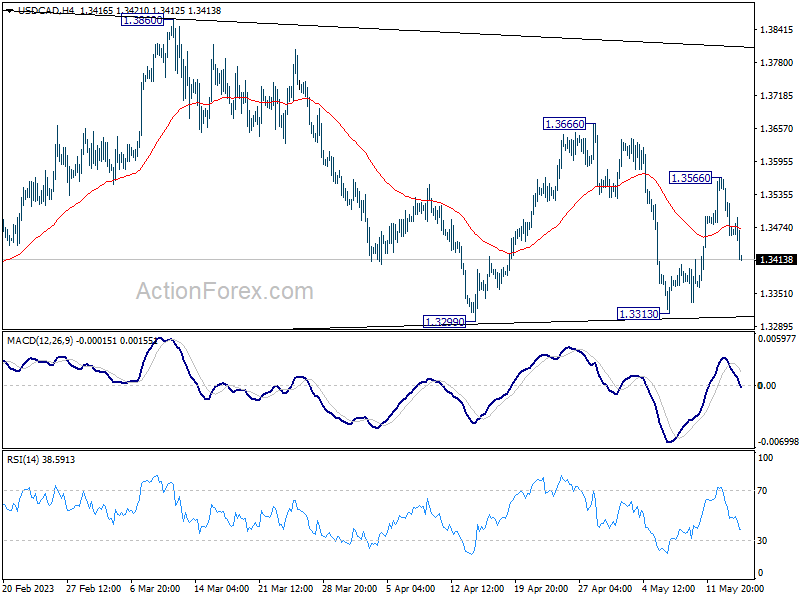
In the bigger picture, as long as 55 W EMA (now at 1.3321) holds, up trend from 1.2005 (2021 low) is still in favor to resume through 1.3976 at a later stage. However, sustained trading below the EMA and 38.2% retracement of 1.2005 to 1.3976 at 1.3233 will raise the chance of bearish reversal. Deeper should then be seen to 61.8% retracement at 1.2758 next.
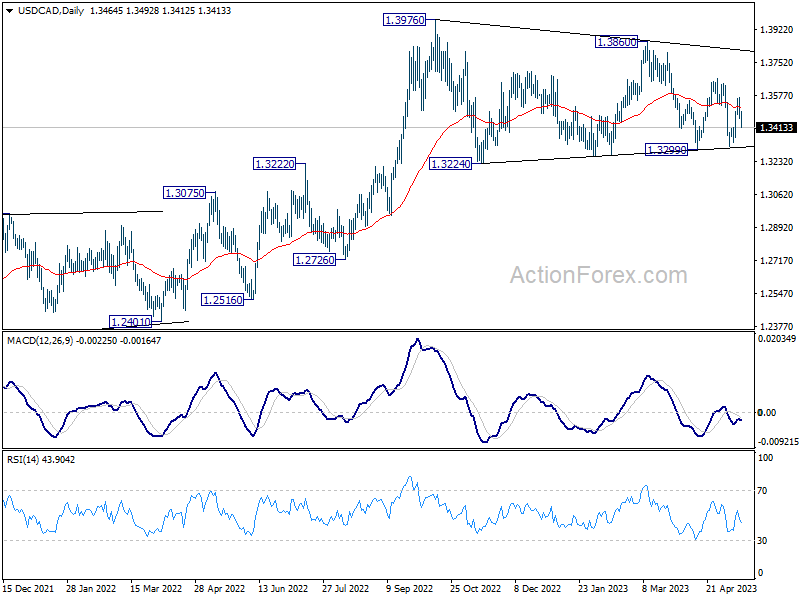
Canada CPI rose to 4.4% yoy in Apr, first acceleration since June 2022
Canada CPI rose 0.7% mom in April, above expectation of 0.5% mom. Prices for gasoline (+6.3%) contributed the most to the headline month-over-month movement. Excluding gasoline, the monthly CPI rose 0.5%.
Over the 12-month period, CPI accelerated from 4.3% yoy to 4.4% yoy, above expectation of 4.1% yoy. That's the first acceleration in headline CPI since June 2022. Statistics Canada said that higher rent prices and mortgage interest costs contributed the most to the all-items CPI increase.
CPI median slowed from 4.5% yoy to 4.2% yoy, below expectation of 4.3% yoy. CPI trimmed dropped from 4.4% yoy to 4.2% yoy, above expectation of 4.1% yoy. CPI common slowed from 6.0% yoy to 5.7% yoy, above expectation of 5.5% yoy.
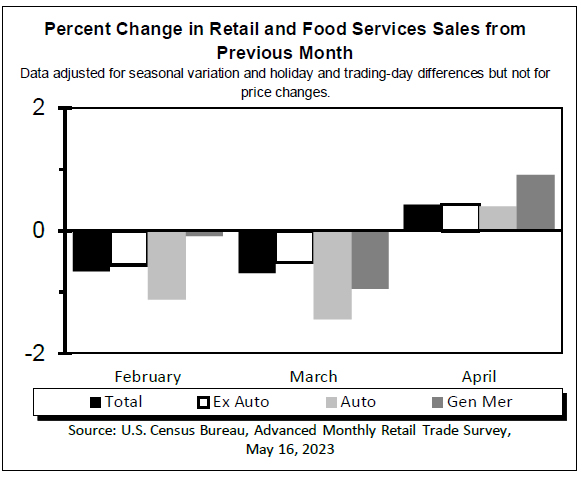
US retail sales up 0.4% mom in Apr, ex-auto sales up 0.4% mom
US retail sales rose 0.4% mom in USD 686.1B in April, below expectation of 0.8% mom. Ex-auto sales rose 0.4% mom to USD 556.1B, below expectation of 0.5% mom. Ex-gasoline sales rose 0.5% mom to USD 631.4B. Ex-auto, gasoline sales rose 0.6% mom to USD 501.4B. Total sales for the February through April period were up 3.1% yoy.
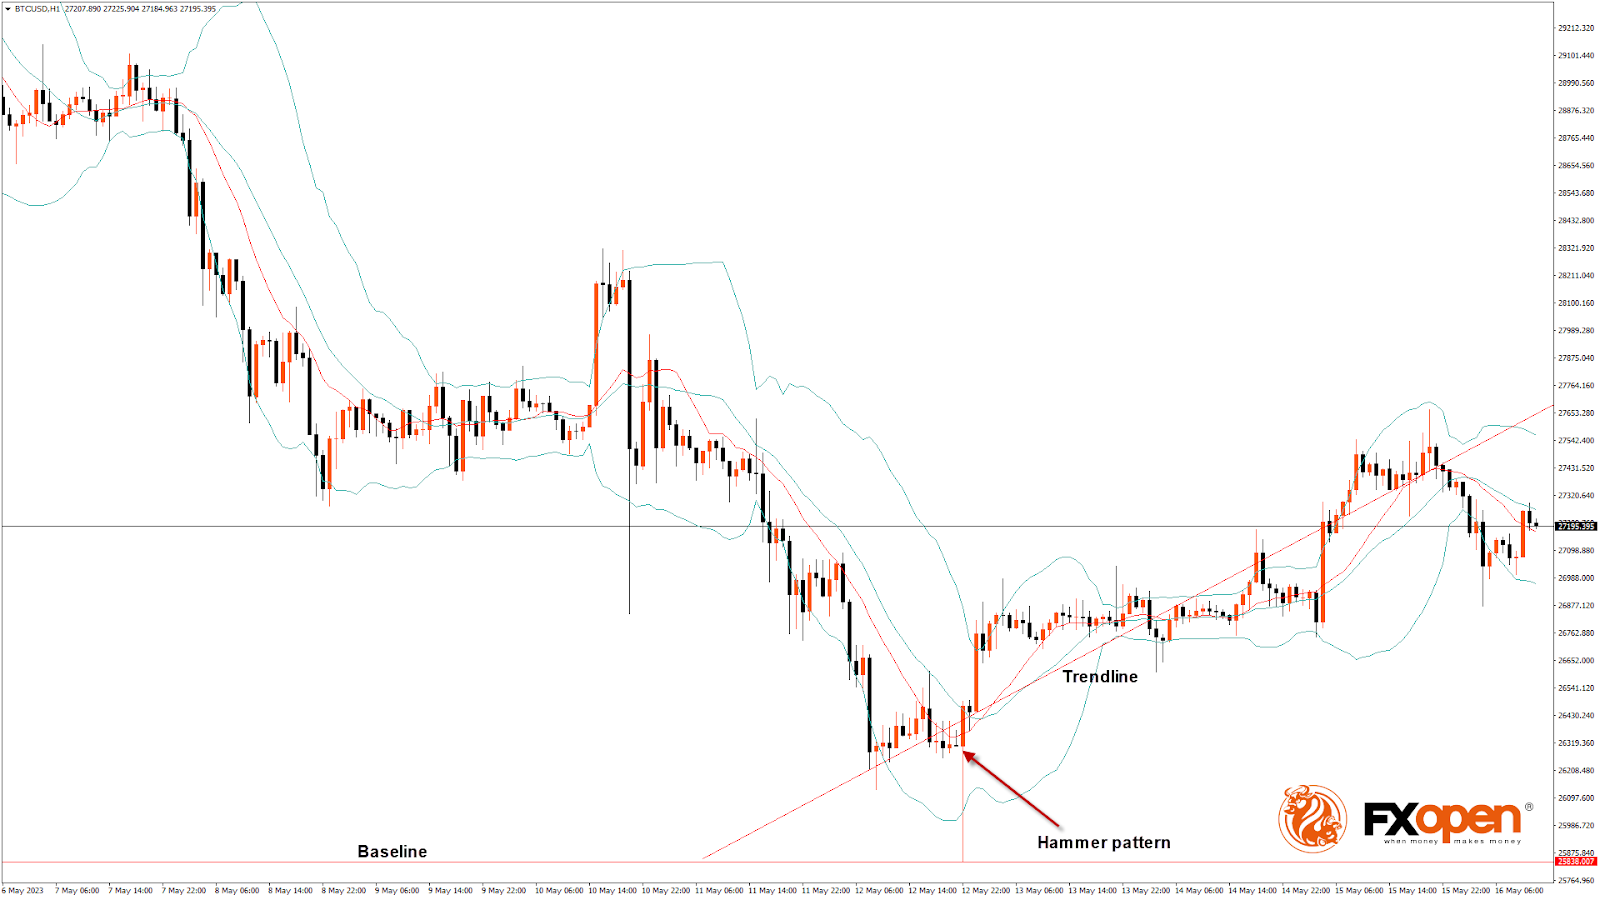
BTCUSD Analysis: Hammer Pattern above $25,838
Bitcoin price continues its bullish momentum from last week, and after touching a low of $25,838 on May 12, we can see a move towards a consolidation phase, after which we are expecting upsides in the range of $28,500-$29,000.
We can clearly see a hammer pattern above the $25,838 handle on the H1 timeframe.
Bitcoin today continues to move in a consolidation phase, after which we can see upside moves towards the $27,000 handle.
Both the STOCH and Williams’s percent range are in overbought zones, which means that in the immediate short term a decline in the price is expected.
We can also see the formation of a bullish harami pattern in the 15-minute and weekly timeframes.
The relative strength index is at 48.98, indicating a neutral demand for Bitcoin and the continuation of the consolidation in the markets.
Bitcoin price is now moving above its 100-hour simple moving average and its 100-hour exponential moving average.
Most of the major technical indicators are giving a bullish signal, which means that in the immediate short term, we are expecting targets of $27,500 and $28,500.
The average true range indicates low market volatility with mild bullish momentum.
- Bitcoin price bullish continuation is seen above $25,838.
- The RSI remains below 50, indicating a neutral market.
- The Bitcoin price is now trading below its pivot level of $27,242.
- The short-term range is mildly bullish.
- Bitcoin price is ranging near the support of the channel and triangle.
Bitcoin Bullish Continuation Seen Above $25,838
The Bitcoin to USD exchange rate entered into a consolidation zone above the $25,000 handle after which we can see the start of the bullish moves.
There is a bullish trend reversal pattern with 200 and 50-period adaptive moving averages in the 2-hour timeframe.
The Aroon indicator is giving a bullish trend signal in the 30-minute timeframe.
We have also seen a bullish harami cross pattern located in the 15-minute timeframe.
A support zone is at $25,881, which is a 1-month low, and at $26,624, which is a 38.2% retracement from 13-week high.
BTCUSD is now facing its classic resistance level of $27,280 and Fibonacci resistance level of $27,303, breaking which the price will be able to move to $28,000.
The price is above the Ichimoku cloud in the 15-minute timeframe.
The short-term outlook for Bitcoin is mildly bullish, the medium-term outlook has turned bullish, and the long-term outlook remains neutral under present market conditions.
The Week Ahead
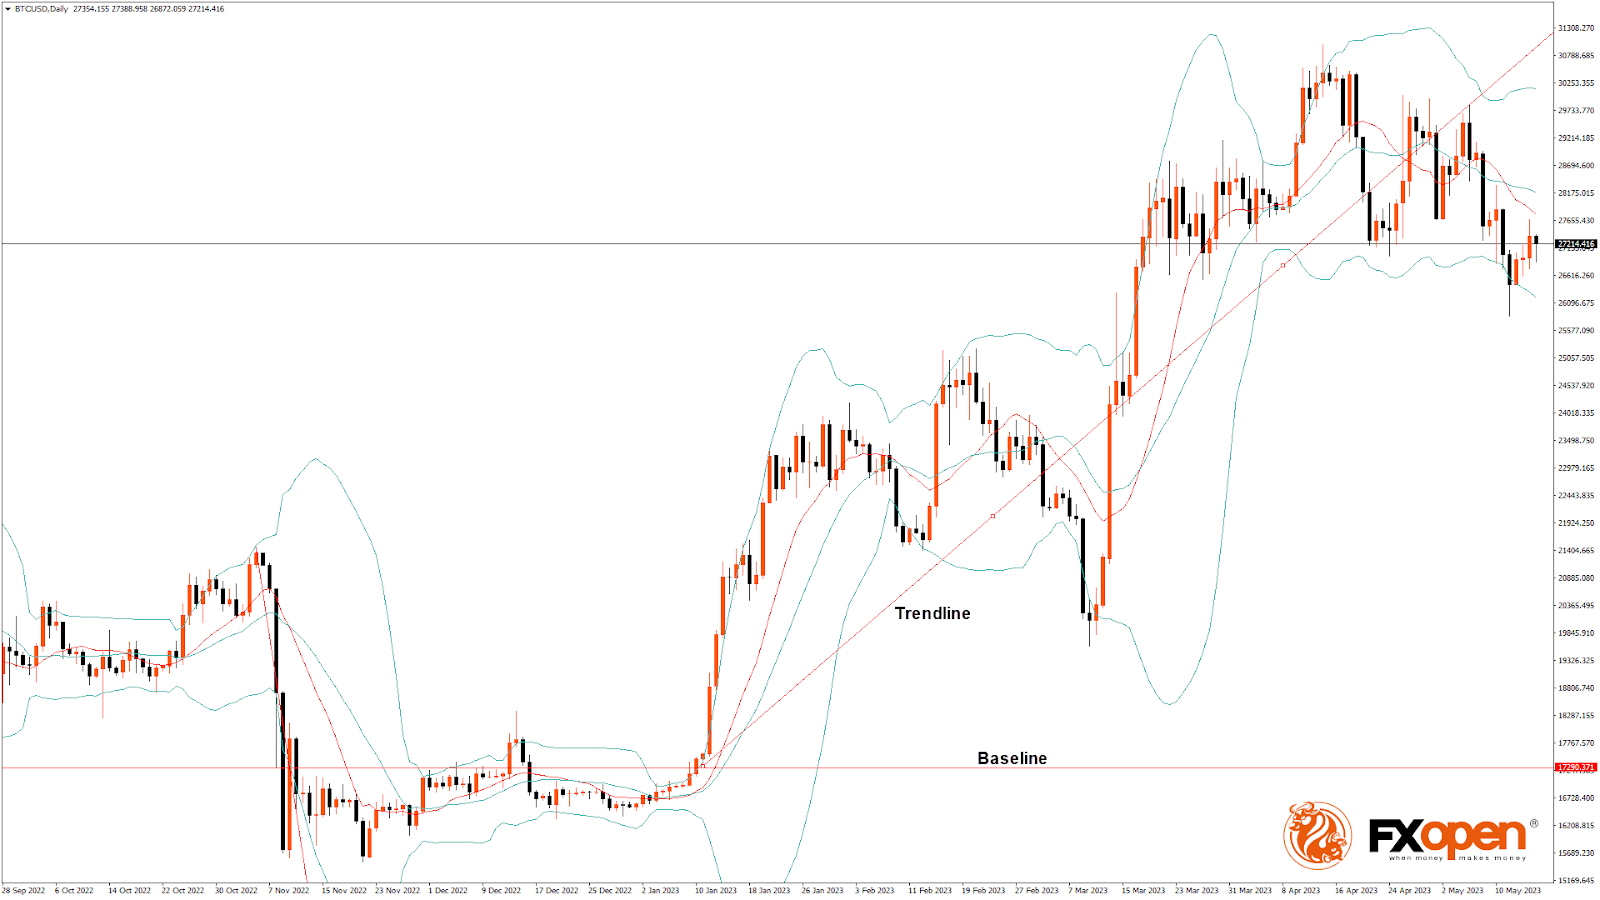
We can see that on a daily chart, Bitcoin remains well supported above the $25,000 handle and there is a medium-term continuation pattern, with the current support at $25,281, which is a 50% retracement from 13-week high/low.
The immediate expected target is $28,000, after which we may see some consolidation in the $28,500 zone.
Monthly RSI is at 49.38, which indicates the neutral market and the shift towards the consolidation zone in the medium-term range.
We can see the formation of a bullish trendline from $25,838 to $27,690.
The BTCUSD is now facing resistance at $27,682, which is a 38.2% retracement from 4-week low, and at $27,786 at which the price crosses the 9-day moving average.
The weekly outlook for Bitcoin price is projected at $28,500 with a consolidation zone of $28,000.
RBA: Minutes to May Board Meeting Make Strong Case to Justify Rate Increase
Despite the strong case the Minutes point to the decision in May being “finely balanced” – this still argues for the next ‘live’ meeting being August.
The Minutes of the Reserve Bank Board meeting make a strong case for the surprise decision to raise the cash rate at the May Board meeting.
In interpreting these Minutes we must be mindful that when a central bank makes a decision that is not expected it will go out of its way to justify the decision.
The key change in the rhetoric which certainly enforces the case for the rate hike is the recognition that the current forecast for inflation does not have it reaching the top of the target band until mid-2025. In previous communications the Board made a virtue of that long period as the ‘price’ to pay for maintaining most of the employment gains of recent years. Now we are hearing that the strategy is risky, leaving “little room for upside surprises to inflation given that inflation would have been above the target for around four years by that time”. This risk, which has been part of the policy scenario since the Bank began the tightening cycle, now appears to be unnerving the Board.
The upside risks, which are not new, centre on: services inflation in other countries, which has been persistently high; strong population growth; upward pressures on rents; weak productivity growth boosting unit labour costs; and a potential shift in inflation expectations (although still no evidence so far that this is occurring, and actual inflation is now declining).
The Board now also points directly at asset markets, the pause in April seen as likely partly contributing to a lift in house prices and lower Australian dollar. Commentary on both of these links them to the outlook for activity and inflation rather than implying policy is targeting asset markets. Concerns about a wealth effect from the housing market at this stage of the cycle seem to be a marked over-reaction.
The case for a pause was familiar: weak consumption; rising aggregate mortgage rates as low fixed rate mortgages expire; and a forecast increase in unemployment that might see inflation slow more quickly than forecast. The argument here is to hold steady to gain more information.
Given this rhetoric it seems surprising that “the arguments were finely-balanced” rather than overwhelmingly in favour of the hike.
That ‘finely balanced’ assessment also seems inconsistent with the return in the rhetoric to the February approach of discussing multiple rate hikes, although the phrasing “are likely to be needed” is replaced by “may still be required”.
Also, in the concluding line of the ‘Considerations for monetary policy’ section – “Members also agreed that further increases in interest rates may still be required, but it would depend on how the economy and inflation evolves” – the phrasing ‘further increases’ has replaced ‘monetary policy may need to be tightened’ which comes across as stronger language.
So we are left with a somewhat confusing message. The decision was ‘finely balanced’ but the case for tightening was made much more strongly than the case to hold.
The importance of the clear slowing in activity and its implications for demand-related inflation pressures seems to be underplayed. There is now a ‘cost’ of pausing – boosting asset prices.
The attraction of pausing to assess the cumulative impact of the most rapid tightening cycle we have seen seems to have less weighting, e.g. “there was a case to hold the cash rate steady in order to gather more information.” And the high frequency of meetings no longer rates a mention.
How the productivity argument can impact the near term outlook for policy is not explained – productivity, which is driven by the supply side of the economy, will evolve over the medium term and should not be a factor affecting the immediate policy outlook unless the Board is convinced that Australia is set for an extended period of further productivity erosion in which case the tightening cycle would have significantly further to run.
Conclusion
We still expect that the Board will choose to pause at the next Board meeting on June 6. But the case for further near-term rate increases cannot be dismissed.
The concerns the Board has around the risks to its inflation target are understandable but so are the signals around the sharp slowdown in spending and the likely feedback this will have on inflation and labour markets.
As the Board has outlined, the decision in May was ‘finely balanced’, therefore given the relentless frequency of Board meetings the case for a pause in June is respectable.
However, unless we see data on wages and the labour market later in the week that shocks the Board the next ‘live’ meeting should still be August 2 when there will be more information on the Board’s progress towards its inflation target while evidence around the consumer slowdown will be clearer.
As was the case in May, the arguments in August will again be ‘finely balanced’ although our forecasts point to an ‘on hold’ decision.
Will Australia’s Labor Data Tempt RBA to Hike Again?
Despite the Reserve Bank of Australia (RBA) saying at its May meeting that more rate increases may be required, investors are nearly convinced that it will take no action at the June gathering, and evenly split on whether another 25bps may be warranted in August or September. So, to get a better sense of how the RBA may proceed henceforth, they may pay close attention to wage growth and employment data, due out on Wednesday and Thursday, respectively.
Market expects the RBA to return to the sidelines
At its latest gathering, the RBA raised interest rates by 25bps, stunning investors who were expecting officials to stay sidelined for the second time in a row. Policymakers decided to hike due to stubbornly high services inflation and faster-than-expected rental increases, adding that more hikes may be required depending on how the economy and the inflation outlook evolve.
In the minutes of that meeting, released today, it was revealed that board members were considering staying sidelined for another month, but the inflation risks convinced them that a hike was a more appropriate decision.
Having said all that though, despite officials saying that more hikes may be required, and despite Australia’s consumer prices increasing 6.3% year-on-year in March, market participants are currently assigning an 87% probability for no change at the upcoming meeting in June, with the remaining 13% pointing to another quarter-point hike.
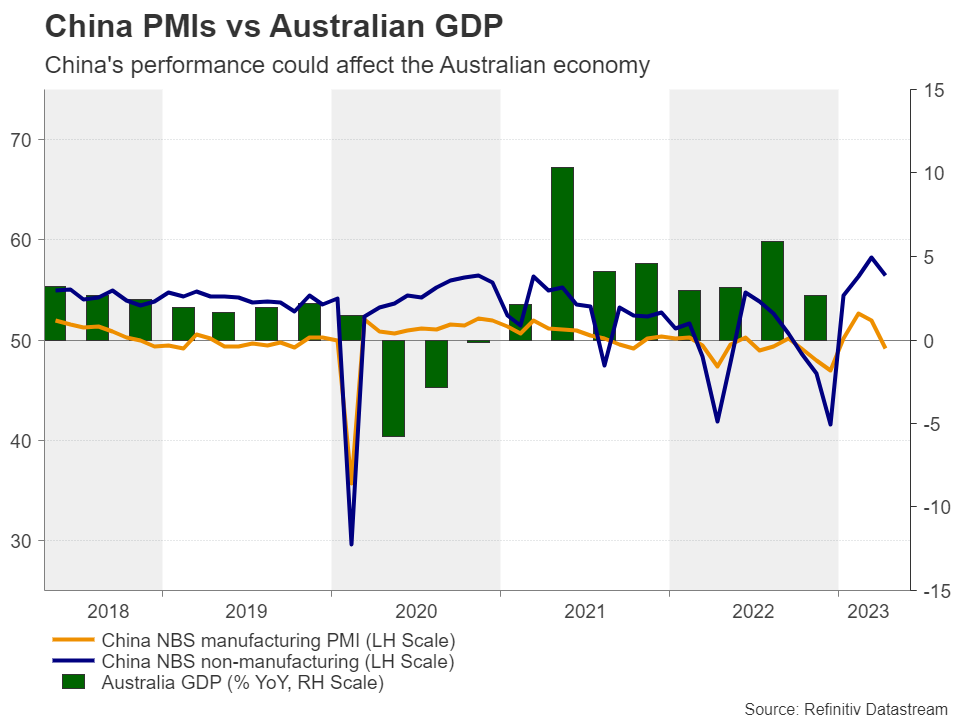
Perhaps that’s due to inflation being in a downtrend since December, when it hit 8.4% y/y, and due to Chinese data suggesting that after the post-reopening boost, the world’s second largest economy and Australia’s main trading partner is losing momentum.
Will the jobs data increase the chances of another hike?
Beyond June, investors are pricing in around a 30% chance for a quarter-point hike in July, while they are evenly split for August and September. So, as they try to better understand how the RBA could proceed later this year, they may pay attention to the wage price index for Q1 and the employment report for April, due out during the Asian sessions Wednesday and Thursday, respectively.
Wages are forecast to have continued to accelerate for the 9th consecutive quarter, which could add to concerns about inflation staying elevated, and although the employment change is expected to show that the economy added less than half the jobs it gained in March, the unemployment rate is seen holding steady at 3.5%, just a tick above its record low of 3.4%.
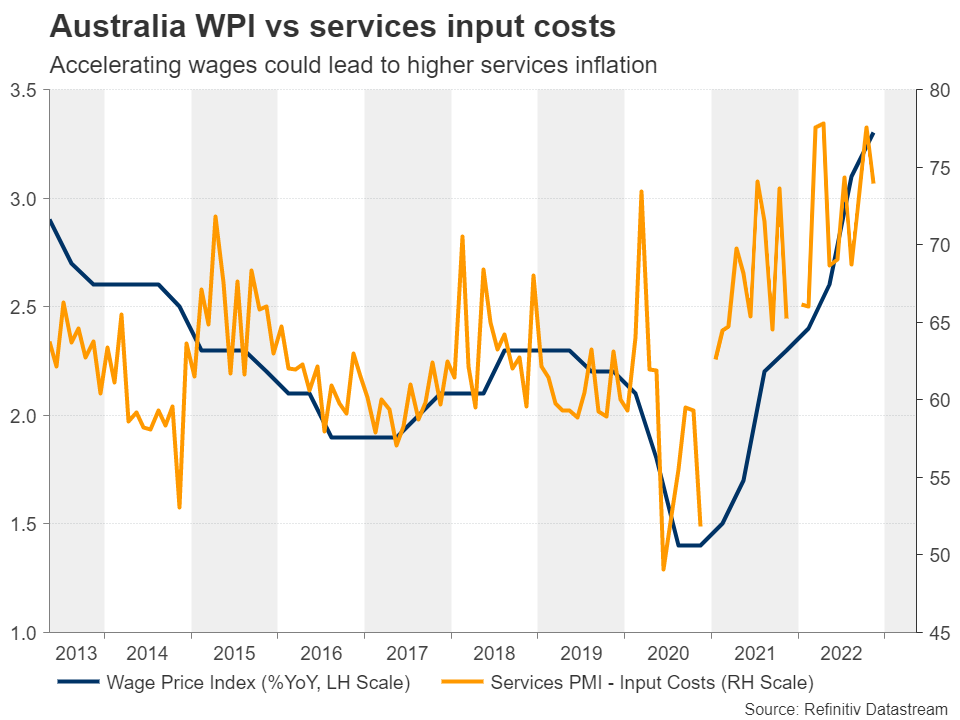
A tight labor market and rising wage growth, which according to the S&P Global services PMI, is contributing to accelerating price pressures for firms in Australia, could prompt investors to price in a higher probability for a hike during the summer months.
Aussie may be destined to stay weak for a while longer
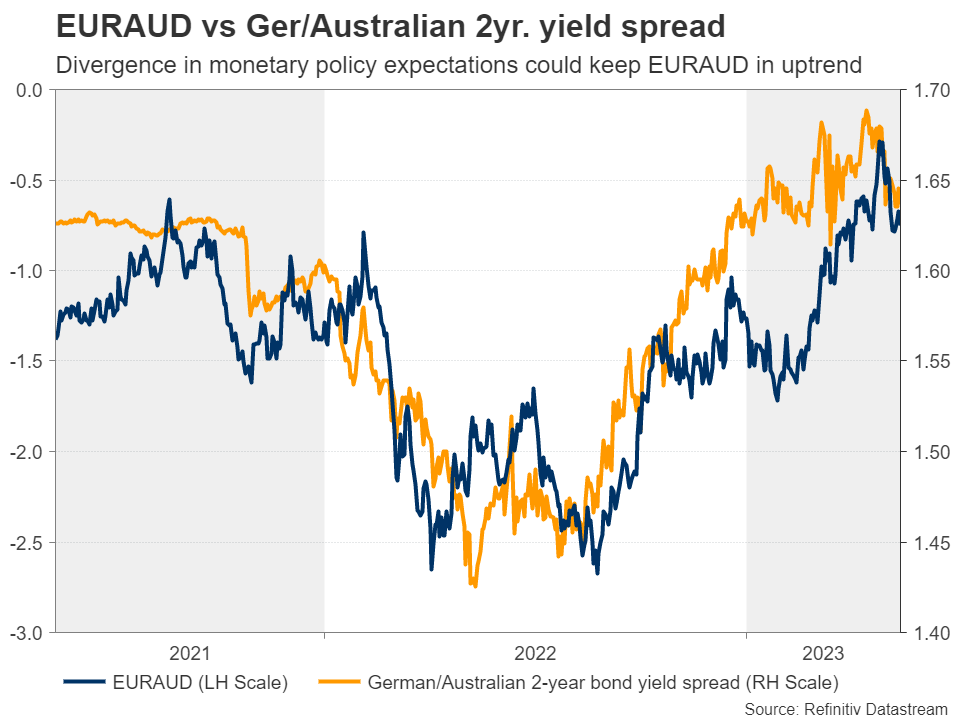
This could prove positive for the Australian dollar, but its upside may be capped by market participants’ concerns over the outlook of the Chinese economy. With the Fed expected to proceed with nearly three quarter-point cuts by the end of the year, the picture in ausie/dollar may not be so clear, but with the ECB seen hiking by another 50bps, euro/aussie may be destined to continue its uptrend for a while longer, even if the Australian currency temporarily benefits by this week’s data.
Euro/aussie has been in a sliding mode since April 26, when it hit resistance at 1.6790, a territory that threw the bulls out of the game back in October 2020 as well. Nonetheless, the pair remains above the uptrend line drawn from the low of August 26, which keeps the bigger picture positive.
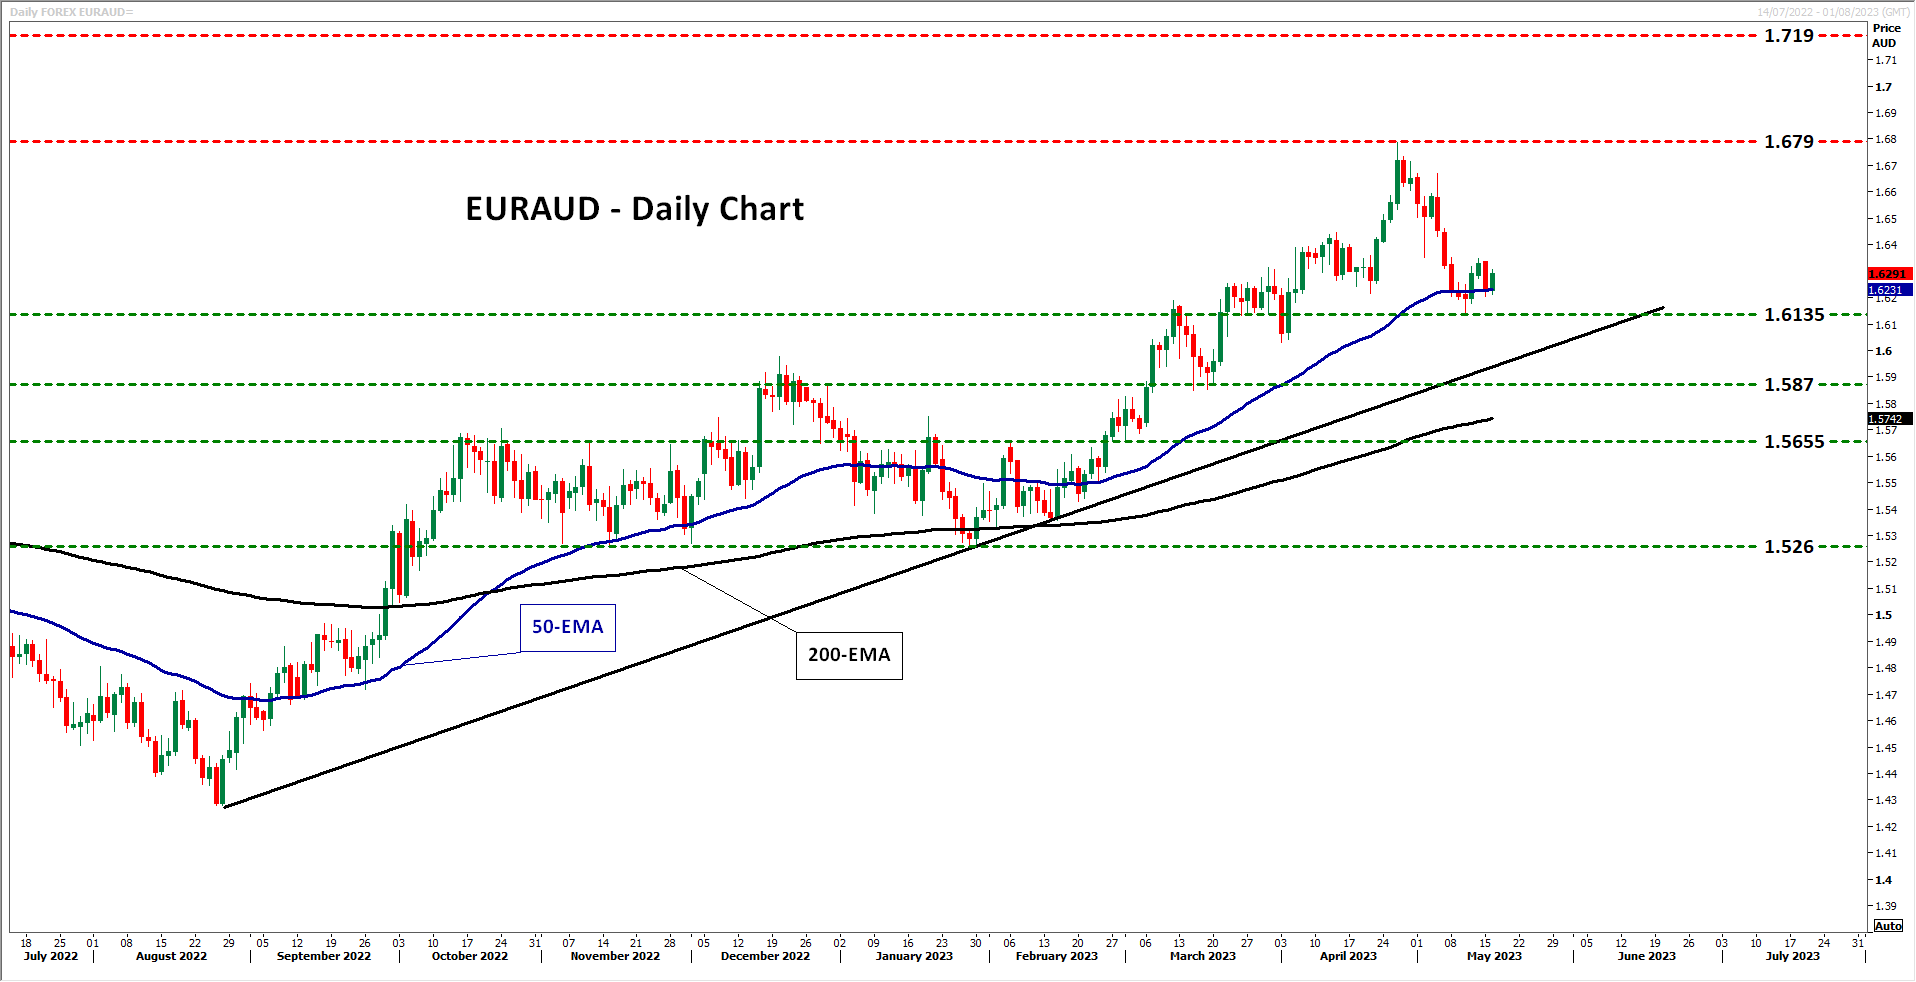
Even if the slide extends beyond last week’s low of 1.6135, the buyers could still step back into the action from near the uptrend line and perhaps stage another march towards the 1.6790 zone. If they manage to break that zone, they could then put the 1.7190 area on their radar, which offered resistance back in early May 2020.
The outlook could start darkening if the bears are able to break the aforementioned uptrend line, but also the 1.5870 support. Should this happen, they may get encouraged to dive towards the 1.5655 territory, marked by the inside swing high of February 6, the break of which could see scope for extensions towards the 1.5260 area, which acted as a floor between November 4 and January 30.
US Default: If the US Government Runs Out of Money, What Direction Will the Markets Take?
Who would have thought that we would ever see a time during our lives in which it could be possible for the United States, the world’s commercial and economic superpower since the industrial revolution, to potentially run out of money?
Perhaps even more of a stretch of imagination would be needed to comprehend that the United States national coffers would run up a debt so high that it would not be able to service the repayments, despite the country’s almost 250-year long history of hard work, ingenuity and commercial marketing genius.
Nowadays the American Dream is made in China, and the overall cost of operations is at an all-time high, whilst competition from almost every corner of the earth is rife and has been challenging American corporate hegemony for a while now.
A national economy which now survives on debt means that at some point, the borrowing needs to be repaid, and in the case of the United States, there is a ‘debt ceiling’ in place which is an actual law which limits the amount that the US government is allowed to borrow, which currently stands at $31 trillion.
National debt is now at such a high point that the debt ceiling has been almost approached, and the government is weighing up making plans to raise it so that it can borrow more money.
Every few years, a government can, according to the law, bring in a vote to increase the debt ceiling, however, at a time during which the country is on paper heading toward bankruptcy, is borrowing more a good idea?
During the discussions within the US Congress over recent days, many have observed that the United States government could run out of money as soon as June 1 this year.
That may well be an alarming prospect, but rather interestingly, there are swathes of reports which depict a very calm approach by investors and traders.
The question remains: which assets will likely be affected?
1: American big tech: The FAANG stocks
During the past two years, the ‘big tech’ arena of American stocks listed on the NASDAQ and New York Stock Exchange have been surprisingly volatile.
These days, ‘big tech’ does not refer to engineering or physical hardware manufacturers, but largely to internet companies which either offer e-commerce such as Amazon, search & SEO giants like Google, social media platforms such as Facebook (Meta), or online video streaming such as Netflix.
These tend to dominate the American stock markets, and their Silicon Valley base tends to dominate the entire tech development for the world.
During the lockdowns of 2020 and 2021, the American government along with many western allies attempted to change the behaviour of the population, largely succeeding to do so, and tens of millions of people moved their social life and work life online. These platforms boomed.
Then in 2021 and 2022, they crashed. There was a US tech stock downturn, which lasted almost a year.
Now, with costs up and a national debt which is becoming unserviceable in their homeland, will Chinese, Indian and Eastern European locations become favourable for global tech giants?
If so, the tremendously high cost of operating in Silicon Valley may be looked at.
We saw Israeli-owned American high tech firms pull over $30 billion in operating funds out of Israel when the new government took office earlier this year, resulting in a downgrading of the entire country’s credit rating. $30 billion is a lot for a small country but is nothing for the US. Imagine what may happen if large, borderless multinationals become concerned about the fluidity of the US economy and move their business to Mexico, India, Brazil, China or a combination of all of these.
Right now, nobody is panicking, but who knows what decisions will be made if the credit crunch arrives.
2: The US Dollar
Aside from corporate concerns in the boardrooms of American publicly listed giants, there is a simpler aspect to consider: The US Dollar.
America’s sovereign currency has for many decades been the de facto major currency against which everything, everywhere in the world is measured.
It is regarded as the most stable, most traded and most circulated currency in the world. Everyone is safe with Dollars, right?
Well….
Since September last year, the British Pound, which was on a road to oblivion during most of 2022, has been gaining significant ground against the US Dollar.
On September 16, 2022, the British Pound was at 1.16 against the US Dollar, whereas today, a few US bank demises, billions spent on overseas wars, and a credit catastrophe later, the British Pound is at 1.25 against the US Dollar.
Fluctuations that great are usually reserved for exotic currencies and it is very rare that majors would experience such a degree of volatility, but here we are in May, with a strong Pound against the US Dollar despite the UK’s own economic problems including high inflation, an energy price crisis and 12 years of ‘austerity’.
The US Dollar would perhaps be worth watching if a default does actually happen, as it may well be the first time in decades that its standing as the de facto currency has been challenged. After all, if its own central bank and central government is bankrupt, it would be being issued by an insolvent institution.
3: Credit Default Swaps
What is a Credit Default Swap? These are relatively unheard of by many mainstream traders, and of course are less relevant to the everyday lives of most currency and commodity traders, however, they’re worth a quick mention here.
A Credit Default Swap is a derivative which allows one investor to swap a default on a debt with another investor. To swap the risk of default, the lender buys this particular product from another investor who agrees to reimburse them if the borrower defaults.
These have been spiking as traders head toward betting on the possibility of a default and attempting to profit from it.
Therefore, the popularity of these swaps is a demonstration of the sentiment that many people are considering that a default by the US government on its debt could actually happen.
4: FTSE 100
The good, old-fashioned London Stock Exchange. What do you mean old fashioned? You may ask. Well, the London Stock Exchange may indeed be state of the art in its execution and electronic trading prowess, but the companies listed on it, especially the top drawer, blue-chip companies, are very much of the old school.
Compared to the NASDAQ’s straight-to-market, out-of-the-blue SPAC-listed startups with valuations of several billion dollars, many of which have barely distributed a product, London Stock Exchange is a bastion of established, well-rounded companies which rarely take risks and are evergreen.
The FTSE 100 index is the basket of stocks which make up the 100 most prestigious, large-cap companies on the London Stock Exchange, many of which are in traditional sectors such as pharmaceuticals, mineral extraction and mining, air and rail travel, shipping, retail and commercial banking, entertainment and leisure, and supermarkets and food distribution.
Should the US government default on its debts and destabilise the US economy, investors may look toward the steady, tortoise-like FTSE 100 index for its age-old corporations with histories as long as most people can remember, and eschew the Silicon Valley crowd, both established or SPAC listed, across the pond on New York’s trading venues.
Whichever way, this is a very turbulent time and will be regarded as an historic moment on the US commercial landscape.
Will the default take place or will America get even deeper into debt?
We shall soon find out…
China’s Recovery Falls Short of Expectations
China’s economic growth is falling short of economists’ expectations, putting pressure on the yuan and raising questions about the sustainability of the national and global economies.
Industrial production rose 5.6% y/y in April, but the average forecast was 10.9% y/y due to low base effects. Retail sales growth also missed expectations, reaching 18.4% y/y versus the expected 22%.
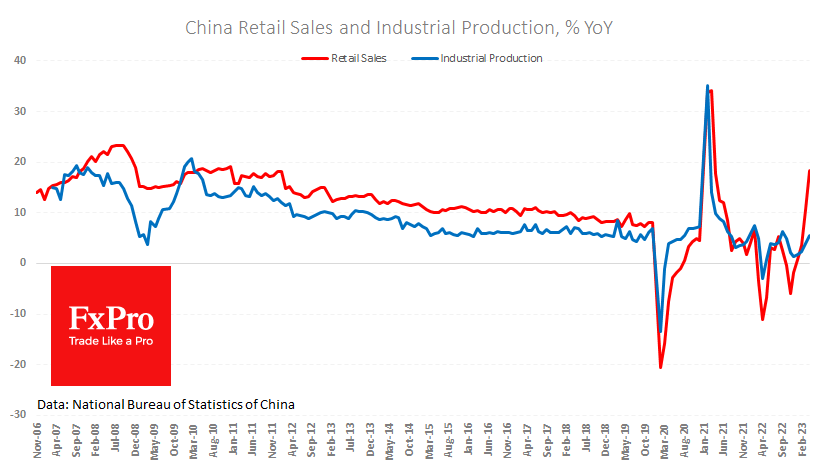
Disappointing data is more a manifestation of economic inertia than a sign of weakness. Assuming that the problem is simply one of the inflated market expectations, the situation in China looks much better than in most developed countries. The unemployment rate has fallen to its lowest level since November 2021, which bodes well for the coming months. With jobs, people are spending more, so the outlook for the coming months is less bleak.
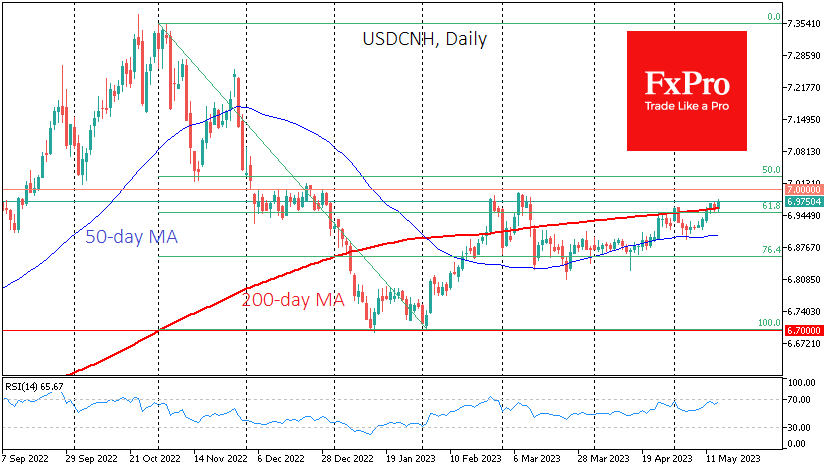
The weaker-than-expected data put pressure on the renminbi. The USDCNH briefly touched 6.978, a high of 6.978 this morning, and is now approaching a test of the psychologically important 7.0 level, which the pair has failed to break since last December. A break above this level could be an important milestone for the forex market, adding to the general pressure on the renminbi and risk assets.
Some Positives for BoE from UK Jobs Data, Chinese Figures Less Good
Stock markets are treading water on Tuesday, with jobs number from the UK not inspiring and Chinese data also highlighting weakness in the recovery.
Some positives for the BoE to cling to
UK jobs data was a mixed bag this morning as wages accelerated again to 6.7%, excluding bonuses, while unemployment also ticked higher as inactivity fell. The Bank of England will no doubt be concerned about the pace of wage growth, with it not being consistent with inflation returning to 2%, but there are signs of slack emerging which is encouraging.
If inflation does halve as expected this year, that in itself should have a dampening effect on wage growth alongside a less tight labour market. There's still a long way to go but there are promising signs. Sterling declined after the data amid signs that the numbers may soon be enough for the MPC to pause its tightening cycle. Markets are pricing in only one more hike this year before reversing course from the start of next.
An unbalanced recovery in China
Chinese data overnight disappointed, highlighting the likely need for further monetary support from the PBOC over the coming months. The consumer has been the engine of growth for the economy in the opening months of the year but that, as we've seen elsewhere post-pandemic, is primarily services based.
The recovery in China is simply not broad-based and there remain many pockets of weakness that targeted stimulus could provide a boost to. Industrial production and fixed asset investment were both well short of expectations last month and there's little sign of that improving without additional support.
Oil settles in lower range and further declines may prove challenging
Oil prices are marginally higher on Tuesday but remain below the December to March range. The risks remain tilted to the downside amid a sluggish recovery in China, uncertainty around the US economy and banking system, and the impact of much higher interest rates on demand.
The primary bullish case for oil prices comes from OPEC+ and the prospect of another output cut in a couple of weeks but even that has been downplayed. Perhaps Brent has simply consolidated for now in a $70-$80 range, with a move below here potentially difficult as the US seeks to refill the SPR at these levels, while OPEC+ wouldn't hesitate to pull the trigger if prices slipped too far.
Gold buoyed by debt ceiling drama
Gold is a little lower on the day but remains above $2,000 as traders appear reluctant to concede on hopes of record highs. The yellow metal came within a whisker of record highs earlier this month and could take another run at it, depending on how things unfold over the coming weeks.
Debt ceiling drama could be supporting gold and preventing a deeper correction. I think everyone is extremely confident that a default will not happen but the closer we get to the deadline, the more we'll see those risks being priced into the markets which could support gold.
Beyond that, it's all about interest rates and whether we can get more evidence of inflation abating and the labour market becoming less tight. That will justify a pause next month and, if we see significant progress on that front, start the conversation around when easing will begin.
A deeper correction for Bitcoin?
Bitcoin appears to be consolidating around $27,000 in the short term but there remains downside risk after breaking this notable support level last week. It found support around $26,000 but may struggle to generate significant momentum higher. It's been a phenomenal run this year so a correction would make sense. If it does break below $26,000 then $25,000 would be the next potential support level.
Aussie Shrugs Off RBA Minutes, Weak Consumer Confidence
- RBA minutes state further rate hikes possible.
- Australian consumer confidence sinks.
- Australian wage growth to be released on Wednesday.
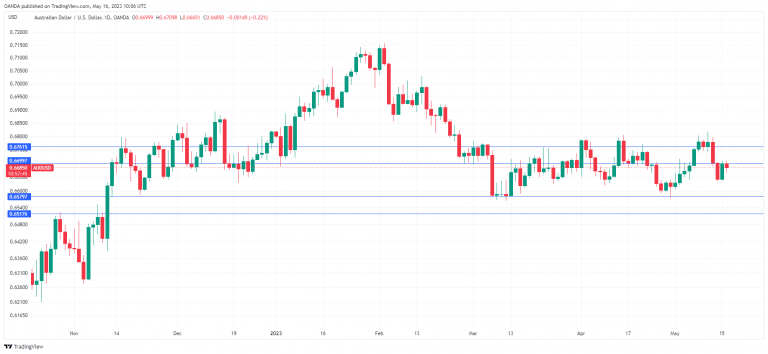
The Australian dollar has taken investors on a wild ride over the past few days but has settled down on Tuesday. AUD/USD is trading at 0.6687 in Europe, down 0.13% on the day.
RBA minutes indicate more rate hikes possible
The RBA released the minutes of its meeting earlier this month. That meeting was a barn-burner, with the RBA stunning the markets with a 25 basis-point hike. The central bank had finally taken a pause in its rate-tightening cycle in April and given the lukewarm economy, a second-straight pause seemed a safe bet, but in the end, the RBA opted for a rate increase.
The minutes noted that the decision to pause or hike was “finally balanced”, with strong arguments for both. In the end, policy makers opted to lift rates in order to lower the risks of inflation becoming entrenched in the economy. Strong population growth, low rental vacancy rates and a tight labour market supported a rate hike.
What can we expect next from the RBA? The minutes didn’t provide any insights, stating that more rate hikes “may be required” to drive down inflation, but that would “depend on how the economy and inflation evolve”. In other words, don’t look to the RBA for guidance, as rate policy will depend on economic data, particularly inflation.
Australian consumer confidence fell sharply, but the Australian dollar didn’t react. Westpac Consumer Confidence plunged 7.9% in May, a sharp reversal from the 9.4% gain in April and much worse than the estimate of -1.7%. The Westpac survey found that consumers were very pessimistic about the surprise rate hike and expect mortgage rates and house prices to move upwards.
We’ll get a look at wage growth on Wednesday, which is expected to rise in the first quarter. The RBA will be watching carefully and an unexpected reading could see the Aussie show some volatility.
AUD/USD technical
- AUD/USD is putting pressure on resistance at 0.6699. This is followed by 0.6761.
- 0.6579 and 0.6517 are providing support.