Sample Category Title
US Debt Talks Progress
Market movers today
Today is a slow day on the data front. We get the final April HICP figures from the euro area. The inflation data will be scrutinised to measure the strength of the underlying price pressure and the contribution from services and goods, respectively.
We will also be listening in to Riksbank's Flodén's thoughts on inflation, see more below.
G7 leaders will meet for a summit in Hiroshima, Japan, from Friday to Sunday with Russia and China being high on the agenda.
Friday, which is a bank holiday in Denmark, we expect a further increase in Japanese CPI inflation in April. Friday we also have Fed's Williams and Bowman speaking.
The 60 second overview
Japan's GDP for Q1 surprised to the upside rising 1.6% q/q annualised versus consensus expectations of 0.8% q/q annualised. The increase was driven by stronger consumption and rebounding tourism. It added to the strength in Japanese equities while it had limited effect on USD/JPY.
US debt ceiling talks progress with Republican speaker of the House, Kevin McCarthy saying it would be possible to reach a deal by the end of the week while also warning that there was still a lot of work to do. President Joe Biden will cut short a foreign trip coming back on Sunday from G7 meetings in Japan, thus scrapping visits to Papa New Guinea and Australia.
US retail sales beat expectations yesterday with core sales (the so-called control group) rising 0.7% m/m in April (consensus 0.4% m/m), while being revised slightly lower in March to -0.4% m/m from -0.3% m/m. 2-year treasury yields rose 13bp in response. Fed speakers continue to be tilted towards the hawkish side relative to market pricing with several speakers yesterday suggesting a further hike in June is still possible and that it is premature to talk about rate cuts. Despite the repricing yesterday, the market still prices 60bp of cuts by year end.
Equities: Global equities lower yesterday dragged down by Europe and US. It looks very much like investors have started the waiting game of the debt ceiling deadline and no big investment decision will be taken ahead of a deal. Looking at rotations it does not suggest any signs yet of big worries ahead of the x-day which Yellen repeated yesterday could be 1 June. Cyclical growth outperformed yesterday and this has been the trend since the middle of the earnings season. Again, no major rotation is taking place and the VIX in hovering around well below 20. In US equities closed lower with Dow -1.0%, S&P 500 -0.6%, Nasdaq -0.2% and Russell 2000 -1.4%. Asian markets are mixed this morning. However, it is interesting to note the remarkable continuation of Japanese outperformance. US futures are a tad higher this morning while European futures are a tad lower.
FI: The 5-10y point led the sell-off of 5bp yesterday as issuance picks up and stronger than expected US retail sales initiated the sell-off.
FX: Yesterday was characterised by USD strength across the board in a risk-off environment. EUR/USD still trading below the 1.09-mark. Rising US yields driven by relatively upbeat US data took USD/JPY well above 136. Scandies weakened against the EUR. EUR/NOK rose above 11.60, while EUR/SEK is hovering around 11.30. EUR/GBP is around the 0.87-mark.
Credit: Yesterday, credit markets were relatively calm and traded unchanged to slightly wider with CDS indices closing with iTraxx Main (unch.) at 86.3bp, and iTraxx Crossover (+2.3bp) at 451.3bp. The primary Eurobond market is continuing the busy pace with several borrowers raising debt where Lifco AB, KfW, Volvo, BNP Paribas Home Loan SFH, Arion Banki and Jyske Realkredit were among the announced deals.
Nordic macro
Riksbank Deputy Governor Martin Flodén attends a seminar about global perspectives on inflation and the post-Covid recovery. The seminar starts at 11.30 CET. Note that the Swedish bond market closes at 12.00 CET today.
USD/CAD Daily Outlook
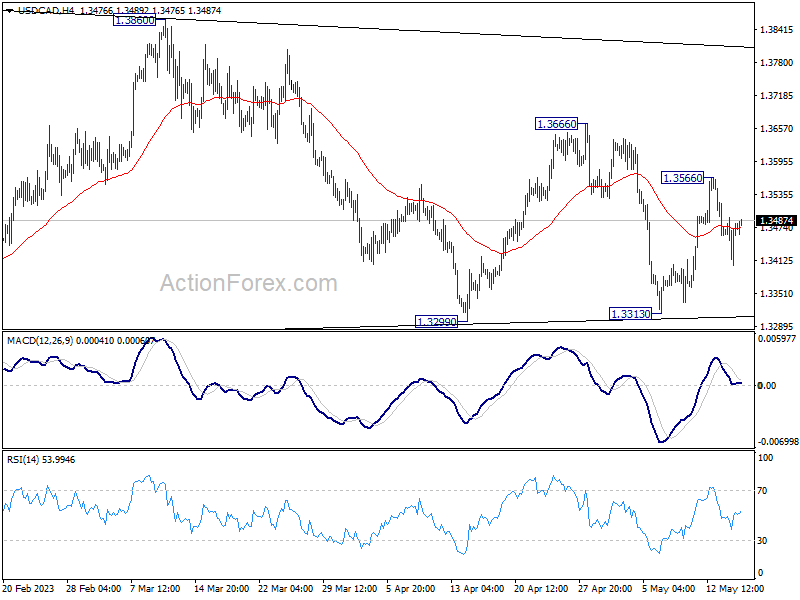
Daily Pivots: (S1) 1.3424; (P) 1.3459; (R1) 1.3513; More....
Intraday bias in USD/CAD stays neutral at this point. Overall, the pair is seen as extending the triangle consolidation pattern from 1.3976. Above 1.3566 will resume the rebound towards 1.3666 resistance and then 1.3860. However, firm break of 1.3313 support will invalidate this view and indicate that deeper correction is underway.
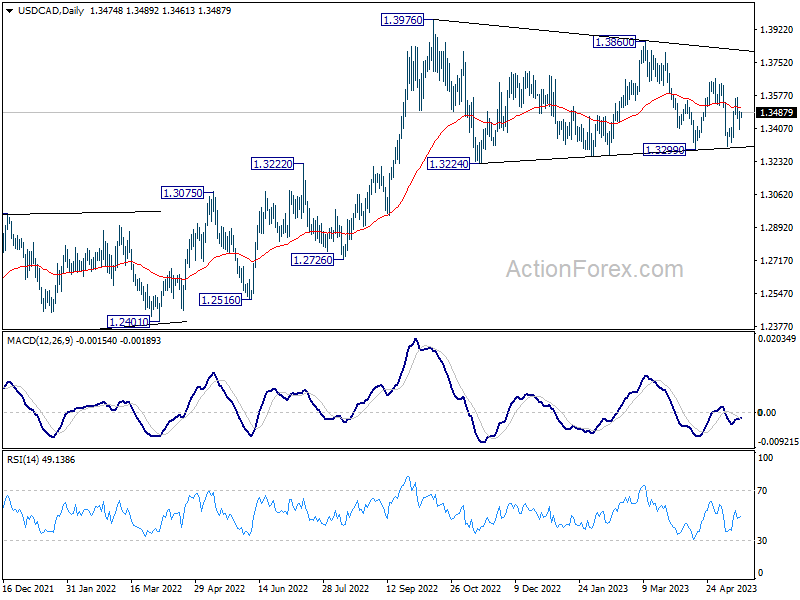
In the bigger picture, as long as 55 W EMA (now at 1.3321) holds, up trend from 1.2005 (2021 low) is still in favor to resume through 1.3976 at a later stage. However, sustained trading below the EMA and 38.2% retracement of 1.2005 to 1.3976 at 1.3233 will raise the chance of bearish reversal. Deeper should then be seen to 61.8% retracement at 1.2758 next.
AUD/USD Daily Report
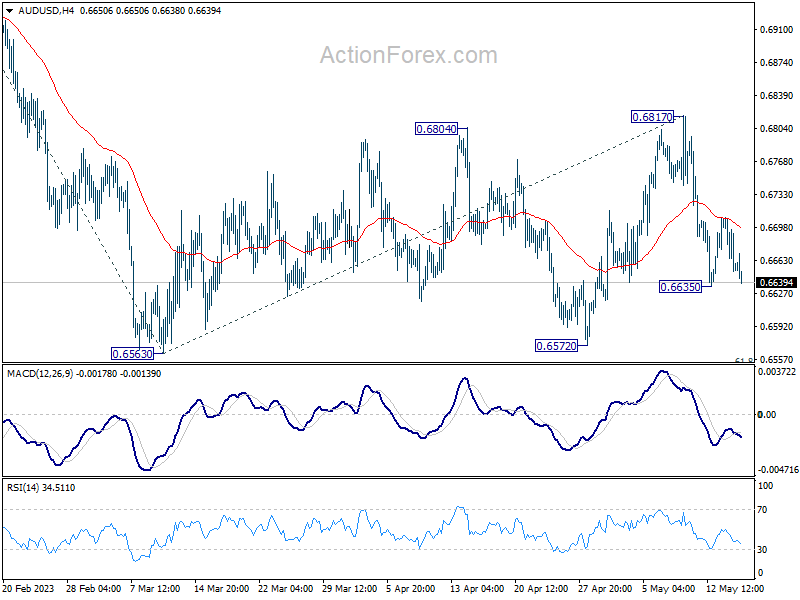
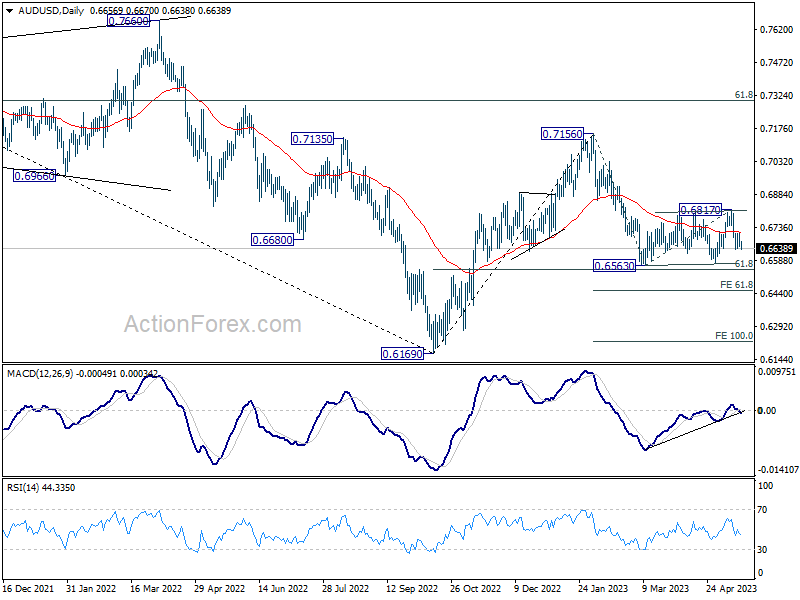
Daily Pivots: (S1) 0.6634; (P) 0.6672; (R1) 0.6693; More...
Intraday bias in AUD/USD remains neutral first, and risk will stay on the downside as long as 0.6817 resistance holds. Consolidation pattern from 0.6563 could have completed with three waves to 0.6817. Below 0.6635 will bring retest of 0.6563 low first. Decisive break there will resume larger decline from 0.7156 to 61.8% projection of 0.7156 to 0.6563 from 0.6817 at 0.6451.
In the bigger picture, the failure to break through 55 W EMA (now at 0.6822) keeps medium term outlook bearish. Firm break of 61.8% retracement of 0.6169 to 0.7156 at 0.6546 will raise the chance of long term down trend resumption through 0.6169 low. This will now be the favored case as long as 0.6817 resistance holds.
EUR/USD Daily Outlook
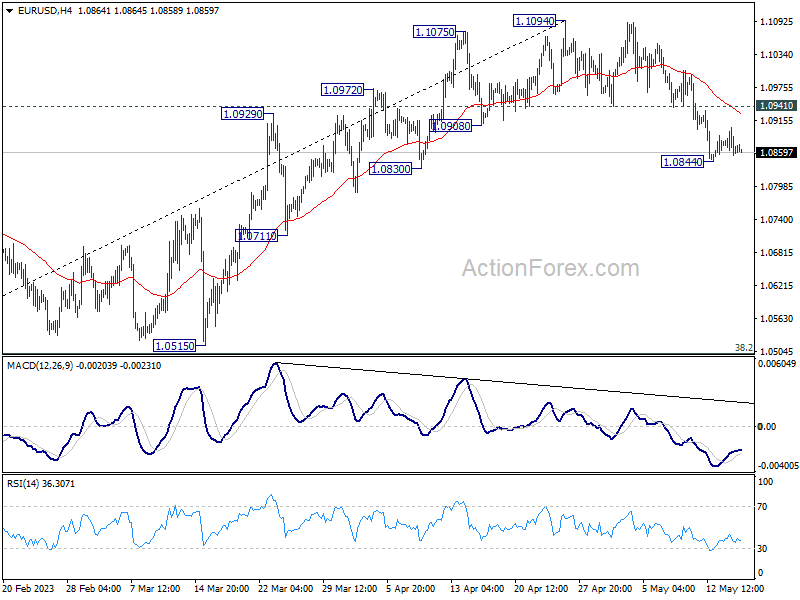
Daily Pivots: (S1) 1.0844; (P) 1.0874; (R1) 1.0894; More...
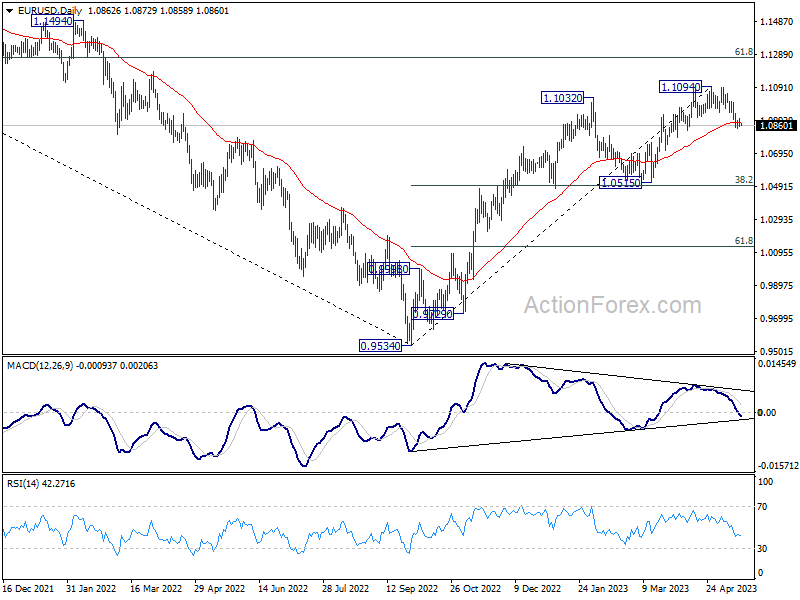
Intraday bias in EUR/USD stays neutral and further decline is expected with 1.0941 minor resistance intact. Fall from 1.1094 short term top is seen as correcting whole up trend from 0.9534. Below 1.0844 will target 1.0515 cluster support, 38.2% retracement of 0.9534 to 1.1094 at 1.0498. On the upside, though, above 1.0941 resistance will turn bias back to the upside for retesting 1.1094 high.
In the bigger picture, as long as 1.0515 support holds, rise from 0.9534 (2022 low) would still extend higher. Sustained break of 61.8% retracement of 1.2348 (2021 high) to 0.9534 at 1.1273 will solidify the case of bullish trend reversal and target 1.2348 resistance next (2021 high).
GBP/USD Daily Outlook
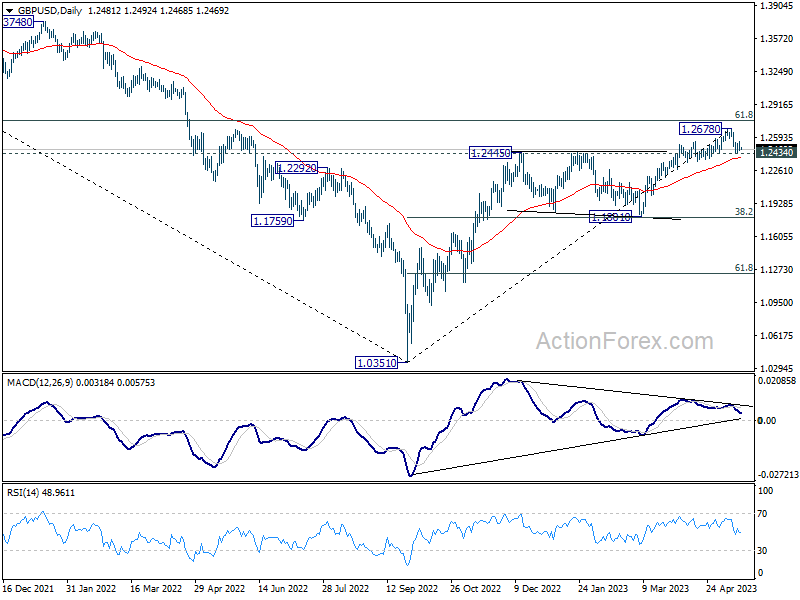
Daily Pivots: (S1) 1.2452; (P) 1.2499; (R1) 1.2532; More...
GBP/USD is still bounded in range below 1.2678 and intraday bias stays neutral for the moment. On the downside, firm break of 1.2434 will confirm short term topping at 1.2678, on bearish divergence condition in 4H MACD. Intraday bias will be back on the downside for 1.1801 cluster support (38.2% retracement of 1.0351 to 1.2678 at 1.1789), as correction to whole up trend from 1.0351. On the upside, however, break of 1.2678 will resume larger up trend from 1.0351 instead.
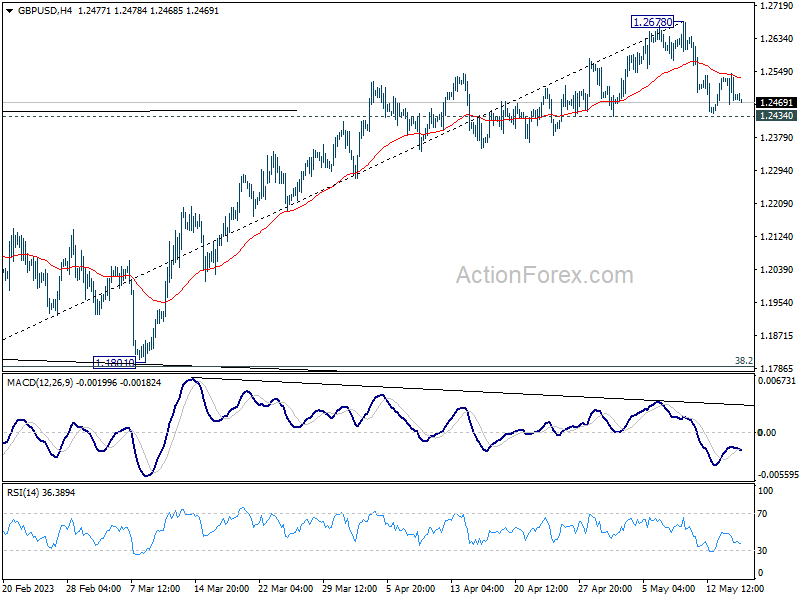
In the bigger picture, as long as 1.1801 support holds, rise from 1.0351 medium term bottom (2022 low) is expected to extend further. Sustained break of 61.8% retracement of 1.4248 (2021 high) to 1.0351 at 1.2759 will add to the case of long term bullish trend reversal. However, firm break of 1.1801 will indicate rejection by 1.2759, and bring deeper decline, even as a correction.
USD/CHF Daily Outlook
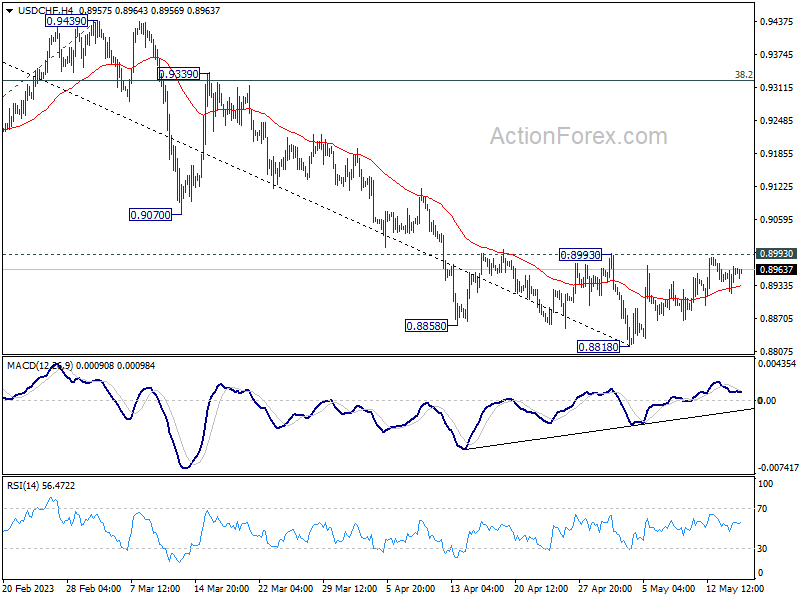
Daily Pivots: (S1) 0.8932; (P) 0.8951; (R1) 0.8983; More...
No change in USD/CHF's outlook as range trading continues and intraday bias stays neutral. On the upside, decisive break of 0.8993 resistance will confirm short term bottoming at 0.8818, on bullish convergence condition in 4H MACD. Intraday bias will be turned back to the upside for 55 D EMA (now at 0.9045) and possibly above. In case of another fall, strong support should be seen from 61.8% projection of 1.0146 to 0.9058 from 0.9439 at 0.8767, which is close to 0.8756 long term support, to bring rebound.
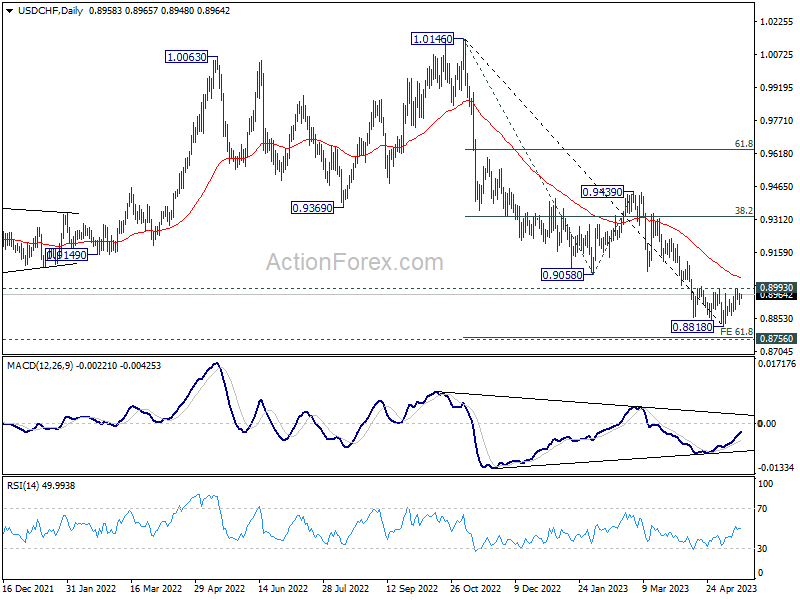
In the bigger picture, fall from 1.1046 (2022 high) is seen as a leg in the long term range pattern from 1.0342 (2016 high). So, downside should be contained by 0.8756 to bring reversal. Sustained break of 0.9058 support turned resistance will be the first sign of medium term bottoming. However, decisive break of 0.8756 will carry larger bearish implications.
Technical Outlook and Review
DXY:
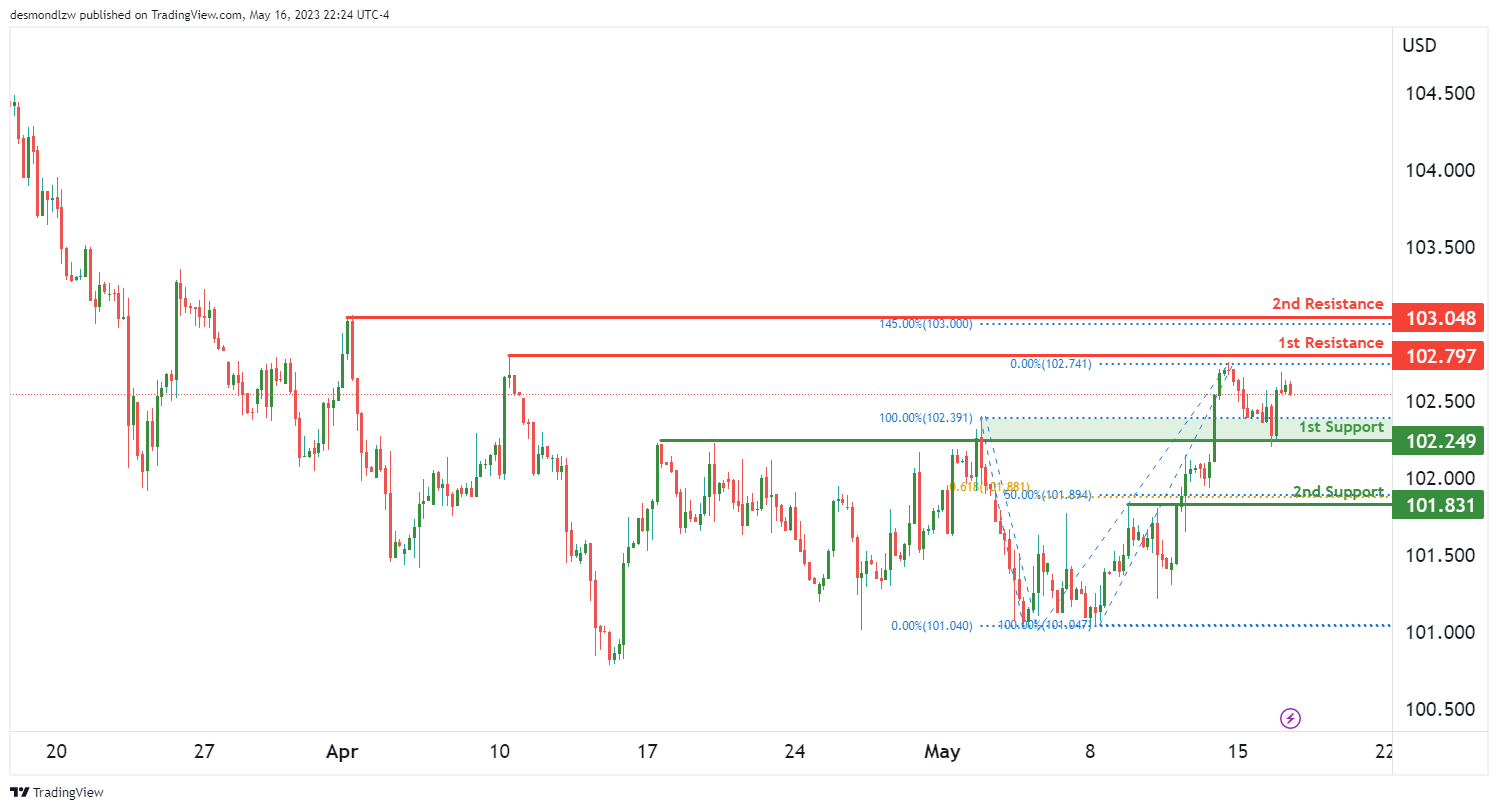
In the context of the DXY, we’re witnessing a weak bullish momentum with low confidence. This suggests a potential bullish continuation towards the 1st resistance, although we should be cautious due to the low confidence in the momentum.
Currently, DXY is being underpinned by a strong 1st support level at 102.24. The strength of this support level comes from it being an overlap support, a phenomenon that often suggests price stability at that level.
Should the price take a downturn, we have our 2nd support firmly established at 101.83. This particular level is characterized as a pullback support, and it aligns with a 61.8% Fibonacci retracement, which often represents a critical inflection point for price movement.
On the upside, if the DXY continues its bullish move, our 1st resistance stands at 102.79. This level is a swing high resistance, hinting that it was a former peak which might present some challenge for the bulls.
In the event of a more substantial bullish breakout, the DXY could potentially ascend towards our 2nd resistance up at 103.04. This is another swing high resistance point and happens to line up with a 145% Fibonacci extension, which may add to the resistance level’s robustness.
Despite the overall weak bullish momentum, it’s essential to consider the potential for price fluctuations. If DXY were to break the 1st resistance, it could trigger a bullish continuation towards the 2nd resistance. However, if DXY falls below the 1st support, it might find its next base at the 2nd support.
EUR/USD:
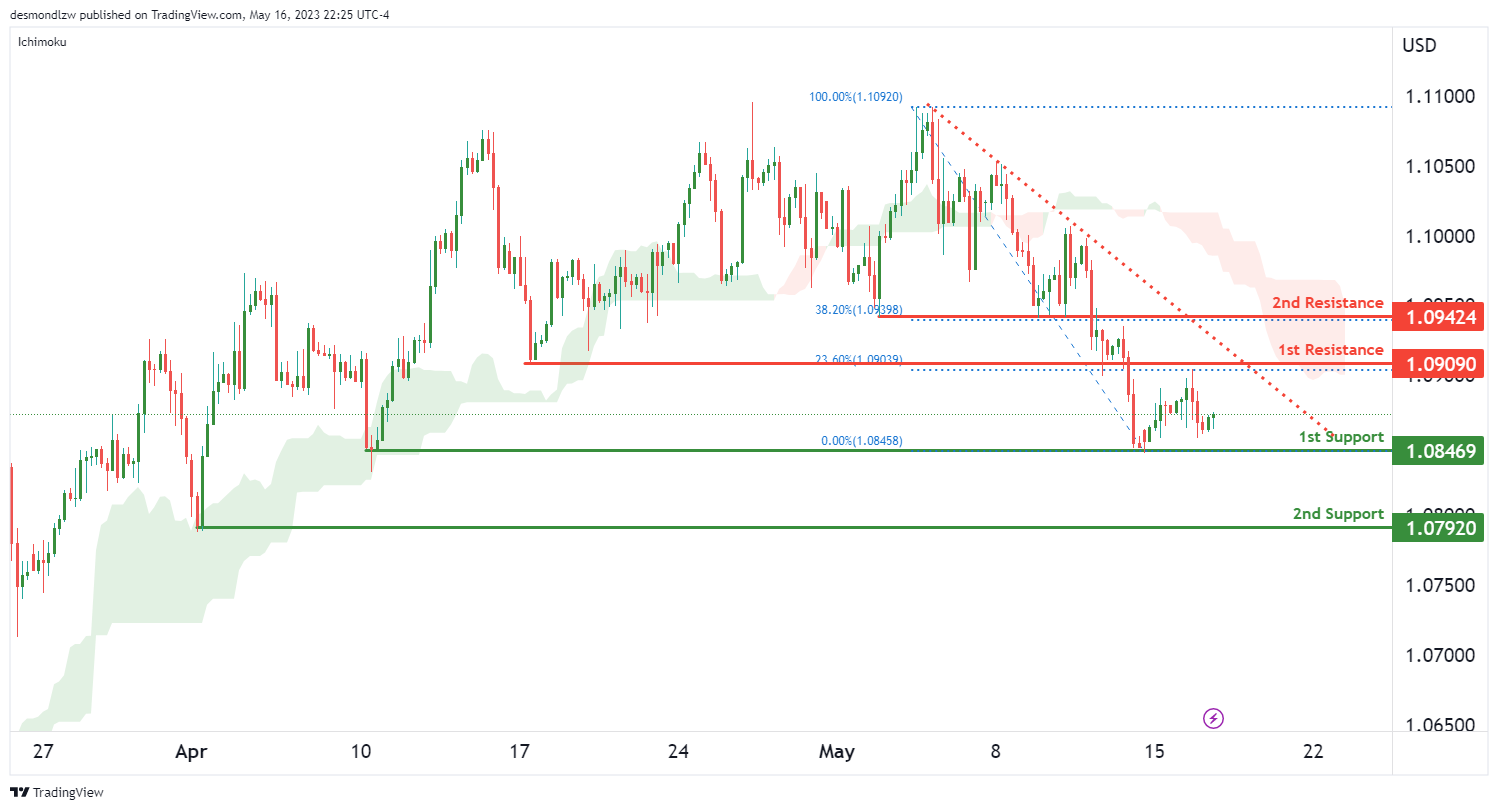
For the EUR/USD, we are currently witnessing a bearish momentum. Notably, the price is below a major descending trend line, suggesting that further bearish momentum may be in the cards. Moreover, the price is also positioned below the bearish Ichimoku cloud, reinforcing the overall bearish bias.
As such, there could potentially be a bearish reaction off the 1st resistance, leading to a drop down to the 1st support level.
Our 1st support is standing at 1.0846. This level acts as a multi-swing low support, often indicating a robust defensive line for the bears. Should the price continue to drop, we have our 2nd support at 1.0792, which is a swing low support point, suggesting that it has previously been a level where the price has found support.
On the flip side, if the EUR/USD attempts a rebound, it will meet our 1st resistance at 1.0909. This level is an overlap resistance and also lines up with a 23.6% Fibonacci retracement, indicating a potentially challenging barrier for the bulls.
In the event of a more pronounced bullish reversal, the EUR/USD could potentially rise towards our 2nd resistance at 1.0942. This level is another overlap resistance point and lines up with a 38.2% Fibonacci retracement, which could add to the resistance level’s strength.
GBP/USD:
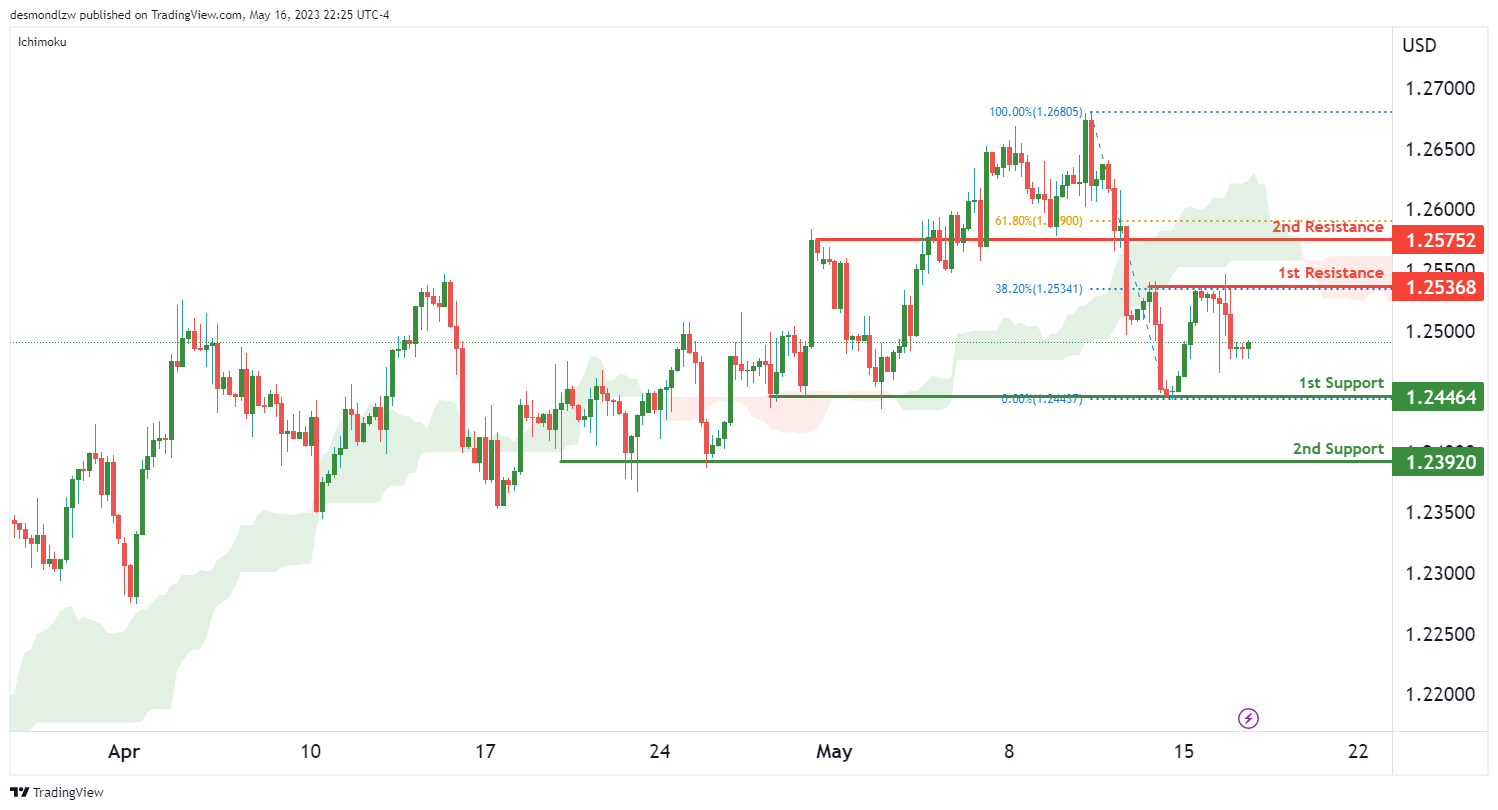
Presently, the GBP/USD is exhibiting a bearish momentum. The price is positioned below a significant descending trend line, which signals that bearish momentum might be in the offing. Furthermore, the price is lodged beneath the bearish Ichimoku cloud, solidifying the overall bearish outlook.
Given this context, there’s a likelihood for a bearish continuation towards the 1st support.
Our 1st support stands firmly at 1.2446. This level serves as a multi-swing low support, indicating it’s been a point of rebound multiple times in the past. In the event of a deeper bearish push, we have a second line of defense in our 2nd support at 1.2392, another multi-swing low support point that could prove to be a robust barrier for the bears.
In contrast, if the GBP/USD attempts a recovery, it will encounter our 1st resistance at 1.2536. This resistance is a multi-swing high resistance and aligns with a 38.2% Fibonacci retracement, suggesting a potential challenge for the bulls.
Should there be a more significant bullish reversal, the GBP/USD could potentially climb towards our 2nd resistance at 1.2575. This resistance point is characterized as a pullback resistance and is in line with a 61.8% Fibonacci retracement, which might add to the resistance level’s strength.
USD/CHF:
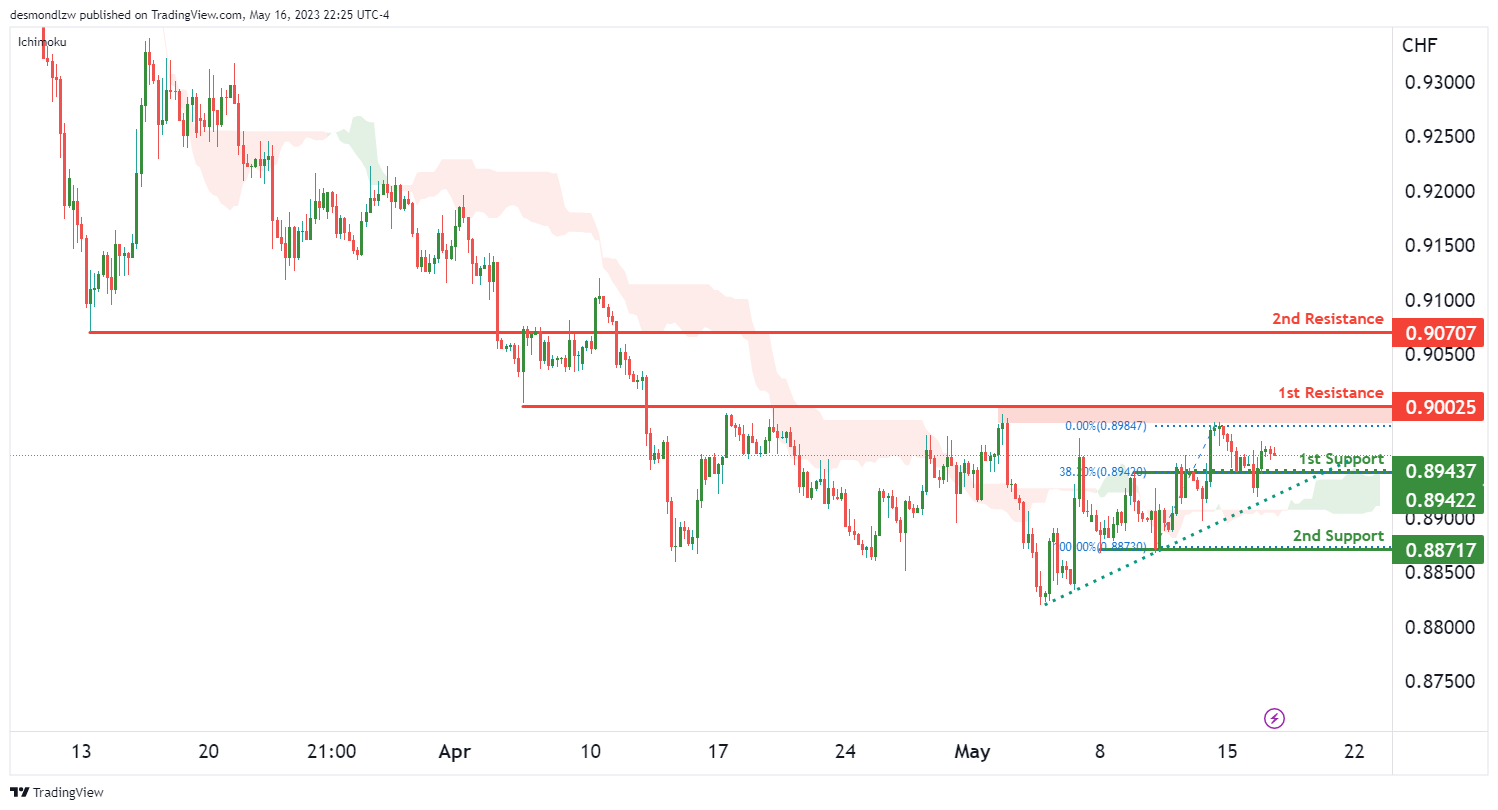
For the USD/CHF, we are currently seeing a bullish momentum. The price is positioned above a significant ascending trend line, suggesting that further bullish momentum might be on the horizon. Additionally, the price is perched above the bullish Ichimoku cloud, which strengthens the overall bullish bias.
With this in mind, there’s potential for a bullish bounce off the 1st support, propelling the price towards the 1st resistance.
Our 1st support stands robustly at 0.8943. This level is characterized as an overlap support and lines up with a 38.2% Fibonacci retracement, often indicating a key level for price reaction. Should the price dip lower, we have our 2nd support at 0.8871, a multi-swing low support point, suggesting that it has previously been a level where price found support.
Conversely, if the USD/CHF continues its upward trajectory, it will encounter our 1st resistance at 0.9002. This level is an overlap resistance, hinting that it could pose a challenge for the bulls.
If there’s a more substantial bullish breakout, the USD/CHF could potentially surge towards our 2nd resistance at 0.9070. This level is another overlap resistance point, which could add to the resistance level’s robustness.
USD/JPY:
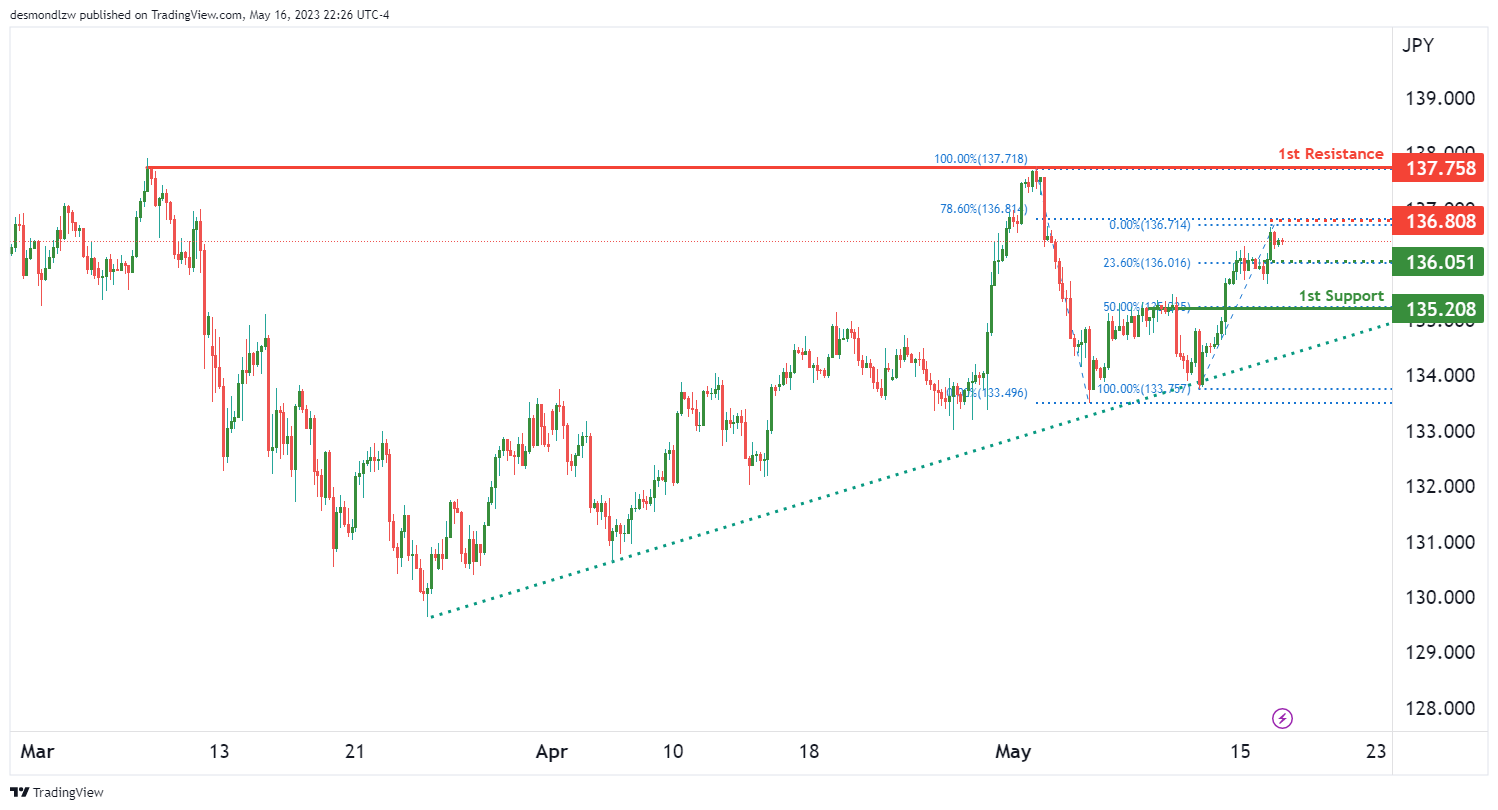
The USD/JPY is currently exhibiting bullish momentum. The price is positioned above a significant ascending trend line, suggesting that further bullish momentum might be on the cards.
Given this context, there’s a likelihood for a bullish continuation towards the 1st resistance.
Our 1st support stands firmly at 135.20. This level serves as a pullback support, aligning with a 50% Fibonacci retracement, indicating it’s a key level for price reaction. Between the current price and our 1st support, we have an intermediate support at 136.05, which is a pullback support that lines up with a 23.6% Fibonacci retracement.
In contrast, if the USD/JPY continues its bullish journey, it will encounter our 1st resistance at 137.75. This resistance is a multi-swing high resistance, suggesting a potential challenge for the bulls. Before reaching the 1st resistance, the price might face an intermediate resistance at 136.80, which is a swing high resistance and aligns with a 78.6% Fibonacci retracement.
Given the overall bullish momentum, it’s important to anticipate potential price movements. If the USD/JPY continues its bullish momentum, it could touch the 1st resistance. However, if the USD/JPY falls below the intermediate support, it could potentially drop to the 1st support.
AUD/USD:
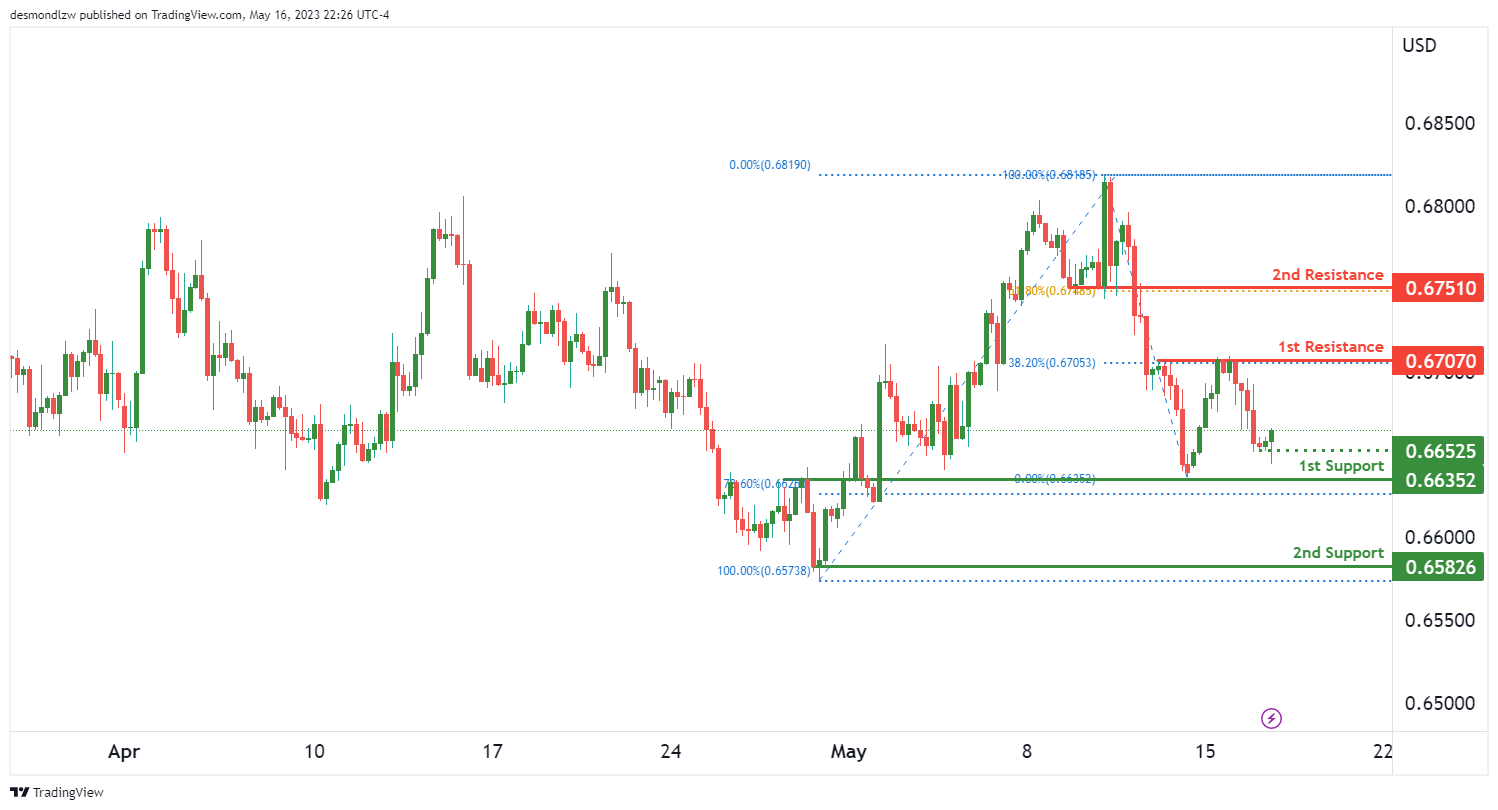
Given this context, there’s potential for a bearish break off the 1st support, leading the price to drop towards the 2nd support.
Our 1st support stands robustly at 0.6635. This level is an overlap support that aligns with a 78.6% Fibonacci retracement, indicating it’s a key level for price reaction. If the price were to break below this level, we have our 2nd support at 0.6582. This level is a multi-swing low support point that coincides with a 23.6% Fibonacci retracement, further validating its significance.
Conversely, if the AUD/USD were to rebound, it will encounter our 1st resistance at 0.6707. This level is a multi-swing high resistance, which aligns with a 38.2% Fibonacci retracement, suggesting a potential challenge for the bulls.
Should there be a substantial bullish reversal, the AUD/USD could potentially surge towards our 2nd resistance at 0.6751. This level is a swing high resistance point that coincides with a 61.8% Fibonacci retracement.
NZD/USD
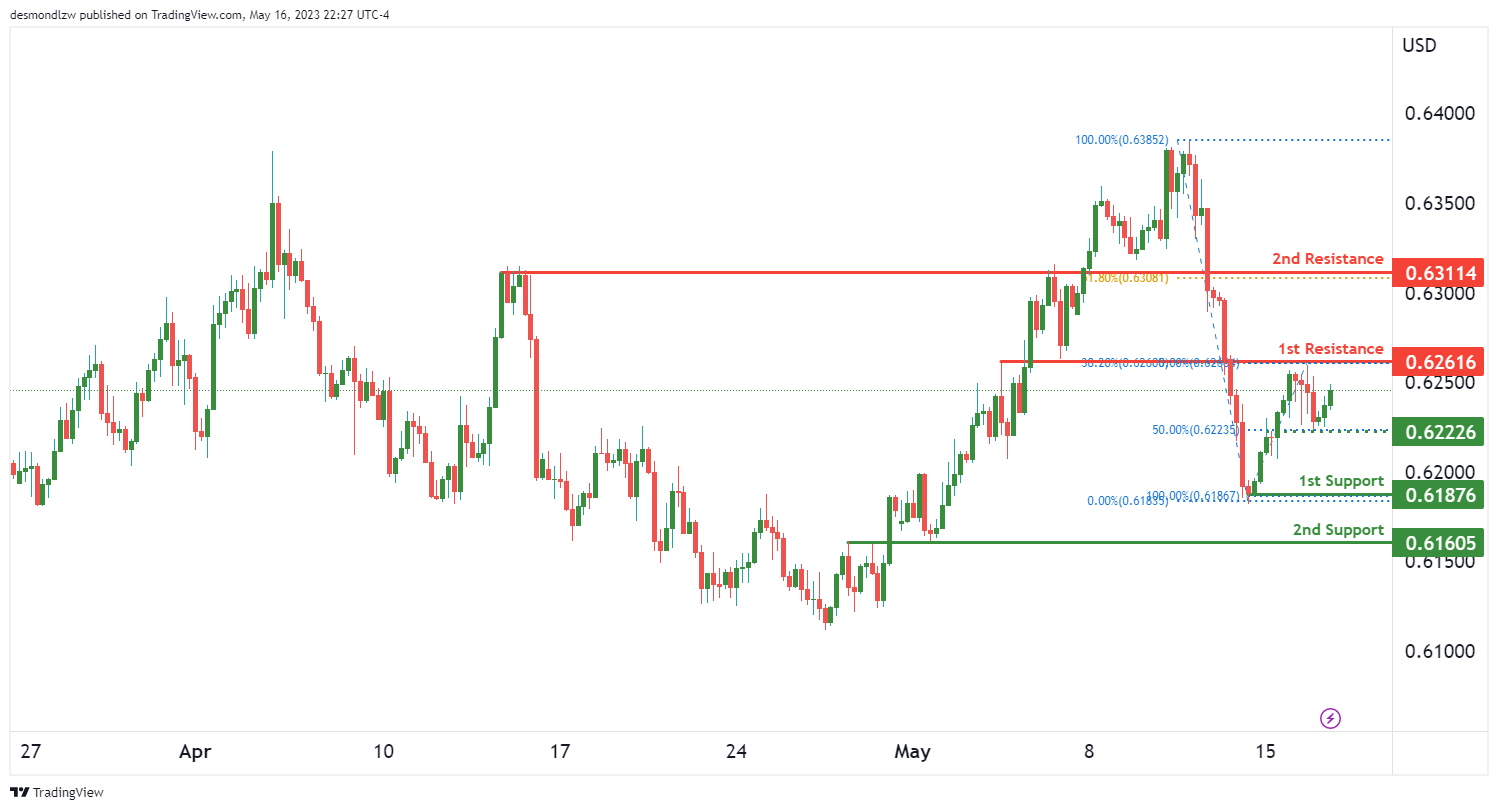
The NZD/USD chart is currently displaying weak bearish momentum with low confidence. In this context, there’s a potential for a bearish continuation towards the 1st support.
Our 1st support stands solid at 0.6187. This level is a swing low support and could be a key area for price reaction. If the price were to breach this level, we have our 2nd support at 0.6160. This level serves as an overlap support, giving it further significance.
However, an intermediate support at 0.6222, which is an overlap support coinciding with a 50% Fibonacci retracement, lies between the current price and our 1st support. A break of this intermediate support could trigger a bearish acceleration towards our 1st support.
On the upside, if NZD/USD were to bounce back, it will encounter our 1st resistance at 0.6261. This level is an overlap resistance, which coincides with a 38.2% Fibonacci retracement, suggesting a potential obstacle for the bulls.
In the event of a significant bullish reversal, the NZD/USD could potentially rise towards our 2nd resistance at 0.6311. This level serves as a pullback resistance and lines up with a 61.8% Fibonacci retracement.
Given the overall weak bearish momentum, it’s crucial to anticipate potential price movements. If the NZD/USD were to break below the 1st support, it could trigger a bearish movement towards the 2nd support. However, if NZD/USD rebounds from the 1st support, it could potentially rise to the 1st resistance.
USD/CAD:
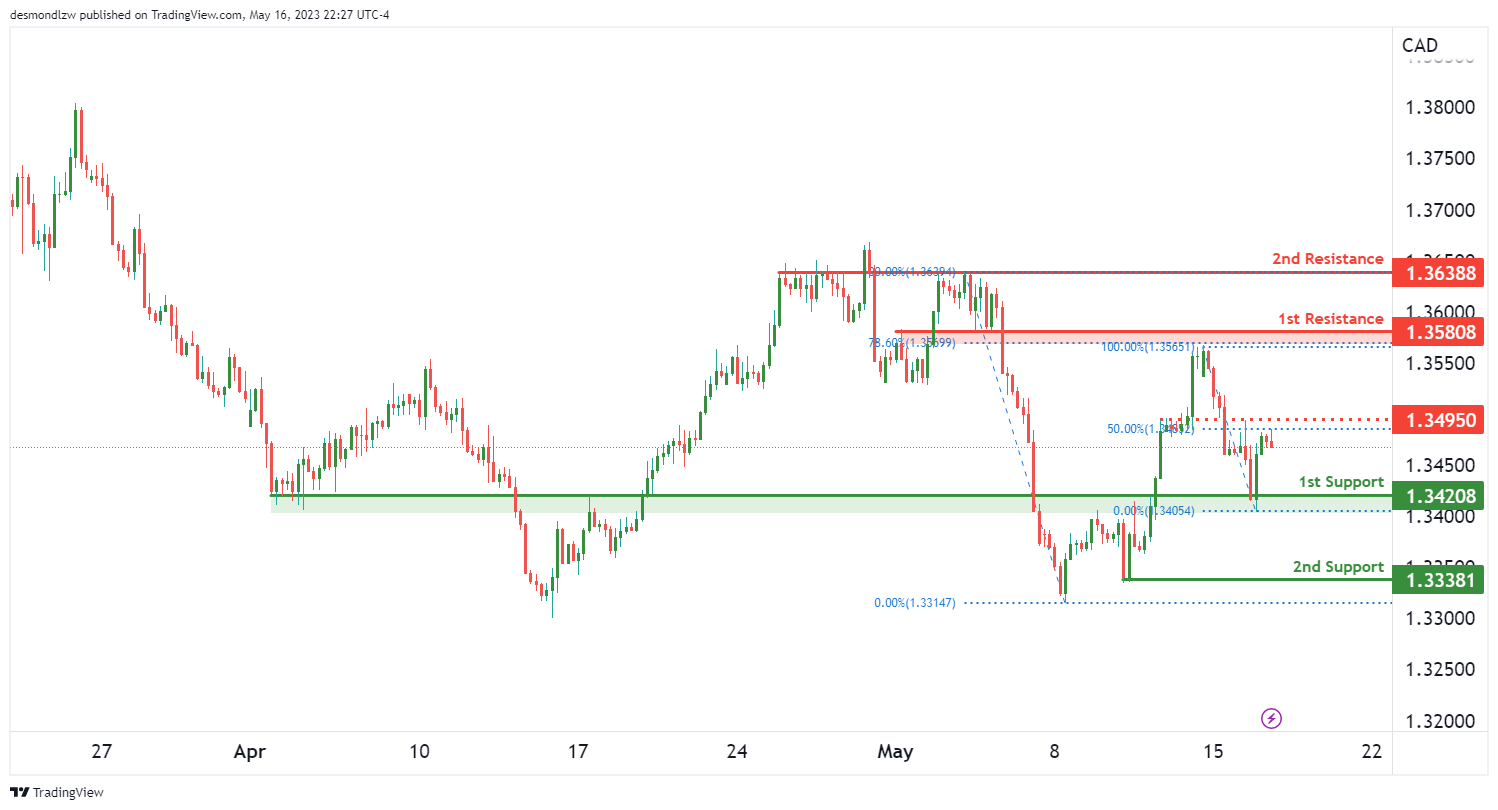
Currently, the USD/CAD chart is showing a bearish momentum. This suggests there’s a potential for a bearish continuation towards the 1st support.
Our 1st support is found at 1.3420. This level presents an overlap support, making it an area of interest for potential price reactions. If the price were to break through this level, we could see a drop towards the 2nd support at 1.3338, a level which has acted as a multi-swing low support in the past.
However, there’s an intermediate resistance at 1.3495 that could play a significant role. This overlap resistance aligns with a 50% Fibonacci retracement, making it a notable barrier for the price. If the price were to break this intermediate resistance, it might trigger a bullish acceleration towards our 1st resistance.
On the bullish side, if the USD/CAD were to reverse and bounce back, it could run into our 1st resistance at 1.3580. This level serves as an overlap resistance and coincides with a 78.6% Fibonacci retracement, suggesting a potential hurdle for the bulls.
If the price were to break through our 1st resistance, it could potentially rise towards our 2nd resistance at 1.3638. This level also serves as an overlap resistance, adding to its significance.
DJ30:
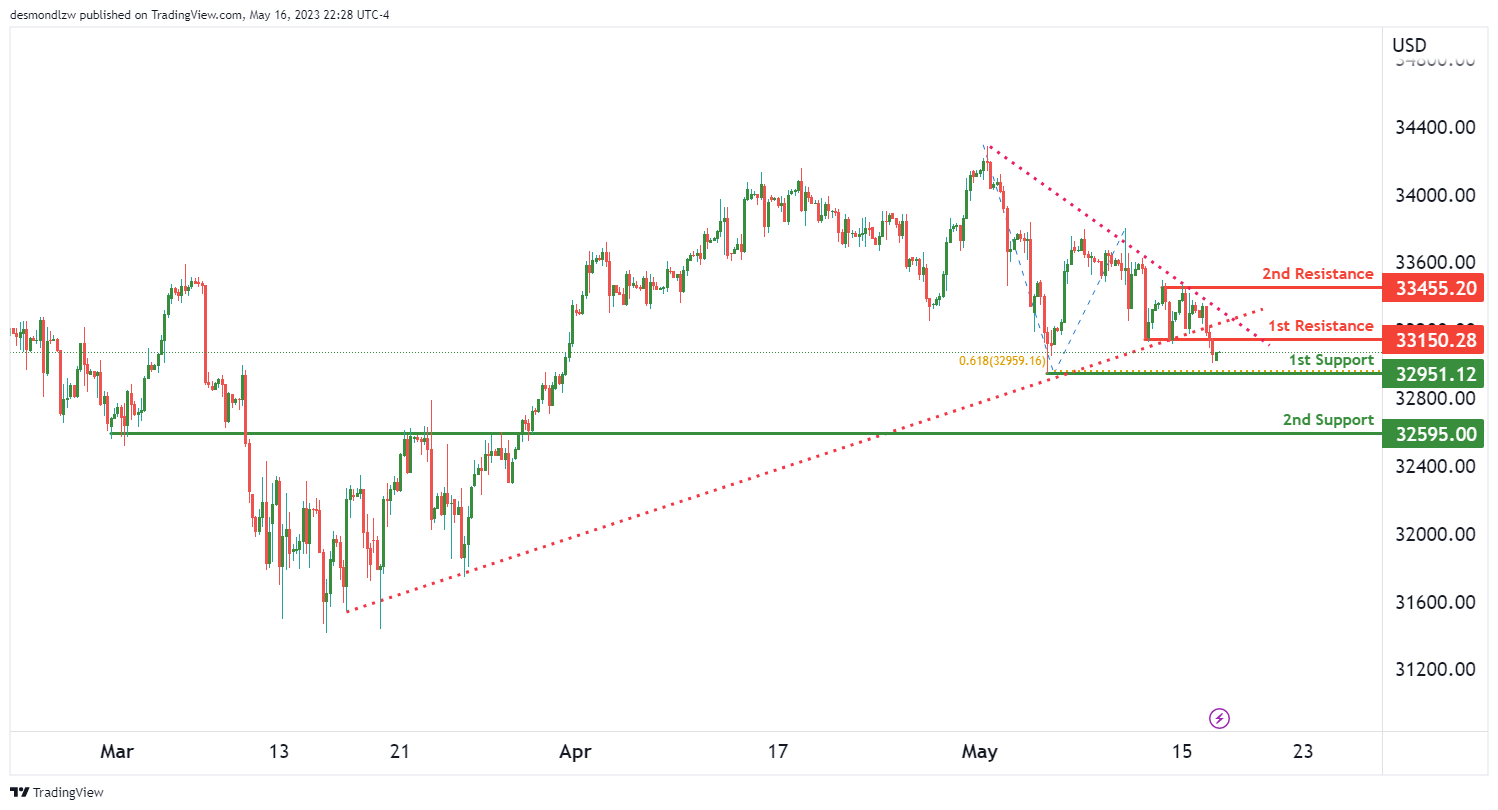
THe DJ30 is exhibiting a bearish momentum. This suggests a potential for a bearish break off the 1st support and a subsequent drop towards the 2nd support.
The 1st support is situated at 32951.12. This level acts as a swing low support and coincides with a 61.8% Fibonacci projection, indicating a significant area for possible price reactions. If the price were to breach this level, it could fall towards the 2nd support at 32595.00, which has previously acted as an overlap support.
On the flip side, if the USD/CAD were to reverse its course and rally, it might encounter our 1st resistance at 33150.28. This level acts as a pullback resistance and could pose a challenge for the bulls.
Should the price break above our 1st resistance, it could potentially ascend towards our 2nd resistance at 33455.20. This level serves as a multi-swing high resistance, further reinforcing its significance.
Given the overall bearish momentum and the presence of a bearish symmetrical triangle, which is a bearish continuation chart pattern, it’s crucial to anticipate potential price movements. If the USD/CAD were to break below the 1st support, it could prompt a bearish move towards the 2nd support. However, if the USD/CAD rebounds from the 1st support, it could potentially climb to the 1st resistance.
GER30:
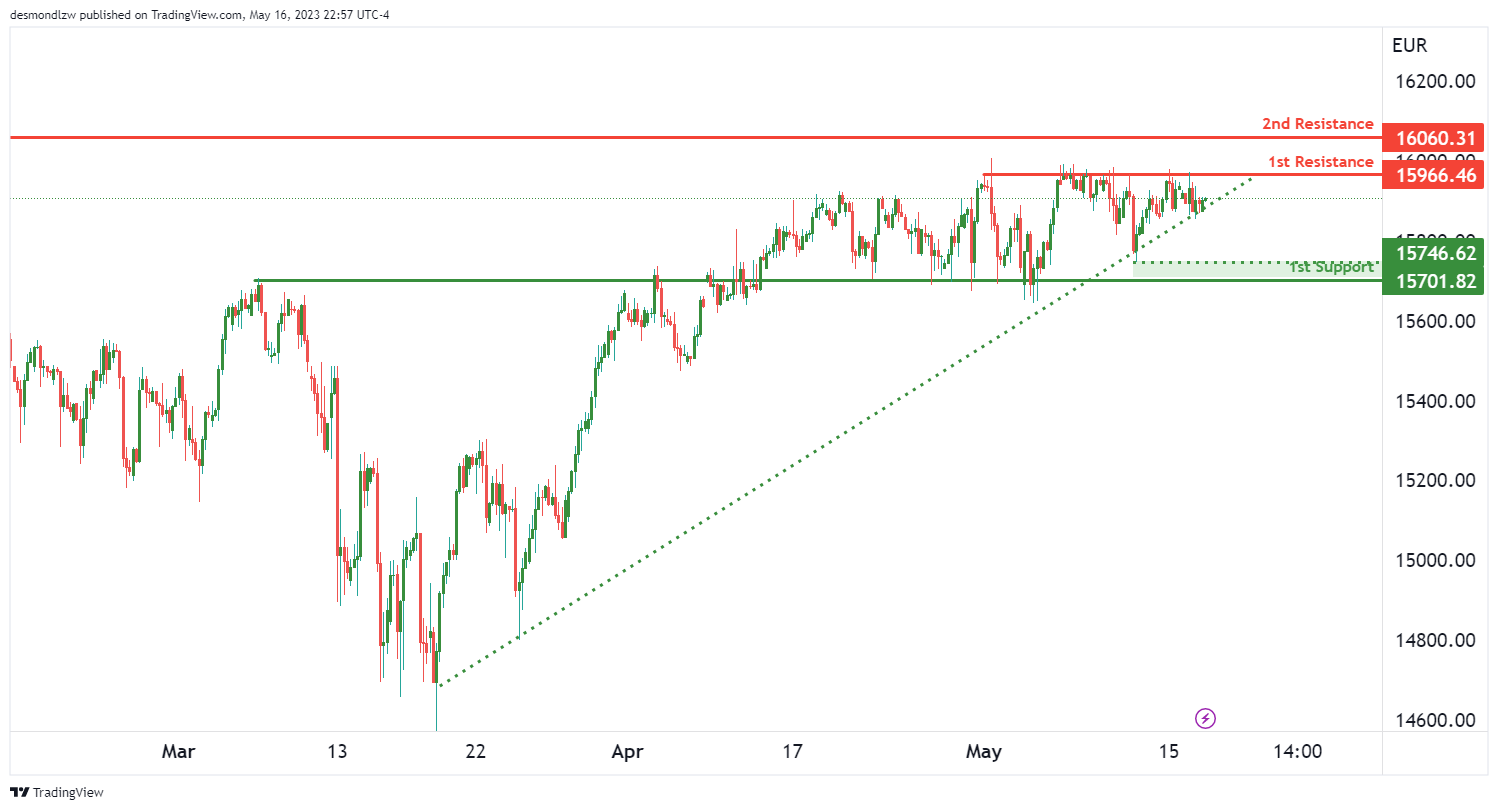
Currently, the GER30, or the German DAX index, is showcasing a bullish trend. This upward momentum is supported by the fact that the price is situated above a major ascending trend line, suggesting that further bullish momentum is on the horizon.
The potential for the GER30 is a bullish breakthrough of the first resistance level, leading to a rise towards the second resistance.
In the event of a market correction, the first line of support lies at 15701.82. This level has shown to be a reliable overlap support, providing a solid foundation for potential price rebounds.
Closer to the current price action, an intermediate support level is located at 15746.62. This level has previously acted as a swing low support, providing an additional layer of protection against bearish fluctuations.
On the other hand, if the bullish momentum persists, traders should watch out for the first resistance level at 15966.46. This multi-swing high resistance has the potential to hinder further upward movement.
If the market can overcome this first resistance, the next level to watch out for is the second resistance at 16060.31. This swing high resistance could present the next challenge for the bullish trend.
BTC/USD:
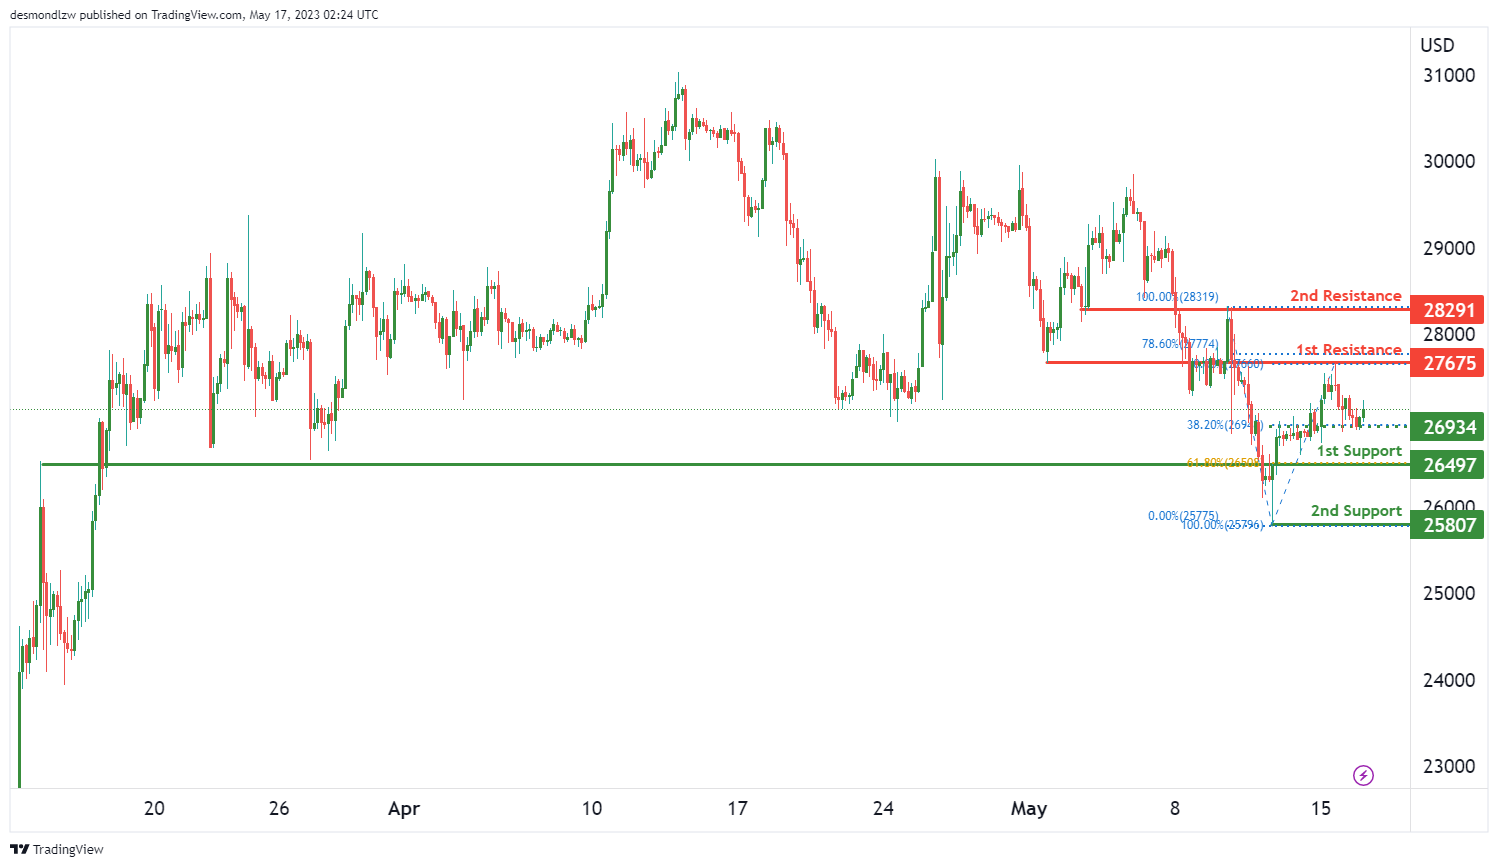
The Bitcoin (BTC) to US Dollar (USD) pair currently exhibits a bearish trend, with a potential for the price to continue moving towards the first support level.
At the moment, the first line of support for BTC/USD is at 26497. This level serves as a notable overlap support, and it aligns with the 61.80% Fibonacci retracement level, suggesting that it could be a significant area for potential price rebounds.
An intermediate support level is found at 26934. This level also functions as an overlap support and corresponds to the 38.20% Fibonacci retracement level, adding an extra layer of potential support closer to the current price action.
If the bearish momentum persists, the price could potentially drop to the second support level at 25807, which has previously acted as a swing low support.
On the upside, if a reversal occurs, the first resistance level to watch is at 27675. This overlap resistance coincides with the 78.60% Fibonacci retracement level, which could serve as a substantial barrier to bullish movements.
Beyond that, the second resistance level is located at 28291, and it also acts as an overlap resistance, presenting another potential hurdle for any bullish resurgence.
US500
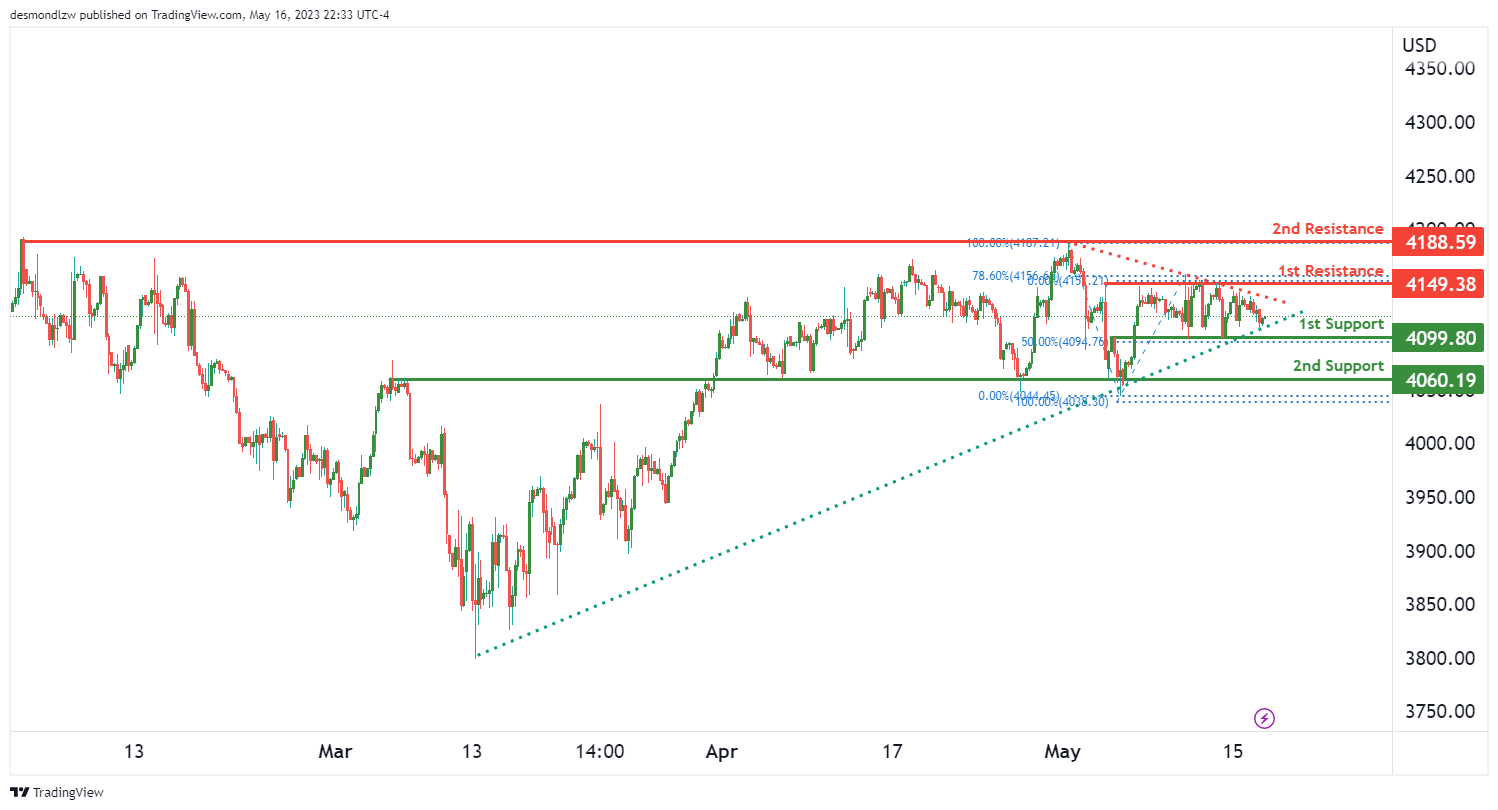
The US500, also known as the S&P 500 Index, is currently demonstrating a neutral momentum, suggesting that the price could potentially fluctuate between the first support and resistance levels.
The first line of support for the US500 is located at 4099.80, acting as an overlap support. This level could serve as a strong foundation for the price if a downward movement occurs.
Further below, the second support level stands at 4060.19. This level also functions as an overlap support, offering an additional layer of defense against a potential bearish turn.
On the upside, the first resistance level is found at 4149.38. This level, which has served as a multi-swing high resistance, could present a significant barrier to any bullish attempts.
Above that, the second resistance level is situated at 4188.59. This level has also acted as a multi-swing high resistance, and it could further impede upward movements.
Notably, the US500 is currently exhibiting a symmetrical triangle chart pattern. This pattern typically represents a period of consolidation before the price is forced to breakout or breakdown. A break above the upper trendline of the pattern could signal a bullish breakout, while a break below the lower trendline might indicate a bearish breakdown.
ETH/USD:
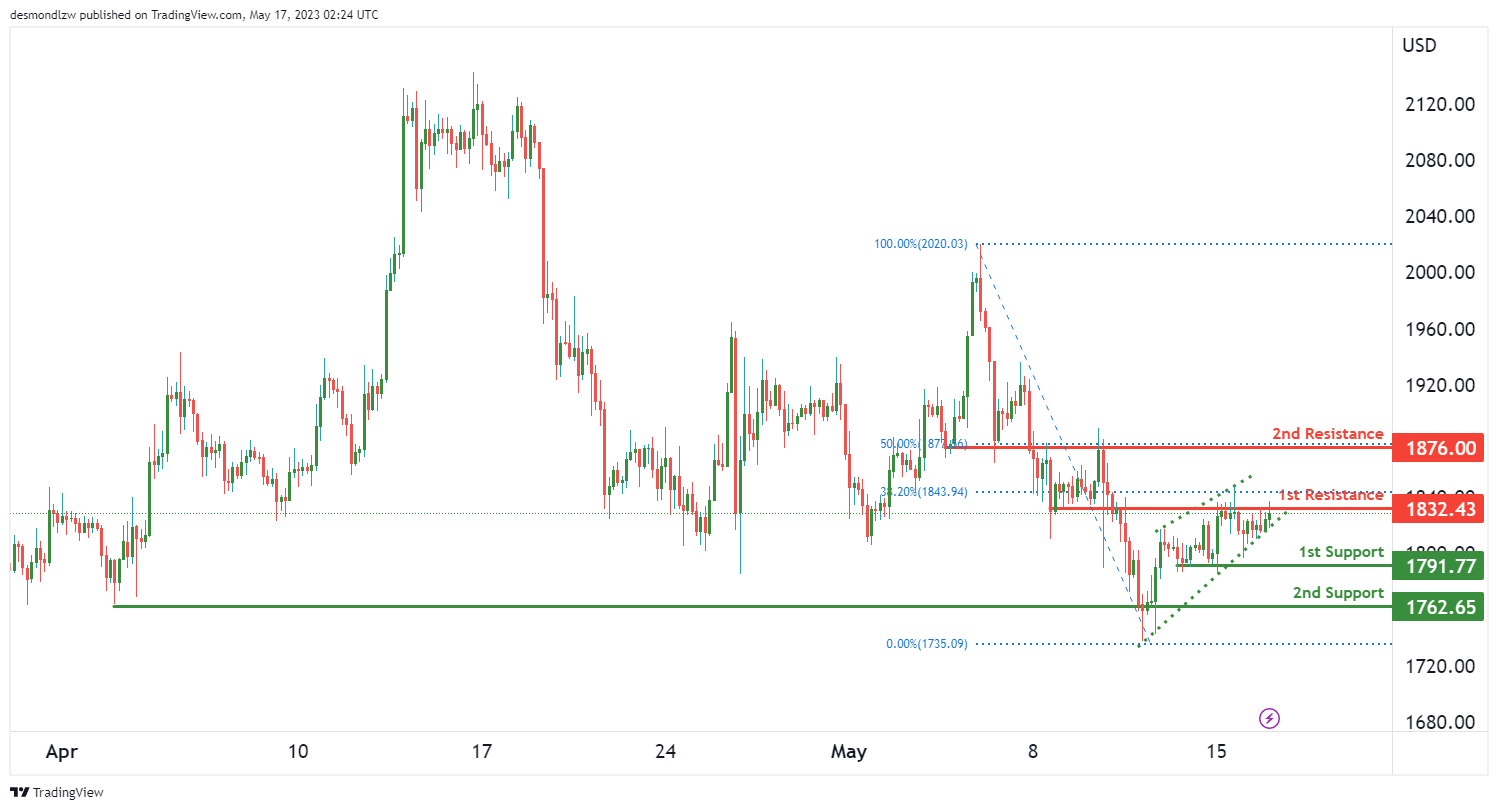
The ETH/USD pair is currently showing bearish momentum, suggesting that the price could potentially react off the first resistance level and drop to the first support level.
The first line of support for the ETH/USD is located at 1791.77. This level is serving as a multi-swing low support, which could offer a strong support if a downward price movement occurs.
The second support level is found slightly lower at 1762.65. This is another multi-swing low support level, offering an additional layer of defense against a potential bearish move.
On the upside, the first resistance level is set at 1832.43. This overlap resistance, further reinforced by a 38.20% Fibonacci retracement level, could be a significant hurdle for any bullish attempts.
Above that, the second resistance level is set at 1876.00. This level, also acting as an overlap resistance and accompanied by a 50% Fibonacci retracement level, could further challenge upward movements.
It’s noteworthy to mention that the pair is forming a bearish rising wedge pattern. This type of pattern typically signals that the price is likely to drop and move in the downward direction soon.
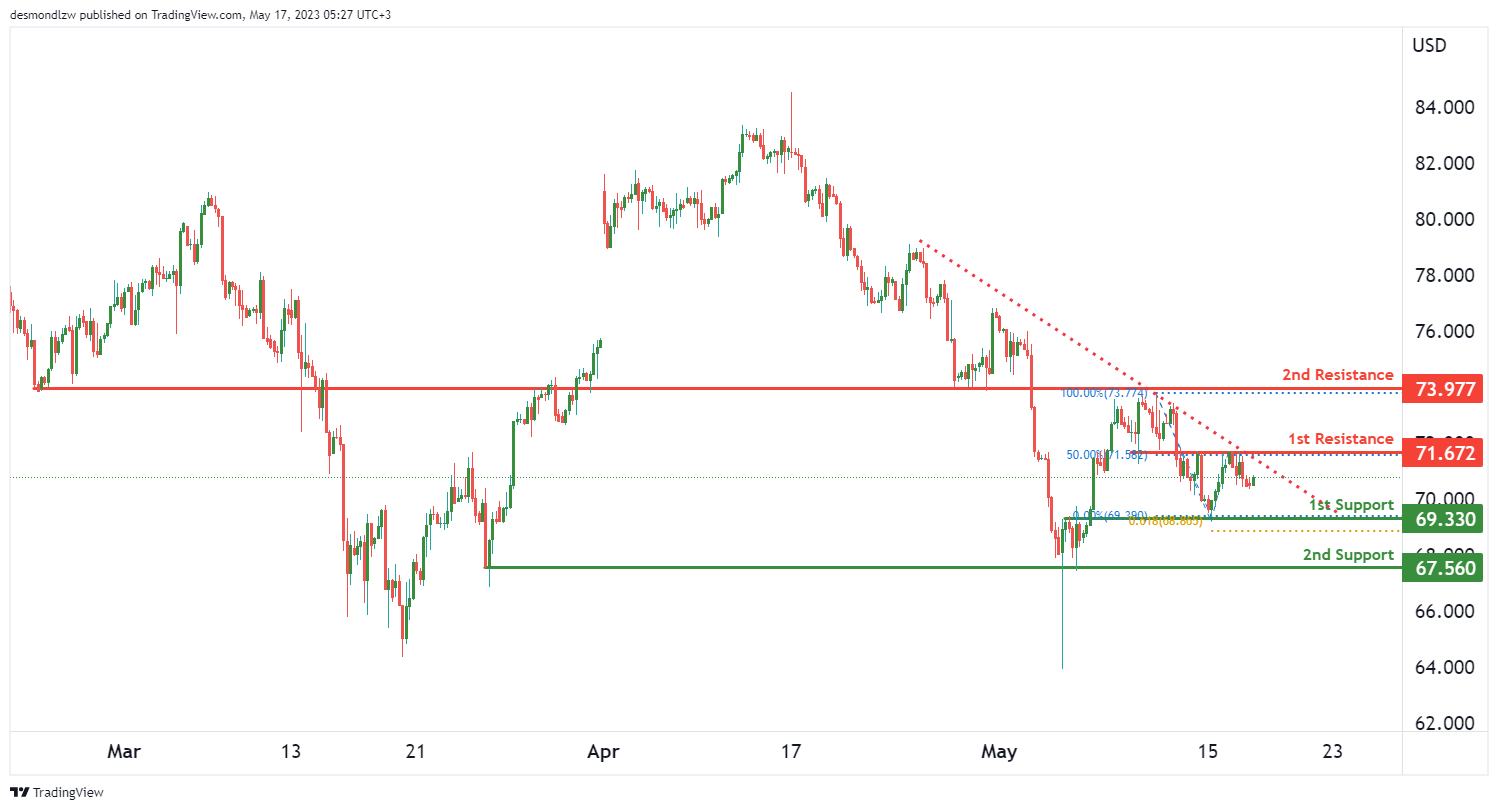
WTI/USD:
The WTI instrument is currently on a bearish momentum, suggested by the price being below a major descending trend line.
The first line of support for WTI is located at 69.33. This level is acting as an overlap support, further reinforced by a 61.80% Fibonacci projection level. This could offer a strong hold against further bearish movements.
The second support level is found slightly lower at 67.56. This is a multi-swing low support level, offering an additional layer of protection against a potential downward price move.
On the upside, the first resistance level is set at 71.67. This overlap resistance, accompanied by a 50% Fibonacci retracement level, could be a significant hurdle for any bullish attempts.
Above that, the second resistance level is set at 73.97. This level, also acting as an overlap resistance, could further challenge upward movements.
XAU/USD (GOLD):
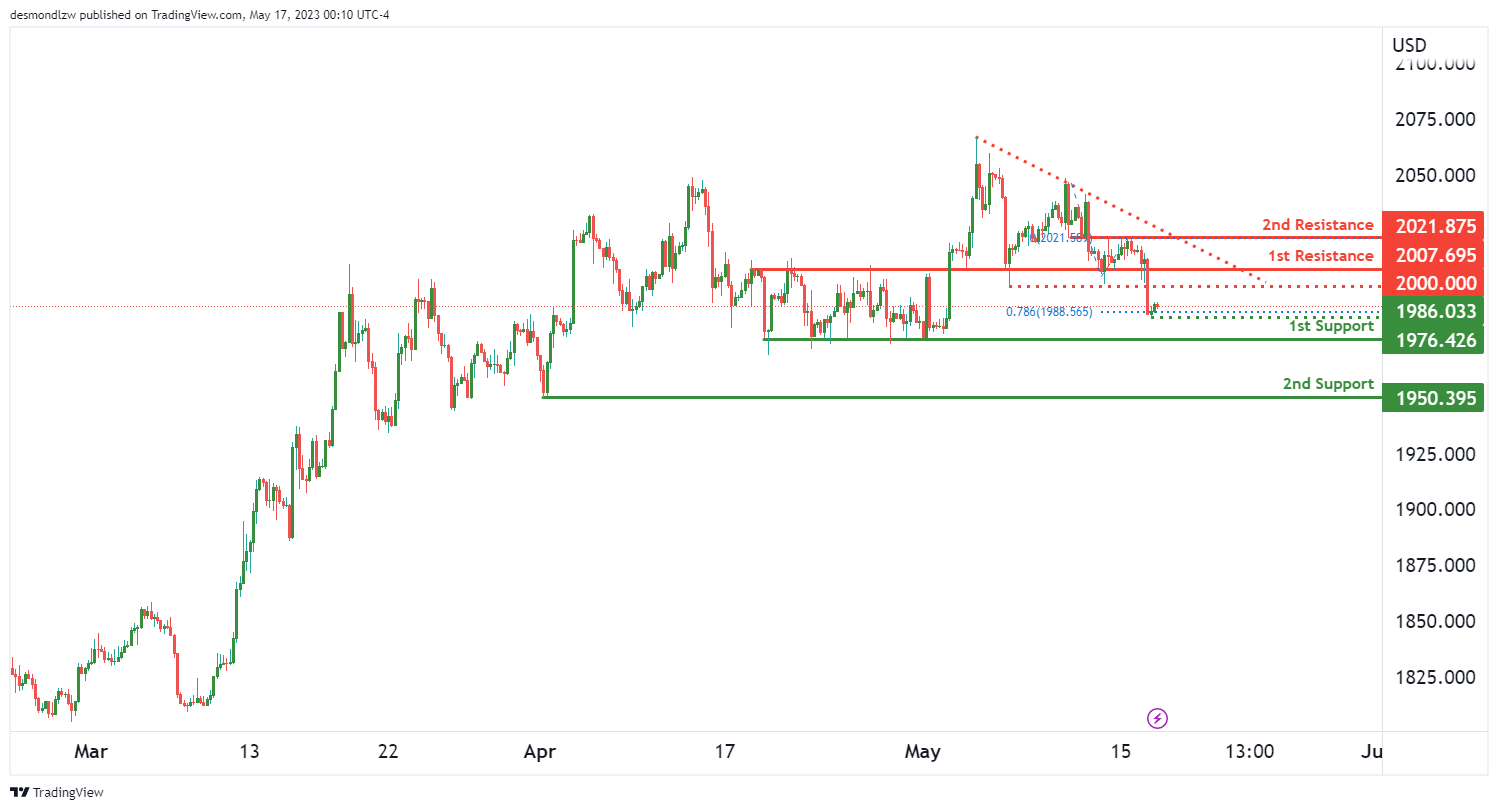
The XAU/USD pair is currently showing a bearish momentum as the price is below a major descending trend line, suggesting that further bearish momentum could be on the cards.
The first line of support for XAU/USD is located at 1976.42. This level is acting as a multi-swing low support and could offer a strong hold against further bearish movements.
The second support level is found slightly lower at 1950.39. This is also a multi-swing low support level, offering an additional layer of protection against a potential downward price move.
On the upside, the first resistance level is set at 2007.69. This pullback resistance could be a significant hurdle for any bullish attempts.
Above that, the second resistance level is set at 2021.87. This level, acting as an overlap resistance, could further challenge upward movements.
In between these levels, there’s an intermediate resistance point at 1986.03. This point, acting as a swing low support, is also aligned with the 78.60% Fibonacci projection, which could cause some price reactions.
USD/JPY Daily Outlook
Daily Pivots: (S1) 135.82; (P) 136.26; (R1) 136.82More...
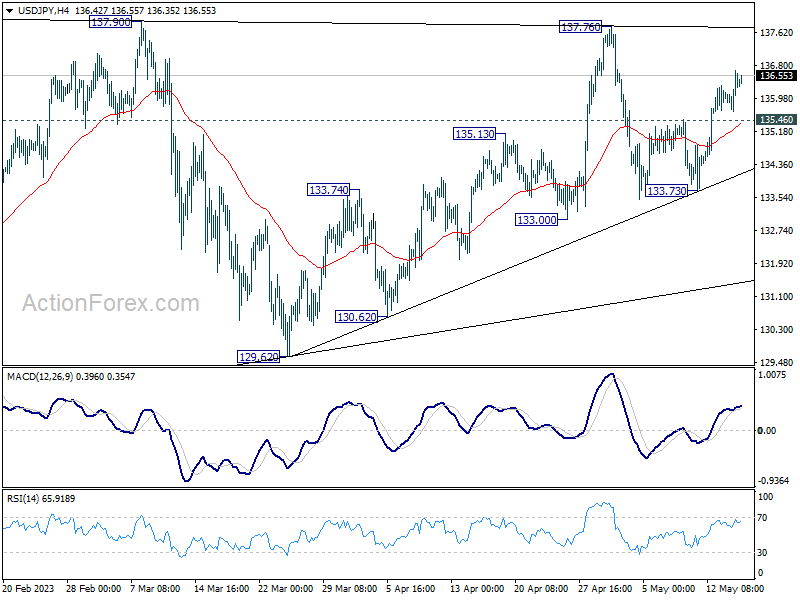
USD/JPY's rally from 133.73 is still in progress and intraday bias remains on the upside for 137.76/90 resistance zone. Decisive break there will resume whole rebound from 127.20. On the downside, though, below 135.46 minor support will turn bias back to the downside for 133.73. Firm break there will resume the fall from 137.76 through 133.00.
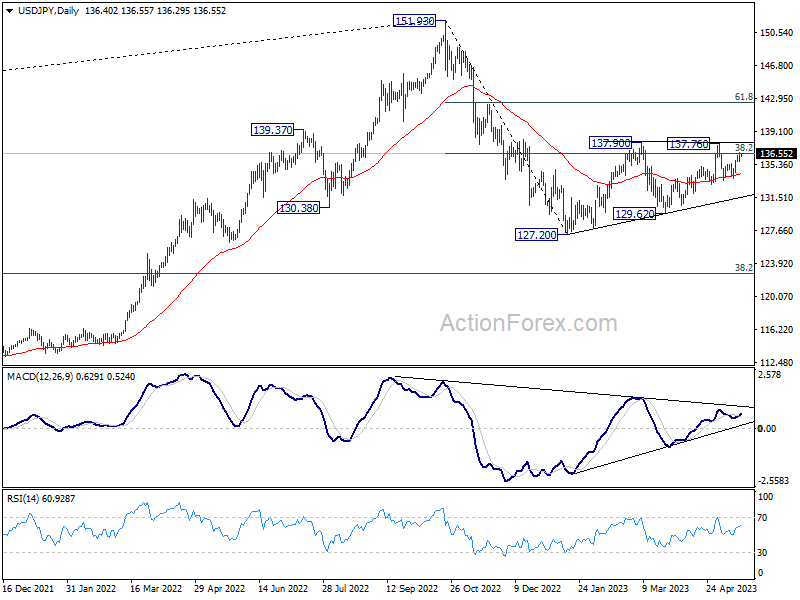
In the bigger picture, price actions from 151.93 high are currently seen as a corrective pattern to the long term up trend. The first leg should have completed at 127.20. Rebound from there is seen as the second leg. Sustained break of 38.2% retracement of 151.93 to 127.20 at 136.34 will bring stronger rise to 61.8% retracement at 142.48. Meanwhile, break of 129.62 will argue that the third leg is starting through 127.20 low.
Forex Markets See Uncertainty, Yen’s Slide Persists, Gold Back Below 2000
Clear direction is yet to be established in the forex markets this week, with the exception of Yen's continued depreciation, albeit at a slow pace. Canadian Dollar's rally, spurred by CPI data, was abruptly halted due to worsening risk sentiment, marked by DOW's over -330pts drop. US Treasury Secretary Janet Yellen amplified her warning about the urgent need to increase the debt limit, cautioning that failure to do so could result in "a number of financial markets break – with worldwide panic triggering margin calls, runs and fire sales."
Currently, most major pairs and crosses remain within last week's range, with the exceptions of USD/JPY, GBP/CAD, and AUD/CAD. Yen, Dollar, and Euro are showing weakness, while New Zealand Dollar, Canadian Dollar, and Swiss Franc are demonstrating strength. Aussie and Sterling are mixed. Considering the sparse economic calendar for today and tomorrow, trading may continue to be subdued. However, Australian Dollar could see some action tomorrow with the release of Australian job data.
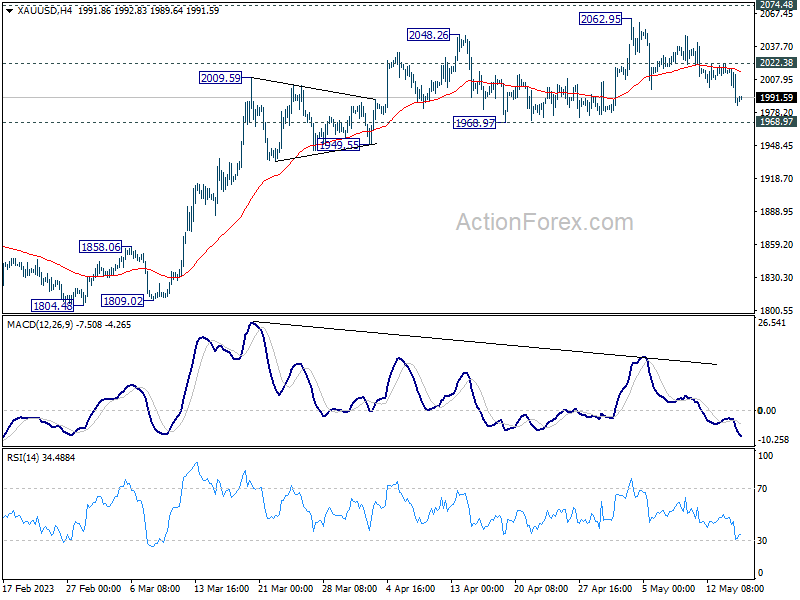
On the technical side, Gold is continuing its pullback from 2062.92 and has dipped below the 2000 mark. Near-term outlook remains bullish as long as 1968.97 support level holds. break of 2022.38 minor resistance could indicate readiness a rally resumption, potentially testing record high of 2074.48. However, firm break below 1968.97 could signal that near-term bearish reversal is already underway.
In Asia, at the time of writing, Nikkei is up 0.85%, back above 30k handle. Hong Kong HSI is down -0.55%. China Shanghai SSE is down -0.23%. Singapore Strait Times is down -0.83%. Japan 10-year JGB yield is down -0.0231 at 0.373. Overnight, DOW dropped -1.01%. S&P 500 dropped -0.64%. NASDAQ dropped -0.18%. 10-year yield rose 0.041 to 3.549.
Fed Logan: Slower tightening shouldn't signal any less commitment
Dallas Fed President Lorie Logan semphasized the importance of a cautious approach to tightening monetary policy amidst uncertainty, suggesting that a slower pace doesn't diminish commitment to achieving inflation goals.
Logan stated in a conference, "when conditions are uncertain, you may need to travel more slowly. But a slower pace of tightening shouldn't signal any less commitment to achieving the inflation goal." She further noted the potential for nonlinear deterioration of financial conditions, advocating for smaller, less frequent rate hikes to mitigate this risk.
Logan also underscored the multifaceted nature of monetary policy's impact. She said, "The restrictiveness of monetary policy comes from the entire policy strategy - how fast rates rise, the level they reach, the time spent at that level and the factors that determine further increases or decreases."
Seaprately, New York Fed President John Williams highlighted the time lag between policy decisions and their full impact on the economy, underlining the importance of monitoring the economy's behavior post-decision. "We've got to make our decisions and then watch what happens, get that feedback, see how the economy's behaving," Williams explained.
In another occasion, Chicago's Austan Goolsbee, however, indicated it may be too soon to discuss rate cuts or changes to monetary policy. He said, "I think it's far too premature to be talking about rate cuts and premature to be saying — even for the next meeting — are we going to pause? Are we going to raise? Are we going to cut."
Japan's economy bounced back in Q1, up 1.6% annualized, 0.4% qoq
Japan's economy delivered a robust performance in Q1, expanding at annualized rate of 1.6%, which significantly surpassed expectation of 0.7%. This marks the first expansion in three quarters, thanks to a potent combination of strong private consumption and a rebound in inbound tourism.
In terms of real GDP, adjusted for inflation, there was an increase of 0.4% qoq, beating the forecast growth of 0.1% qoq. The positive data signals a welcome resurgence in Japan's economy, signaling a potential turn-around after short period of technical recession.
Looking into the details, private consumption for the quarter rose by 0.6%, driven by robust demand for cars and durable goods. Concurrently, consumers boosted spending on services such as dining out, culminating in the fourth consecutive quarterly gain. Meanwhile, capital spending rose by 0.9%, aided by increased car-related investments and marking the first increase in two quarters.
However, not all sectors exhibited positive trends. Exports took a hit, declining by -4.2% due to a slump in shipments of cars and machinery used for chip production. Imports also fell by 2-.3%. Public investment remained largely flat.
Australia wage growth accelerated to 0.8% in Q1, highest in over a decade
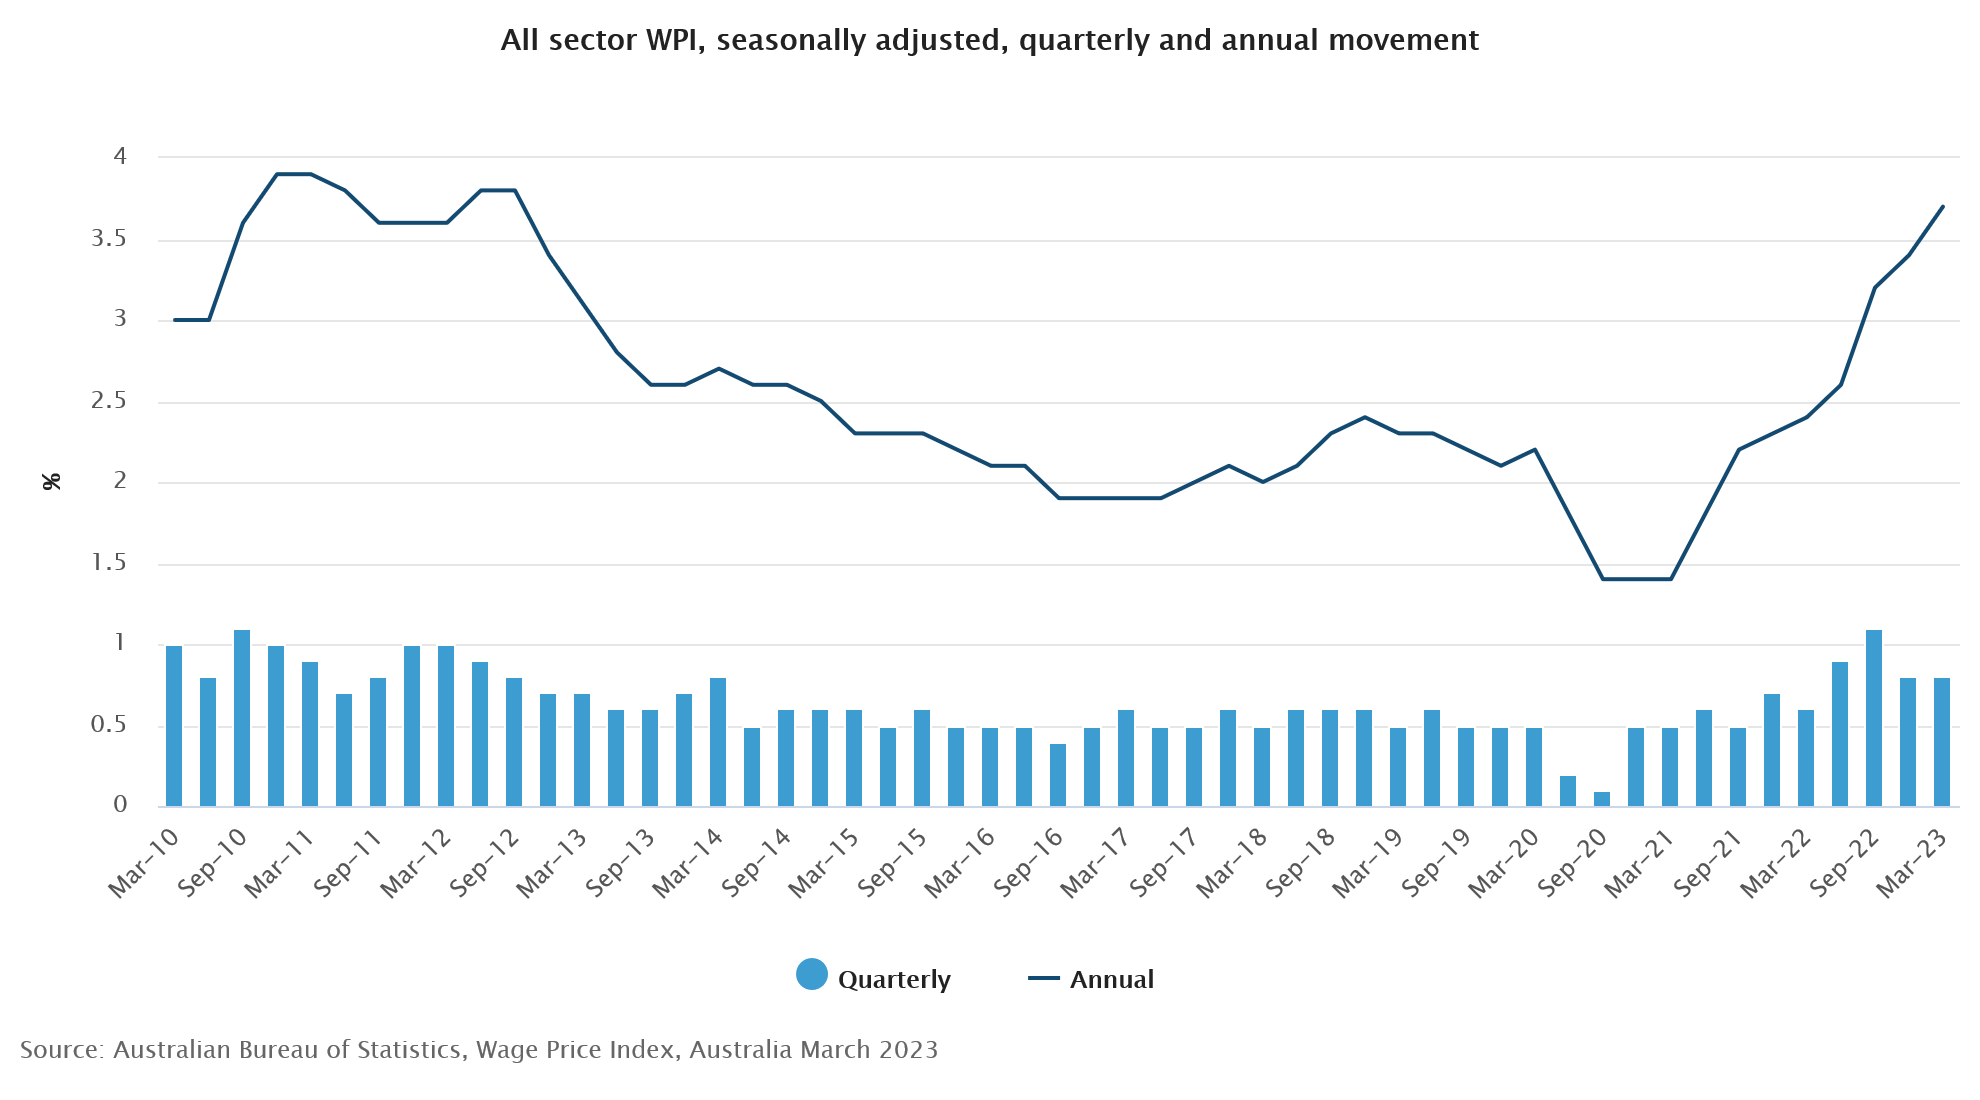
Australia wage price index posted 0.8% qoq increase in Q1 2023, slightly short of expected 0.9% rise. Despite this, annual wage growth accelerated to 3.7%, marking the highest level since Q3 2012. This uptick is attributable to a combination of factors, including low unemployment, tight labour market, and high inflation.
Private sector emerged as the primary engine of growth, with wages climbing 0.8% over Q1 and experiencing an annual rise of 3.8%. According to Leigh Merrington, ABS's acting head of prices statistics, several private sector industries witnessed an annual wage growth exceeding 4%, with the remaining industries all recording an annual growth above 3%.
In the public sector, the highest quarterly (0.9%) and annual (3.0%) wage growth in a decade was reported. Increase in public sector wages is attributed to outcomes from enterprise agreement bargaining, regular scheduled rises, and higher wage caps.
Merrington further highlighted wage outcomes for Q1 2023, stating, "There was a continued lift in the share of jobs receiving wage rises of between 4 and 6 per cent, which is the highest share since 2009. The share of jobs with a wage rise of 2 per cent or less has fallen from over 50 per cent in mid-2021 to less than 20 per cent."
Looking ahead
Eurozone CPI final will be the main focus in European session while Italy trade balance will be featured too. US will release housing starts and building permits later in the day.
USD/JPY Daily Outlook
Daily Pivots: (S1) 135.82; (P) 136.26; (R1) 136.82More...
USD/JPY's rally from 133.73 is still in progress and intraday bias remains on the upside for 137.76/90 resistance zone. Decisive break there will resume whole rebound from 127.20. On the downside, though, below 135.46 minor support will turn bias back to the downside for 133.73. Firm break there will resume the fall from 137.76 through 133.00.
In the bigger picture, price actions from 151.93 high are currently seen as a corrective pattern to the long term up trend. The first leg should have completed at 127.20. Rebound from there is seen as the second leg. Sustained break of 38.2% retracement of 151.93 to 127.20 at 136.34 will bring stronger rise to 61.8% retracement at 142.48. Meanwhile, break of 129.62 will argue that the third leg is starting through 127.20 low.
Economic Indicators Update
| GMT | Ccy | Events | Actual | Forecast | Previous | Revised |
|---|---|---|---|---|---|---|
| 23:50 | JPY | GDP Annualized Q1 P | 0.40% | 0.20% | 0.10% | |
| 23:50 | JPY | GDP Deflator Y/Y Q1 P | 2.00% | 2.00% | 1.20% | |
| 01:30 | AUD | Wage Price Index Q/Q Q1 | 0.80% | 0.90% | 0.80% | |
| 04:30 | JPY | Industrial Production M/M Mar F | 1.10% | 0.80% | 0.80% | |
| 08:00 | EUR | Italy Trade Balance (EUR) Mar | 2.50B | 2.11B | ||
| 09:00 | EUR | Eurozone CPI Y/Y Apr F | 7.00% | 7.00% | ||
| 09:00 | EUR | Eurozone CPI Core Y/Y Apr F | 5.60% | 5.60% | ||
| 12:30 | USD | Housing Starts Apr | 1.40M | 1.42M | ||
| 12:30 | USD | Building Permits Apr | 1.44M | 1.43M | ||
| 14:30 | USD | Crude Oil Inventories | -1.5M | 3.0M |
Australia wage growth accelerated to 0.8% in Q1, highest in over a decade
Australia wage price index posted 0.8% qoq increase in Q1 2023, slightly short of expected 0.9% rise. Despite this, annual wage growth accelerated to 3.7%, marking the highest level since Q3 2012. This uptick is attributable to a combination of factors, including low unemployment, tight labour market, and high inflation.
Private sector emerged as the primary engine of growth, with wages climbing 0.8% over Q1 and experiencing an annual rise of 3.8%. According to Leigh Merrington, ABS's acting head of prices statistics, several private sector industries witnessed an annual wage growth exceeding 4%, with the remaining industries all recording an annual growth above 3%.
In the public sector, the highest quarterly (0.9%) and annual (3.0%) wage growth in a decade was reported. Increase in public sector wages is attributed to outcomes from enterprise agreement bargaining, regular scheduled rises, and higher wage caps.
Merrington further highlighted wage outcomes for Q1 2023, stating, "There was a continued lift in the share of jobs receiving wage rises of between 4 and 6 per cent, which is the highest share since 2009. The share of jobs with a wage rise of 2 per cent or less has fallen from over 50 per cent in mid-2021 to less than 20 per cent."