

Sample Category Title
EUR/CHF Daily Outlook
Daily Pivots: (S1) 0.9724; (P) 0.9733; (R1) 0.9746; More...
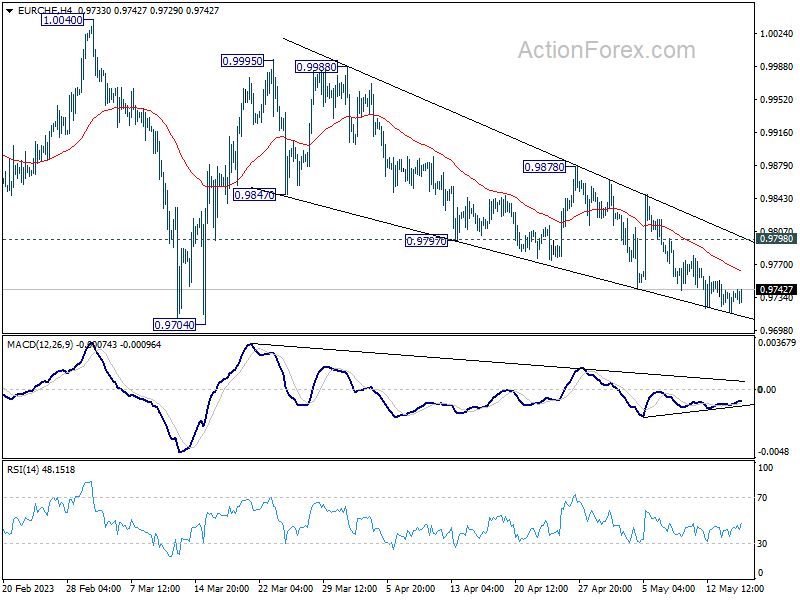
No change in EUR/CHF's outlook. Choppy decline from 0.9995 might extend lower. But strong support should be seen from 0.9704 to bring rebound. Break of 0.9847 will argue that the fall has completed and turn bias back to the downside. However, firm break of 0.9704 will resume the whole decline from 1.0095 to 61.8% retracement of 0.9407 to 1.0095 at 0.9670.
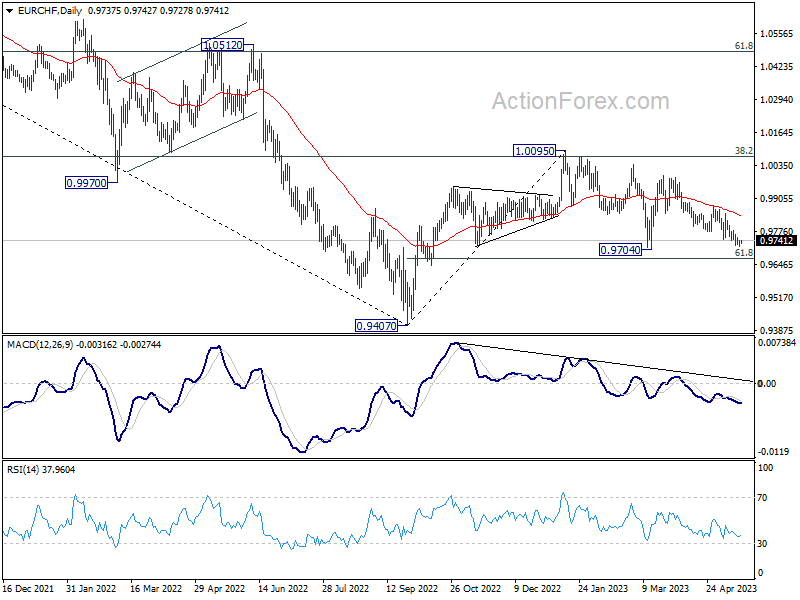
In the bigger picture, prior rejection by 38.2% retracement of 1.1149 to 0.9407 at 1.0072 suggests that medium term outlook is staying bearish. The pair is also capped below 55 W EMA (now at 0.9963). Down trend from 1.2004 is not completed yet and is in favor to resume through 0.9407 at a later stage. However, decisive break of 1.0095 resistance will raise the chance of bullish trend reversal. Rise from 0.9407 should then target 1.0505 cluster resistance (2020 low at 1.0505, 61.8% retracement of 1.1149 to 0.9407 at 1.1484).
GBP/USD Technical Analysis
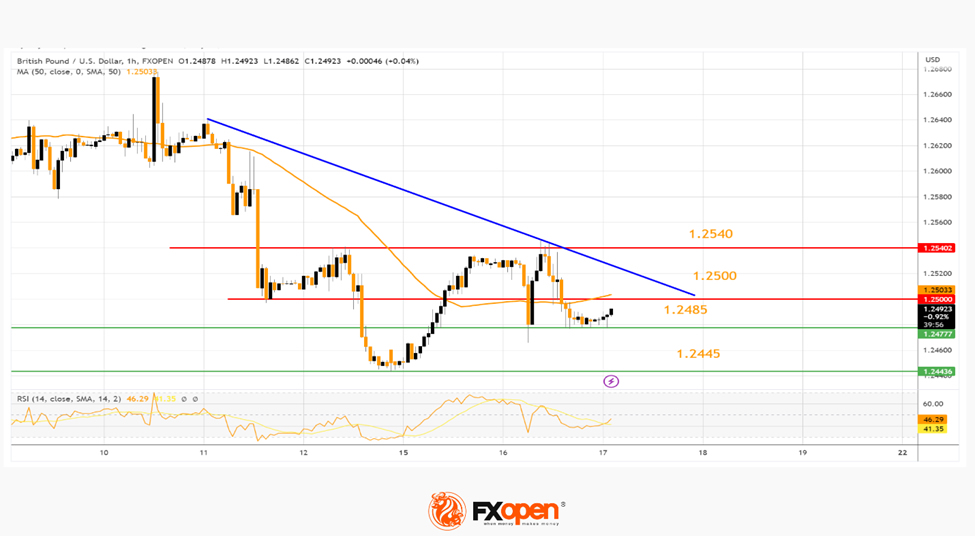
On the hourly chart of GBP/USD at FXOpen, the pair started a fresh decline from the 1.2660 zone. The British Pound declined steadily below the 1.2600 level against the US Dollar.
It tested the 1.2445 support and recently started an upside correction. The pair is now facing resistance near a key bearish trend line at 1.2500 and the 50-hour simple moving average.
If there is a clear upside break above the 1.2500 resistance, the pair could rise toward the 1.2540 level in the near term. The next major resistance sits near the 1.2600 level.
On the downside, the first major support is near the 1.2485 level. The main support is forming near the 1.2445 level. A break below the 1.2445 support could start a fresh downward move toward the 1.2350 support in the coming sessions.
Bitcoin Set for a Deeper Correction
Market picture
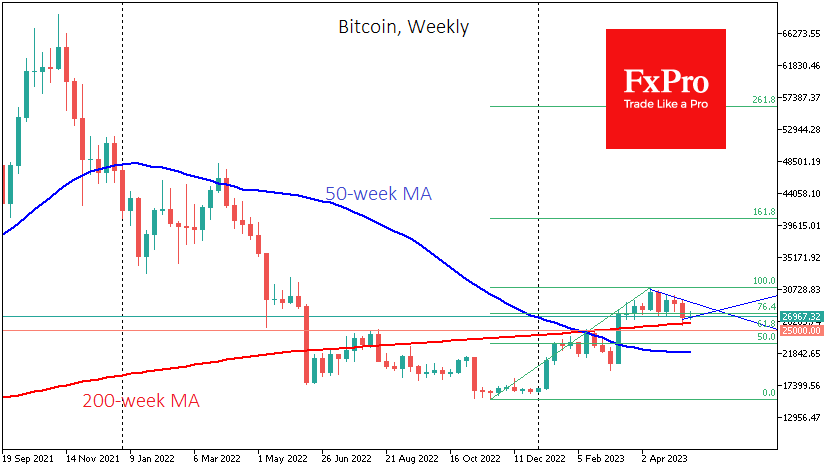
The cryptocurrency market capitalisation remained near $1.127 trillion as attempts to develop growth came up against selling pressure near $1.14 trillion. The top cryptocurrencies over the past 24 hours have ranged from a 0.7% decline (Solana) to a 5.6% rise (XRP), while Bitcoin is losing 0.3% and Ether is rising by the same amount.
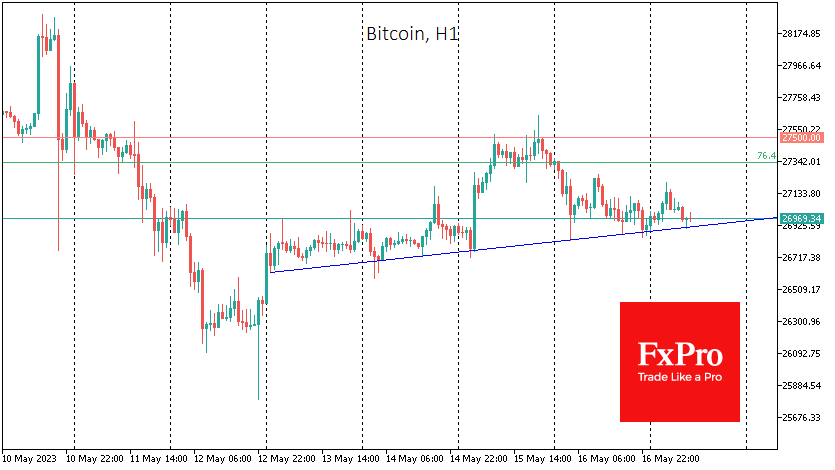
One can discern a moderately upward trend on Bitcoin’s intraday charts, but it’s worth noting that the price is failing to push up from that local support, which now passes near $27K. Investors and traders should be prepared for a price decline into the $25K area, as the market seems set for a full rally correction from the November lows.
Despite the Bitcoin network’s continued rise in transaction volume, the number of active addresses has fallen to 764K – its lowest since July 2021. Due to the hype around BRC-20 and Ordinals tokens, the average transaction fee on the blockchain rose from $2.5 last year to $16.08 at the peak. The situation is to the benefit of Bitcoin miners, who are getting more commission on transactions than from mining for the fifth time in history (6.25 BTC), Glassnode noted.
News background
Bernstein Research expects lower US interest and bank deposit rates will spur public interest in Ethereum-stacking, which generates more interest income. In turn, it could start a new bullish trend in the crypto market.
According to Bloomberg, the appeal of Bitcoin and other cryptocurrencies will decline as US crypto policy tightens and default risks increase.
During the trial of a lawsuit filed by exchange Coinbase, US Securities and Exchange Commission (SEC) officials said drafting laws to regulate cryptocurrencies will take years. In the meantime, fines will “come down”. The SEC called Coinbase’s lawsuit “unfounded”.
The number of transactions on the Dogecoin network has surpassed that of Bitcoin and Litecoin. The community speculates that this momentum is due to activity around DRC-20 tokens, which enable the creation of new digital assets on top of the blockchain.
USDJPY Aims to Revive 2023 Uptrend
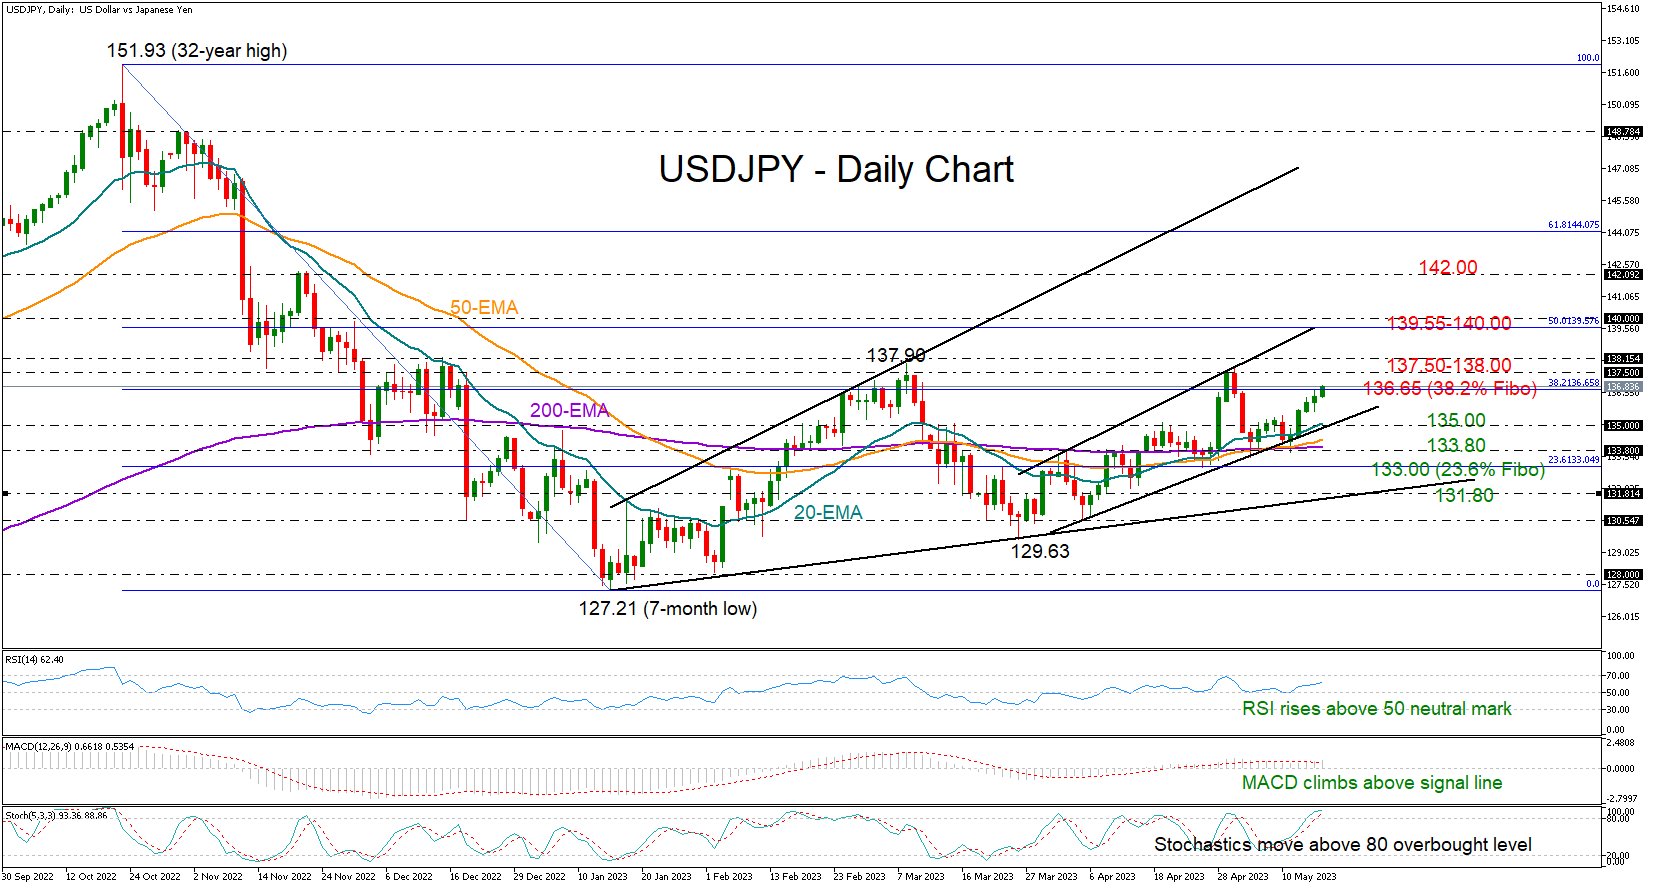
USDJPY has been in the green for almost a week, aiming to resume its 2023 uptrend above the key 137.50-138.00 resistance territory.
The technical picture suggests there is more room for improvement. The exponential moving averages (EMAs) remain positively aligned, with the price trading above those lines. Moreover, the RSI and the MACD are sloping upwards in the bullish area, reflecting a bullish bias too.
The stochastic oscillator, though, is already in the overbought region. Therefore, some caution might be necessary as the price is trading near the 38.2% Fibonacci retracement of the 151.93-127.21 downtrend at 136.65. A decisive close above that number could bring the 137.50-138.00 ceiling under examination. If the bulls successfully breach that wall, the recovery may continue towards the 50% Fibonacci level of 139.55 and the 140.00 psychological mark, where the resistance line from March is placed. Another victory here could see a remarkable rally towards the 142.00 zone.
On the downside, the 20-day EMA and the support trendline at 135.00 could delay an extension towards the 133.80-133.00 region. This is where the 50- and 200-day EMAs and the 23.6% Fibonacci mark are located. Hence, failure to bounce here could prompt a new bearish correction towards the 2023 ascending trendline seen around 131.80.
In summary, USDJPY may keep facing upside pressures in the short-term, though for an outlook improvement, it will need to print a new higher high above the 137.50-138.00 area.
EUR/USD: Bears Hold Grip and Look for Attack at Next Key Support
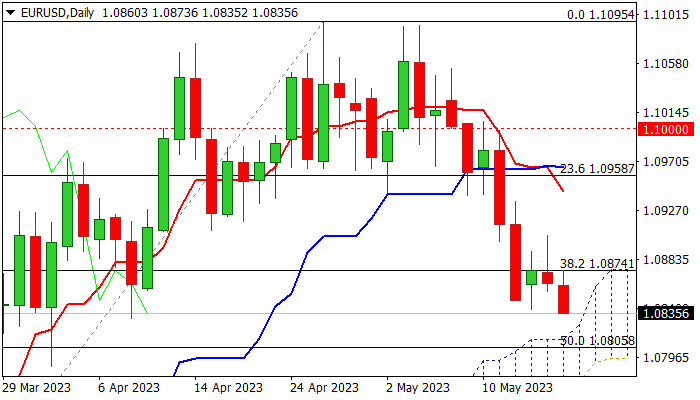
The Euro extends weakness in early European session trading on Wednesday, after the action stayed in a sideways mode in past two days but capped by broken pivotal Fibo support at 1.0874 (38.2% of 1.0516/1.1095), keeping negative near-term bias.
Comments from US policymakers that it’s too early to talk about rate cuts and the Fed should stay strong on inflation despite negative impact on the economy, could be supportive for dollar, in addition to persisting pressure from US debt ceiling crisis, which hurts risk sentiment.
Bearishly aligned daily studies (strong negative momentum / multiple bear-crosses of 10, 20, 30 DMA’s) weigh on near-term action however, strong support from rising and thickening daily cloud (top of the cloud lays at 1.0826) should be considered.
Repeated close below 1.0874 to add to negative outlook, with upticks to offer better selling opportunities while capped by falling 10DMA (1.0931).
Violation of daily cloud top and a nearby 100DMA / 50% of 1.0516/1.1095 (1.0805) to generate fresh bearish signal and expose next pivot at 1.0774 (daily cloud base).
EU inflation report is key event today, with harmonized CPI and core figure (excluding the most volatile components) are expected to remain unchanged in April at 7.0% and 5.6% respectively, which points to stubbornly high inflation and likely to add to ECB’s hawkish stance.
Res: 1.0874; 1.0904; 1.0931; 1.0969.
Sup: 1.0826; 1.0805; 1.0774; 1.0737.
Dollar Headed Higher – EUR/USD Breaking Key Trendline Support
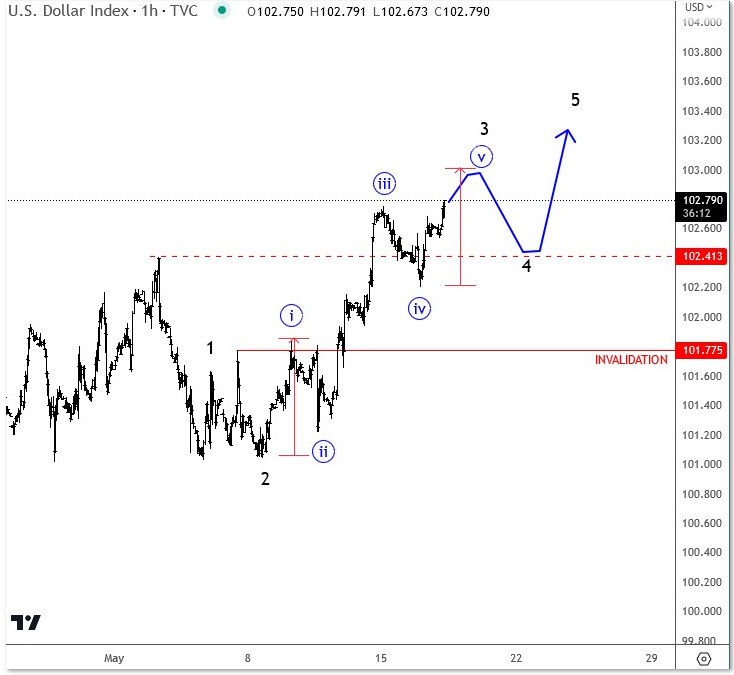
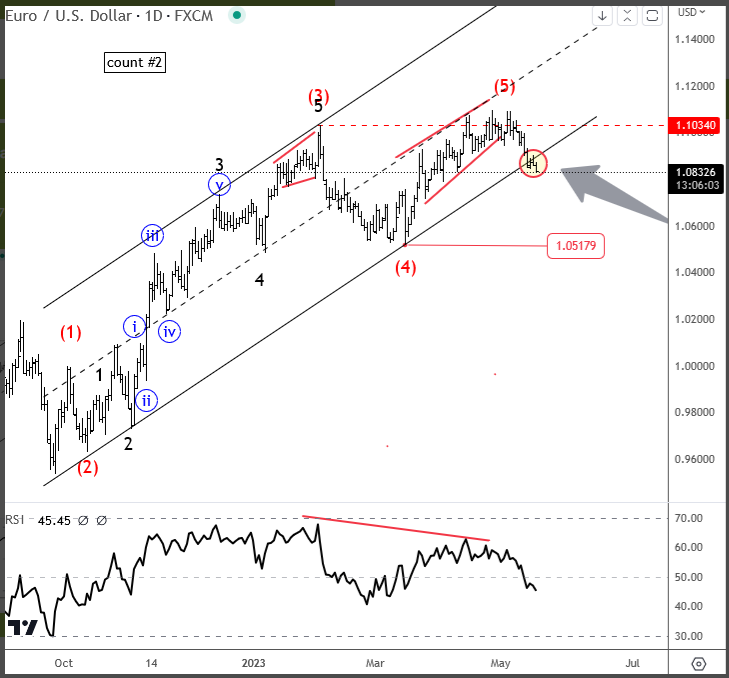
The USD is higher while stocks are still somehow sideways. The reason for the higher USD can be optimism and speculation about US debt-ceiling. We know that will approve it, otherwise, this will cause a lot of damage on the financial market. "Yellen has repeatedly warned that failure by Congress to raise the $31.4 trillion federal debt limit could spark a "constitutional crisis" and would unleash an "economic and financial catastrophe" for the U.S. and global economies" as reported by Reuters. From an Elliott wave perspective I see USD in a recovery mode, looking very impulsive on hourly chart so think there cna be more upside after next fourth wave pullback, which can once again find support near 102.40, if its retested.
EUR/USD is breaking the major trendline support.
EUR/USD and USD/JPY Weekly Chart Outlook
EUR/USD started a decent recovery above the 1.0500 resistance. USD/JPY is showing positive signs but must clear 137.30 to start a fresh increase.
Important Takeaways for EUR/USD and USD/JPY Analysis
- The Euro broke a few hurdles near 1.0500 and 1.0820 against the US Dollar.
- There was a break above a key bearish trend line with resistance near 1.0500 on the weekly chart of EUR/USD at FXOpen.
- USD/JPY corrected lower from the 152.00 resistance and found support at 127.20.
- There is a connecting bullish trend line forming with support at 133.00 on the weekly chart at FXOpen.
EUR/USD Technical Analysis
On the weekly chart of EUR/USD at FXOpen, the pair started a decent recovery wave after it settled above the 1.0000 level. The Euro was able to gain pace above 1.0200 against the US Dollar.
During the increase, it traded above a key bearish trend line with resistance near 1.0500 and the 50-week simple moving average. Recently, there was a move above the 50% Fib retracement level of the last major decline from the 1.2266 swing high to the 0.9535 low.
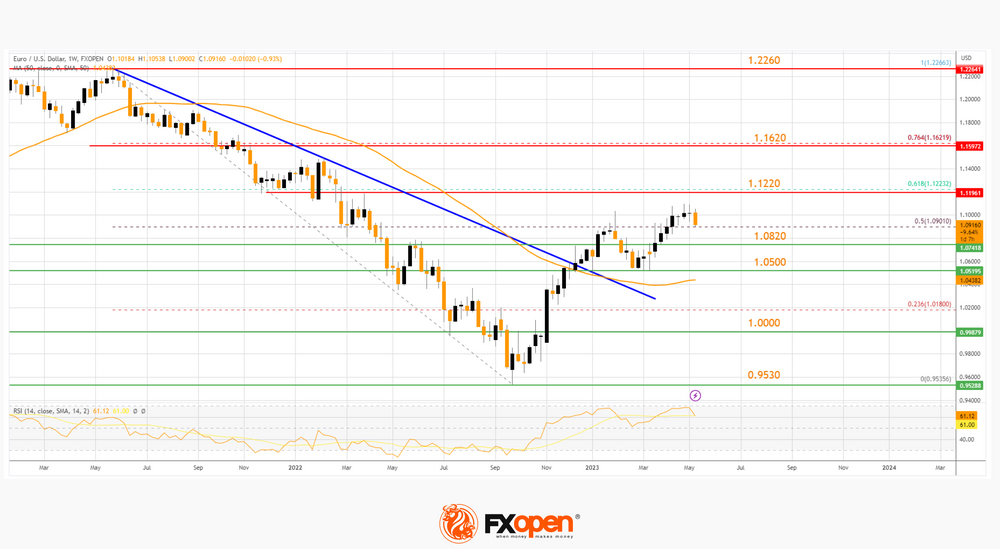
On the upside, the first major resistance is forming near the 61.8% Fib retracement level of the last major decline from the 1.2266 swing high to the 0.9535 low at 1.1220.
The next major resistance on the EUR/USD chart is near the 1.1620 level, above which the pair might revisit the 1.2260 resistance zone if the weekly RSI stays above 50.
Conversely, if EUR/USD fails to climb higher above the 1.1220 resistance, it could correct gains. Immediate support is near the 1.0820 level. The first major support is near the 1.0500 level, below which the pair could decline toward 1.0000.
USD/JPY Technical Analysis
On the weekly chart of USD/JPY, the pair faced strong rejection near the 152.00 level. The US Dollar started a downside correction below the 137.30 support against the Japanese Yen.
The pair tested the 127.20 support. A low was formed near 127.21 and the pair is now rising. It broke the 23.6% Fib retracement level of the downward move from the 151.94 swing high to the 127.21 low.
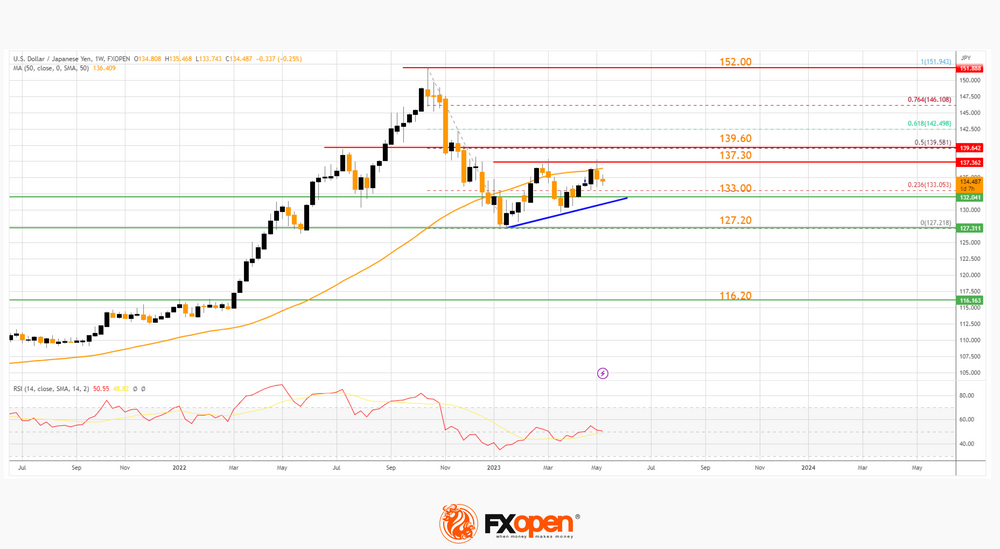
On the upside, the pair is facing resistance near the 50-week simple moving average and 137.20. The next major resistance on the USD/JPY chart is near the 50% Fib retracement level of the downward move from the 151.94 swing high to the 127.21 low at 139.60.
A successful close above 139.60 is likely to start a strong upward move toward 152.00 in the coming weeks. Conversely, if USD/JPY fails to break 139.60, it could retreat lower and revisit the 133.00 support area.
Besides, there is also a connecting bullish trend line forming with support at 133.00. A downside break below the trend line might send the pair toward 127.20.
Any more losses might push the pair into a bearish zone. In the stated case, there is a risk of a drop toward the 116.20 support zone in the medium term.
NZDUSD Battles With 50-Day SMA after Decline Pauses
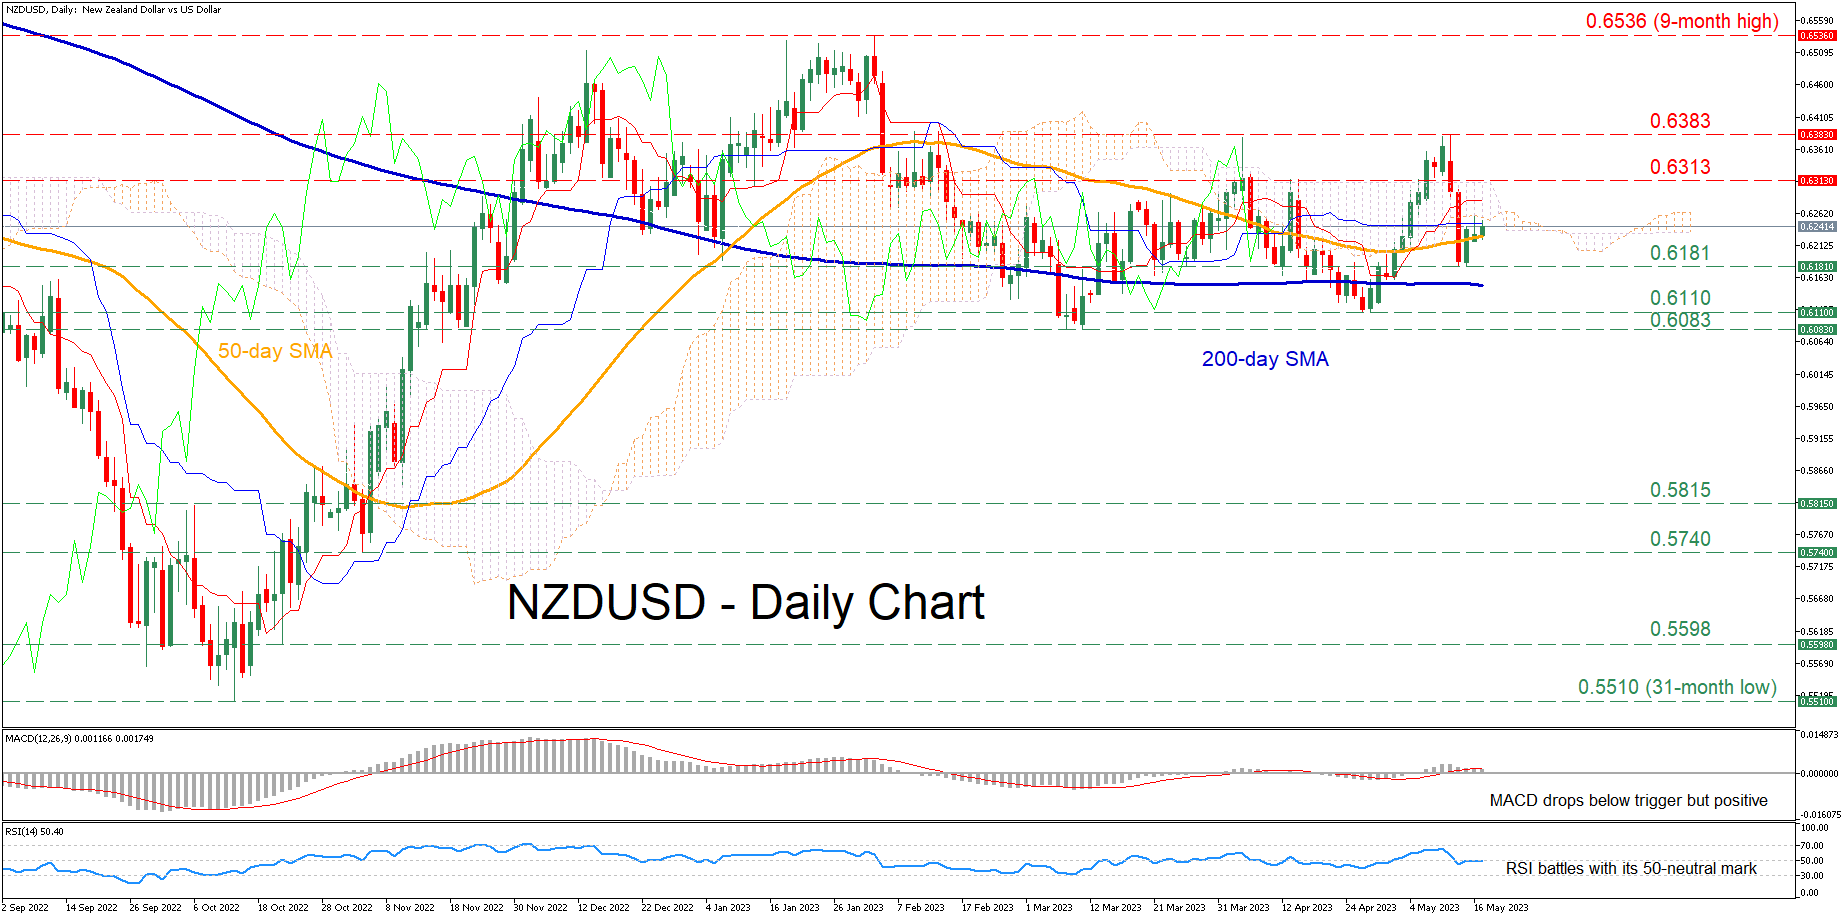
NZDUSD was in a steady short-term uptrend, posting a fresh three-month high of 0.6378 before experiencing a significant pullback. Although the pair managed to halt its retreat and recoup some losses, its attempt for a recovery stalled at the congested region that includes the 50-day simple moving average (SMA) and the lower end of the Ichimoku cloud.
The momentum indicators are reflecting a loss of positive momentum. Specifically, the MACD dropped beneath its red signal line but remains above zero, while the RSI is hovering around its 50-neutral threshold.
Should the selling interest persist, the recent support of 0.6181 could act as the first line of defense. Sliding beneath that floor, the price might descend towards the April low of 0.6110 before the 2023 bottom of 0.6083 gets tested. Further declines might then cease at the 0.5815 hurdle.
On the flipside, if the pair manages to overcome the fortified zone, 0.6313 may prove to be the first barrier for buyers to clear. Conquering this barricade, the bulls could aim for the May peak of 0.6383, which is also a three-month high. A violation of that region could open the door for the nine-month peak of 0.6536.
Overall, NZDUSD has been challenging a crucial technical region in the past couple of daily sessions after its downside correction paused. Therefore, a clear close above both its 50-day SMA and the lower boundary of the Ichimoku cloud is needed to revive bulls’ hopes for a sustained recovery.
US Debt Ceiling Stalemate Remains Firmly in Place
Markets
US treasuries extended their underperformance against German Bunds yesterday as some data beats strengthen the notion that the US customer isn’t backing down yet, hinting at a more resilient economy. Core US retail sales rose by 0.6% M/M with the control group even gaining 0.7% M/M and providing a solid start to Q2. The NAHB housing index increased a fifth consecutive time to the highest level since July (see News & Views). More Fed governors weighed in the debate, highlighting the toss-up that the June policy meeting will be. NY Fed Williams seems in favour of a wait-and-see approach like Chicago Fed Goolsbee and to a lesser extent Dallas Fed Logan. Atlanta Fed Bostic will let the data decide while Minneapolis Fed Kashkari and Richmond Fed Barkin believe there’s no barrier to further rate increases. Cleveland Fed Mester joined that hawkish camp: “At this point, based on the data I have so far, given how stubborn inflation has been, I can’t say I’m at a level of the Fed Funds rate where it’s equally probably that the next move could be an increase or a decrease”. US yields rose by 1.1 bp (30-yr) to 7.3 bps (2-yr). German yields added 3.9 bps (30-yr) to 6.1 bps (5-yr). Mixed German ZEW investor sentiment went unnoticed. Hawkish Austrian ECB member Holzmann said that he preferred a 50 bps rate hike earlier this month and that the ECB shouldn’t pause hikes before they reach 4%. After last month’s decision, he thinks that the bar to returning to 50 bps rate hikes is high. The dollar overall profited from the yield advantage with the trade-weighted greenback (DXY) testing the recent high at 102.75. EUR/USD approached the sell-off low at 1.0846, before closing at 1.0862. US stock markets yesterday underperformed (Dow -1%) with risk aversion creating some additional USD-safe haven flows. The US debt ceiling stalemate remains firmly in place with US Treasury Secretary Yellen’s warnings proving futile for the moment. Apart from the US T-Bill and CDS market, the overall market impact remains low even as we’re only a fortnight away from the assumed “X-date”. Previous debt ceiling episodes learnt that a solution will eventually follow. Today’s eco calendar is extremely thin with only US housing starts and building permits. It doesn’t become much better on Thursday and on Friday, making way for central bankers and especially risk sentiment to set the tone for trading. Current trends are sluggish stocks, weakness in US Treasuries and a better dollar.
News and views
Q1 Japanese growth rebounded more than expected. Activity during the January-March quarter expanded at an annualized rate of 1.6% (0.4% Q/Q), beating expectations for a more modest growth of 0.8%. Activity was mainly supported by a rebound in private consumption (0.6% Q/Q) and business spending (0.9% Q/Q) as consumer spending regained traction post-Covid. Tourism was an important factor in the consumption revival. Net exports subtracted 0.3 ppts from growth as exports (-4.2%) declined faster than imports (-2.3%). The Q1 GDP price deflator printed exactly at 2%, close to expectations. The figure for the previous quarter was downwardly revised from 0.1% (QoQa) to -0.1%, which brought to economy in a technical recession in the second half of last year. A rebound in domestic demand as such is a positive development. However, the Q1 data probably needs confirmation for the BOJ to change its ultra-easy monetary policy. Markets this morning aren’t preparing for such move as the 10-y yield dropped 3 bps to 0.367%. The yen also weakens with USD/JPY extending recent uptrend (136.65).
US NAHB Home Builders sentiment unexpectedly increased further from 45 in April to 50 in May. According the NAHB statement “Limited existing inventory, which has put a renewed emphasis on new construction, resulted in a solid gain for builder confidence in May even as the industry continues to face several challenges, including building material supply chain disruptions and tightening credit conditions for construction loans”. The May rise in the index was the fifth consecutive monthly rise. It was the first time for the index to reach the 50-level since July 2022.
US Debt Theater: Final Act?
Risk sentiment remains poor as the US couldn’t reached an agreement on its debt ceiling.
But House Speaker McCarthy hinted that an agreement is possible within days. Despite both sides being far apart, everyone knows the catastrophic consequences of an eventual US default, and no one is ready to push the US into that black hole.
Yesterday, both equities and bonds were sold off on US debt ceiling impasse, while the US dollar index remained capped at two-week highs.
On the data front, the US retail sales figures released yesterday were softer than expected. Even though, the monthly number showed a rebound after two months of negative print, the rebound was smaller than expected and the yearly print showed that the sales growth unexpectedly decelerated, printed a disappointing 1.6% growth, down from 2.4% a month earlier, and way below the 4.20% penciled in by analysts. Core retail sales excluding gas and cars rose more than expected, while industrial production printed a bigger advance in April. But the latest data will unlikely get the Fed officials to change their mind regarding the fact that the Fed’s next move should be a pause in tightening rather than a further rise.
Activity on Fed fund futures gives around 80% for a pause in June, and the pricing may be partially distorted by the US debt ceiling saga. The chances of a pause are closer to almost-certain.
The US 2-year yield rather spiked above the 4% mark and stays there. Even the long-term papers have a difficult time finding buyers. The 30-year yield for example spiked yesterday to the highest levels since the SVB collapse back in March. All that means that the US debt ceiling theater comes with a cost.
Home Depot disappoints
Latest quarterly results from Home Depot were less than enchanting. Home Depot posted its worst revenue miss in about 20 years and lowered its forecast for this year. Its CFO said that this year will be the year of moderation for the company.
Home Depot finished yesterday’s session more than 2% down.
Moving forward, all eyes are on Target and Walmart earnings. If they happen to be softer than expected, as well, we could maybe take it as a hint that US consumer spending, which has been so resilient this far, could finally be giving in to high inflation and deteriorating macroeconomic conditions. In this context, the spike in US credit card debt, to nearly $1 trillion, is a hint that trouble may be brewing.
Crude Oil under pressure
The weak Chinese data from earlier this week, combined to German pessimism and a 3.7 mio barrel build in US inventories kept crude oil under decent selling pressure.
Even IEA’s prediction that global oil demand will rise more than expected this year due to a record-high Chinese intake couldn’t give a positive spin to the market. IEA said that ‘the vast majority of the projected demand recovery is already in train’ despite the weak Chinese data, but in vain, investors remained focused on lower Chinese growth forecasts from big banks.
Last word about the det ceiling theater
Global risk sentiment for the next few days will be driven by the US debt ceiling theater. While the looming uncertainty makes the markets hard to navigate in the short run, there is a good chance that the drama comes to an end within the next few days. In this scenario, we shall see a relief rally across risk assets. And a relief rally could be further boosted by the fact that the market is extremely bearish right now – which means there is potential for a sizeable recovery despite rising recession odds and a gloomy economic outlook.