Sample Category Title
Japan’s exports grow at slowest pace since Feb 2021 despite setting record high for Apr
Japan's exports grew by a modest 2.6% yoy to JPY 8288B in April. Although this represented the lowest growth in exports since February 2021, it still marked the largest export figure for April on record.
A closer examination of the data reveals a shift in trading dynamics. Exports to China fell by -2.9% yoy, marking the fifth consecutive month of decline. The decrease was driven by downturns in shipments of cars, car parts, and steel. Similarly, exports to Asia overall declined by -6.6% yoy, continuing a contraction trend for the fourth month in a row.
However, things looked rosier elsewhere. Exports to the US and EU showed robust growth, rising by 10.5% yoy and 11.7% yoy respectively. This uptick was led by a rebound in exports of cars and car parts, which have seen easing supply constraints.
Contrasting with export trends, imports fell by -2.3% yoy to JPY 8721B, the first annual decline witnessed in 27 months. This decrease was largely attributed to a slump in imports of crude oil and liquefied natural gas. Consequently, Japan recorded a trade deficit of JPY -432B for the 21st month running.
In seasonally adjusted term, the situation presents a slightly different picture. Exports rose by 2.5% mom to JPY 8259B, while imports inched up by 0.1% mom to JPY 9276B. In light of this, trade deficit narrowed to JPY -1017B.
Australia employment down -4.3k in Apr, unemployment rate up to 3.7%
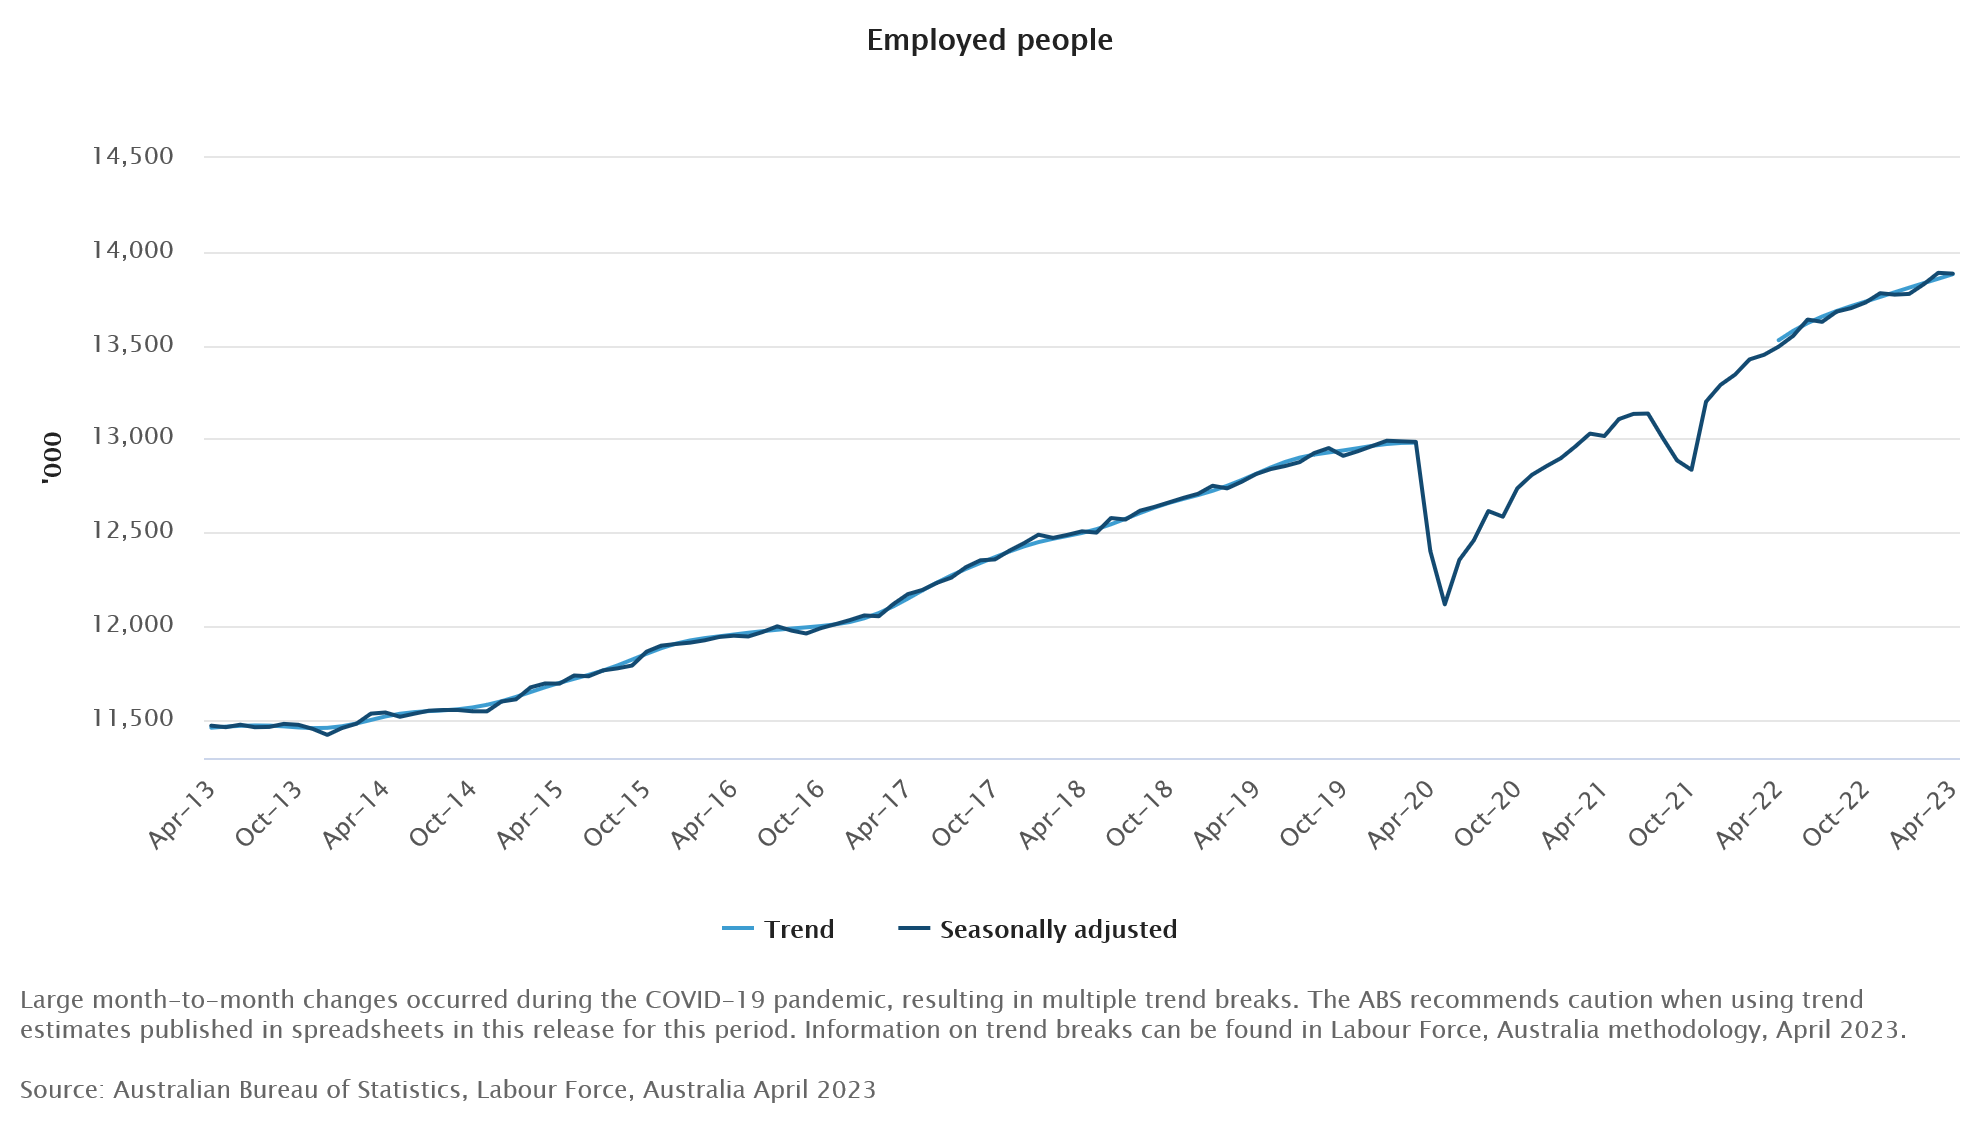
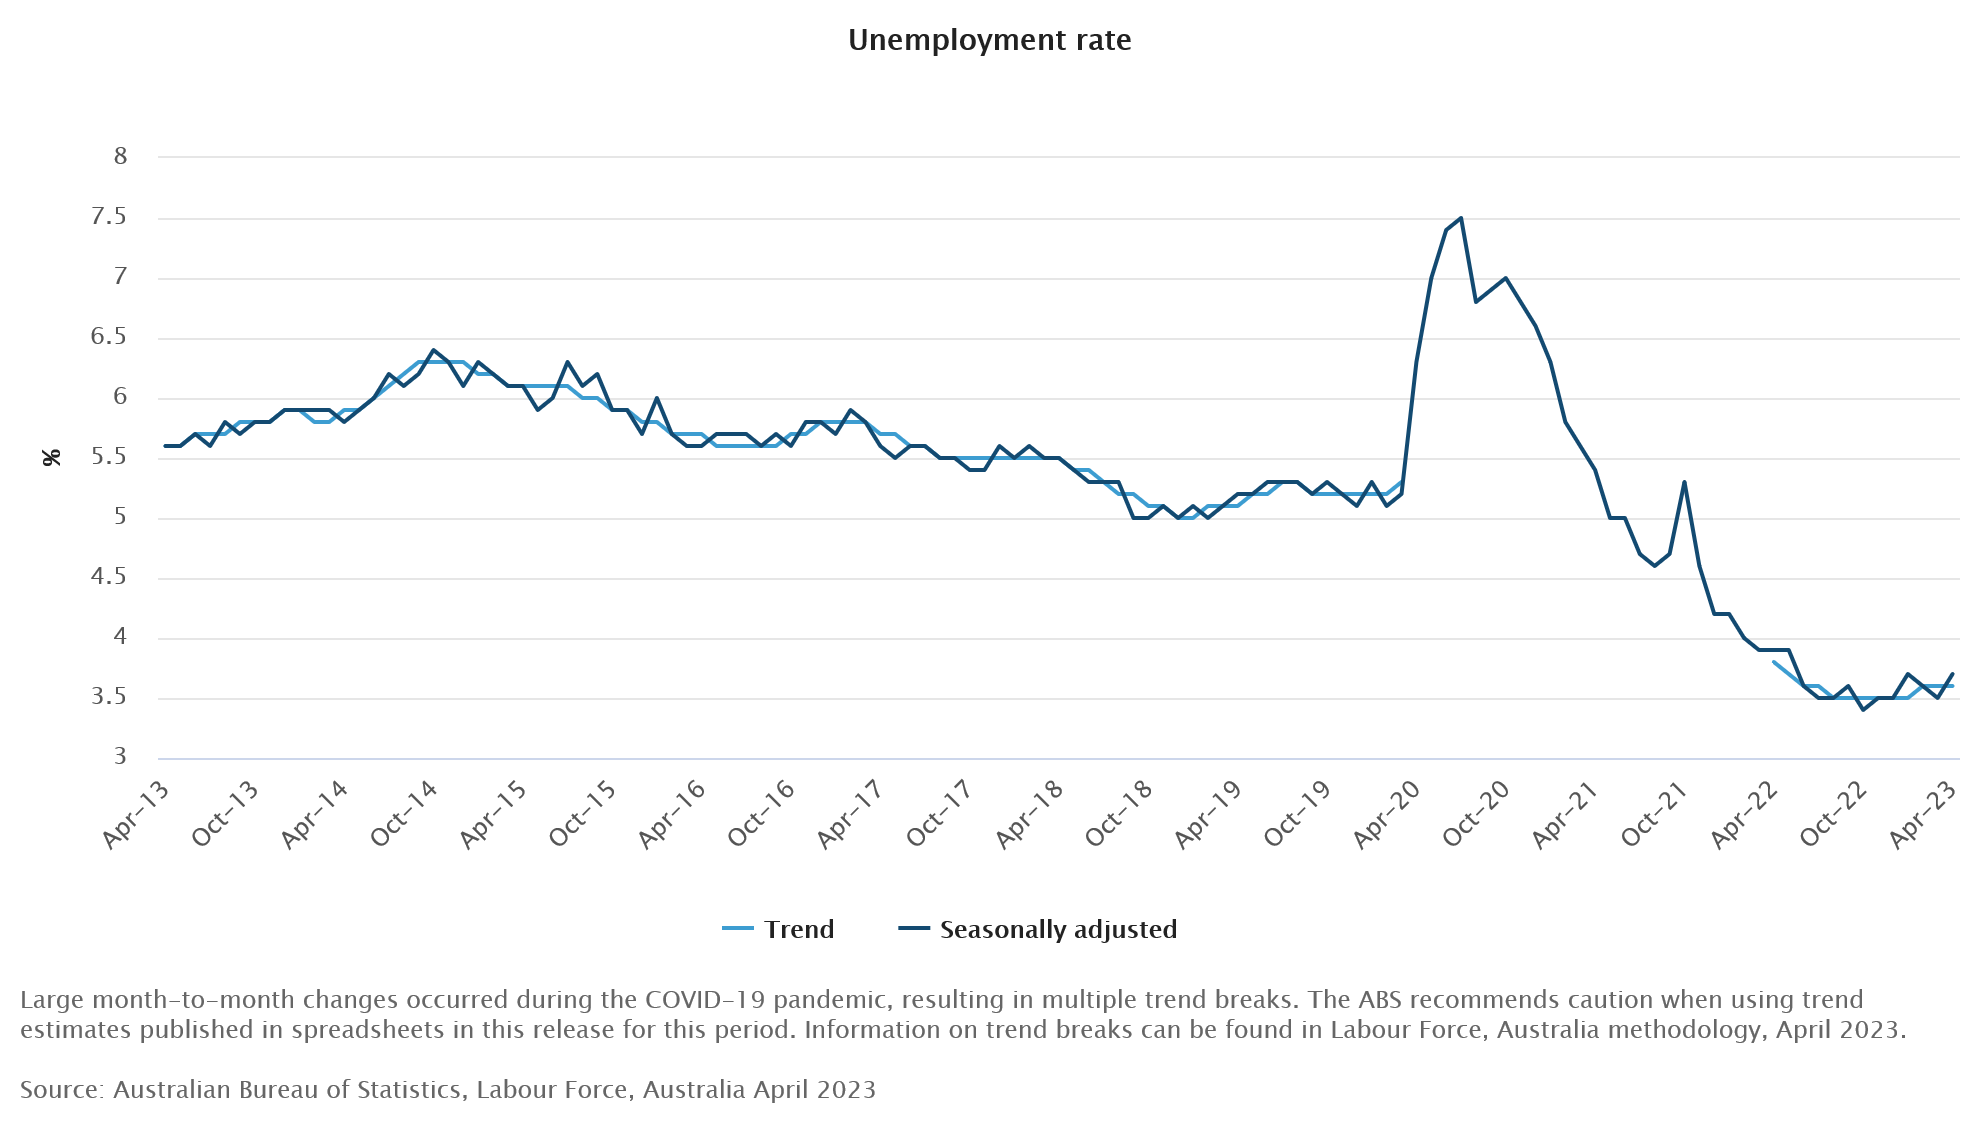
Australia employment contracted -4.3k in April, much worse than expectation of 25k growth. Full time job decreased -27.1k while part-time jobs rose 22.8k. Unemployment rate rose from 3.5% to 3.7%, above expectation of being unchanged at 3.5%. Participation rate dropped -0.1% to 66.7%. Employment-to-population ratio fell -0.2% to 64.2%. Monthly hours worked rose 2.6% mom or 49m hours.
Bjorn Jarvis, ABS head of labour statistics, said: "The small fall in employment followed an average monthly increase of around 39,000 people during the first quarter of this year." Meanwhile, both employment-to-population ratio and participation rate "were still well above pre-COVID-19 pandemic levels and close to their historical highs in 2022".
Crude Oil Price Starts Recovery But Faces Hurdle
Key Highlights
- Crude oil prices started a recovery wave above $70.
- It broke a major bearish trend line with resistance near $70.80 on the 4-hour chart.
- EUR/USD extended its decline and spiked below 1.0840.
- Gold price is consolidating losses near the $1,975 support.
Crude Oil Price Technical Analysis
Crude oil prices remained well-bid above the $65 level against the US Dollar. The price started a recovery wave above the $68 and $68.50 resistance levels.
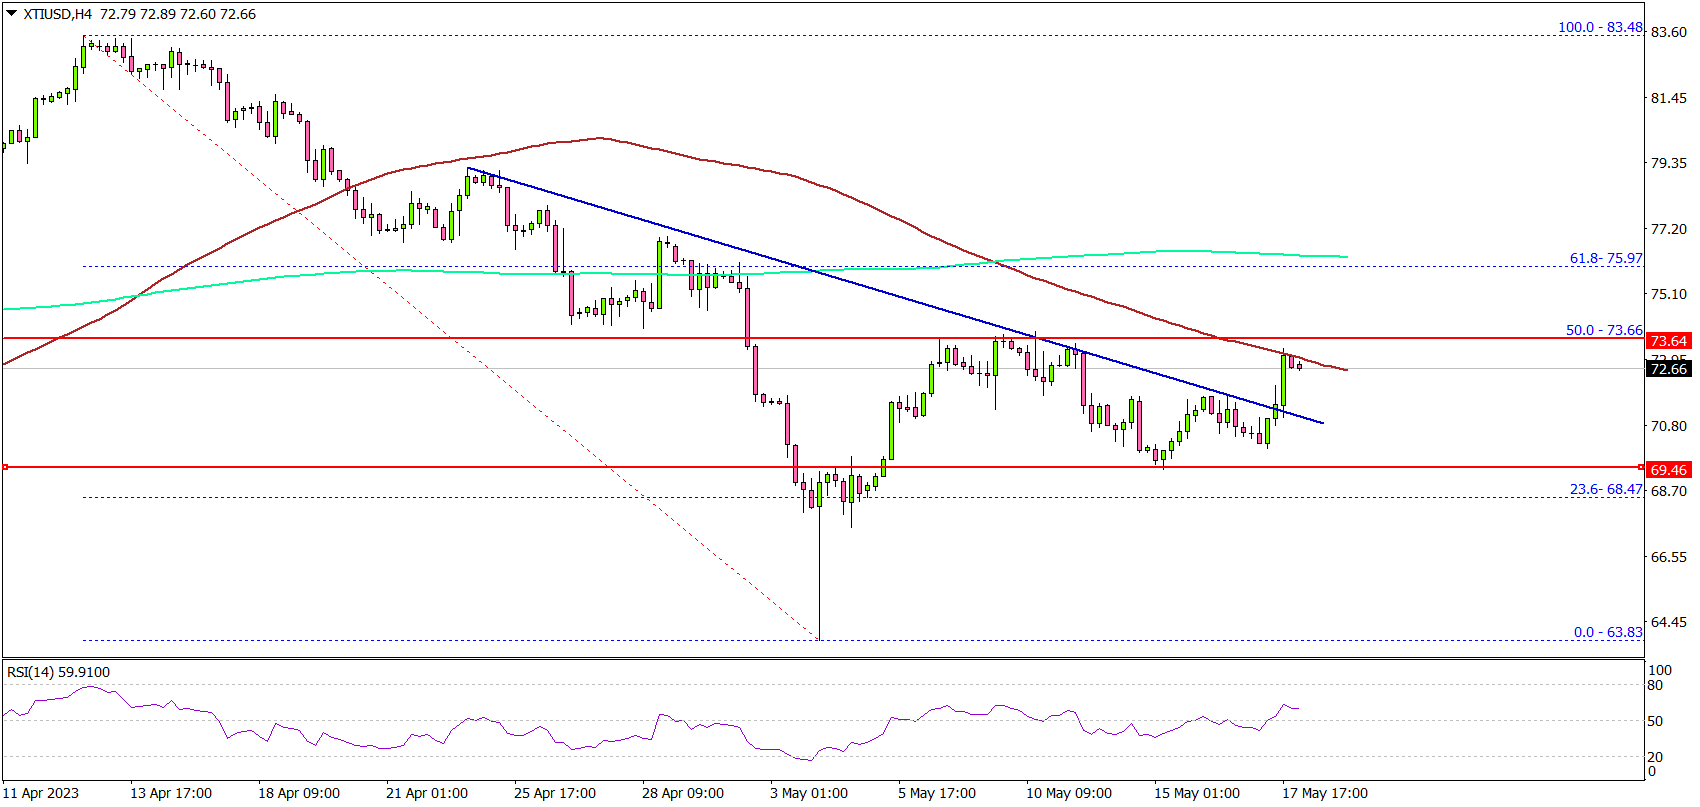
Looking at the 4-hour chart of XTI/USD, the price was able to settle above the $70 level. Besides, there was a break above a major bearish trend line with resistance near $70.80.
The price is now testing the $73 resistance and the 100 simple moving average (red, 4-hour). The first major resistance is near the $73.65 level which is near the 50% Fib retracement level of the downward move from the $83.48 swing high to the $63.83 low.
The next key resistance is near $76 and the 200 simple moving average (green, 4-hour), above which the price may perhaps accelerate higher.
On the downside, initial support is near the $70.80 level. The next major support sits near the $70.00 level. Any more losses might call for a test of the $68.00 support zone in the coming sessions.
Looking at EUR/USD, the pair is moving lower and there is now a risk of a downside break below the 1.0800 support zone.
Economic Releases to Watch Today
- US Initial Jobless Claims - Forecast 254K, versus 264K previous.
Analyzing Litecoin (LTCUSD) Impulsive Surge with Elliott Wave Theory
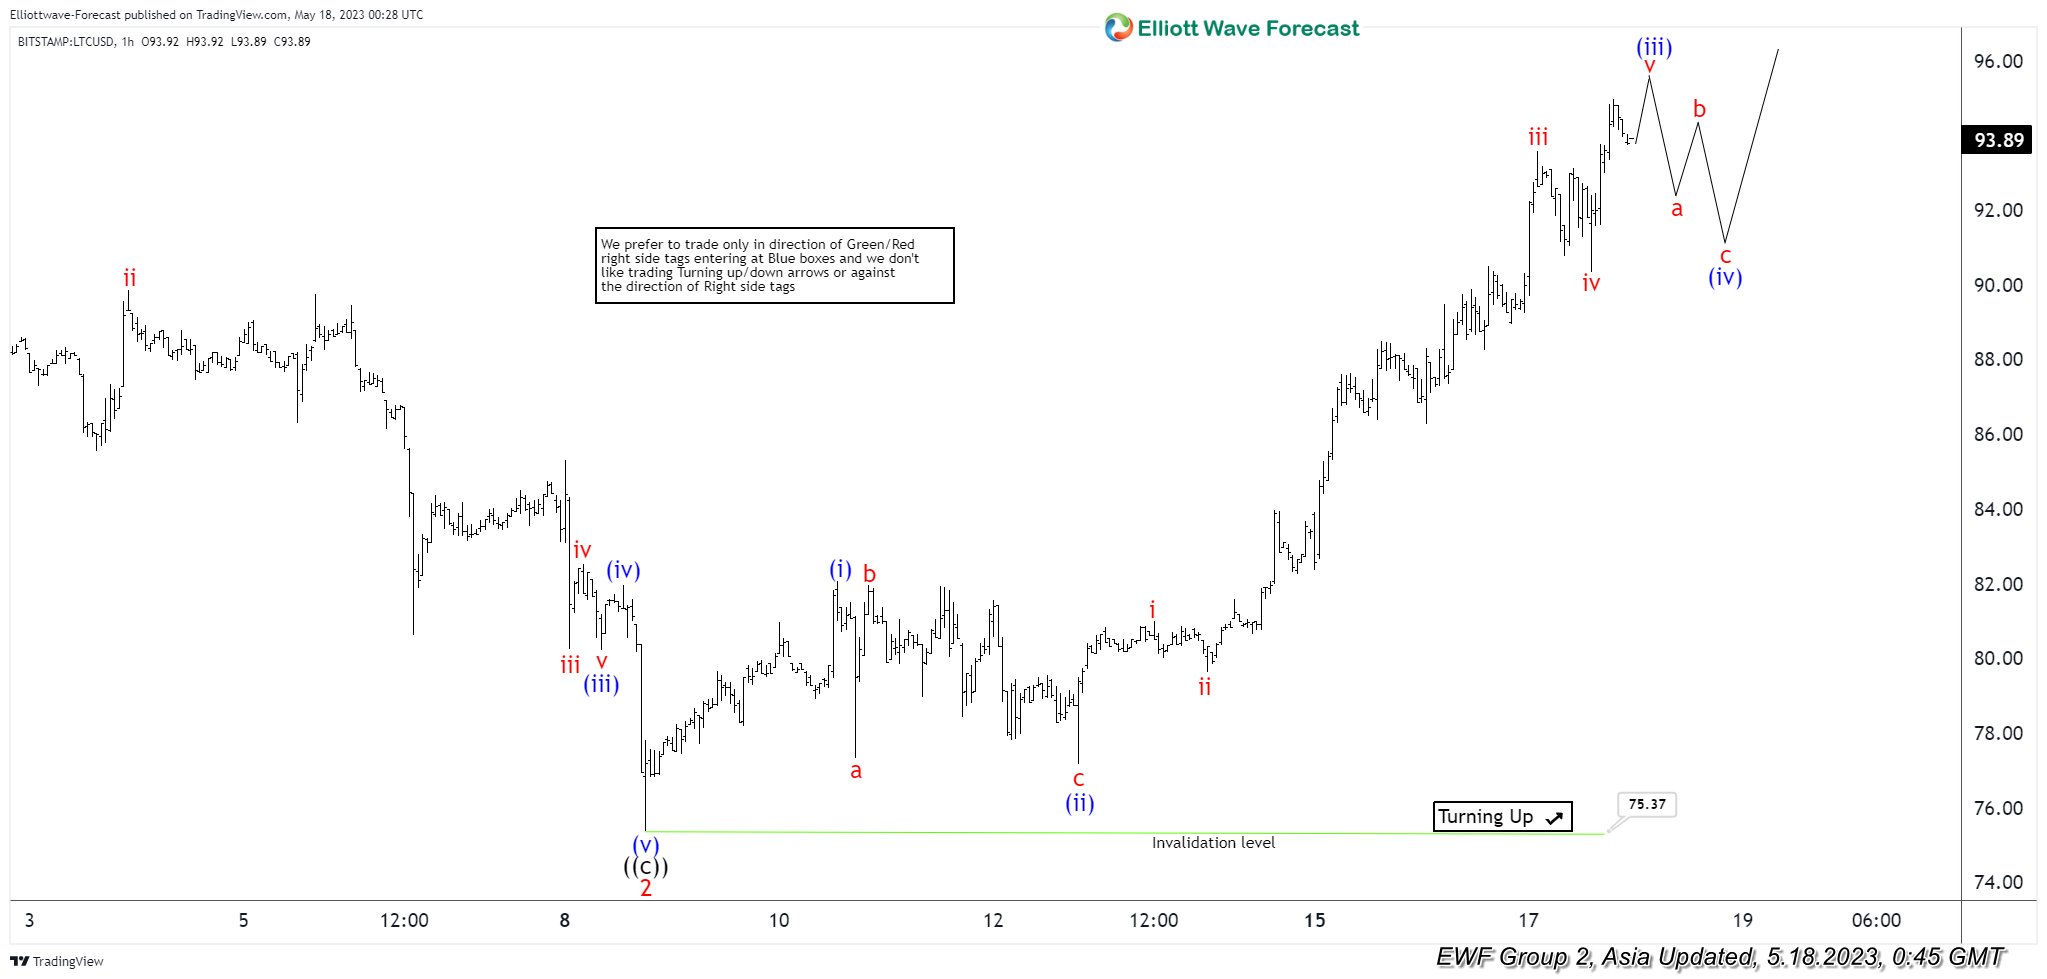
Short term Elliott Wave View in Litecoin (LTCUSD) suggests the rally from 3.11.2023 low takes the form of an impulsive Elliott Wave structure. Up from 3.11.2023 low, wave 1 ended at 103.41 and pullback in wave 2 ended at 75.37. The crypto-currency has now rallied higher in wave 3. Up from wave 2, wave (i) ended at 82.07 and pullback in wave (ii) ended at 77.17. Internal subdivision of wave (ii) unfolded as a zigzag where wave a ended at 77.33, wave b ended at 81.95, and wave c lower ended at 77.17. This completed wave (ii) in higher degree. Up from there, wave i ended at 81 and pullback in wave ii ended at 79.64.
Wave iii higher ended at 93.59 and pullback in wave iv ended at 90.34. Final leg higher wave v ended at 94.98 which completed wave (iii). Expect Litecoin to pullback in wave (iv) before turning higher again in wave (v). This would complete wave ((i)), and the crypto currency should then pullback in wave ((ii)) to correct cycle from 5.8.2023 low before the rally resumes again. Near term, as far as pivot at 75.37 low stays intact, expect pullback to find support in 3, 7, or 11 swing for further upside.
Litecoin (LTCUSD) 60 Minutes Elliott Wave Chart
Litecoin Elliott Wave Video
https://www.youtube.com/watch?v=nX1QaKTDeZ0
CADJPY Wave Analysis
- CADJPY broke key resistance level 101.00
- Likely to rise to resistance level 103.00
CADJPY under the bullish pressure after the earlier breakout of the key resistance level 101.00 (which has been reversing the pair from the start of December).
The breakout of the resistance level 101.00 continues the C-wave of the active intermediate ABC correction (2) from the start of May.
CADJPY can be expected to rise further toward the next resistance level 103.00 (forecast price for the completion of the active ABC correction (2)).

GBPJPY Wave Analysis
- GBPJPY broke resistance level 171.10
- Likely to test next resistance level 172.40
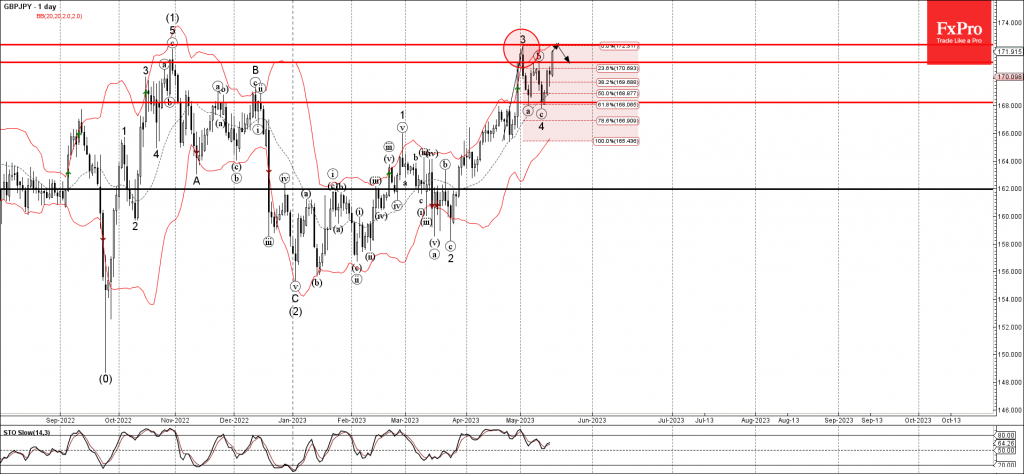
GBPJPY continues to rise after the earlier breakout of the resistance level 171.10 (upward target set in our previous report for this currency pair).
The breakout of the resistance level 171.10 continues the active short-term impulse wave 5, which belongs to wave (3) from January.
Given the predominant daily uptrend, GBPJPY can be expected to rise further toward the next resistance level 172.40 – from where the downward correction is likely.
British Pound Drifts Lower, Markets Eye Bailey Testimony
- BoE Governor Bailey to testify before Treasury Committee on Thursday
- Fed says remains open to rate hikes
- JP Morgan expects Fed to cut rates
Will monetary hearings shake up British pound?
The Bank of England will be in the spotlight on Thursday, as Governor Bailey testifies before the Treasury Committee. Lawmakers will likely pepper the Governor with questions about red-hot inflation, which remains in double-digits despite the BoE’s aggressive tightening. The BoE remains optimistic that inflation will fall more rapidly but there is pressure on the BoE to ratchet up the rate hikes to 50 or 75 basis points, as it did last year. Bailey will have his work cut out as he attempts to convince lawmakers to patiently wait for the tightening to percolate through the economy and dampen inflation.
Bailey stated today at a public engagement that inflation remains much too high, and that he would tighten policy if there was evidence of stronger inflationary pressures. I expect Bailey to reiterate this stance before the Treasury Committee on Thursday.
The Federal Reserve continues to pump out the message that rate hikes are on the table but rate cuts are not in the cards. Richmond Fed President Tom Barkin and Atlanta Fed President Raphael Bostic said earlier this week that the Fed could hike rates if high inflation persisted. The markets still think that the Fed could cut rates before the end of the year, and JP Morgan said on Tuesday “the market is right to be penciling in cuts”, as inflation remains too high and the US was likely headed for a recession.
GBP/USD Technical
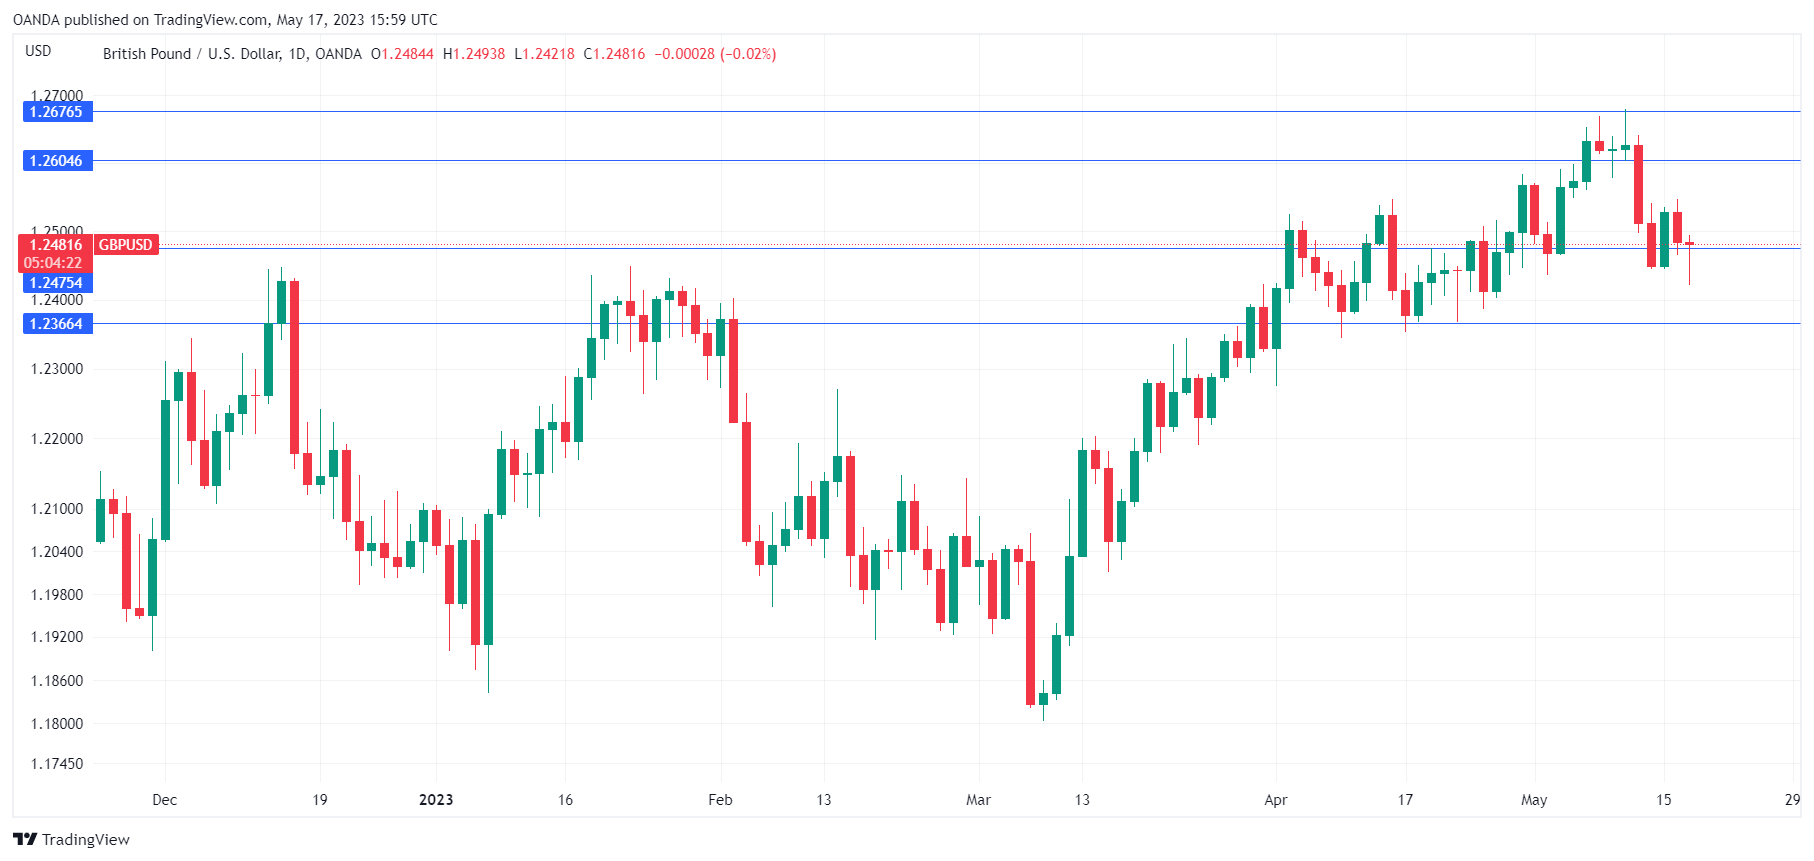
- GBP/USD is testing support at 1.2475. The next support line is 1.2366
- 1.2604 and 1.2676 are the next resistance levels
What Lies Ahead for the Crypto Market?
Here's the latest scoop: Paul Tudor Jones, the billionaire hedge fund manager, seems concerned about Bitcoin's appeal. He believes the growing unfriendly regulatory landscape in the United States makes Bitcoin less attractive. Additionally, the prospect of lower inflation and its impact on Bitcoin's price has got him a bit worried too. In a recent interview, Jones shared his thoughts on Bitcoin and the US economic scenario, painting a rather pessimistic picture. He mentioned how Bitcoin and Gold had lost some of their bullish charm as the whole "inflation hedge" narrative seems to be losing steam. But wait, there's more! The US government's tough stance on cryptocurrencies has also caught Jones' attention. The increased skepticism and scrutiny from regulatory bodies have made the crypto industry a hot topic. Despite his concerns, Jones still holds on to a small amount of Bitcoin in his investment portfolio. He believes that Bitcoin's finite supply, which humans can't manipulate, sets it apart from other assets. So, while he may have reservations, he's sticking with them. Let's see how these factors might impact Bitcoin's future!
US Dollar - H4 Timeframe
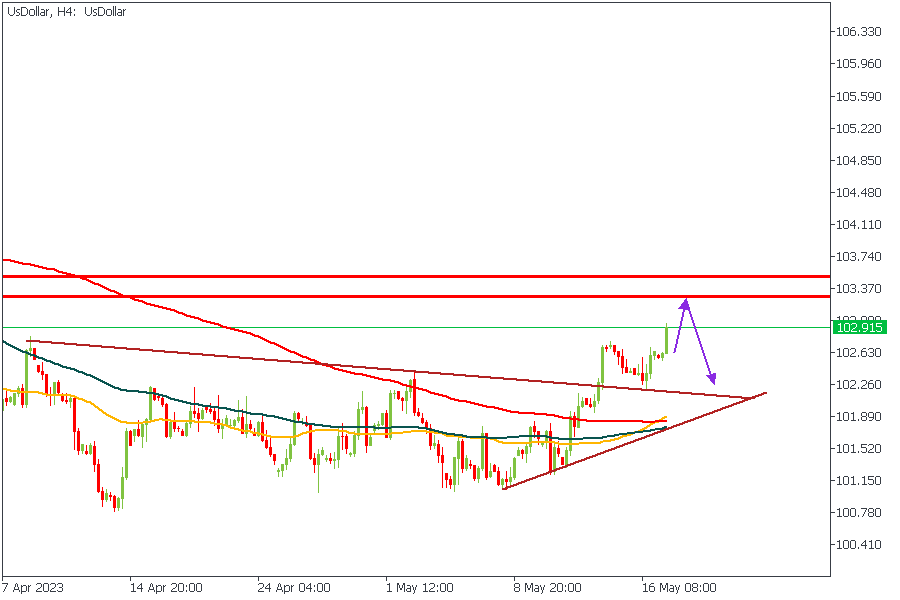
The US Dollar recovered spontaneously last week in response to the release of the CPI news. The resultant bullish movement broke out of a triangle pattern and is approaching a major supply zone on the Daily timeframe. My expectation based on this is that we should see a rejection from the supply zone that could push prices back to the trendline of the triangle pattern.
Analyst’s Expectations:
- Direction: Bearish
- Target: 102.420
- Invalidation: 103.550
BTCUSD - H4 Timeframe
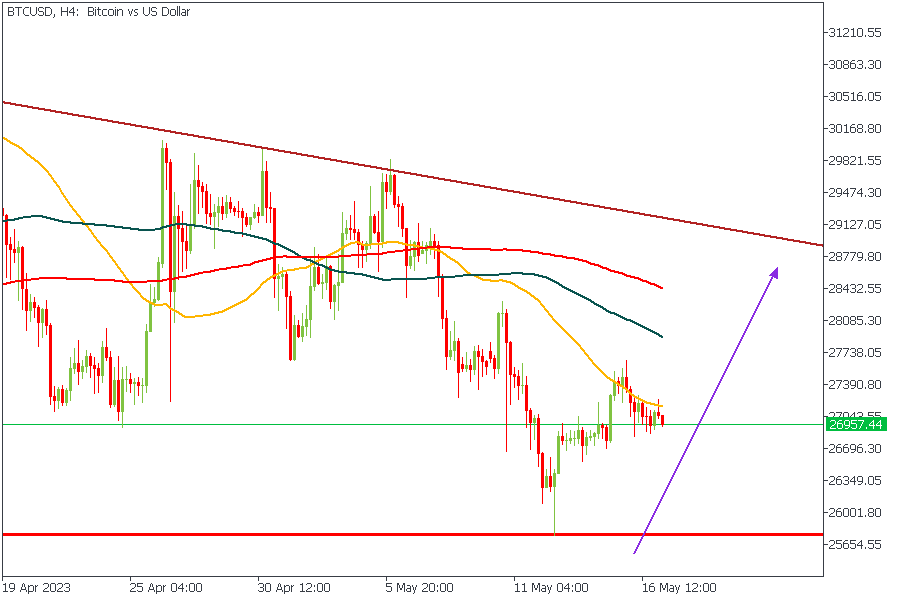
The strength of the US Dollar, coupled with the unfriendly sanctions in the United States, as previously mentioned in the introduction, has impacted the price action on the BTCUSD chart: the bearish price action on the chart, as seen above, is proof. However, the price is currently approaching a key area of support. It is expected to rebound off that area based on the projection of an impending US Dollar's impending weakness, as discussed earlier.
Analyst’s Expectations:
- Direction: Bullish
- Target: $27961.46
- Invalidation: $25394.90
ETHUSD - Daily Timeframe
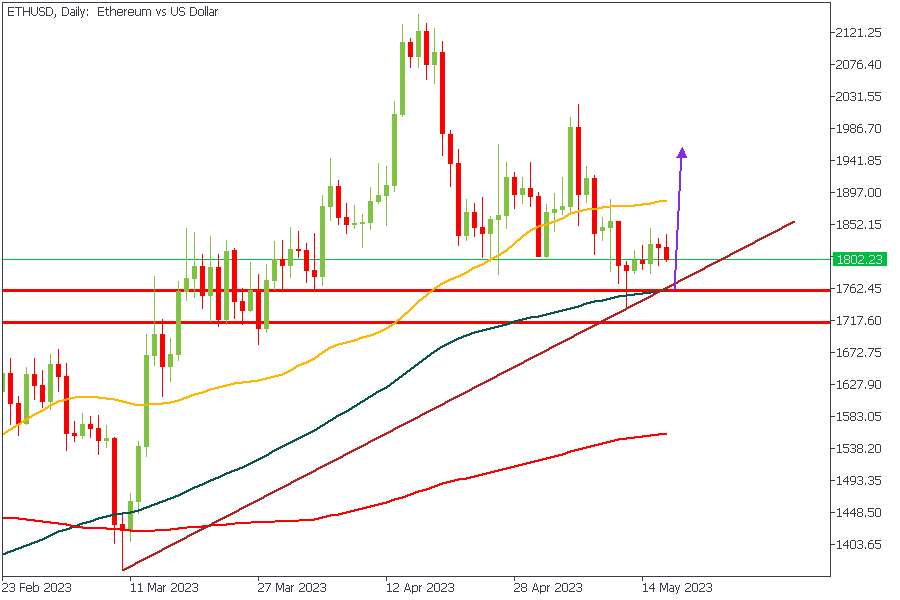
The overlap of the trendline support and the 100-Day moving average is a key confluence supporting a bullish reaction. The moving averages on the Daily timeframe of the ETHUSD chart are also arrayed in ascending order, another confirmation of a bullish trend. Correlating the technical analysis of Ethereum with the forecast from the US Dollar, I have reason to expect a bullish reaction from the highlighted pivot zone.
Analyst’s Expectations:
- Direction: Bullish
- Target: $1886.84
- Invalidation: $1724.66
XRPUSD - Daily Timeframe
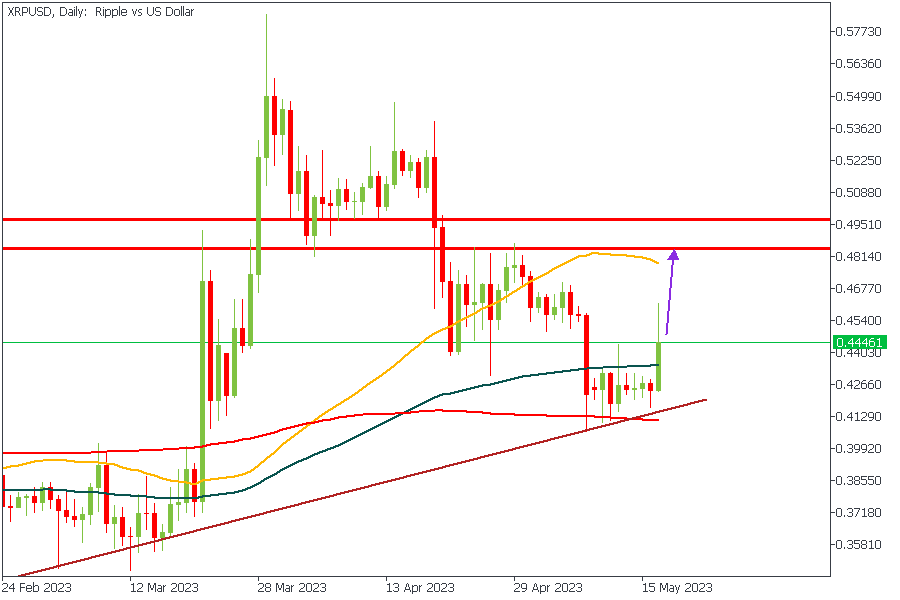
XRPUSD seems to have already commenced its bullish reaction from the support area, originating from the overlap of the trendline support and the 200-Day moving average. Similar to what we saw on the ETHUSD chart, the moving averages on Ripple are also arrayed in ascending order - another indication of likely bullish price action. My conclusion on this is that we will see some continuation of the bullish movement until the price hits the pivot zone I have highlighted.
Analyst’s Expectations:
- Direction: Bullish
- Target: $1889.51
- Invalidation: $1707.62
CONCLUSION
The trading of CFDs comes at a risk. Thus, to succeed, you have to manage risks properly. To avoid costly mistakes while you look to trade these opportunities, be sure to do your due diligence and manage your risk appropriately.
USD/JPY – Japan’s GDP Improves But Yen Slips
- USD/JPY climbs above 137
- Japan’s GDP surprises to the upside
- JP Morgan expects Fed to trim rates
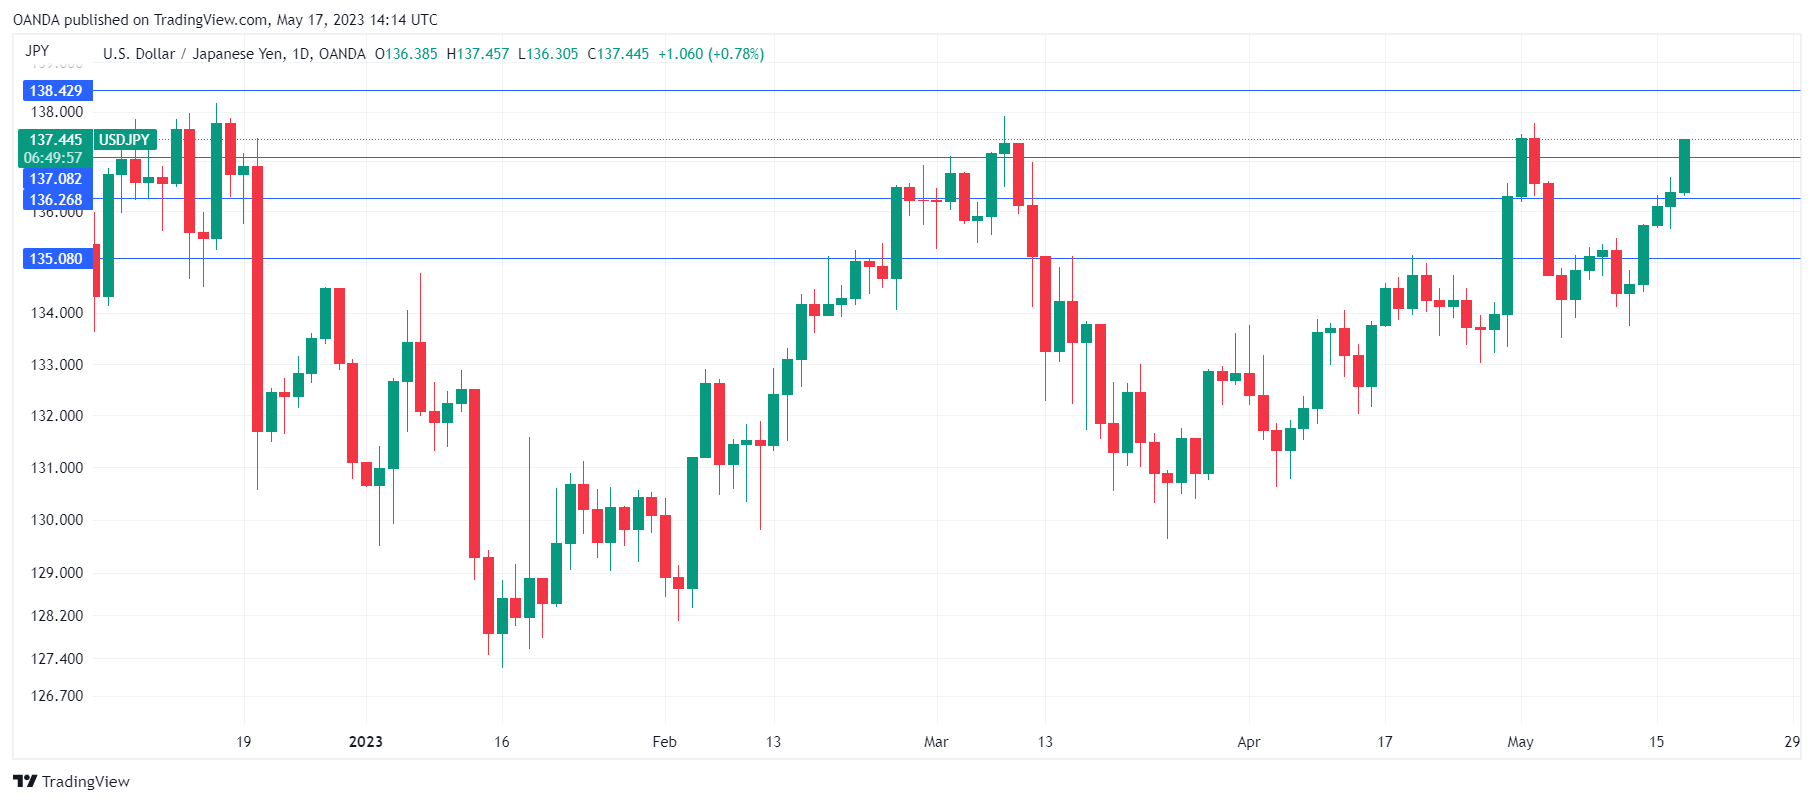
The Japanese yen is on a four-day losing streak and is in negative territory on Wednesday. In the North American session, the yen is trading at 137.39, up 0.74% on the day.
Japan’s GDP beats estimate
Japan’s GDP in the first quarter was higher than expected. The economy grew by 1.6% y/y, after a 0.1% decline in Q4 2022 and easily beat the estimate of 0.7%. On a quarterly basis, GDP expanded by 0.4%, up from 0.0% in Q4 and above the estimate of 0.1%.
One key driver behind the spurt in growth was personal consumption, as demand continues to rise now that the country has reopened. The services sector remains strong but manufacturing continues to struggle. On a sour note, exports fell 4.2% in Q4, as demand for semiconductors and automobiles declined.
The uptick in growth means that sustainable inflation could stay above 2%, and that could prod the Bank of Japan to take steps toward normalization, such as adjusting its yield curve control (YCC) policy. The BoJ has said it would consider tightening policy if inflation is sustainable above 2%, but any shifts in policy are likely to be small, especially if the yen remains weak. The BoJ announced it would conduct a policy review which could take a year or more, and I would not expect the BoJ to raise rates before 2024.
Federal Reserve members continued to remind listeners that more rate hikes are possible if inflation stays high. The Fed has also tried to dampen expectations of rate cuts in the second half of the year. The markets are listening somewhat, as the odds of a rate cut this year have fallen. JP Morgan came out in support of rate cuts on Tuesday, saying that “the market is right to be penciling in cuts”, as inflation remains too high and the US was likely headed for a recession.
USD/JPY Technical
- USD/JPY is testing resistance at 137.08. Above, the next resistance line is 138.42
- There is support at 136.26 and 135.08