Sample Category Title
EUR/AUD Daily Outlook
Daily Pivots: (S1) 1.6226; (P) 1.6292; (R1) 1.6342; More...
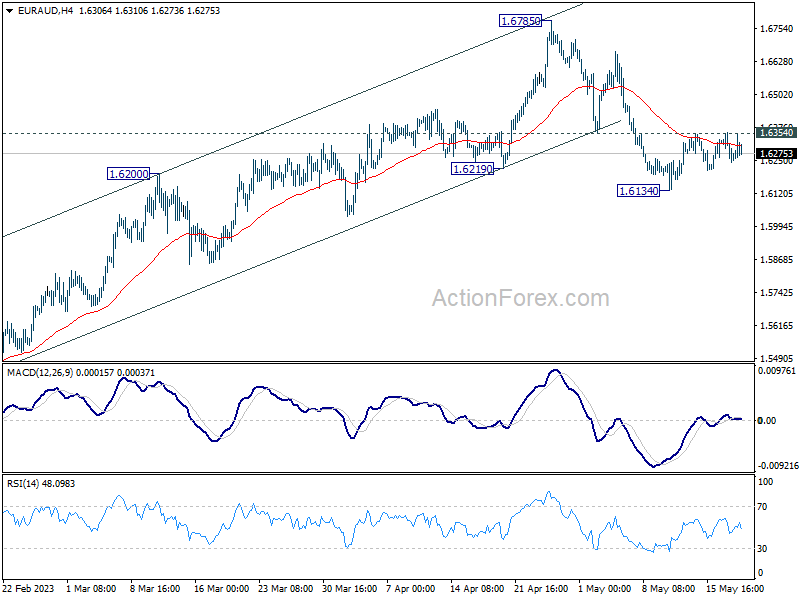
No change in EUR/AUD's outlook and intraday bias stays neutral first. Further decline is expected with 1.6354 minor resistance intact. Considering bearish divergence condition in D MACD, fall from 1.6785 might be a correction to whole up trend from 1.4281. Break of 1.6134 will target 38.2 retracement of 1.4281 to 1.6785 at 1.5828, which is inside 1.5254/5976 support zone. Nevertheless, sustained break of 1.6354 minor resistance will turn bias back to the upside for retesting 1.6785 high instead.
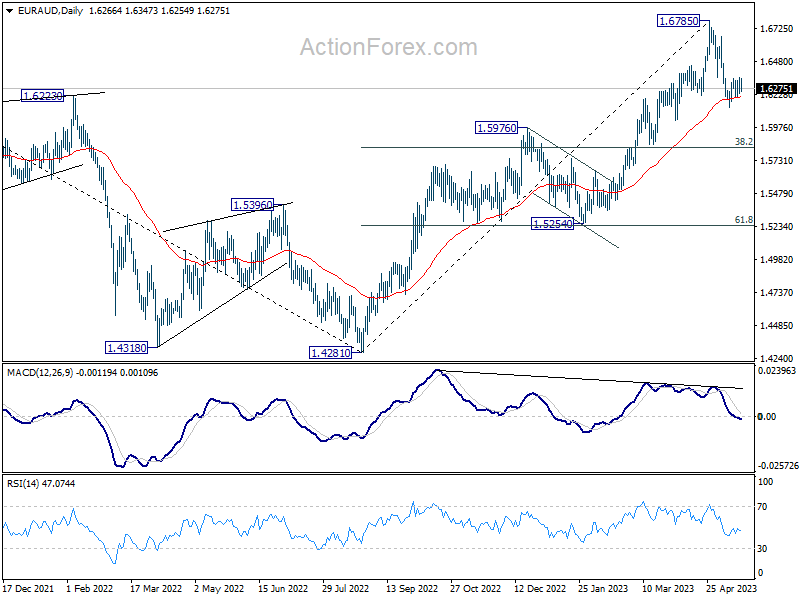
In the bigger picture, whole down trend from 1.9799 (2020 high) should have completed at 1.4281 (2022 low). Further rise should be seen to 61.8% retracement of 1.9799 to 1.4281 at 1.7691 next. For now, outlook will stay bullish as long as 1.5976 resistance turned support holds, even in case of deep pull back.
EUR/JPY Daily Outlook
Daily Pivots: (S1) 148.46; (P) 148.86; (R1) 149.65; More....
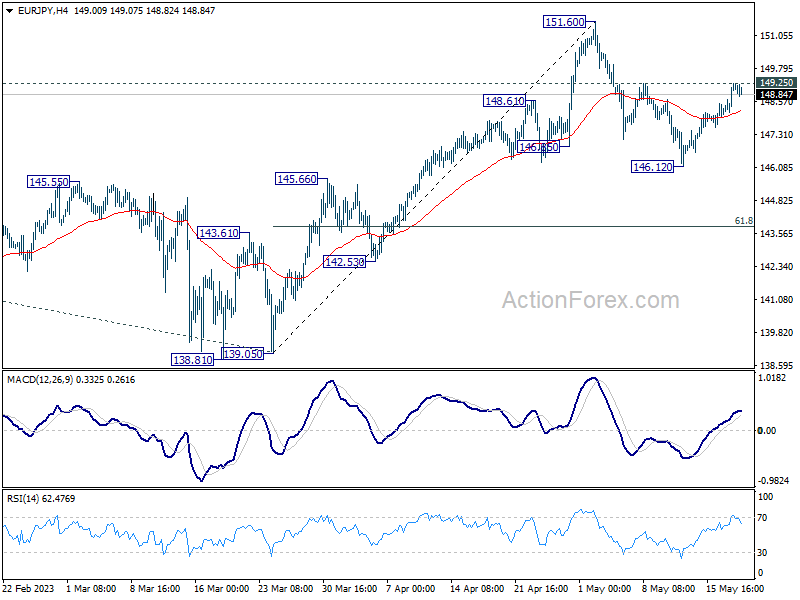
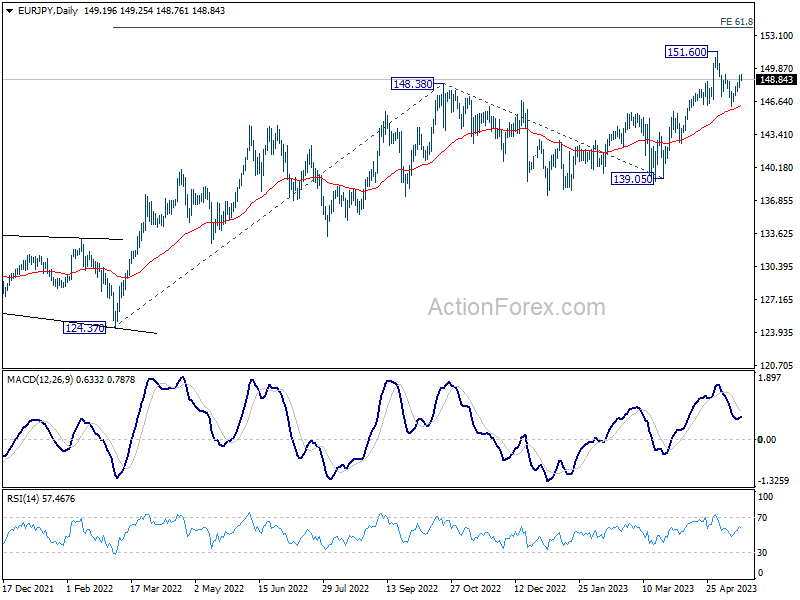
Intraday bias in EUR/JPY remains neutral first. Firm break of 149.25 resistance will argue that pull back from 151.60 has completed at 146.12 already. Stronger rally should be seen back to retest 151.60. On the downside, however, break of 146.12 will resume the fall to 61.8% retracement of 139.05 to 151.60 at 143.84.
In the bigger picture, rise from 114.42 (2020 low) is in progress. Next target is 61.8% projection of 124.37 to 148.38 from 138.81 at 153.64. Sustained break there will pave the way to 100% projection at 162.82. For now, medium term outlook will remain bullish as long as 139.05 support holds, even in case of deep pull back.
GBP/JPY Daily Outlook
Daily Pivots: (S1) 170.71; (P) 171.36; (R1) 172.60; More...
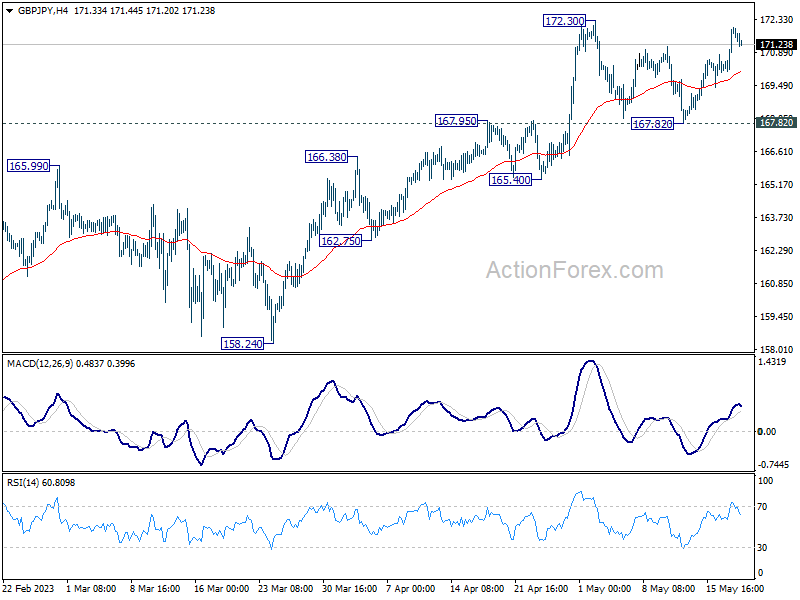
While GBP/JPY rebounded strongly, upside is limited below 172.30 resistance so far. Intraday bias remains neutral first. On the upside, break of 172.30 will resume larger up trend to 100% projection of 148.93 to 172.11 from 155.33 at 178.51. Nevertheless, firm break of 167.82 support should confirm short term topping, and turn bias back to the downside for deeper pull back to 165.40 support and possible below instead.
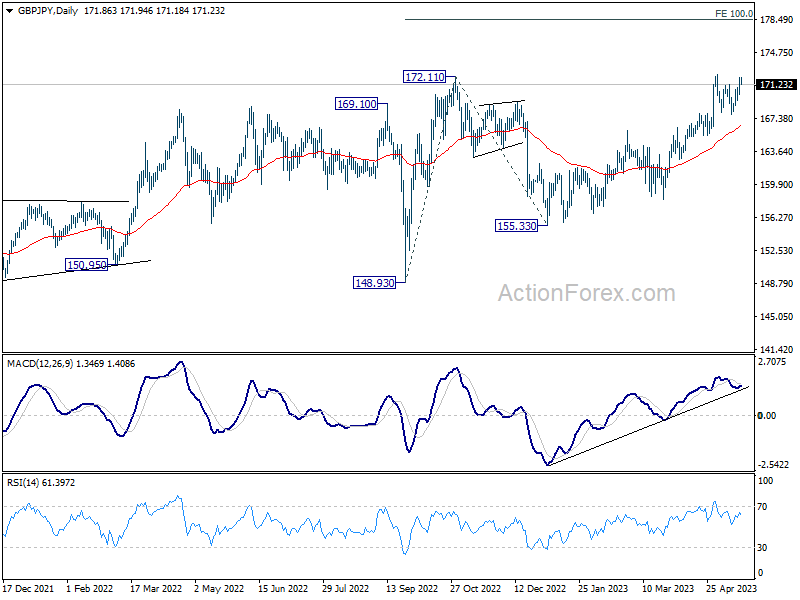
In the bigger picture, focus stays on 172.11 resistance (2022 high). Decisive break there will resume whole up trend from 123.94 (2020 low). Next target will be 161.8% projection of 122.75 (2016 low) to 156.59 (2018 high) from 123.94 at 178.69. Nevertheless, firm break of 165.40 support will indicate rejection by 172.11 and extend the corrective pattern from there with another falling leg.
EUR/CHF Daily Outlook
Daily Pivots: (S1) 0.9725; (P) 0.9744; (R1) 0.9759; More...
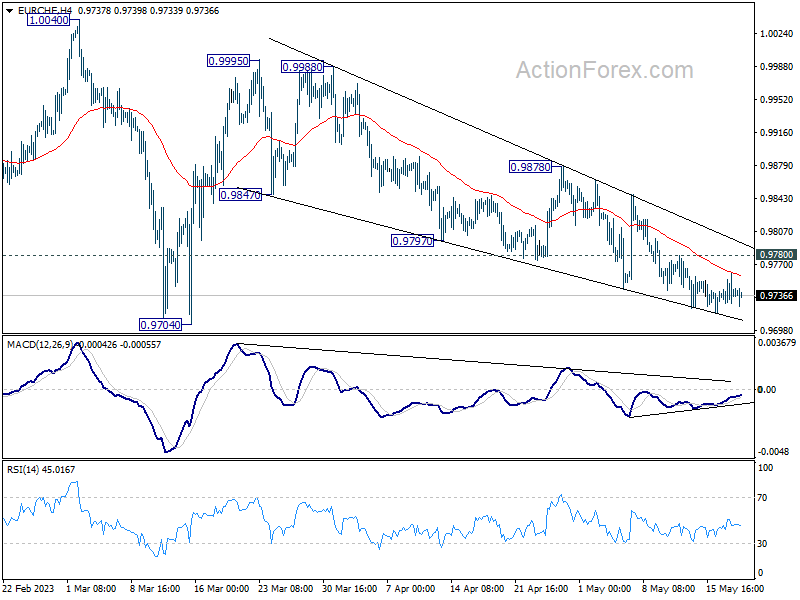
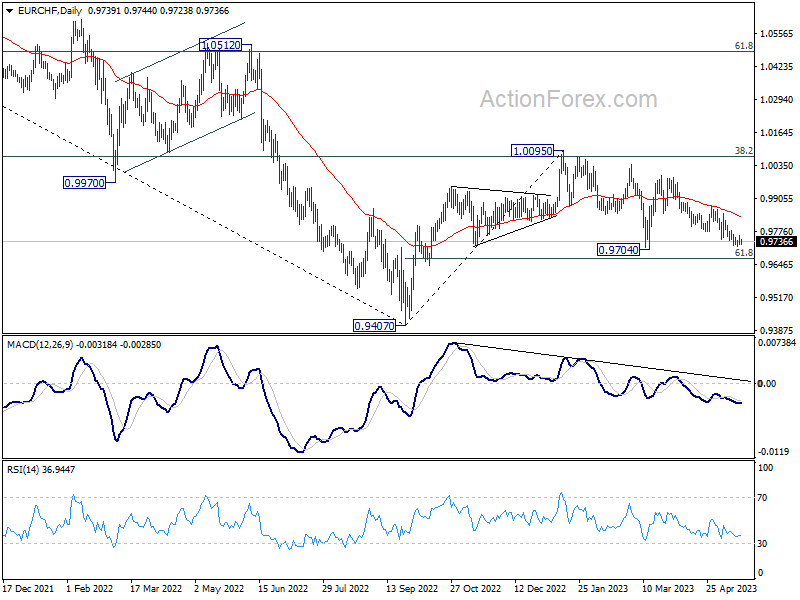
Outlook in EUR/CHF remains unchanged. Choppy decline from 0.9995 might extend lower. But strong support should be seen from 0.9704 to bring rebound. Break of 0.9847 will argue that the fall has completed and turn bias back to the downside. However, firm break of 0.9704 will resume the whole decline from 1.0095 to 61.8% retracement of 0.9407 to 1.0095 at 0.9670.
In the bigger picture, prior rejection by 38.2% retracement of 1.1149 to 0.9407 at 1.0072 suggests that medium term outlook is staying bearish. The pair is also capped below 55 W EMA (now at 0.9963). Down trend from 1.2004 is not completed yet and is in favor to resume through 0.9407 at a later stage. However, decisive break of 1.0095 resistance will raise the chance of bullish trend reversal. Rise from 0.9407 should then target 1.0505 cluster resistance (2020 low at 1.0505, 61.8% retracement of 1.1149 to 0.9407 at 1.1484).
Silver Bears Ride the Curve, Ready to Test Key Support Level
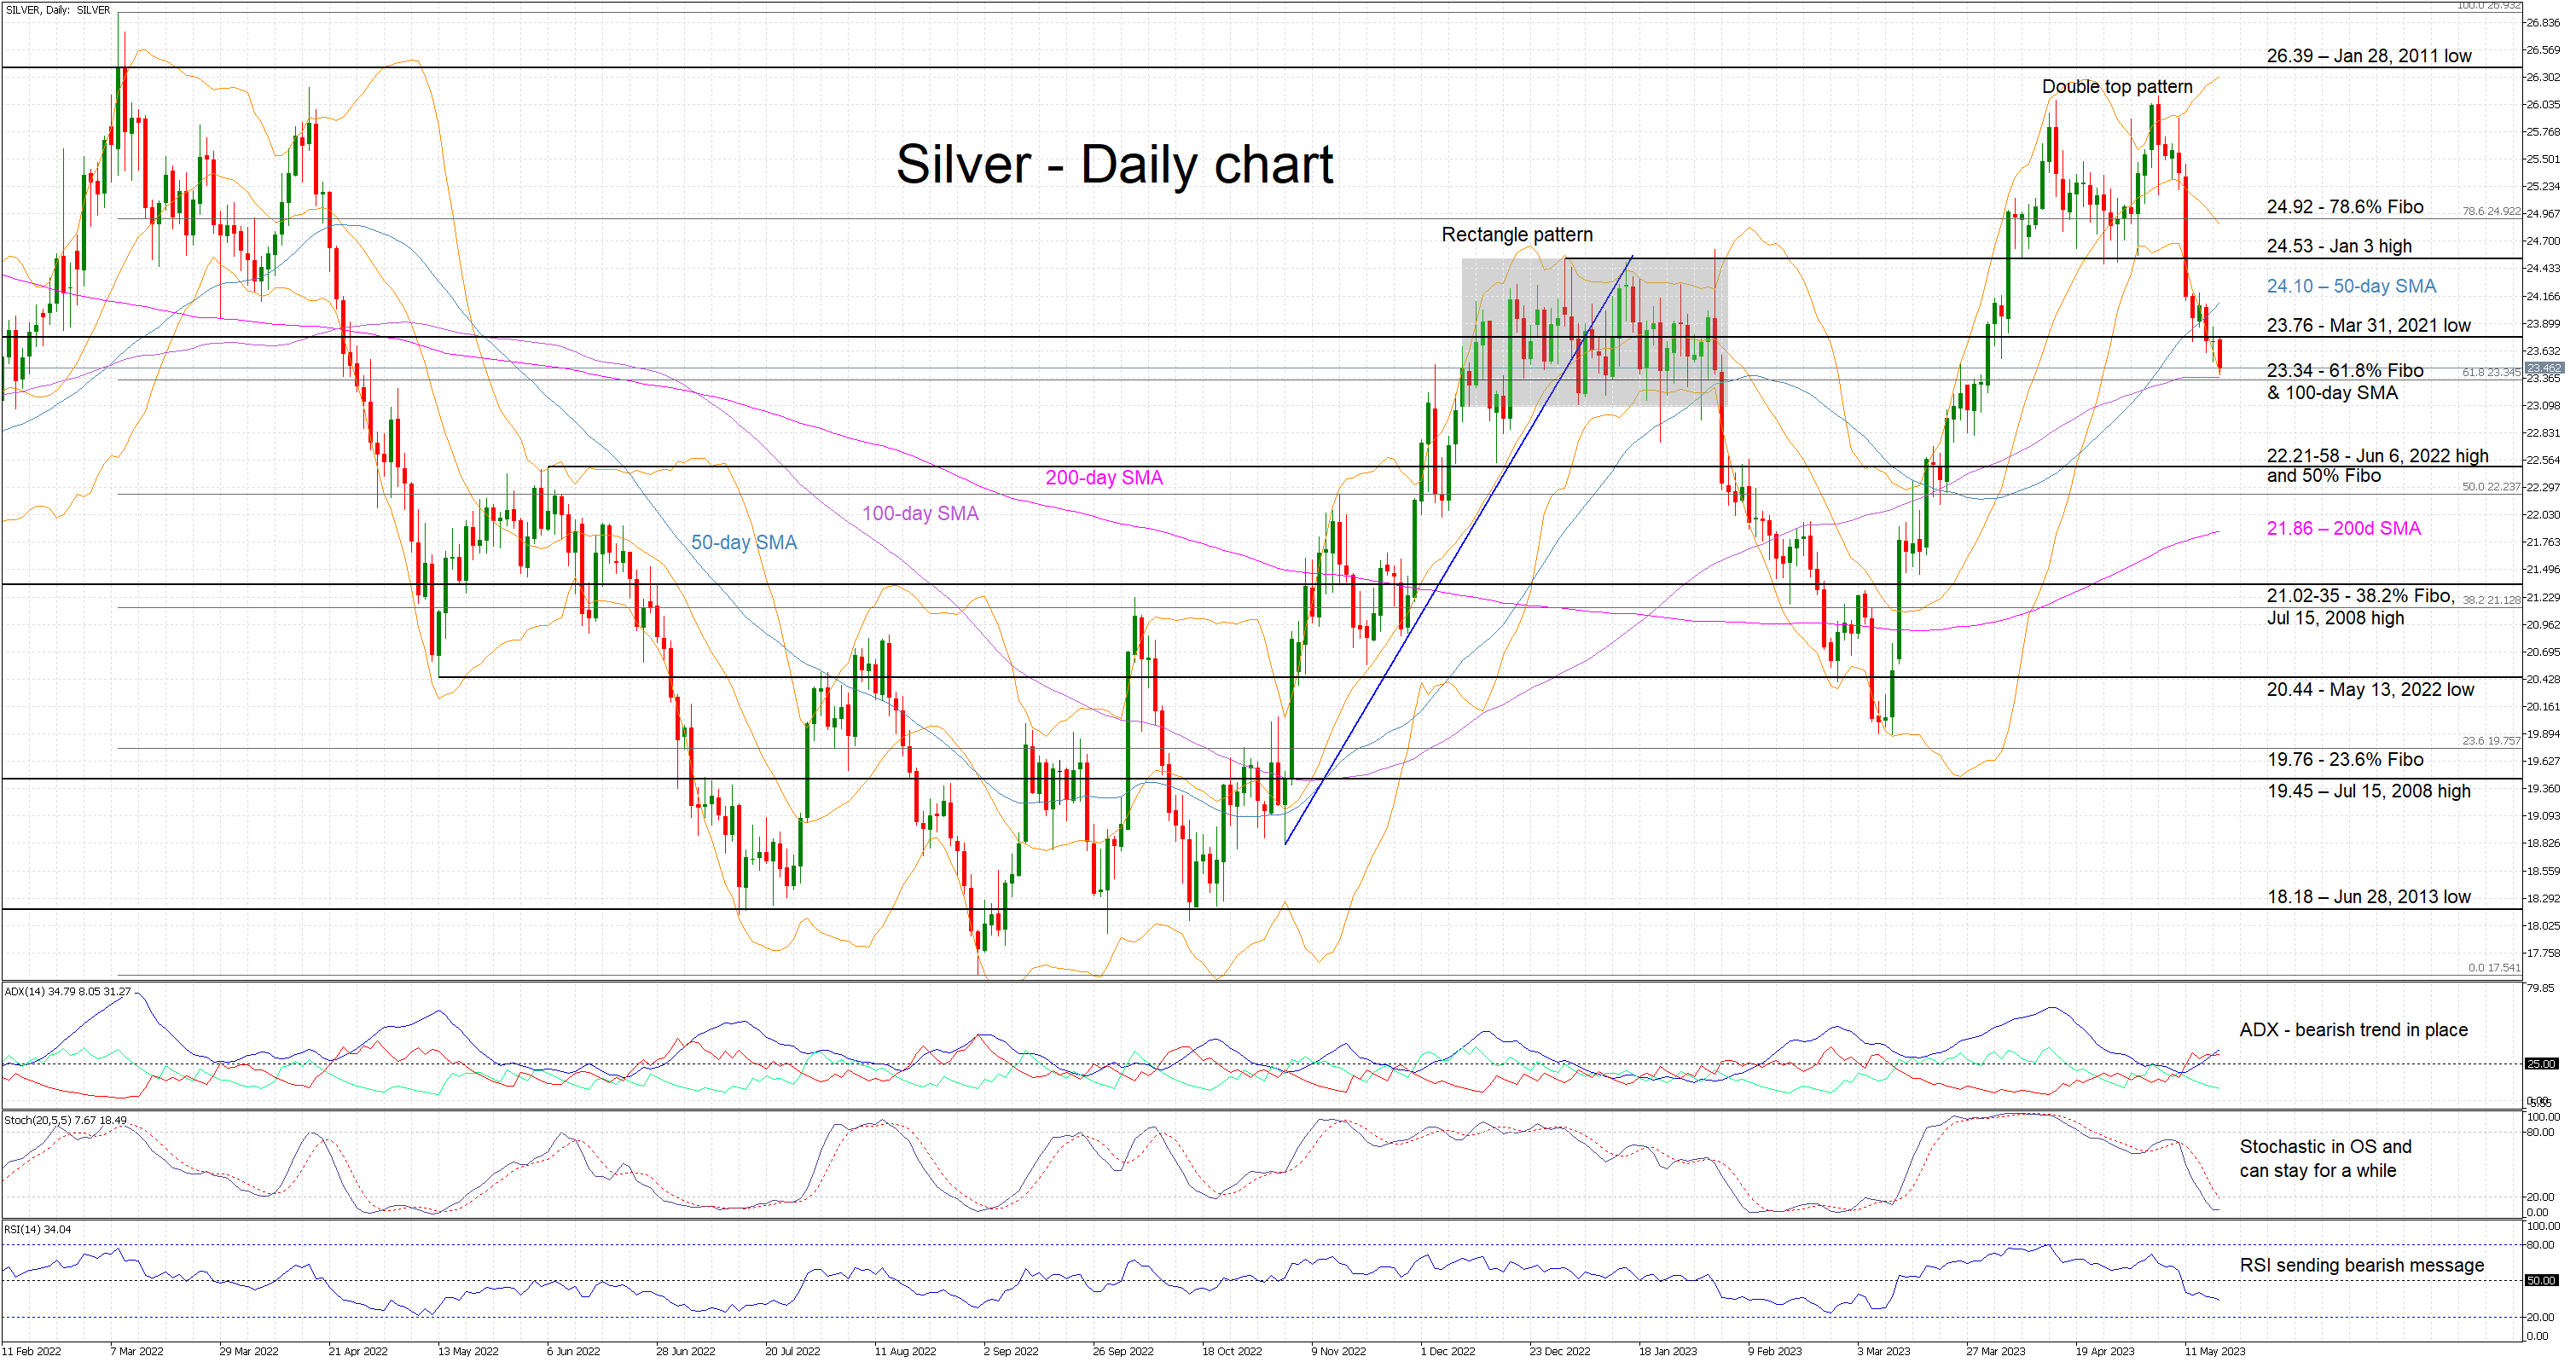
Silver is edging lower today, a continuation of last week's downleg. The recent double top pattern seems to be encouraging this move lower after the break of its neckline at 24.48 on May 11. With this pattern’s target being at around 22.9, the bears could remain confident.
In the meantime, the overall technical picture remains bearish. The Average Directional Movement Index (ADX) is edging higher, confirming the presence of a muted bearish trend in silver, and the RSI has sunk below its 50-threshold. The stochastic oscillator is scraping the bottom of its oversold area and, considering the wider environment, it can stay there for a while.
Amidst this environment, the bears appear to be targeting the 23.34 level populated by the 61.8% Fibonacci retracement of March 8, 2022 – September 1, 2022 downtrend and the 100-day simple moving average (SMA). Should they manage to break this level, they would then come up against the busy 22.21-22.58 area. This range is defined by the June 6, 2022 high and the 50% Fibonacci retracement, and could prove to be a real test of bears’ resolve.
On the other hand, the bulls should not despair. A successful battle for the key 23.34 level would potentially help them build some momentum as they set their eyes on the March 31, 2021 low at 23.76. Higher, the 24.10 and 24.53 levels respectively would be critical for the fate of the current short-term bearish trend.
To conclude, silver bears have been staging an impressive decline since the early May highs. The overall technical picture is still favouring them, but the bulls appear ready for a comeback if 23.34 is not broken convincingly.
WTI Futures Stuck in Range after Bounce Off 17-month Low
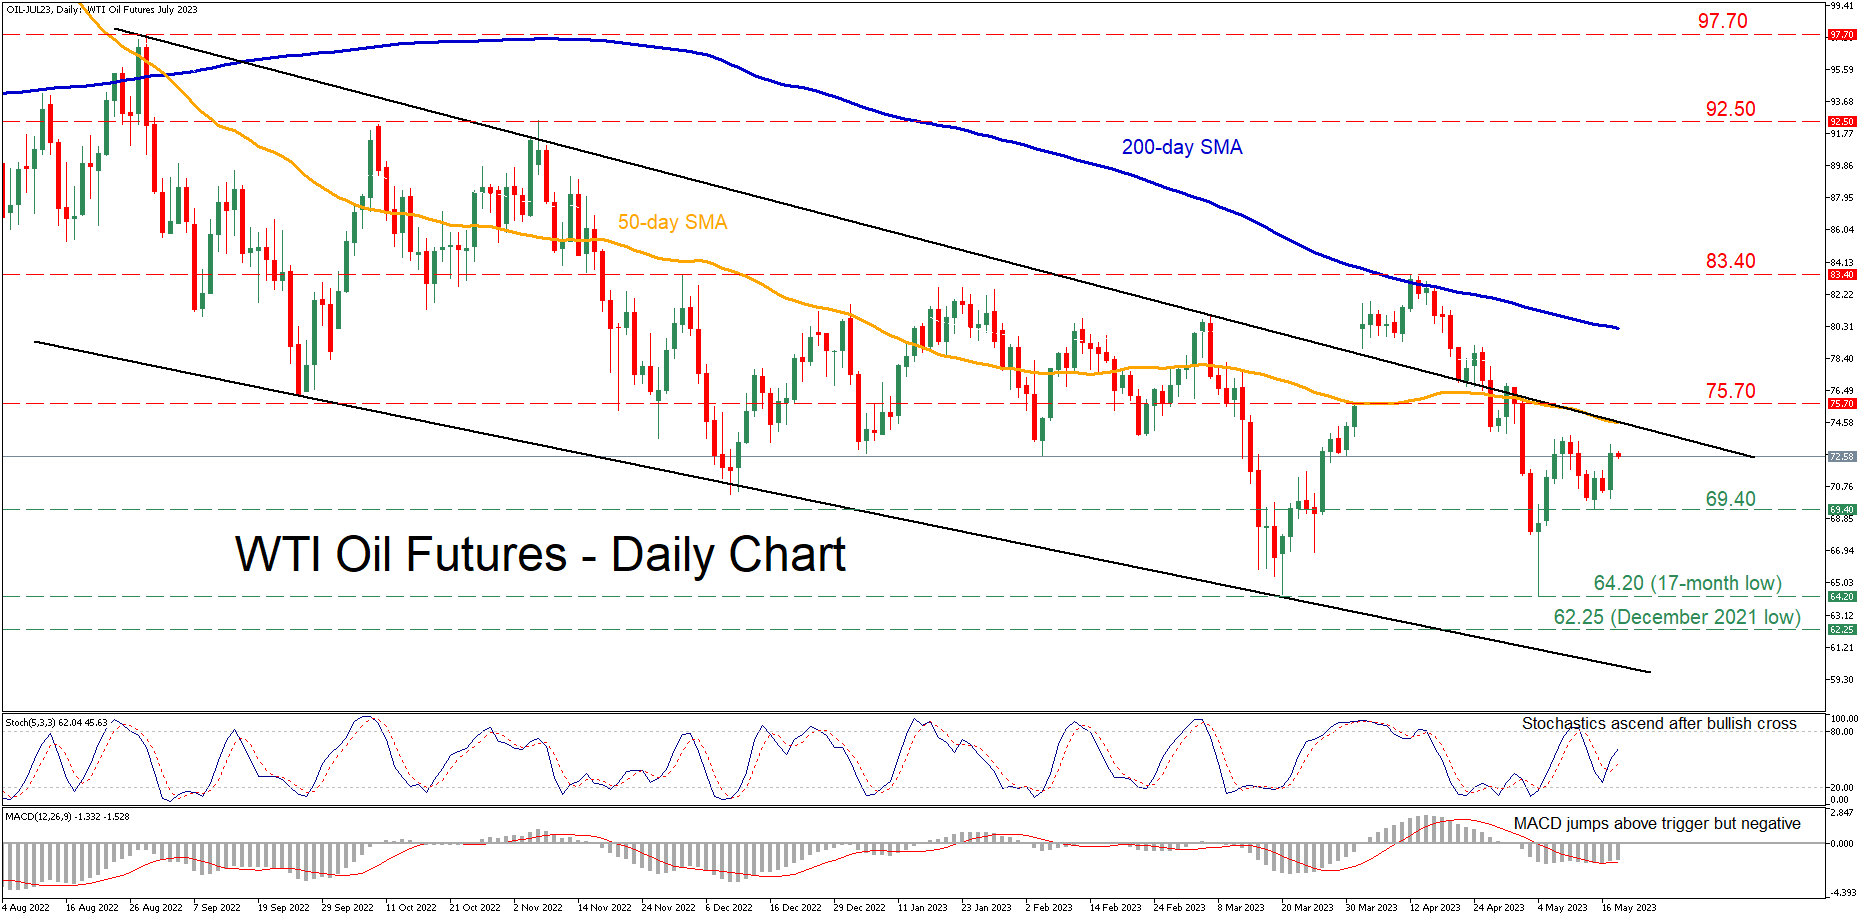
WTI oil futures (July delivery) had been in recovery mode, but the 200-day simple moving average (SMA) recently rejected their latest advance. Since then, the price plummeted to a fresh 17-month low of 64.20 before recouping some losses.
The momentum indicators currently suggest that bearish forces are subsiding but remain in control. Specifically, the stochastic oscillator is ascending after posting a bullish cross, while the MACD jumped above its trigger line in the negative area.
Should buyers re-emerge and push the price higher, immediate resistance could be met at the 75.70 hurdle. Surpassing that zone, the price may ascend to challenge the 2023 peak of 83.40. Further advances could then cease at the November 2022 high of 92.50 before the August 2022 peak of 97.70 comes under examination.
On the flipside, bearish actions could send the price to test the recent support of 69.40. A violation of that zone could open the door for the 17-month low of 64.20. Sliding beneath that floor, the price could descend towards levels not seen in the past few months, where the December 2021 low of 62.25 could provide downside protection.
In brief, WTI oil futures experienced a sharp decline and posted a fresh multi-month low, forming a bullish double-bottom pattern. For that scenario to materialize, the price needs to escape its downward sloping channel to the upside.
EUR/USD Daily Outlook
Daily Pivots: (S1) 1.0808; (P) 1.0841; (R1) 1.0872; More...
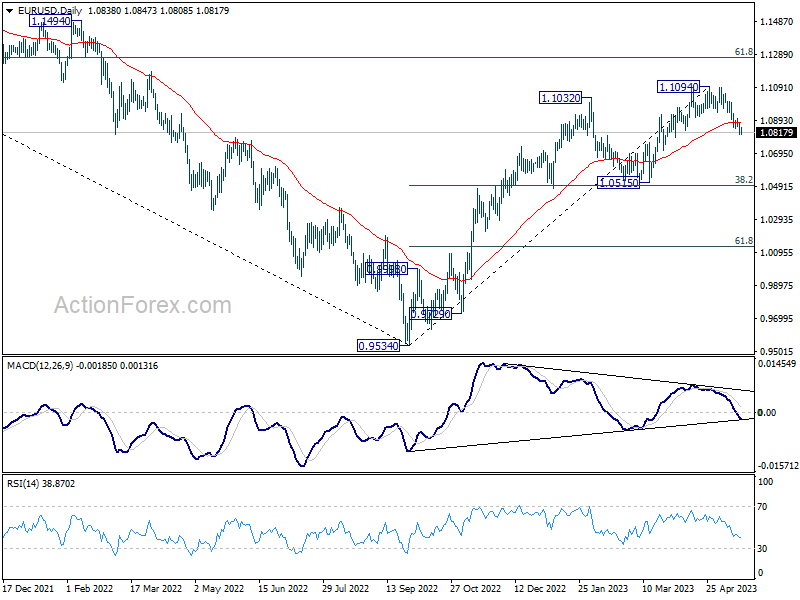
Intraday bias in EUR/USD remains on the downside as fall from 1.1094 short term top is in progress. Current decline is seen as correcting whole up trend from 0.9534. Deeper fall would be seen to 1.0515 cluster support, 38.2% retracement of 0.9534 to 1.1094 at 1.0498. On the upside, above 1.0903 minor resistance will turn intraday bias neutral first.
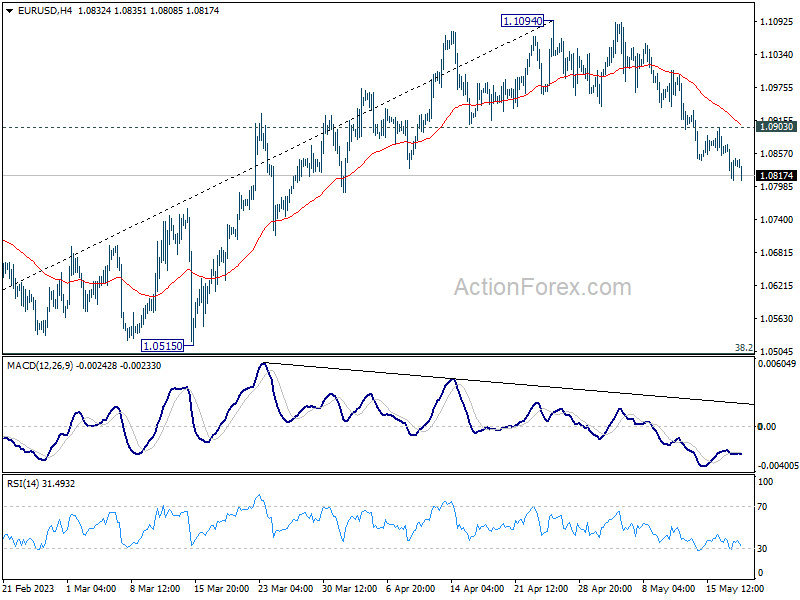
In the bigger picture, as long as 1.0515 support holds, rise from 0.9534 (2022 low) would still extend higher. Sustained break of 61.8% retracement of 1.2348 (2021 high) to 0.9534 at 1.1273 will solidify the case of bullish trend reversal and target 1.2348 resistance next (2021 high).
GBP/USD Daily Outlook
Daily Pivots: (S1) 1.2436; (P) 1.2473; (R1) 1.2524; More...
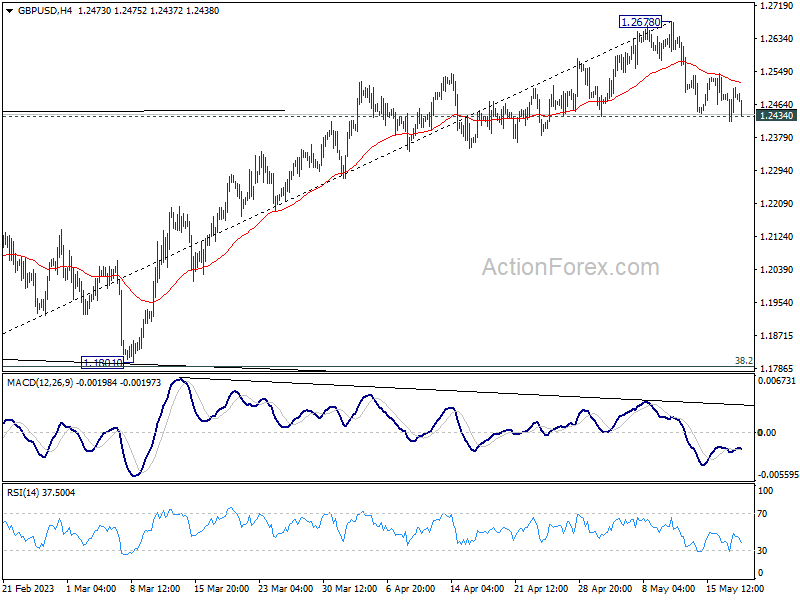
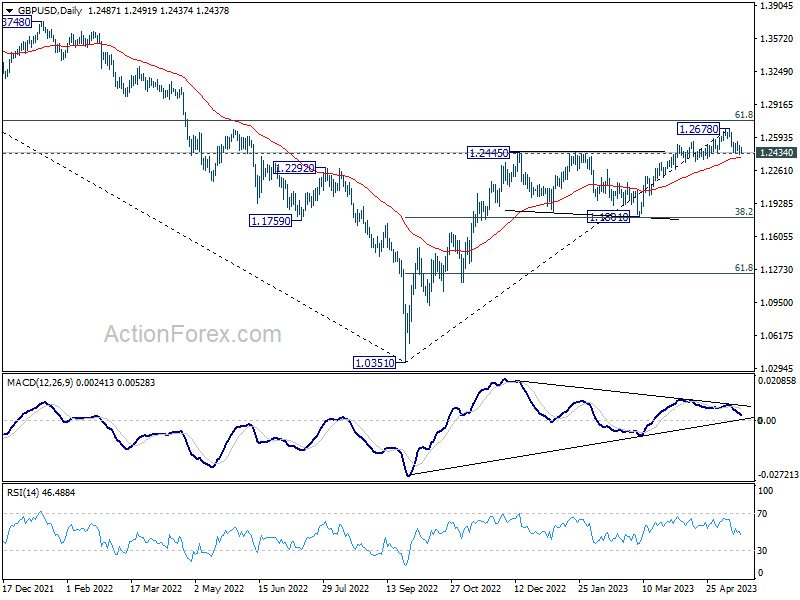
Intraday bias in GBP/USD remains neutral at this point. On the downside, firm break of 1.2434 will confirm short term topping at 1.2678, on bearish divergence condition in 4H MACD. Intraday bias will be back on the downside for 1.1801 cluster support (38.2% retracement of 1.0351 to 1.2678 at 1.1789), as correction to whole up trend from 1.0351. On the upside, however, break of 1.2678 will resume larger up trend from 1.0351 instead.
In the bigger picture, as long as 1.1801 support holds, rise from 1.0351 medium term bottom (2022 low) is expected to extend further. Sustained break of 61.8% retracement of 1.4248 (2021 high) to 1.0351 at 1.2759 will add to the case of long term bullish trend reversal. However, firm break of 1.1801 will indicate rejection by 1.2759, and bring deeper decline, even as a correction.
USD/CHF Daily Outlook
Daily Pivots: (S1) 0.8947; (P) 0.8987; (R1) 0.9024; More...
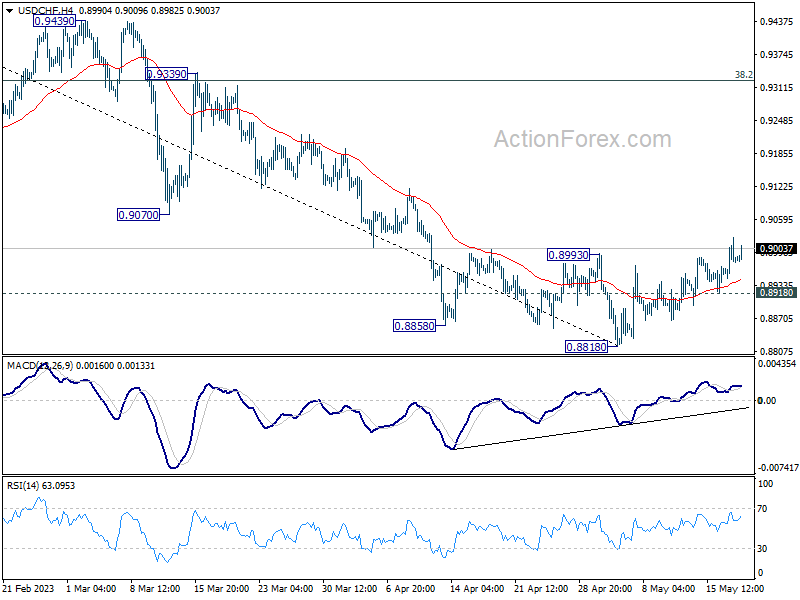
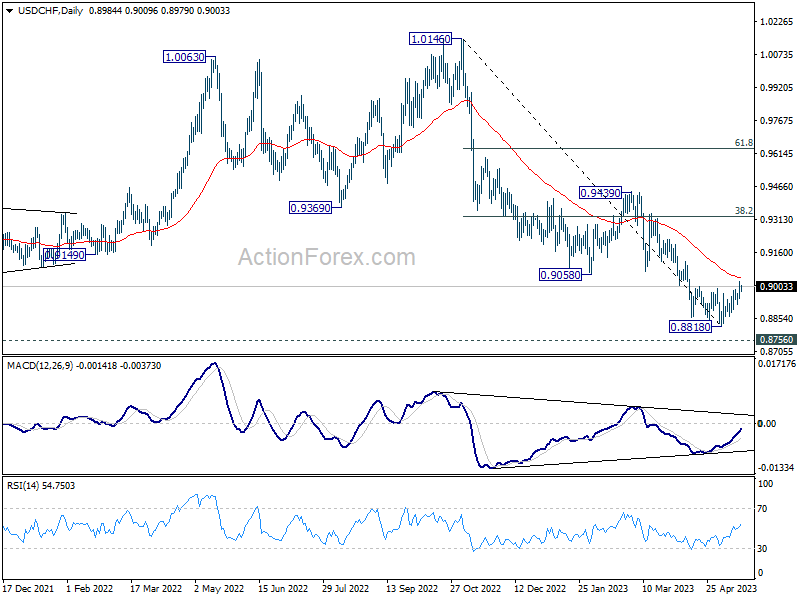
Intraday bias in USD/CHF stays on the upside at this point. Rise from 0.8818 short term bottom is at least corrective whole down trend from 1.0146. Sustained break of 55 D EMA (now at 0.9042) will confirm this case and target 38.2% retracement of 1.0146 to 0.8818 at 0.9325. On the downside, below 0.8918 minor support will turn intraday bias neutral first.
In the bigger picture, fall from 1.1046 (2022 high) is seen as a leg in the long term range pattern from 1.0342 (2016 high). So, downside should be contained by 0.8756 to bring reversal. Sustained break of 0.9058 support turned resistance will be the first sign of medium term bottoming. However, decisive break of 0.8756 will carry larger bearish implications.
USD/JPY Daily Outlook
Daily Pivots: (S1) 136.78; (P) 137.24; (R1) 138.18; More...
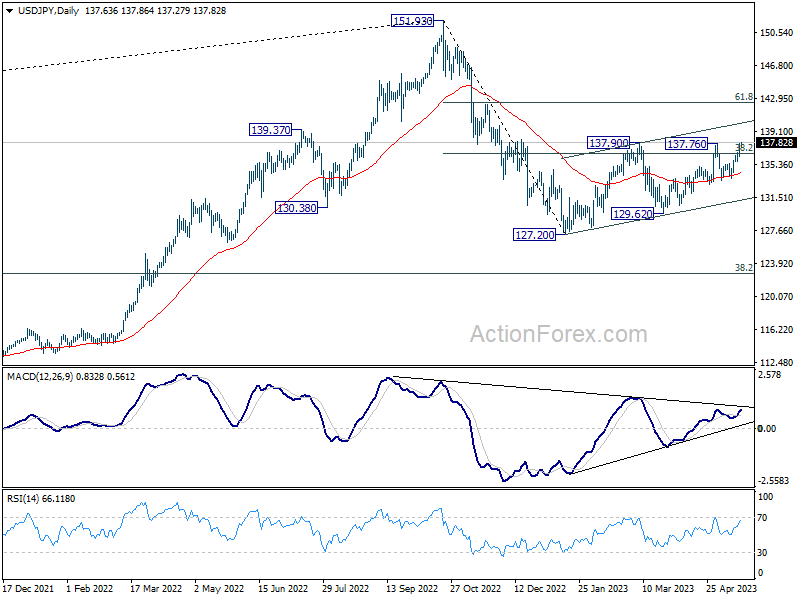
Intraday bias in USD/JPY remains on the upside at this point. Decisive break of 137.76/90 resistance zone will resume whole rebound from 127.20. Next target is 142.48 fibonacci level. On the downside, below 136.67 minor support will turn intraday bias neutral first.
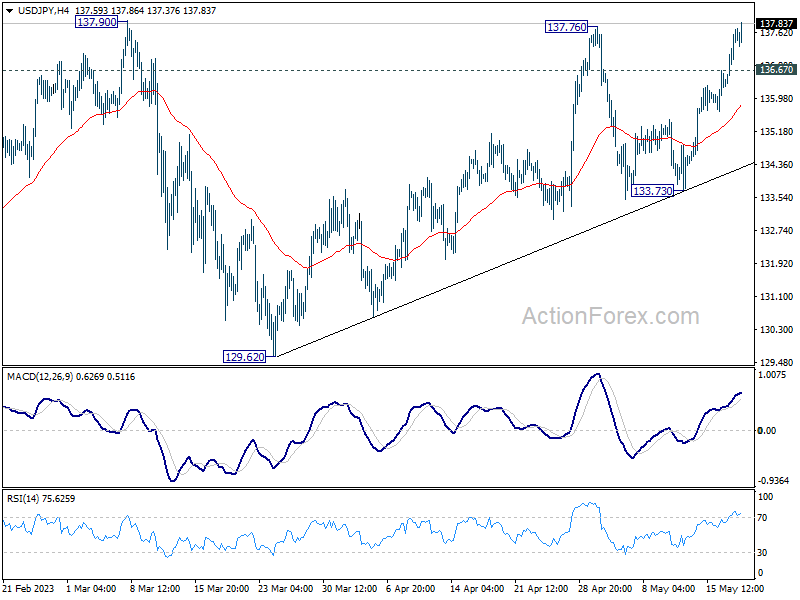
In the bigger picture, price actions from 151.93 high are currently seen as a corrective pattern to the long term up trend. The first leg should have completed at 127.20. Rebound from there is seen as the second leg. Sustained break of 38.2% retracement of 151.93 to 127.20 at 136.34 will bring stronger rise to 61.8% retracement at 142.48. Meanwhile, break of 129.62 will argue that the third leg is starting through 127.20 low.