Sample Category Title
Dollar Explodes Higher, But Unlikely to Last
The dollar has strengthened against its major rivals over the past two weeks, gaining 2% against a basket of major currencies. The Dollar Index surpassed 103, a level not seen since the second half of March.
Notably, the rally in the US currency has been accompanied by a rally in equity indices, an odd couple. The dollar is rising, along with the chances of another rate hike in the middle of next month. The market is now pricing in a 30% chance of another hike, up from almost 0% at the start of May.
The odds that the Fed could make one more hike, rather than sit still before a reversal as widely expected by analysts, are rising amid relatively hawkish comments from Fed members. The market had previously made the mistake of assuming that the Federal Reserve would follow the pattern of the past few decades of avoiding recessions by easing policy.
But comments from central bank officials and monetary policy experts increasingly suggest that the Fed will follow the behaviour of Volcker in the 1980s, who did not fear recession for the sake of beating inflation.
In addition to the fundamental backdrop, it is also worth noting that the Dollar Index has found support in dips below 101. The same area corresponded to a psychologically significant 1.10 in EURUSD and was close to 1.25 in GBPUSD.
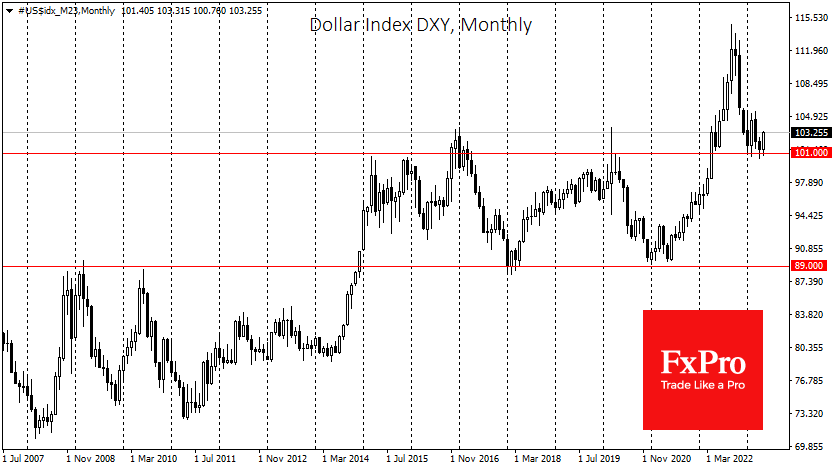
From a historical perspective, the current battle for the dollar could be decisive for many quarters. Until 2022, the Dollar Index was yet to gain a strong foothold above this level. Last year, however, it was a real breakout for the Dollar Index, which rose almost 15% before turning around.
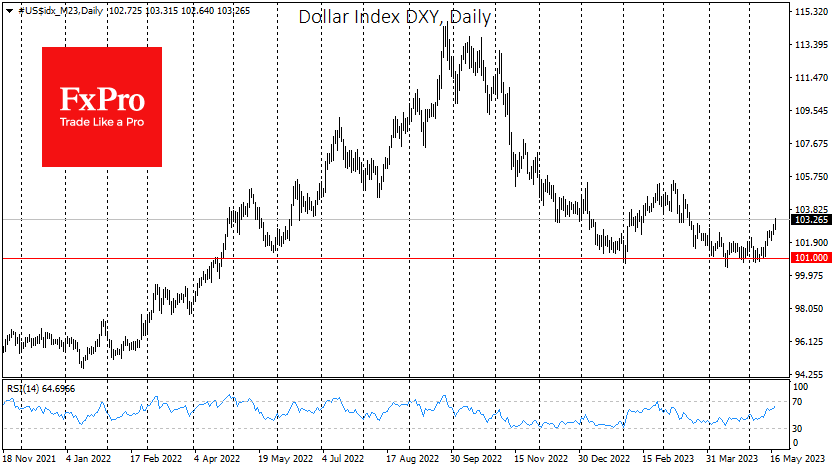
It may be that we now see former insurmountable resistance become strong support. We saw a similar exit for the DXY in late 2014 and 2018, and 2021. But the fundamental basis was the zero-interest rate policy, where the Fed’s interest rates were higher than its competitors.
Looking deeper into history, we can easily see that in the era of traditional monetary policy, before 2008, the dollar was chronically falling as the Fed’s competitors were far more successful in suppressing inflation.
It is worth being prepared for the short-term bounce that the Dollar Index is currently experiencing, followed by a long-term reversal to the downside. From a technical point of view, we note that the index has already accumulated local overbought conditions, suggesting a corrective pullback, at least in the short term.
EURUSD Wave Analysis
- EURUSD under bearish pressure
- Likely to fall to support level 1.0715
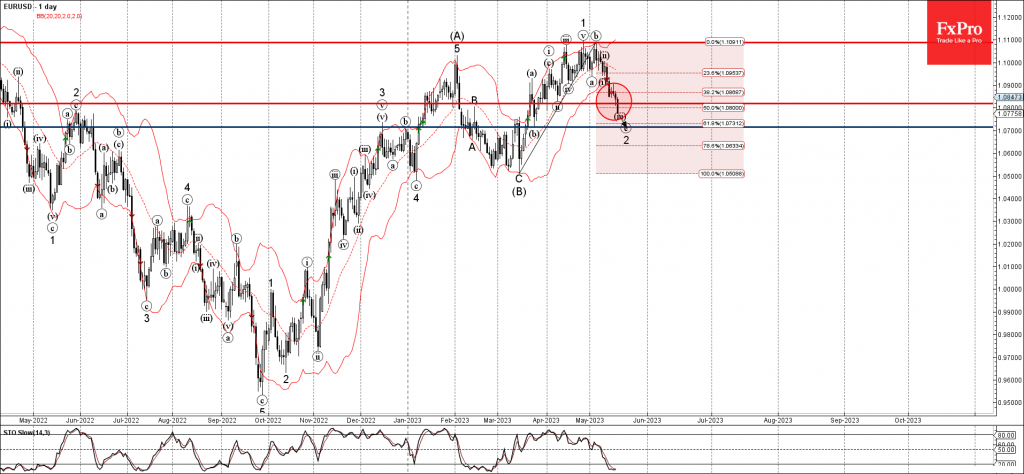
EURUSD under the bearish pressure after the price broke the support level 1.0820 (which stopped the previous short-term correction (ii)).
The breakout of the support level 1.0820 coincided with the breakout of the 50% Fibonacci correction of the previous upward impulse wave 1 from March.
EURUSD can be expected to fall further toward the next support level 1.0715 (low of wave (b) from March, target for the completion of the active ABC correction 2).
USDJPY Wave Analysis
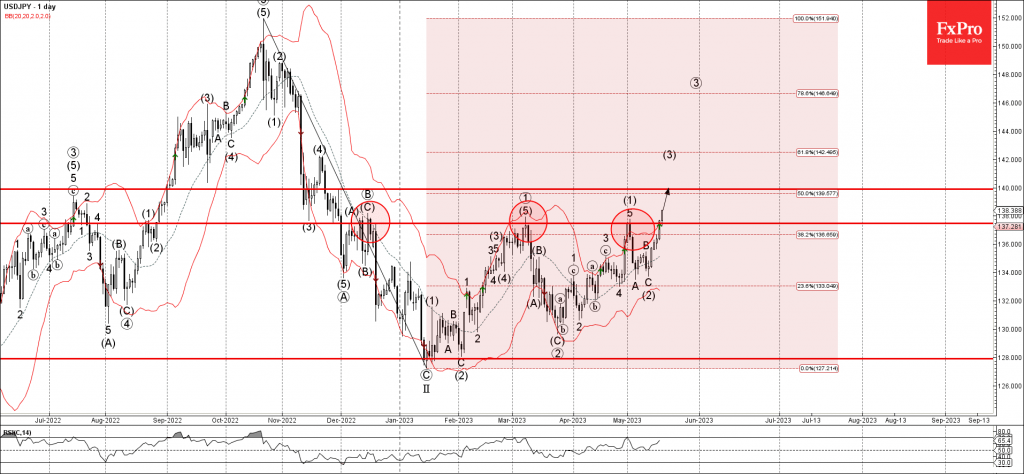
- USDJPY broke resistance level 137.50
- Likely to rise to resistance level 140.00
USDJPY recently broke the multi-month resistance level 137.50 (which has been reversing the pair from the middle of December).
The breakout of the resistance level 137.50 follows the earlier breakout of the 38.2% Fibonacci correction of the previous sharp weekly correction II from October.
USDJPY can be expected to rise further toward the next resistance level 140.00 (former minor resistance from last November).
Yen Sinks to 6.5 Month Low, is 140 Next?
- USD/JPY punches to its highest level since November 2022
- Japan eyes Core CPI
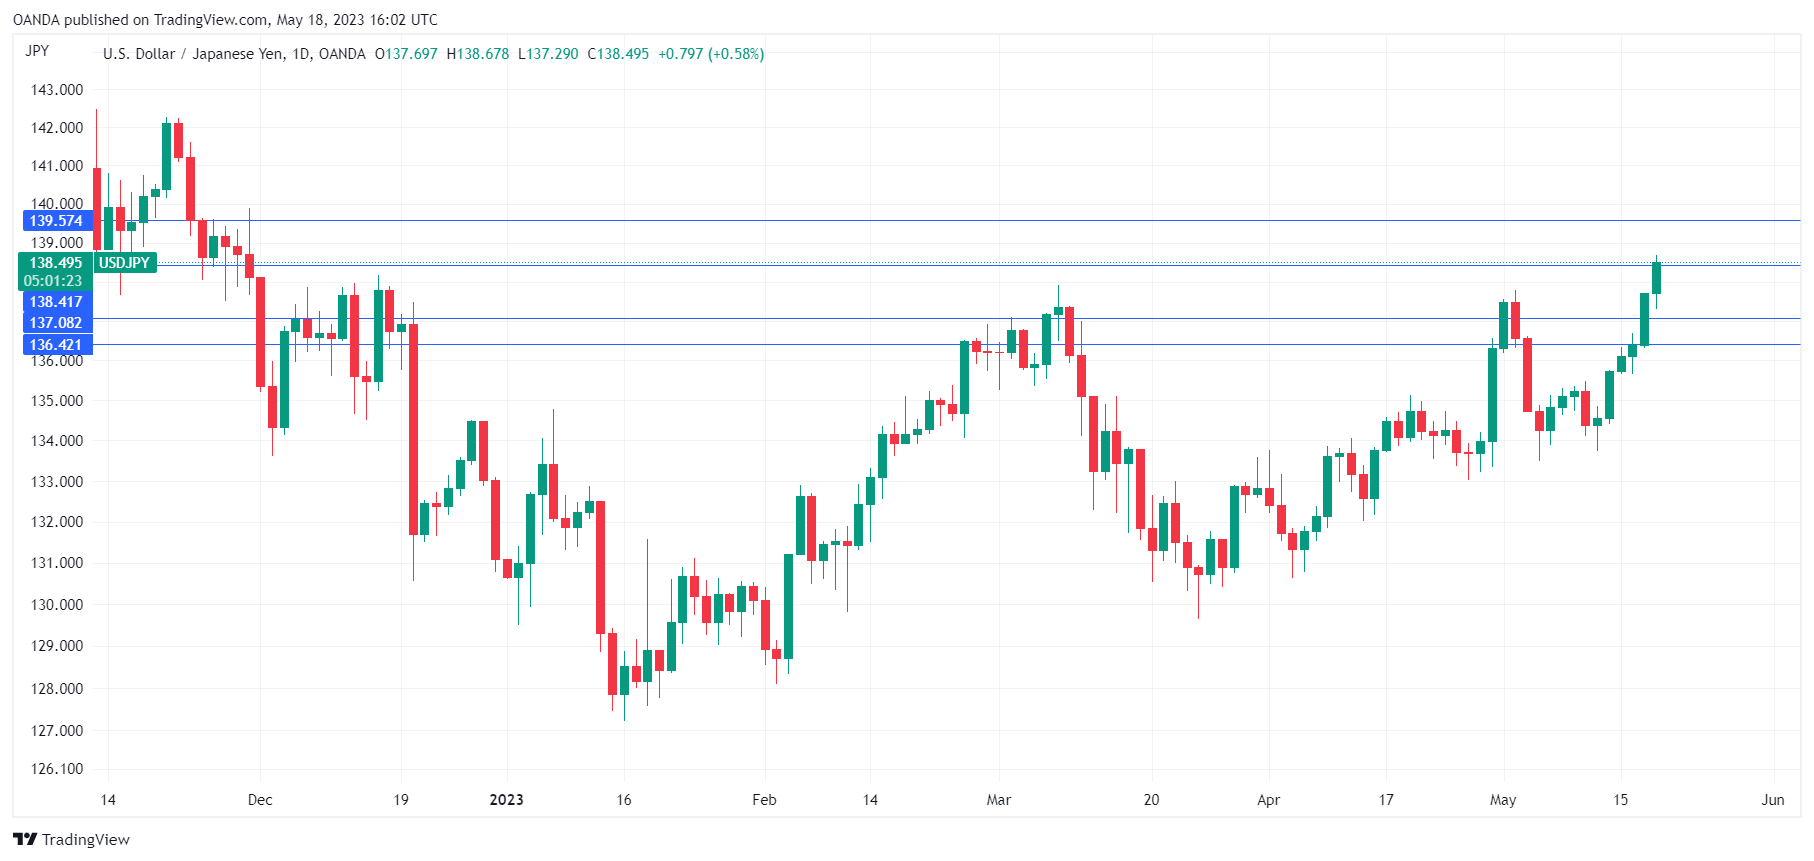
The yen woes continue, as the currency has plunged a massive 400 points over the past week. In Thursday’s North American session, the yen is trading at 138.52, up 0.60% on the day. USD/JPY hasn’t been at such high levels since November 2022.
Japan’s Core CPI expected to accelerate
All eyes will be on Japan’s Core CPI release early on Friday. This is a key inflation indicator and could move the dial of the yen. The markets are expecting Core CPI to rise to 3.4% in April, after two straight readings of 3.1%.
Inflation remains a key issue for the Bank of Japan. The new Governor, Kazuo Ueda, has continued the Bank’s ultra-accommodative policy but has also hinted at taking steps towards normalization, such as adjusting the yield curve control (YCC) policy if inflation remains sustainable above 2%. This week’s GDP release showed growth in the first quarter was higher than expected, and that could raise expectations that the Bank will shift policy, perhaps in baby steps, in the near future. As for interest rate policy, we’re unlikely to see any tightening before 2024.
Federal Reserve Chairman Powell will speak on a panel later today, and the markets will be all ears. Powell has remained hawkish, saying that high inflation could result in further rate hikes. Powell has dismissed outright any rate cuts, but the markets still believe that the Fed will trim rates before the end of the year. JP Morgan weighed in earlier this week, saying they agreed with the markets that the Fed would cut rates, as the economy was likely to tip into a recession.
USD/JPY Technical
- USD/JPY is testing resistance at 138.42. Above, the next resistance line is 139.58
- There is support at 137.08 and 136.42
Fed Jefferson highlights persistent inflation challenges amid slowing progress
Fed Governor and Vice Chair Nominee, Philip Jefferson, has given a sobering assessment of the ongoing inflationary pressures that US economy is wrestling with. In a speech, he highlighted that, while inflation has decreased significantly since last summer, the high levels persist and progress in mitigating them appears to be slowing.
Jefferson made it clear that tackling inflation remains a substantial challenge. He stated, "While inflation has come down substantially since last summer, it is still too high, and by some measures progress has been slowing." Moreover, he underscored that "outside of energy and food, the progress on inflation remains a challenge."
The Vice Chair Nominee then offered a more granular perspective on core inflation, distinguishing between core goods inflation, housing services inflation, and nonhousing services inflation.
Jefferson noted, "Core goods inflation fell sharply over the second half of 2022 as supply-chain bottlenecks eased, but more recently it has stabilized at around 2.6 percent."
Housing services inflation, which includes rent and the equivalent for owner-occupied homes, was another key point of discussion. He pointed out that "Housing services inflation, which is 8.2 percent on a 12-month basis. Housing is a big part of inflation, and while rent increases on new leases have come down considerably over the past year, it will take some time for this softening in rents to show through to the 12-month changes."
As for nonhousing services, the largest component of services, inflation remains stubbornly high at around 4.5% with no substantial decrease in sight.
ETHUSD Analysis: Bullish Engulfing Pattern above $1,785
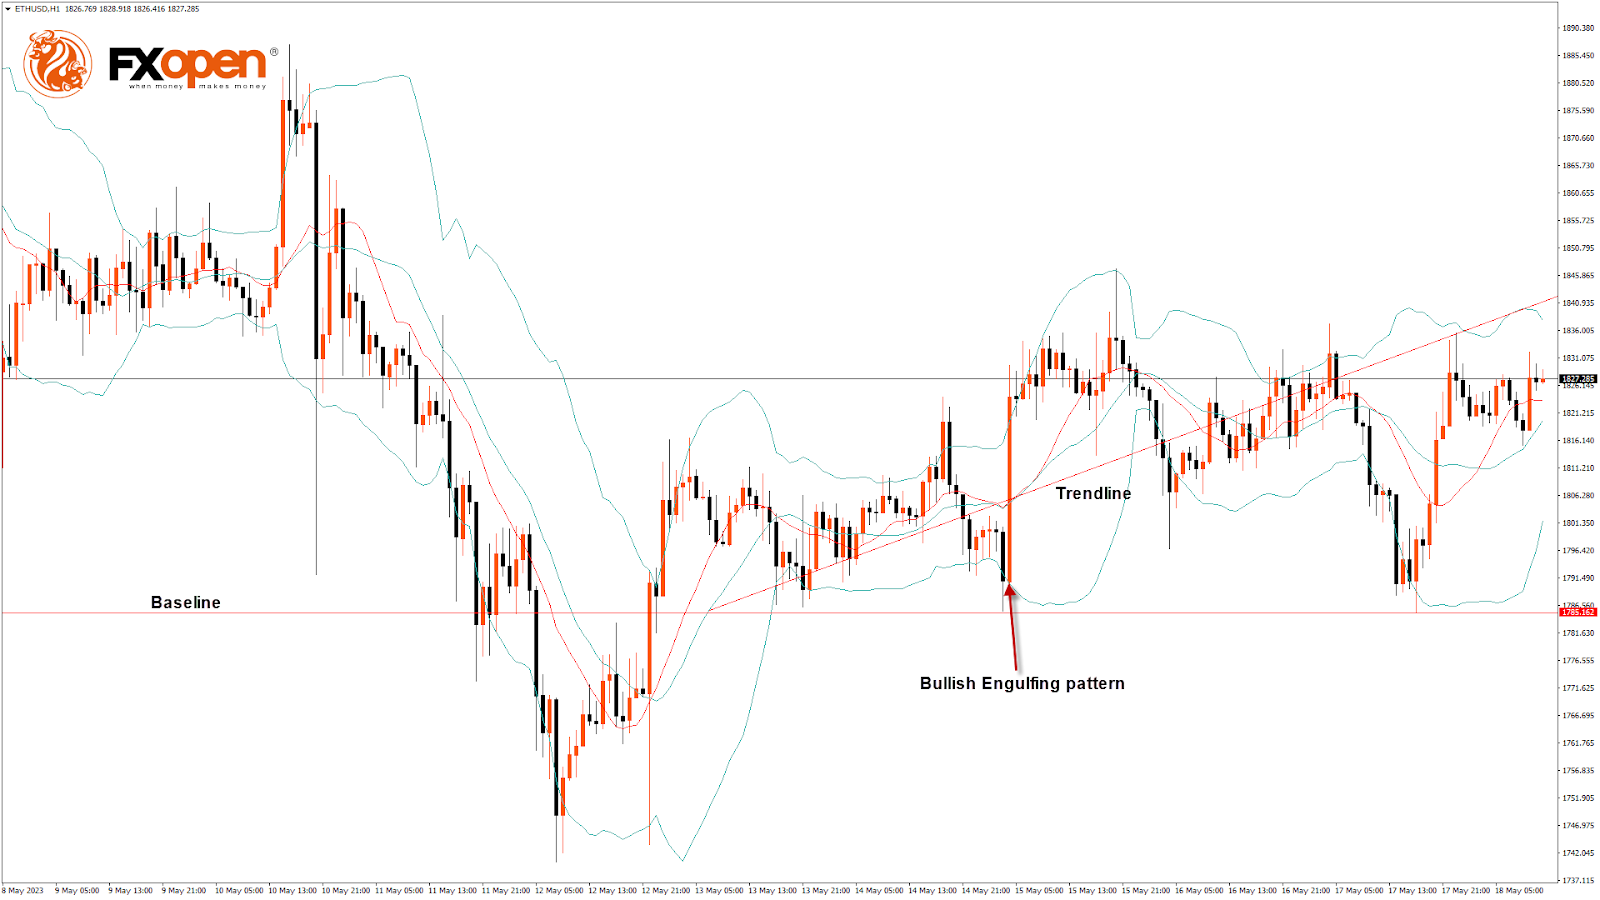
Bulls were able to take control of the market, and after touching a low of $1,785 on 17 May, the ETHUSD pair started moving upwards, with strong demand seen above $1,800.
On the H1 timeframe:
- ETHUSD is supported by bulls after its decline below the $1,800 handle with immediate targets of $1,850 and $1,900.
- The bullish engulfing pattern is above the $1,785 handle. It's a bullish pattern, which signifies the end of a bearish phase.
- The relative strength index is at 59.28, indicating a strong demand for Ether and a continuation of a buying sentiment in the market.
- Both the STOCH and ADX are giving a neutral signal, meaning that the Ethereum price is expected to remain in the consolidation phase in the short-term range.
- ETH price is now trading above the 100-hour simple and 200-hour exponential moving averages.
- ETH price bullish reversal is seen above the $1,785 mark.
- The average true range indicates low market volatility.
- The ultimate oscillator indicator provides a neutral signal.
ETH Bullish Reversal Seen above $1,785
On the D1 timeframe:
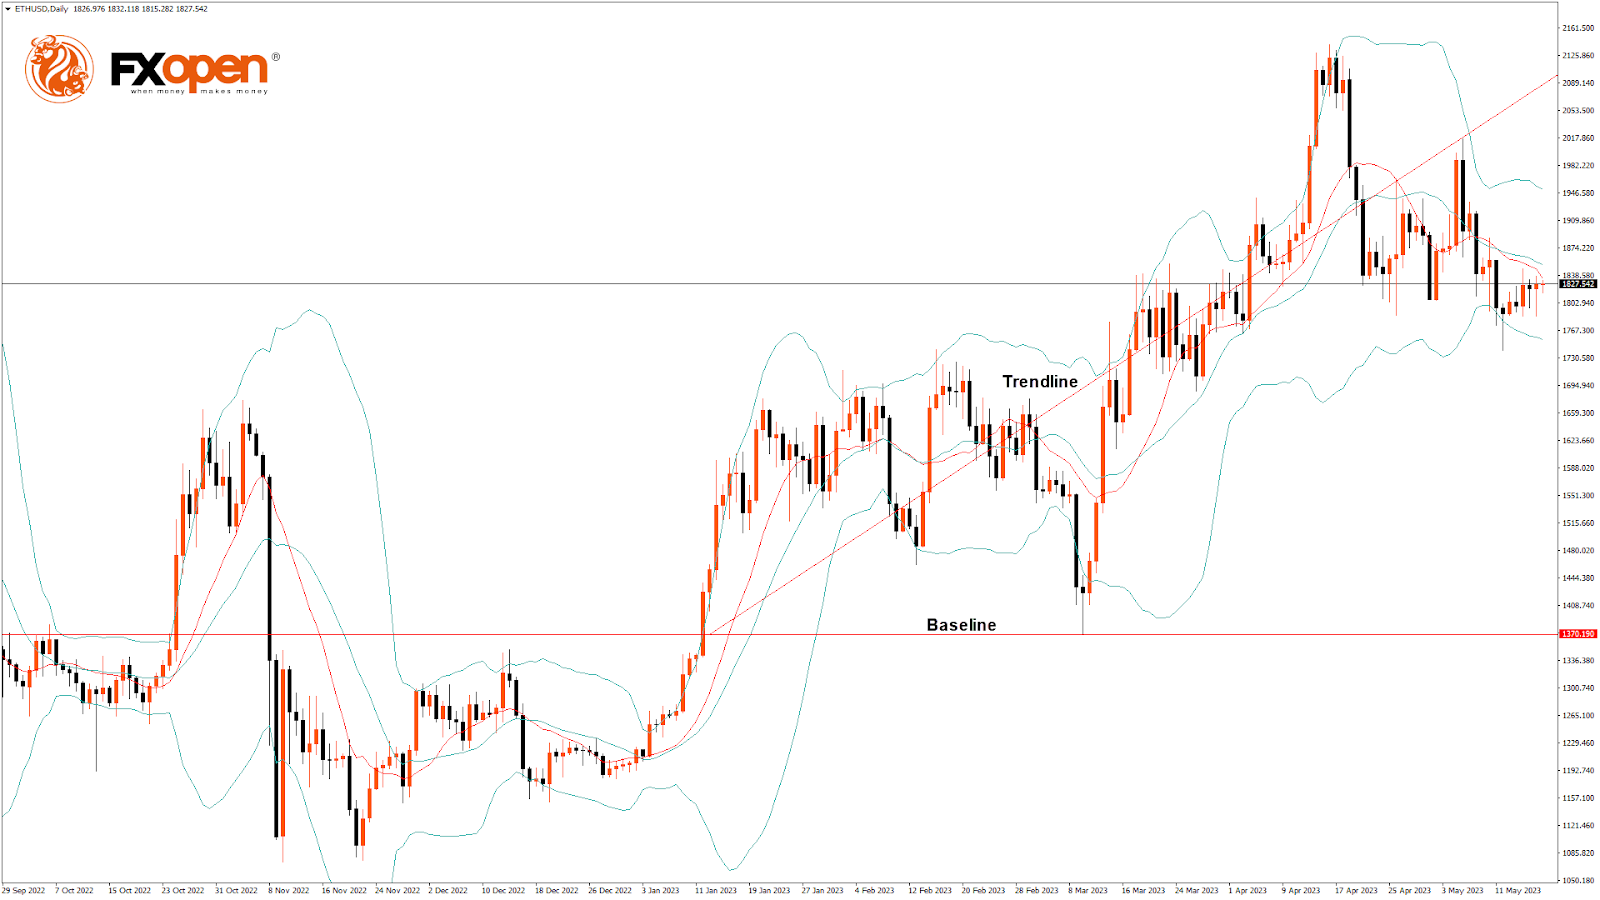
- ETH price is trading just above its pivot level of $1,825 and is moving into a mild bullish channel.
- The price is about to break its classic resistance level of $1,833 and its Fibonacci resistance level of $1,839; further supports are $1,742 and $1,755.
- We can see the formation of a bullish engulfing pattern.
- The short-term range is expected to be mildly bullish.
- The resistance of the triangle and channel is broken.
On the weekly timeframe:
- The market opened bullish.
- The price is back over the pivot point.
- Some of the technical indicators signal a neutral tone in the market.
Most of the technical indicators are bullish. Most moving averages are bullish at the current market level of $1,826.
The key support levels to watch are $1,796, which is a 14-3 day raw stochastic at 20, and $1,816, which is a pivot point.
The Week Ahead
The Ethereum to USD exchange rate continues to correct higher, above $1,800, reflecting the bullish momentum and is expected to move towards the $1,850 level in the medium-term range in the H1 timeframe.
We see a short-term bullish trend line forming from $1,785 towards $1,842.
The immediate short-term outlook for ETH has turned mildly bullish, the medium-term outlook has turned bullish, and the long-term outlook is neutral in present market conditions.
The resistance zone is at $1,839, at which the price crosses a 18-day moving average, and at $1,852, which is a 14-day RSI at 50.
The weekly outlook for Ethereum price is $1,900, with a consolidation zone around $1,850.
LTCUSD Analysis: Inverted Hammer Pattern above $79.64
Bulls were able to take control of the market last week, and after touching a low of $79.64 on 13 May, the price started to correct higher against the US Dollar, crossing the $94.00 handle today in the European trading session.
The short-term outlook for Litecoin has turned mildly bullish.
On the H1 timeframe:
- There is an inverted hammer pattern above the $79.64 handle. It signifies the end of a bearish phase and the start of a bullish phase in the market.
- Litecoin price is trading above its 100-hour simple moving average and 200-hour exponential moving average and just above its pivot level of $92.97.
- The relative strength index is at 69.02, indicating a strong demand for Litecoin and a shift towards the bullish phase in the markets.
- Litecoin remains above most of the moving averages, which is a bullish signal at current market levels of $93.20.
- Some of the technical indicators are bullish.
- The average true range indicates low market volatility.
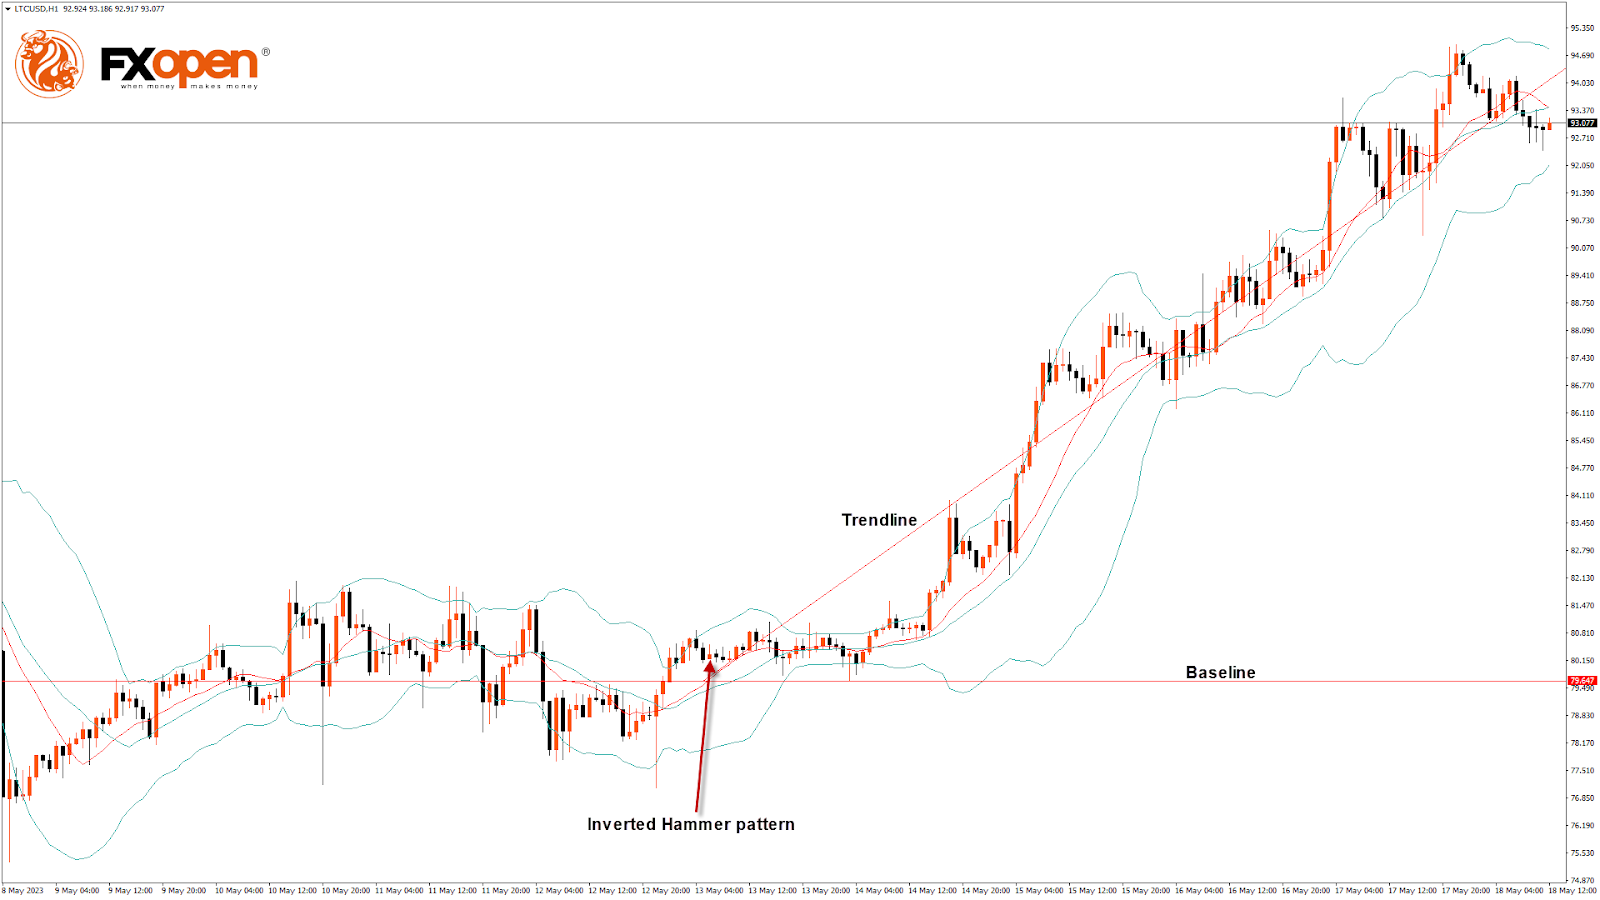
Litecoin Bullish Reversal Seen above $79.64
On the D1 timeframe:
- Litecoin continues to move in a bullish momentum after its recent decline below $80.00.
- Litecoin to USD exchange rate is ranging above $90.00 with more upsides at $94 and $95 levels.
- The resistance of the channel is broken.
On the weekly timeframe:
- The market opened bullish.
- We can see the formation of the morning star pattern, which indicates a bullish trend.
- We can see the formation of a bullish price crossover pattern with 20- and 50-period adaptive moving averages.
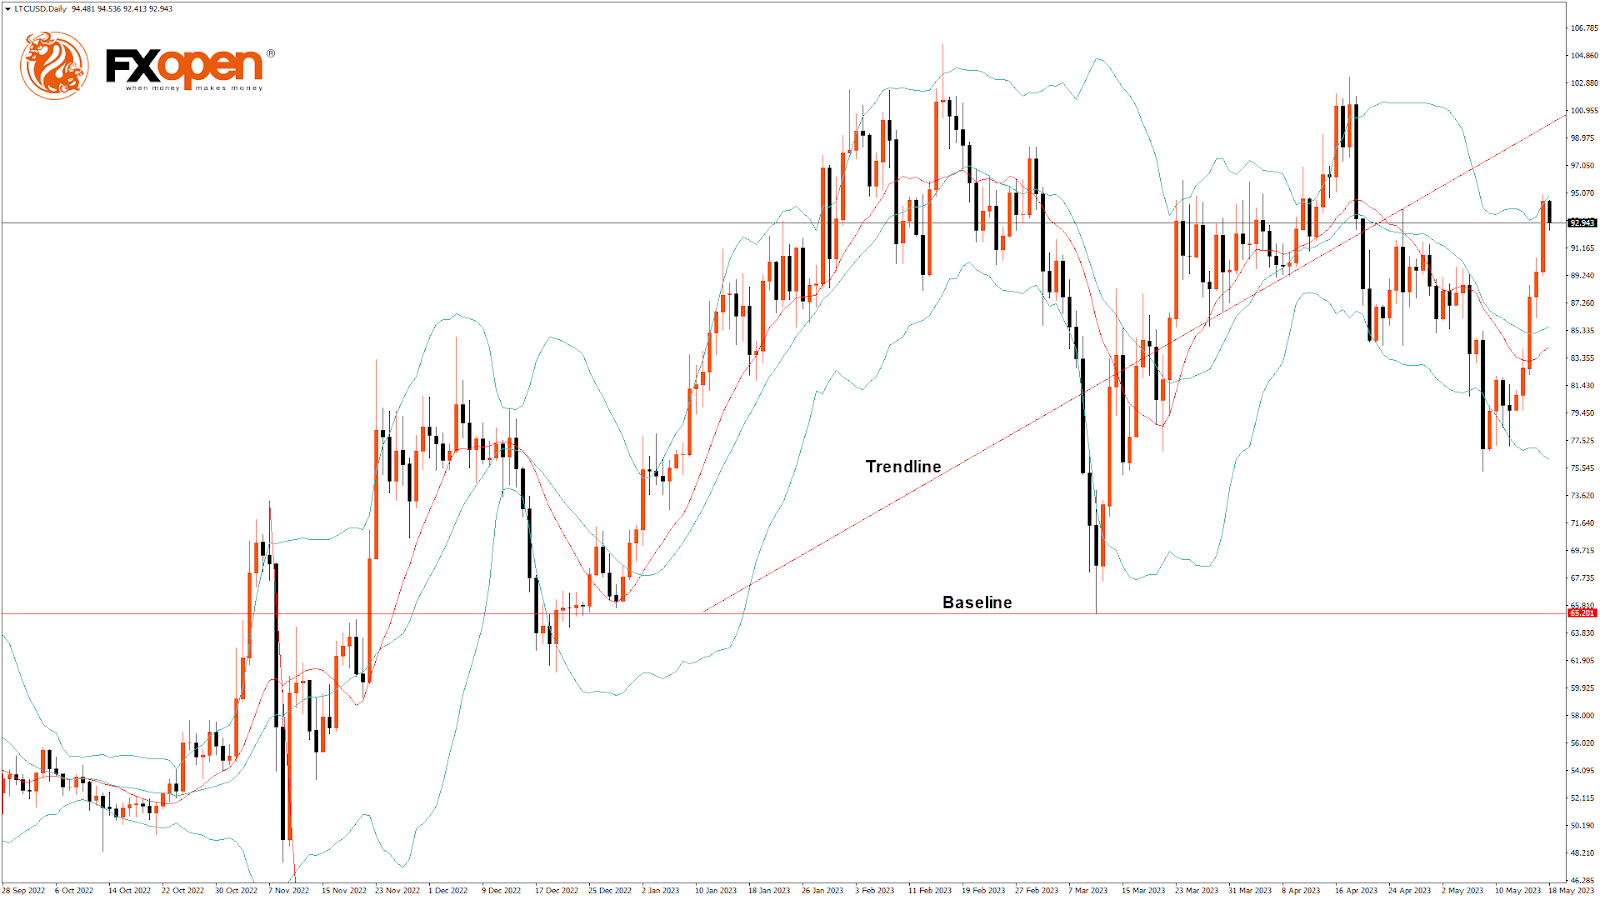
LTCUSD is about to break its classic resistance level of 93.55 and Fibonacci resistance level of 94.18, after which the path towards $95 will get cleared.
Litecoin faces resistance at $96.53, which is a pivot point’s first resistance level, and at $98.58, which is a pivot point’s second resistance level.
The Week Ahead
Litecoin price continues to correct higher against the US Dollar, and a strong bullish momentum is visible, with further upsides located at $95 and $100.
Most technical indicators signal a bullish sentiment in the market.
Litecoin price should stay above the important support level of $87.40, which is a 14-day RSI at 50, and at $88.65, at which the price crosses the 9-day moving average.
The weekly projection for Litecoin price is $98, with a consolidation zone near $95.
The short-term outlook for Litecoin has turned strongly bullish, the medium-term outlook is bullish, and the long-term outlook is neutral at present market conditions.
The Stock Market Has Helped Crypto
Market picture
The crypto market capitalisation rose 0.55% over the past 24 hours to 1.134 trillion. Late Wednesday afternoon, another attempt was made to break above 1.14 trillion, following the US stock market rally on the government debt ceiling news. However, it has so far failed to stay in this territory.
Bitcoin is up 0.7% at $27.2K, staying within the recovery trend that has been in place since the 12th. However, this recovery is painfully slow, and local resistance at $27.5K, which has been supporting since late March, remains in place.
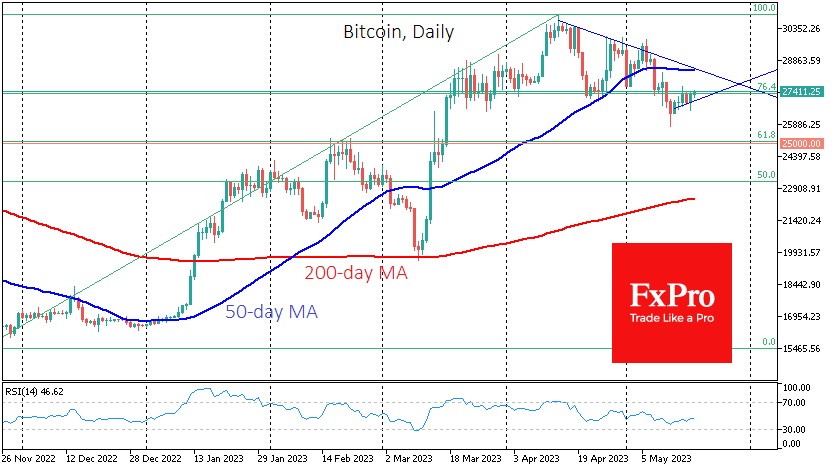
According to Santiment, large Bitcoin holders continue accumulating BTC – over the past five weeks, cryptocurrency holdings have increased by nearly 85,000 BTC ($2.3 billion). Santiment believes Bitcoin is now in a consolidation phase before a new surge.
News background
The stock and cryptocurrency markets will collapse if the US defaults, says Mike McGlone, senior strategist at Bloomberg Intelligence. He is bearish on cryptocurrencies but bullish on gold.
Lightning Labs, the developer of the Lightning Network, announced the release of Taproot Assets Protocol v 0.2, which avoids potential delays in transaction processing due to congestion on the Bitcoin network.
The UK Parliament has proposed regulating cryptocurrencies as gambling. Crypto assets can potentially be used for fraud and money laundering, posing a high risk to consumers and the economy.
Tether’s issuance team has decided to invest up to 15% of its net profits in Bitcoin monthly to diversify its reserves. It has already invested $1.5 billion in BTC. The bulk of USDT’s collateral is still in short-term US Treasuries.
According to a Bloomberg survey, only 31 of the top 60 cryptocurrency companies have successfully undergone external financial audits or confirmed reserves. Many auditors are reluctant to work with cryptocurrency companies or need more expertise.
EUR/USD Mid-Day Outlook
Daily Pivots: (S1) 1.0808; (P) 1.0841; (R1) 1.0872; More...
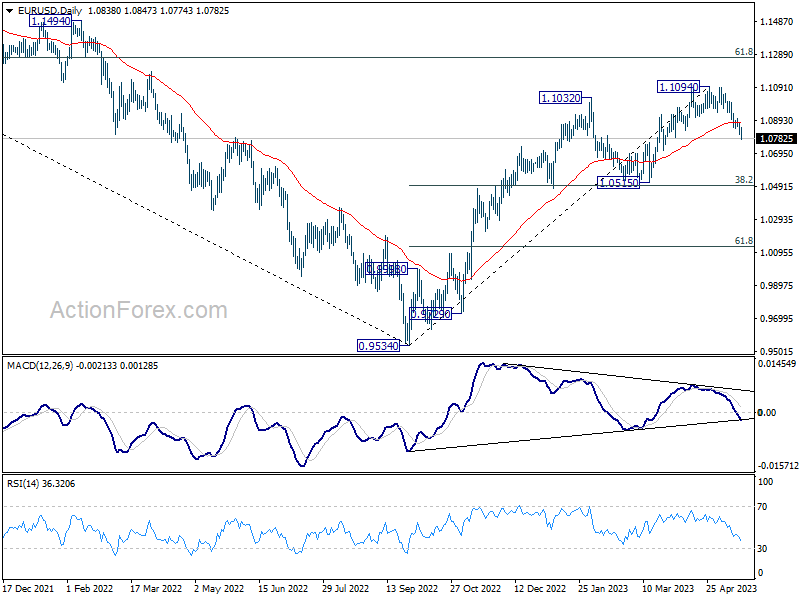
EUR/USD's decline from 1.1094 is still in progress and intraday bias stays on the downside. As a correction to whole up trend from 0.9534, current fall should target 1.0515 cluster support, 38.2% retracement of 0.9534 to 1.1094 at 1.0498. On the upside, above 1.0848 minor resistance will turn intraday bias neutral first.
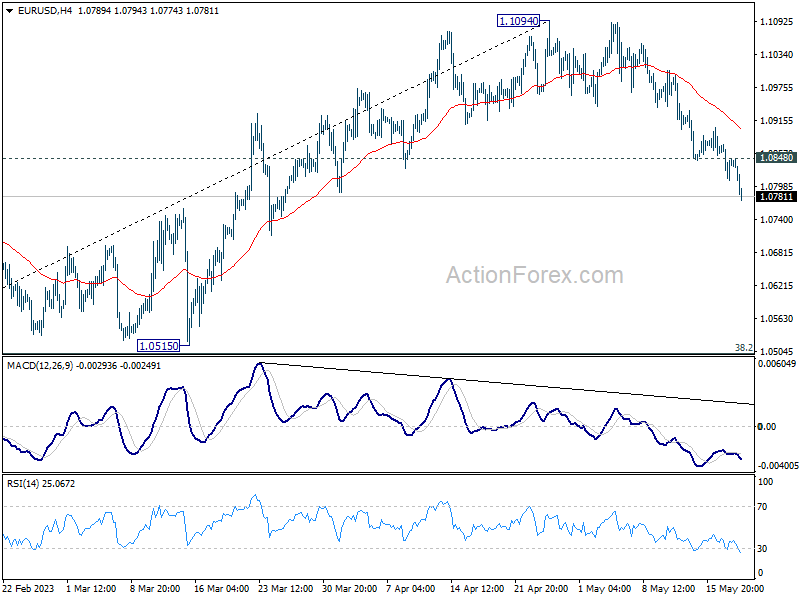
In the bigger picture, as long as 1.0515 support holds, rise from 0.9534 (2022 low) would still extend higher. Sustained break of 61.8% retracement of 1.2348 (2021 high) to 0.9534 at 1.1273 will solidify the case of bullish trend reversal and target 1.2348 resistance next (2021 high).