Sample Category Title
EUR/GBP Daily Outlook
Daily Pivots: (S1) 0.8667; (P) 0.8684; (R1) 0.8698; More...
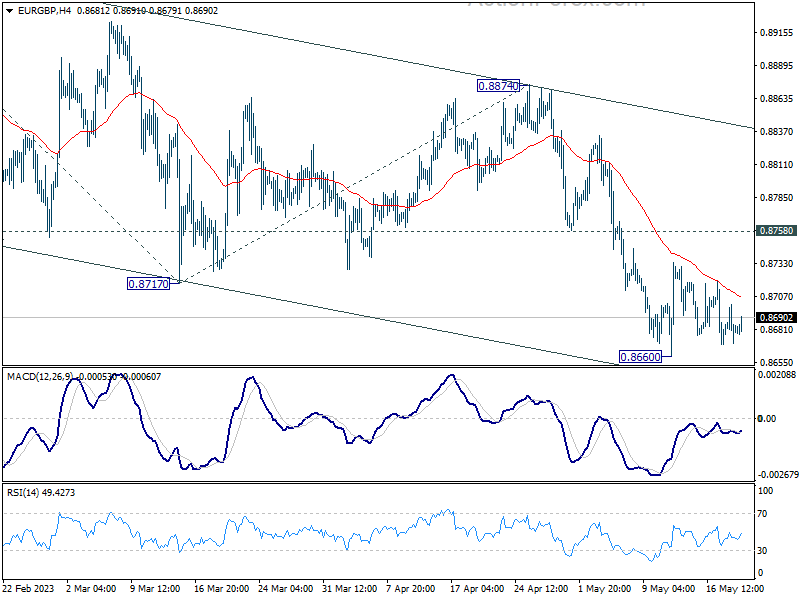
Intraday bias in EUR/GBP remains neutral as consolidation from 0.8660 is extending. Further decline is expected as long as 0.8758 resistance holds. On the downside, break of 0.8660 will resume recent decline to 100% projection of 0.8977 to 0.8717 from 0.8874 at 0.8614. Nevertheless, break of 0.8758 minor resistance will turn bias back to the upside for stronger rebound.
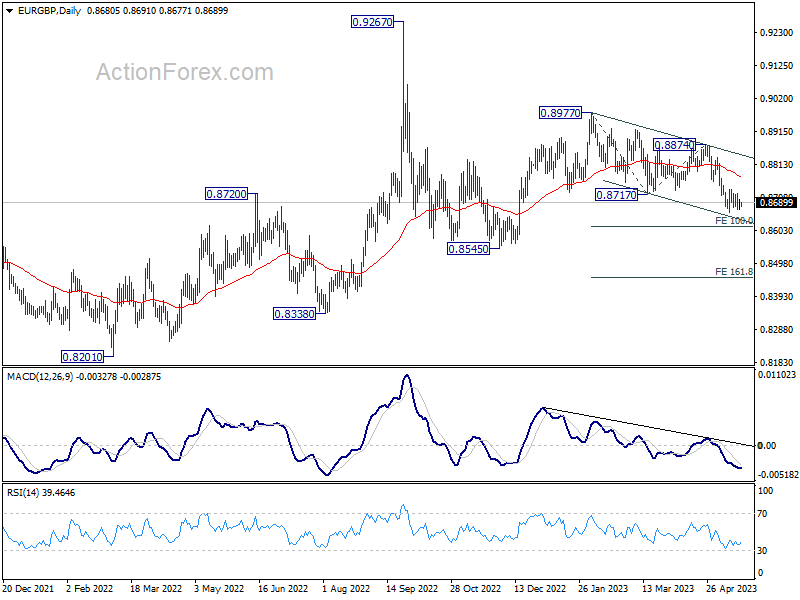
In the bigger picture, current development argues that whole decline from 0.9267 (2022 high) is still in progress. This is part of the long term range pattern from 0.9499 (2020 high). Deeper fall would be seen through 0.8545 support. his will now remain the favored case as long as 0.8874 resistance holds.
EUR/AUD Daily Outlook
Daily Pivots: (S1) 1.6232; (P) 1.6290; (R1) 1.6324; More...
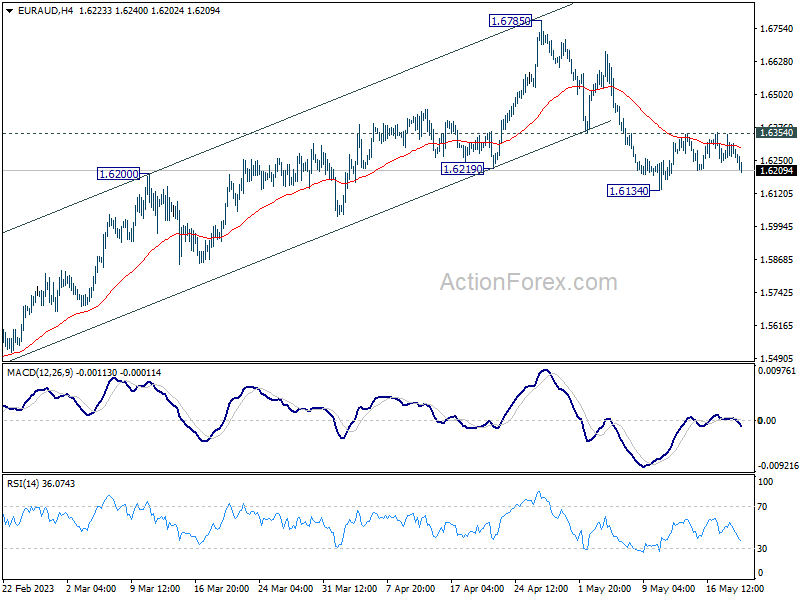
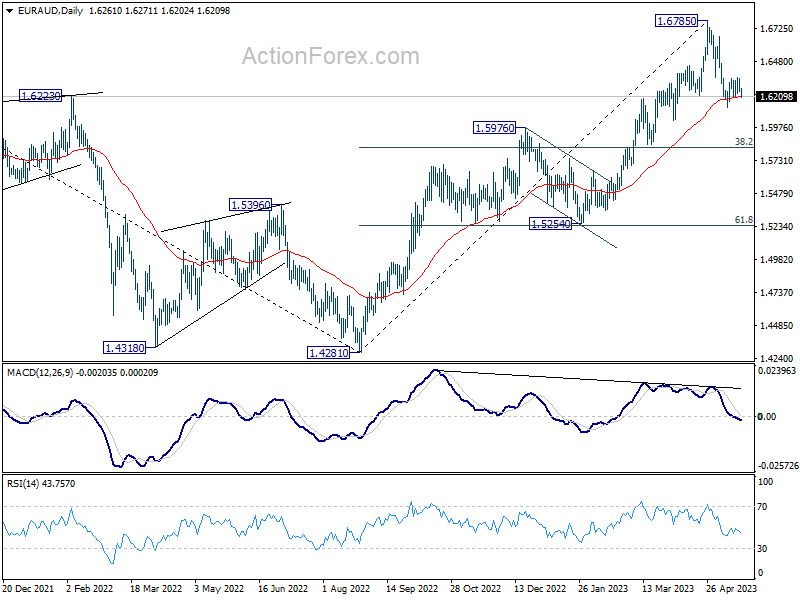
Intraday bias in EUR/AUD stays neutral for the moment. Further decline is expected with 1.6354 minor resistance intact. Considering bearish divergence condition in D MACD, fall from 1.6785 might be a correction to whole up trend from 1.4281. Break of 1.6134 will target 38.2 retracement of 1.4281 to 1.6785 at 1.5828, which is inside 1.5254/5976 support zone. Nevertheless, sustained break of 1.6354 minor resistance will turn bias back to the upside for retesting 1.6785 high instead.
In the bigger picture, whole down trend from 1.9799 (2020 high) should have completed at 1.4281 (2022 low). Further rise should be seen to 61.8% retracement of 1.9799 to 1.4281 at 1.7691 next. For now, outlook will stay bullish as long as 1.5976 resistance turned support holds, even in case of deep pull back.
EUR/JPY Daily Outlook
Daily Pivots: (S1) 148.96; (P) 149.21; (R1) 149.63; More....
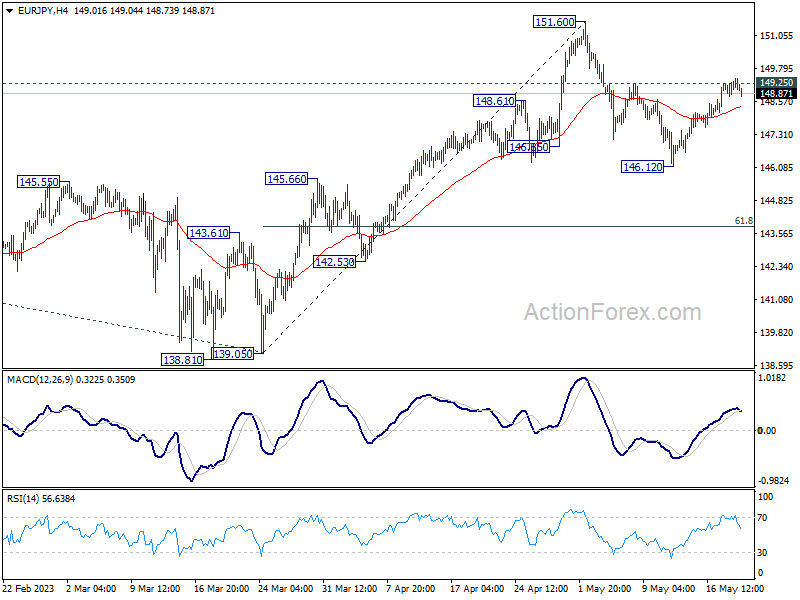
EUR/JPY breached 149.25 resistance briefly but quickly retreated. Intraday bias remains neutral. On the upside, firm break of 149.25 resistance will argue that pull back from 151.60 has completed at 146.12 already. Stronger rally should be seen back to retest 151.60. On the downside, however, break of 146.12 will resume the fall to 61.8% retracement of 139.05 to 151.60 at 143.84.
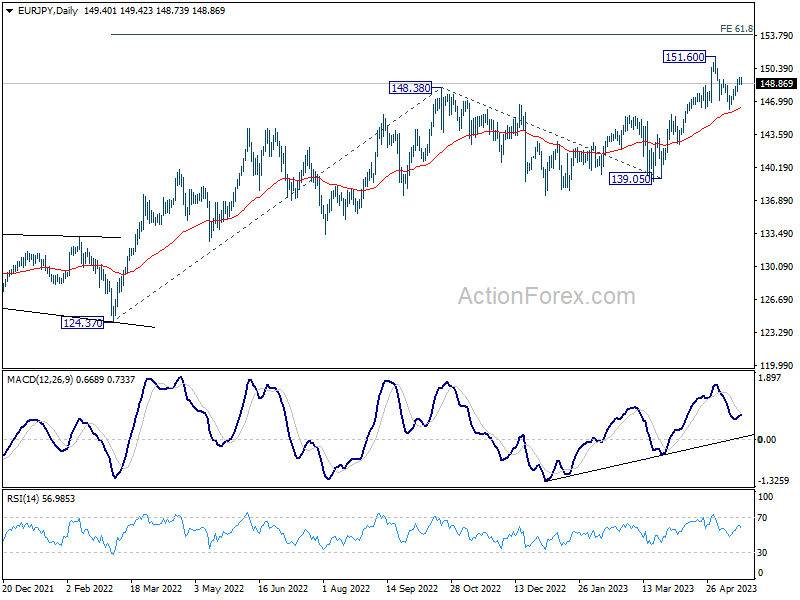
In the bigger picture, rise from 114.42 (2020 low) is in progress. Next target is 61.8% projection of 124.37 to 148.38 from 138.81 at 153.64. Sustained break there will pave the way to 100% projection at 162.82. For now, medium term outlook will remain bullish as long as 139.05 support holds, even in case of deep pull back.
GBP/JPY Daily Outlook
Daily Pivots: (S1) 171.49; (P) 171.83; (R1) 172.45; More...
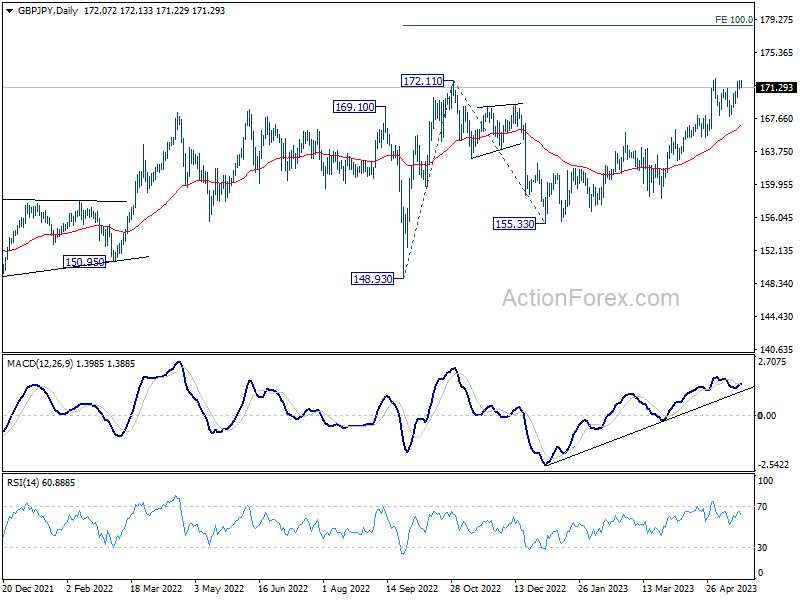
Intraday bias in GBP/JPY stays neutral as it's staying in range below 172.30. On the upside, break of 172.30 will resume larger up trend to 100% projection of 148.93 to 172.11 from 155.33 at 178.51. Nevertheless, firm break of 167.82 support should confirm short term topping, and turn bias back to the downside for deeper pull back to 165.40 support and possible below instead.
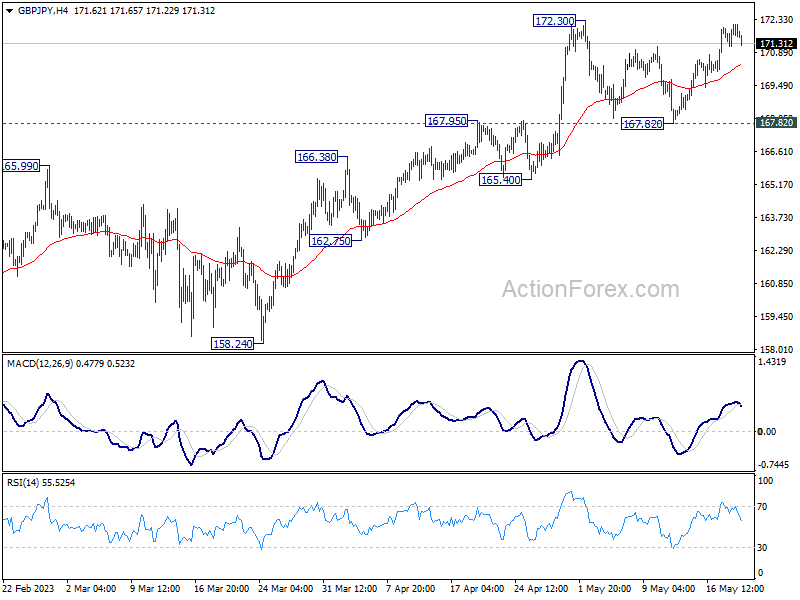
In the bigger picture, focus stays on 172.11 resistance (2022 high). Decisive break there will resume whole up trend from 123.94 (2020 low). Next target will be 161.8% projection of 122.75 (2016 low) to 156.59 (2018 high) from 123.94 at 178.69. Nevertheless, firm break of 165.40 support will indicate rejection by 172.11 and extend the corrective pattern from there with another falling leg.
EUR/CHF Daily Outlook
Daily Pivots: (S1) 0.9729; (P) 0.9745; (R1) 0.9763; More...
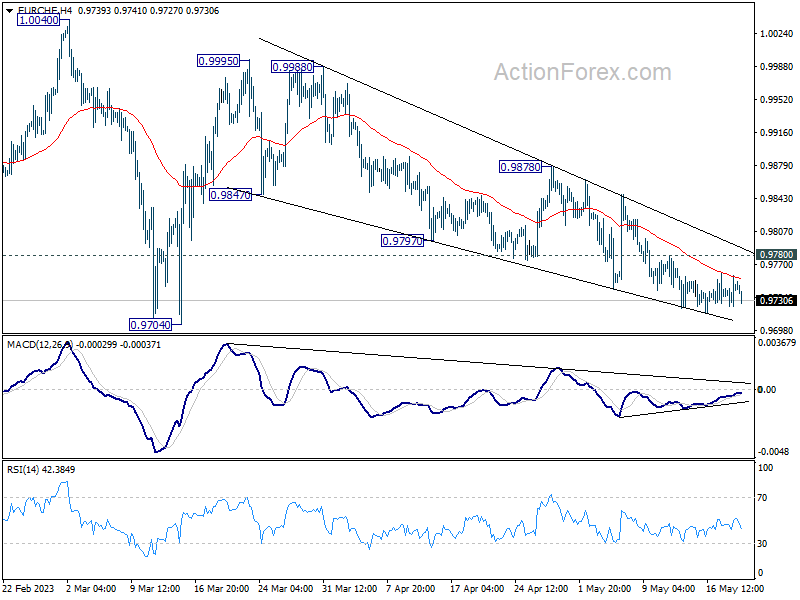
EUR/CHF continues to lose downside momentum as seen in 4H MACD, but there is no sign of bottoming yet. But while deeper fall cannot be ruled out, strong support should be seen from 0.9704 to bring rebound. Break of 0.9847 will argue that choppy fall from 0.9995 has completed and turn bias back to the downside. However, firm break of 0.9704 will resume the whole decline from 1.0095 to 61.8% retracement of 0.9407 to 1.0095 at 0.9670.
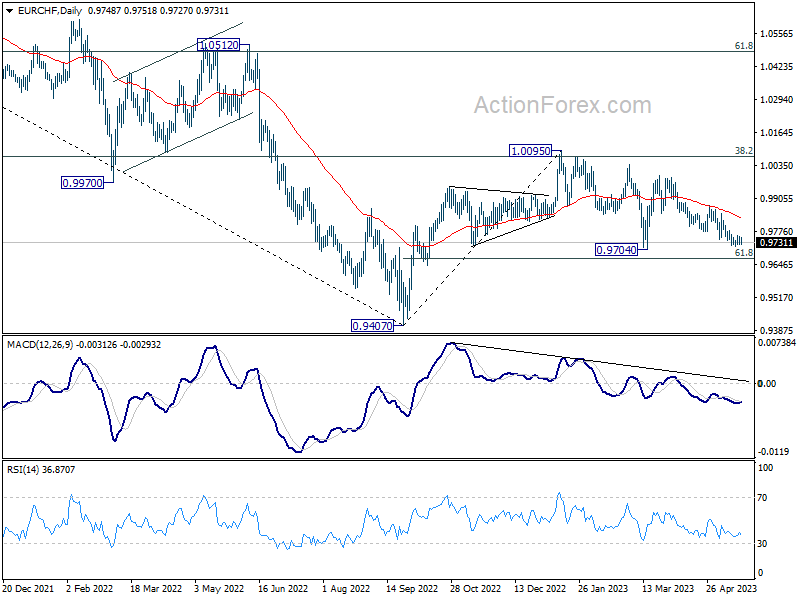
In the bigger picture, prior rejection by 38.2% retracement of 1.1149 to 0.9407 at 1.0072 suggests that medium term outlook is staying bearish. The pair is also capped below 55 W EMA (now at 0.9963). Down trend from 1.2004 is not completed yet and is in favor to resume through 0.9407 at a later stage. However, decisive break of 1.0095 resistance will raise the chance of bullish trend reversal. Rise from 0.9407 should then target 1.0505 cluster resistance (2020 low at 1.0505, 61.8% retracement of 1.1149 to 0.9407 at 1.1484).
AUD/USD and NZD/USD Weekly Chart Outlook
AUD/USD struggled to stay above 0.7000 and corrected lower. Similarly, NZD/USD is facing strong resistance near 0.6540.
Important Takeaways for AUD/USD and NZD/USD Analysis
- The Aussie Dollar started a downside correction from the 0.7150 zone against the US Dollar.
- There is a crucial bearish trend line forming with resistance near 0.6900 on the weekly chart of AUD/USD at FXOpen.
- NZD/USD also started a steady increase above the 0.5750 and 0.6000 levels.
- There is a key bearish trend line forming with resistance near 0.6365 on the weekly chart at FXOpen.
AUD/USD Technical Analysis
On the weekly chart of AUD/USD at FXOpen, the pair climbed higher above the 0.6540 and 0.6900 resistance levels. However, the Aussie Dollar failed to clear the 0.7150 zone against the US Dollar.
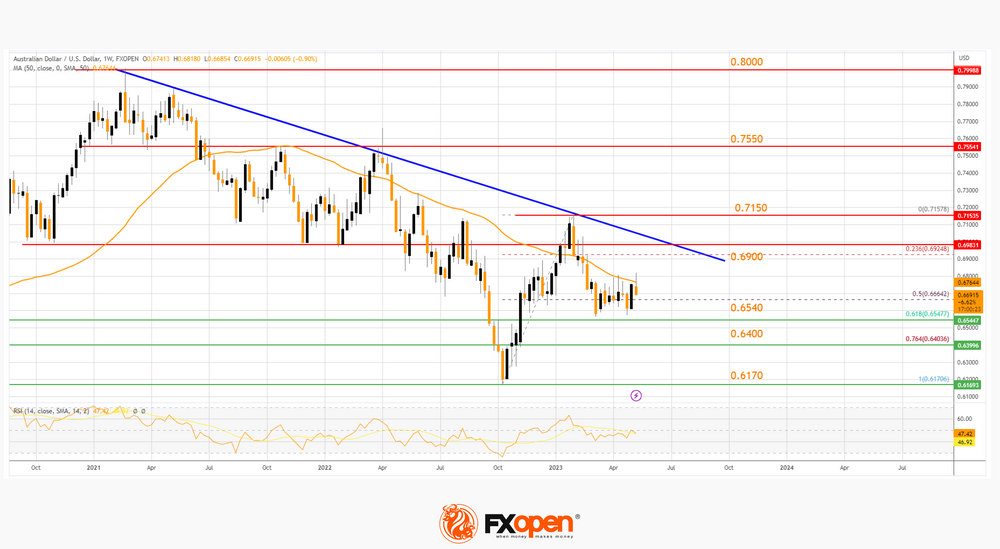
As a result, there was a bearish reaction from the 0.7150 zone. The pair corrected lower below the 0.6900 pivot level and the 50-week simple moving average. Besides, there was a spike below the 50% Fib retracement level of the upward move from the 0.6170 swing low to the 0.7157 high.
On the AUD/USD chart, the pair is now showing bearish signs below the 50-week simple moving average and a crucial bearish trend line with resistance near 0.6900. Only a successful daily close above 0.6900 might start a strong recovery toward the 0.7150 level.
Any more gains might send the pair toward the 0.7550 level. The next major resistance sits near the 0.8000 resistance. On the downside, the first major support is near the 61.8% Fib retracement level of the upward move from the 0.6170 swing low to the 0.7157 high at 0.6540.
The next major support is near the 0.6400 level, below which the pair may perhaps extend its decline toward the 0.6170 level. Any more losses might call for a move toward the 0.6000 level.
NZD/USD Technical Analysis
On the weekly chart of NZD/USD at FXOpen, the pair started a steady increase from the 0.5510 zone. The New Zealand Dollar was able to surpass the 0.5750 and 0.6025 resistance levels. There was also a close above the 50-week simple moving average and RSI settled above 50.
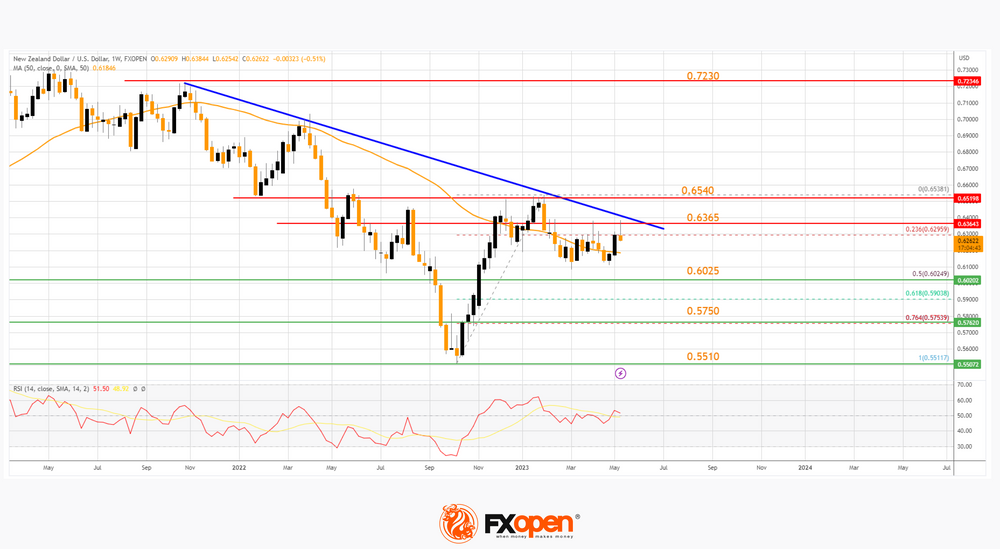
However, the pair failed to clear the 0.6540 level. A high is formed near 0.6538 and the pair is now showing a few bearish signs. It moved below the 23.6% Fibonacci retracement level of the upward move from the 0.5511 swing low to the 0.6538 high.
On the downside, the 0.6025 level is a decent support on the NZD/USD chart since it coincides with the 50% Fibonacci retracement level of the upward move from the 0.5511 swing low to the 0.6538 high.
The next major support is near 0.5750, below which NZD/USD might decline toward the 0.5510 support zone. Any more losses could open the doors for a drop toward the 0.5200 level.
Immediate resistance on the upside is near a key bearish trend line at 0.6365. The first major resistance on the upside is near the 0.6540 level. A successful close above 0.6540 could start a solid upward move toward the 0.7000 resistance. Any more gains might send the pair toward the 0.7230 level.
USDCAD Range-Trading; Next Break Key for Market Sentiment
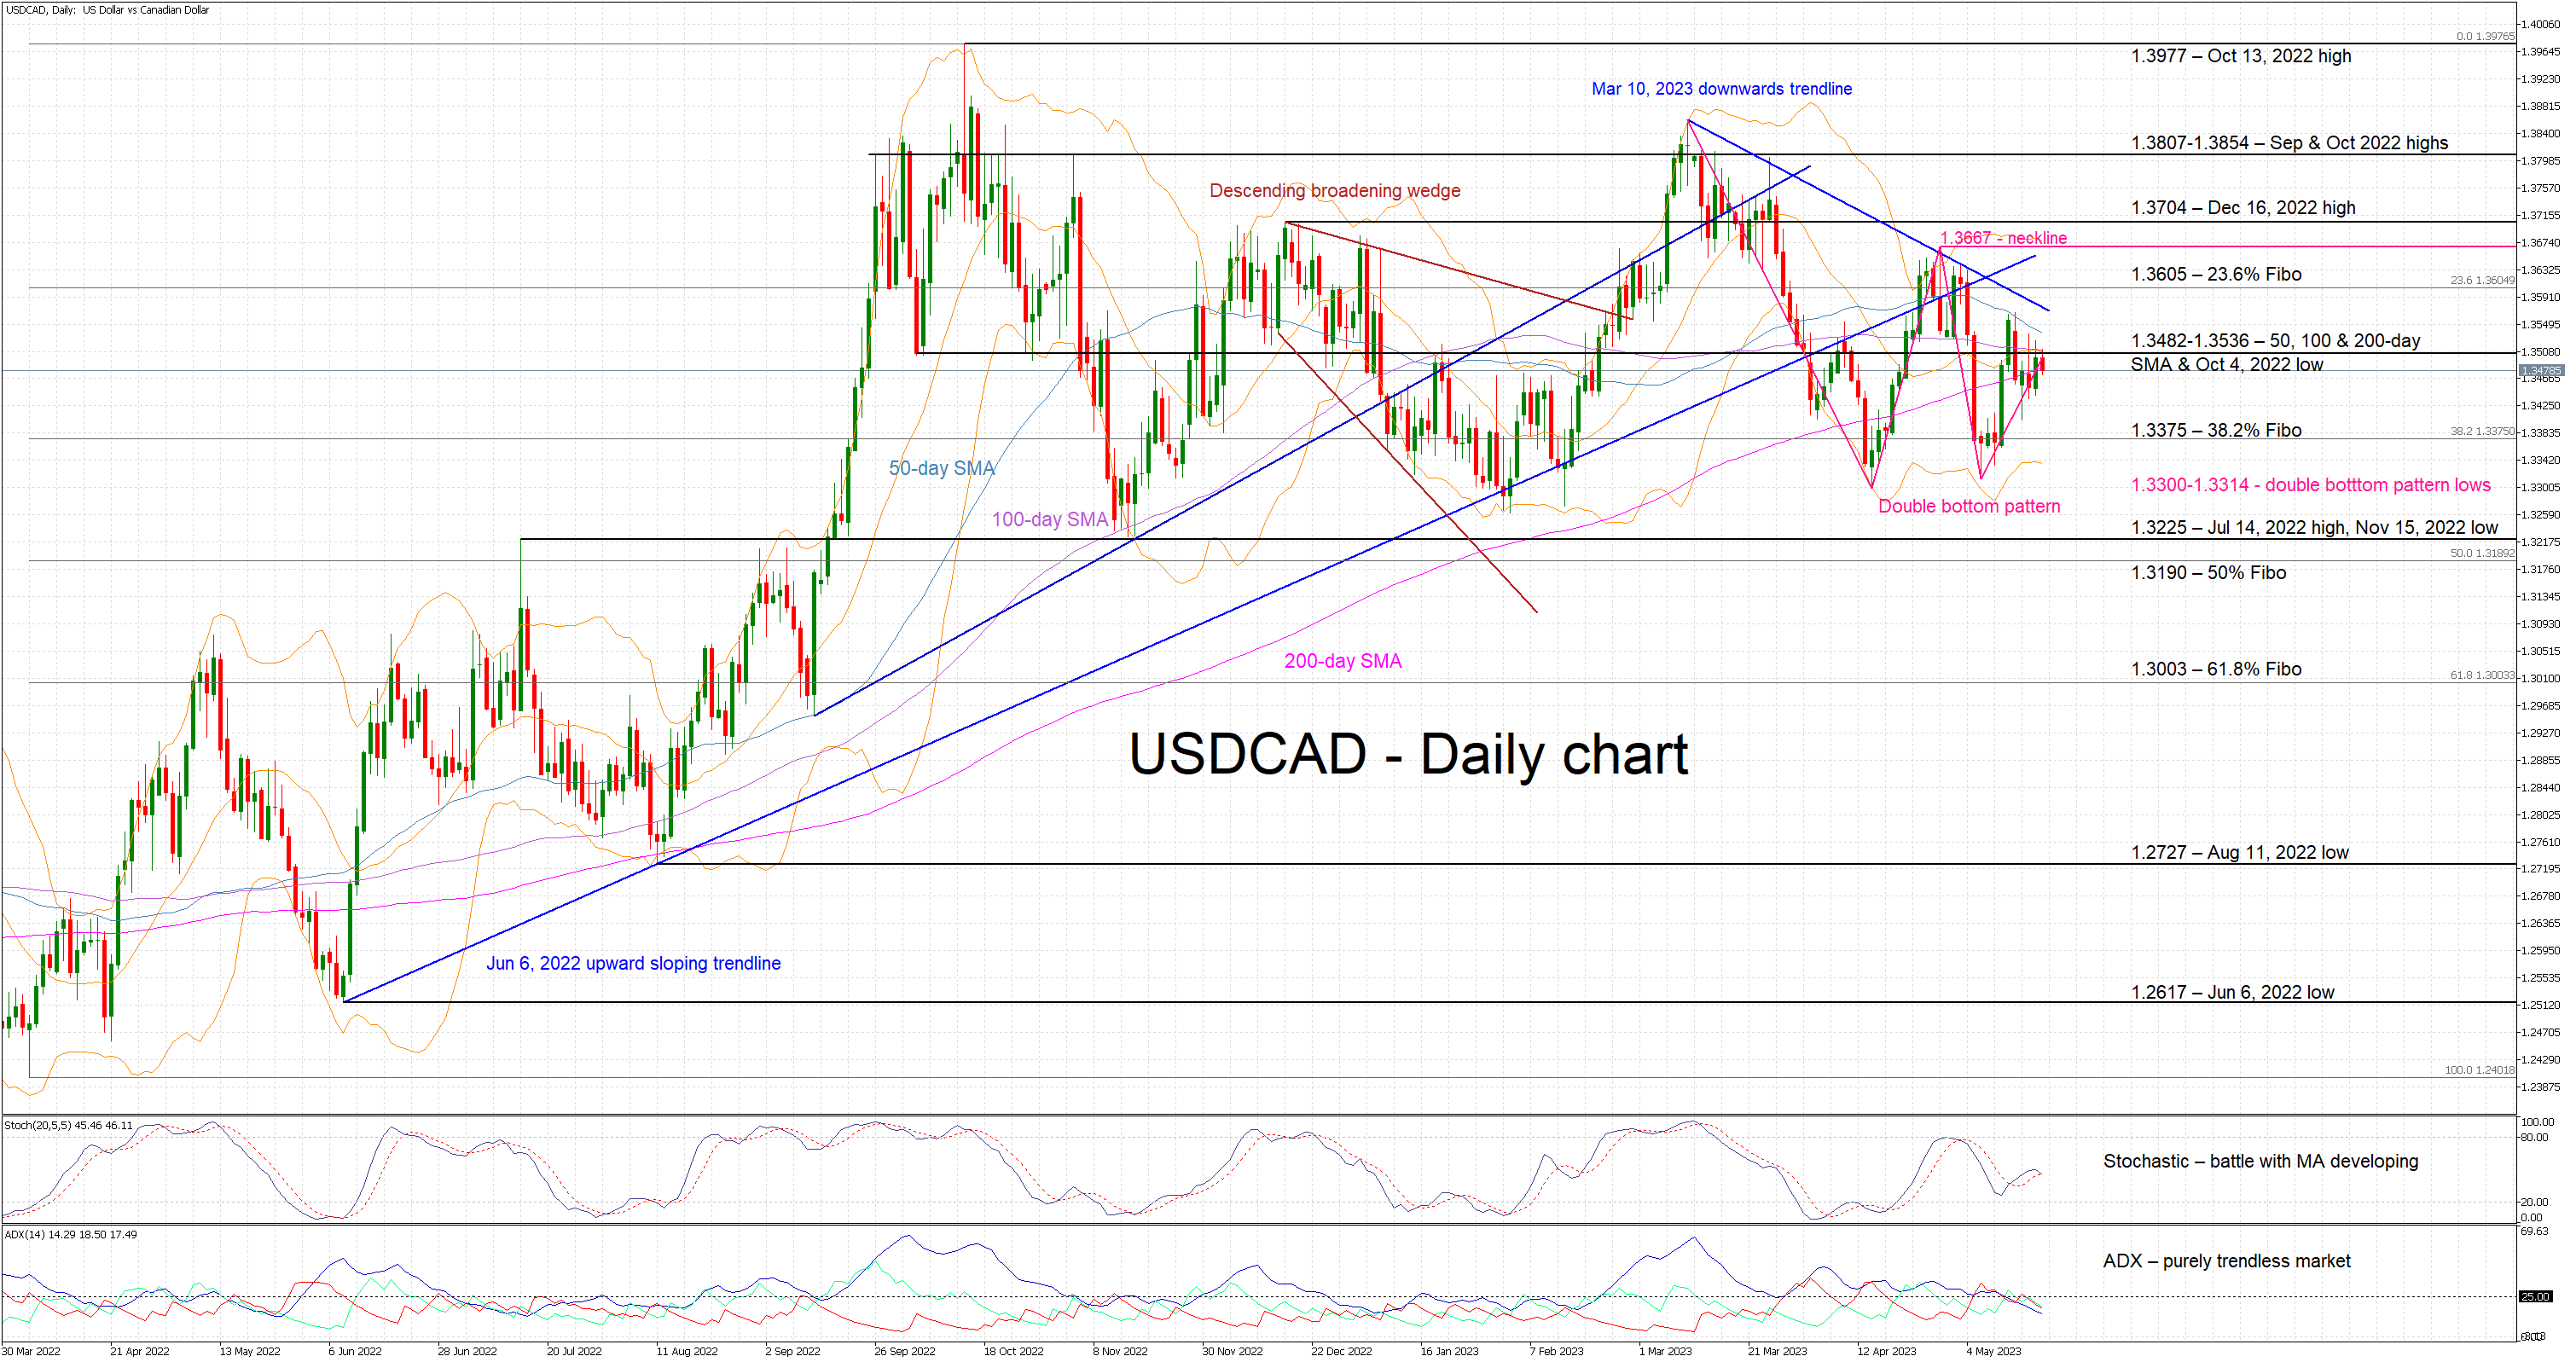
USDCAD is edging lower today but it appears to be in a delicate balance. It is hovering inside the rather busy 1.3482-1.3536 area, as the pair seems to be taking a breather from the downward move that commenced on March 10, 2023. The aggressive convergence of the simple moving averages (SMAs) employed here and the trendless Average Directional Movement Index (ADX) confirm the current range-trading phase.
The stochastic oscillator could offer a potential way out of the current deadlock. It is hovering at its 50-midpoint, but it is also testing the support set by its moving average. A break lower could encourage the bears to push for another lower low in USDCAD. Their first aim would be to break the current 1.3482-1.3536 range populated by the 50-, 100- and 200-day SMAs and the October 4, 2022 low respectively. They would then set their eyes on the 38.2% Fibonacci retracement of the April 5, 2022 – October 13, 2022 uptrend at 1.3375, a tad ahead of the double bottom pattern lows at the 1.3300-1.3314 area.
On the other hand, a bounce higher by the stochastic oscillator could assist the bulls into staging a new rally and limit the recent losses. In addition, there is a bullish double-bottom pattern (bottoms on April 14 and May 8) developing in USDCAD. However, the bulls should avoid jumping the gun as, for the pattern to be valid, the 1.3667 neckline has to be broken first. Should this occur, the potential upside target from this pattern is in the 1.3900 region.
Provided that they clear the much talked about 1.3428-1.3536 area, the bulls would then look for a retest of the 23.6% Fibonacci retracement at 1.3605. Even higher, the double bottom neckline at 1.3667 and the December 16, 2022 high at 1.3704 respectively could prove tougher to crack.
To sum up, USDCAD is at a critical point. The bears appear to have the upper hand due to the downward move since the March 10 high, but the bulls are itching for the completion of the double bottom pattern.
Elliott Wave View: S&P 500 (SPX) Has Started Wave 5 Higher
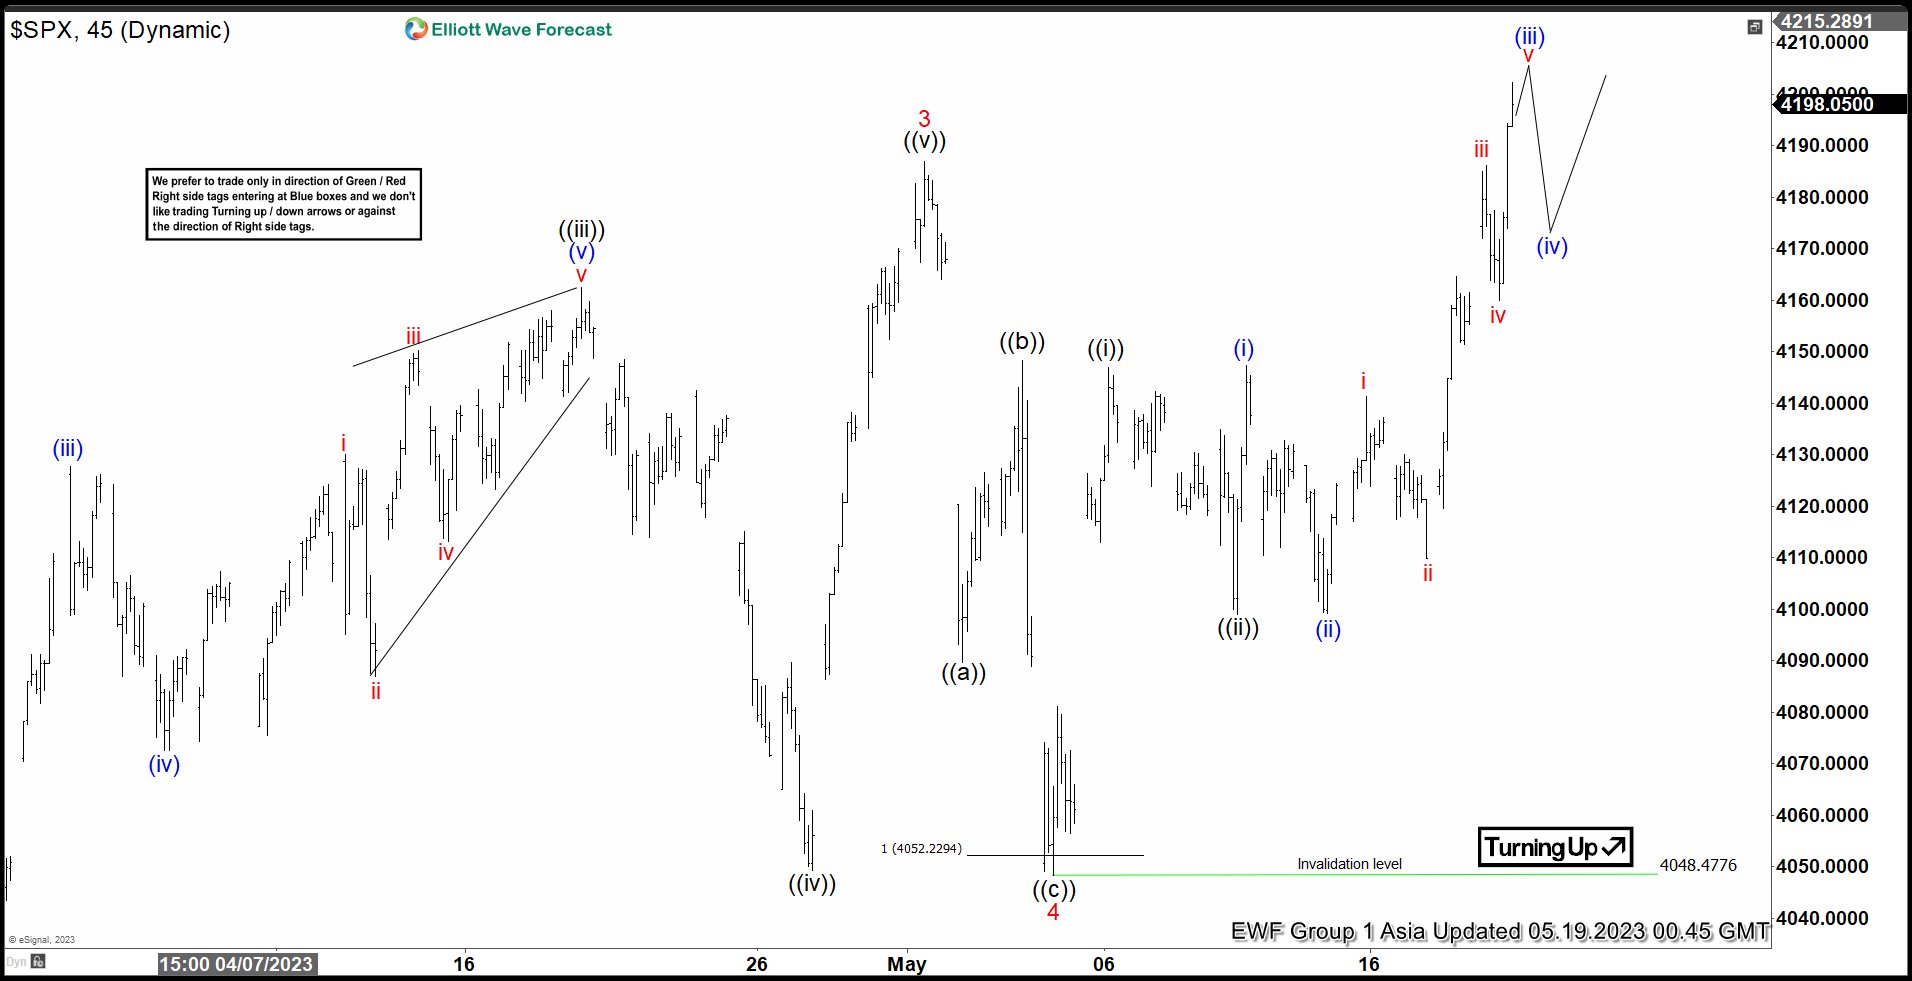
Short term Elliott Wave View in S&P 500 (SPX) shows the Index ended wave 3 at 4186.92 and pullback in wave 4 ended at 4048.4. Internal subdivision of wave 4 unfolded as a zigzag Elliott Wave structure. Down from wave 3, wave ((a)) ended at 4089.72 and rally in wave ((b)) ended at 4148.3. Final leg wave ((c)) lower ended at 4048.47. The Index has resumed higher and broken above wave 3, confirming that wave 5 has started. Wave 5 is unfolding as a 5 waves impulse structure with an extension.
Up from wave 4, wave ((i)) ended at 4147.02 and pullback in wave ((ii)) ended at 4098.92. The Index then resumes higher again in wave ((iii)) in 5 waves of a lesser degree. Up from wave ((ii)), wave (i) ended at 4147.32 and dips in wave (ii) ended at 4099.12. Up from there, wave i ended at 4141.25, wave ii ended at 4109.86. Wave iii ended at 4186.2, wave iv ended at 4160.04. Final leg wave v is expected to end soon which should complete wave (iii). Afterwards, it should pullback in wave (iv) before the rally resumes again. Near term, as far as pivot at 4048.47 low stays intact, expect pullback to find support in 3, 7, 11 swing and Index to resume higher.
S&P 50 (SPX) 45 Minutes Elliott Wave Chart
SPX Elliott Wave Video
https://www.youtube.com/watch?v=_4fAY1PIpmI
USD/CAD Daily Outlook
Daily Pivots: (S1) 1.3459; (P) 1.3492; (R1) 1.3535; More....
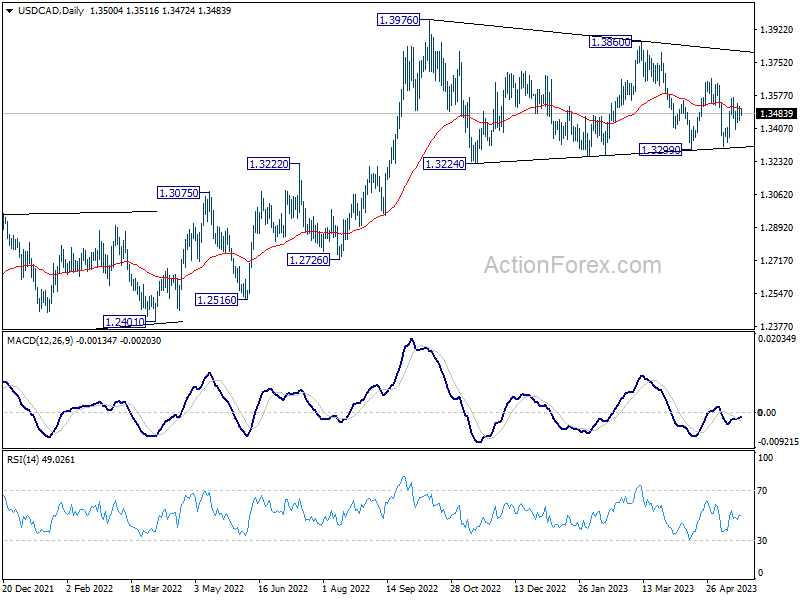
Range trading continues in USD/CAD and intraday bias remains neutral at this point. Overall, the pair is seen as extending the triangle consolidation pattern from 1.3976. Above 1.3566 will resume the rebound towards 1.3666 resistance and then 1.3860. However, firm break of 1.3313 support will invalidate this view and indicate that deeper correction is underway.
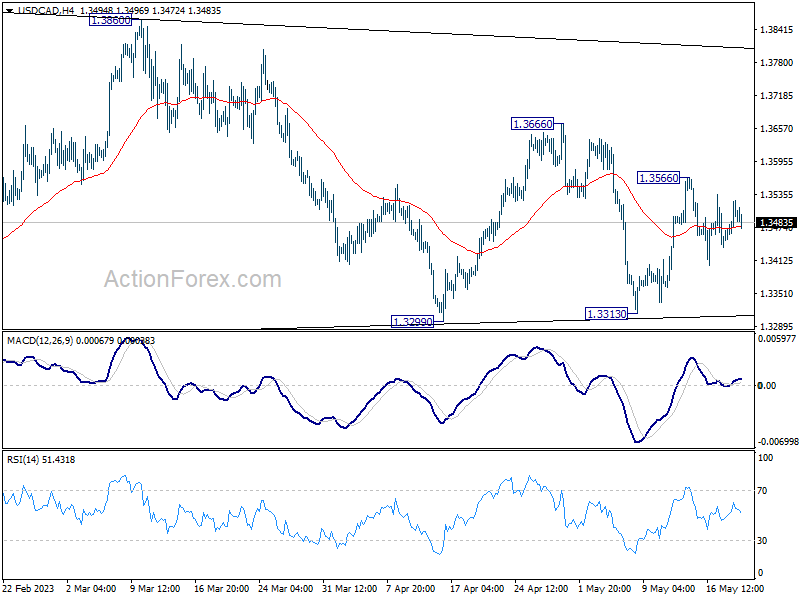
In the bigger picture, as long as 55 W EMA (now at 1.3321) holds, up trend from 1.2005 (2021 low) is still in favor to resume through 1.3976 at a later stage. However, sustained trading below the EMA and 38.2% retracement of 1.2005 to 1.3976 at 1.3233 will raise the chance of bearish reversal. Deeper should then be seen to 61.8% retracement at 1.2758 next.
AUD/USD Daily Report
Daily Pivots: (S1) 0.6595; (P) 0.6632; (R1) 0.6658; More...
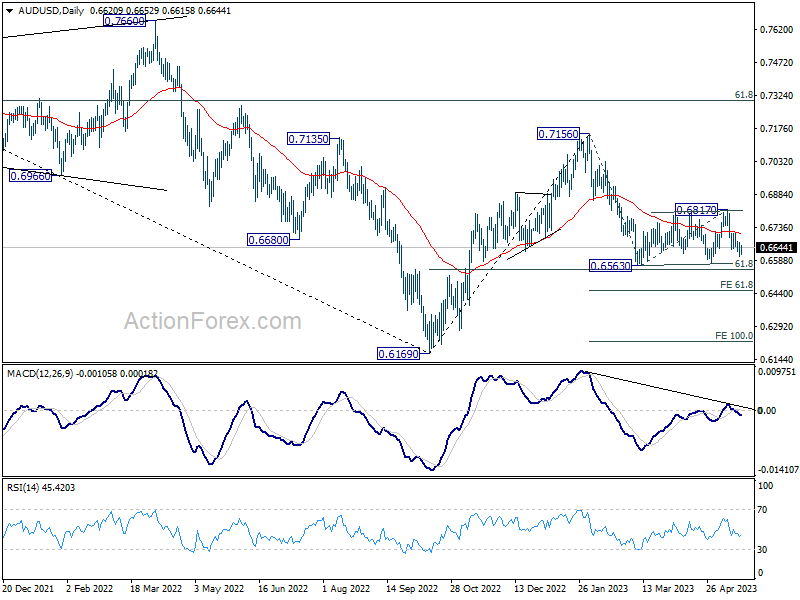
With 0.6708 minor resistance intact, further decline is expected in AUD/USD to retest 0.6563 low. Decisive break there will resume larger decline from 0.7156 to 61.8% projection of 0.7156 to 0.6563 from 0.6817 at 0.6451. On the upside, above 0.6708 minor resistance will delay the bearish case, and probably extend the corrective pattern from 0.6563 with another rising leg.
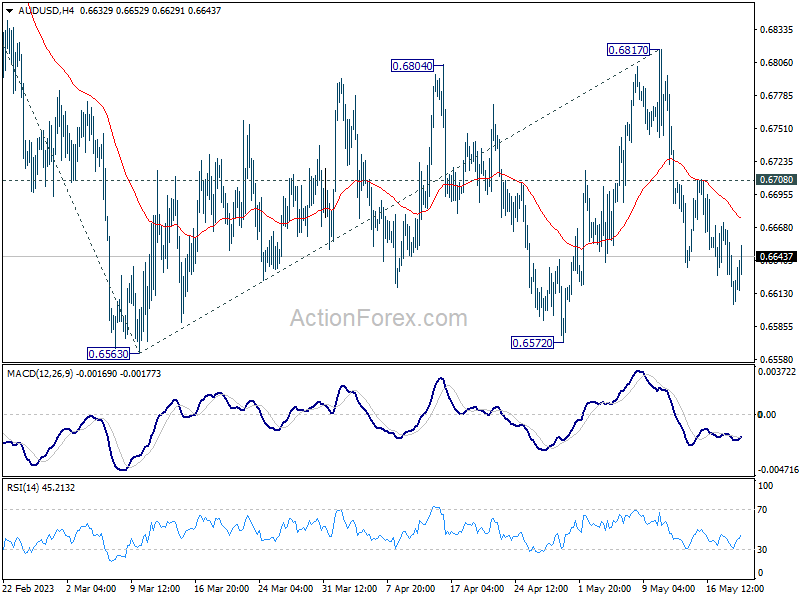
In the bigger picture, the failure to break through 55 W EMA (now at 0.6822) keeps medium term outlook bearish. Firm break of 61.8% retracement of 0.6169 to 0.7156 at 0.6546 will raise the chance of long term down trend resumption through 0.6169 low. This will now be the favored case as long as 0.6817 resistance holds.