

Sample Category Title
EUR/USD Daily Outlook
Daily Pivots: (S1) 1.0739; (P) 1.0794; (R1) 1.0824; More...
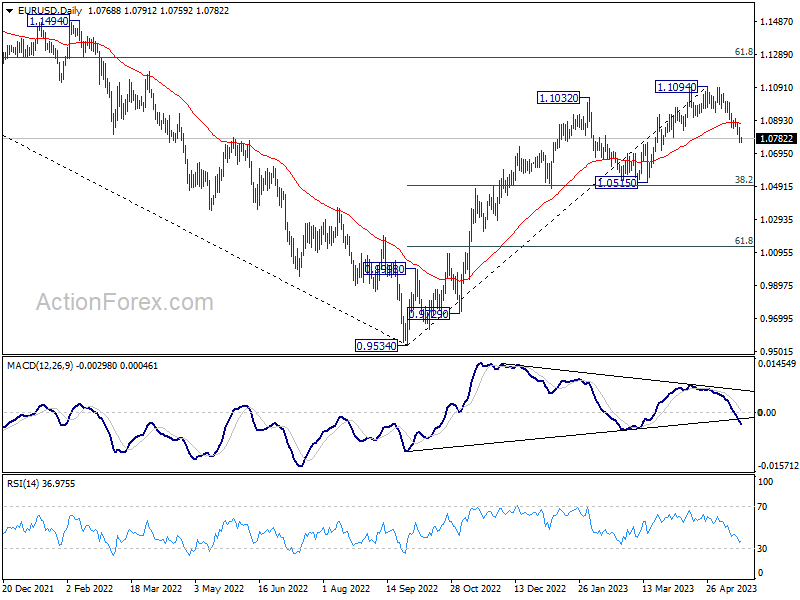
Intraday bias in EUR/USD remains on the downside and outlook is unchanged. As a correction to whole up trend from 0.9534, current fall should target 1.0515 cluster support, 38.2% retracement of 0.9534 to 1.1094 at 1.0498. On the upside, above 1.0848 minor resistance will turn intraday bias neutral first.
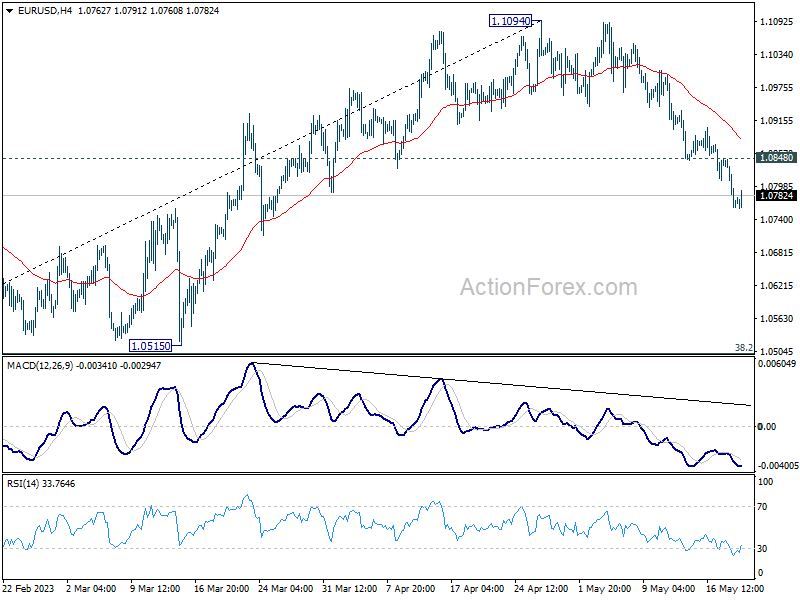
In the bigger picture, as long as 1.0515 support holds, rise from 0.9534 (2022 low) would still extend higher. Sustained break of 61.8% retracement of 1.2348 (2021 high) to 0.9534 at 1.1273 will solidify the case of bullish trend reversal and target 1.2348 resistance next (2021 high).
GBP/USD Daily Outlook
Daily Pivots: (S1) 1.2369; (P) 1.2432; (R1) 1.2471; More...
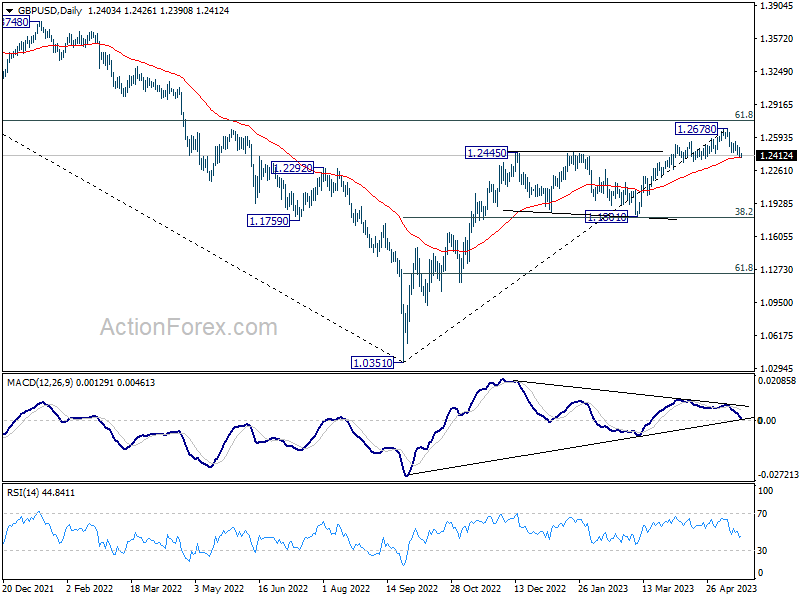
Intraday bias in GBP/USD remains on the downside for the moment. Fall from 1.2678 is seen as correcting whole up trend from 1.0351. Sustained trading below 55 D EMA (now at 1.2392) will affirm this case, and pave the way to 1.1801 cluster support (38.2% retracement of 1.0351 to 1.2678 at 1.1789). On the upside, above 1.2545 minor resistance will turn intraday bias neutral first.
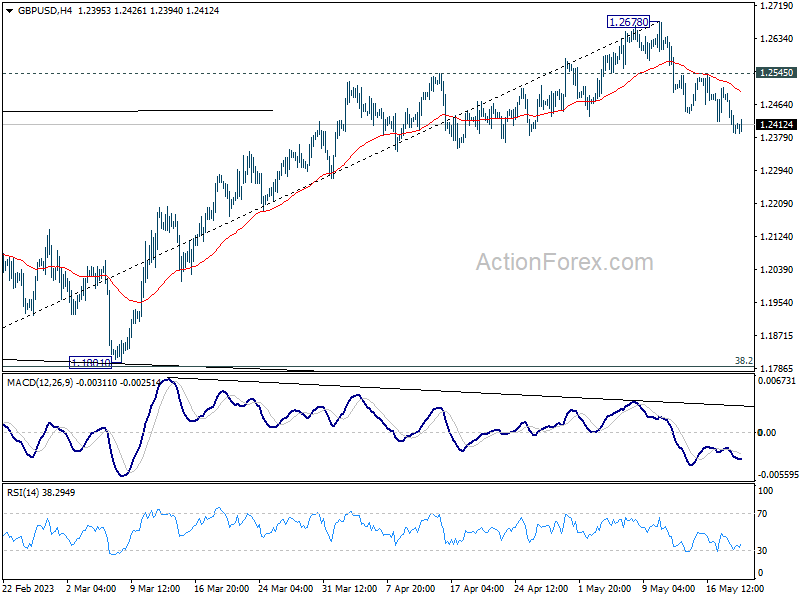
In the bigger picture, as long as 1.1801 support holds, rise from 1.0351 medium term bottom (2022 low) is expected to extend further. Sustained break of 61.8% retracement of 1.4248 (2021 high) to 1.0351 at 1.2759 will add to the case of long term bullish trend reversal. However, firm break of 1.1801 will indicate rejection by 1.2759, and bring deeper decline, even as a correction.
USD/CHF Daily Outlook
Daily Pivots: (S1) 0.8997; (P) 0.9030; (R1) 0.9084; More...
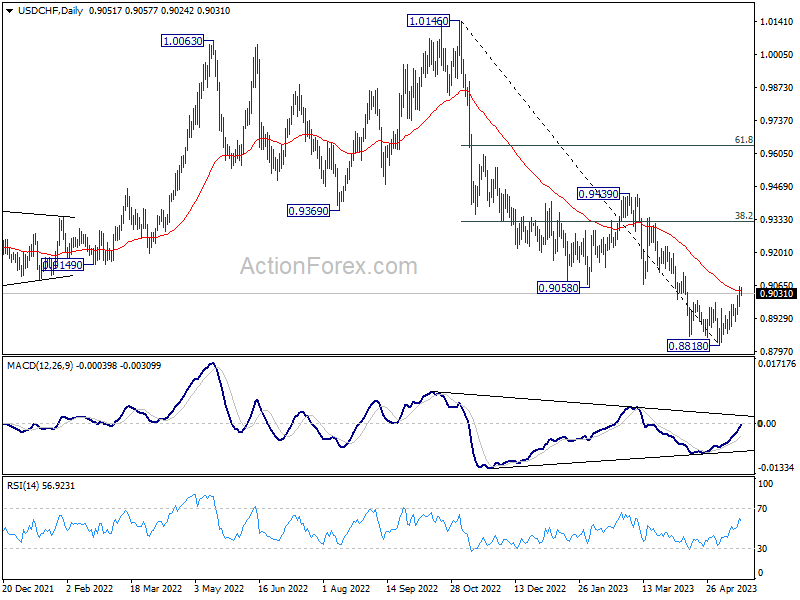
USD/CHF's rebound from 0.8818 short term bottom is in progress. Intraday bias stays on the upside for the moment. Sustained trading above 55 D EMA (now at 0.9042) should confirm that current rally is at least correcting whole down trend from 1.0146. Further rise should then be seen to 38.2% retracement of 1.0146 to 0.8818 at 0.9325. On the downside, below 0.8977 minor support will turn intraday bias neutral first.
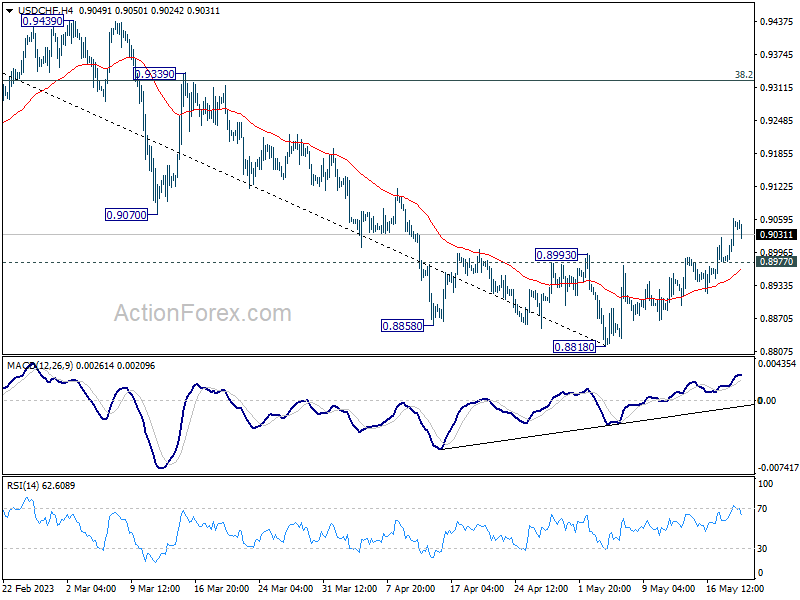
In the bigger picture, fall from 1.1046 (2022 high) is seen as a leg in the long term range pattern from 1.0342 (2016 high). So, downside should be contained by 0.8756 to bring reversal. Sustained break of 0.9058 support turned resistance will be the first sign of medium term bottoming. However, decisive break of 0.8756 will carry larger bearish implications.
USD/JPY Daily Outlook
Daily Pivots: (S1) 137.75; (P) 138.25; (R1) 139.21; More...
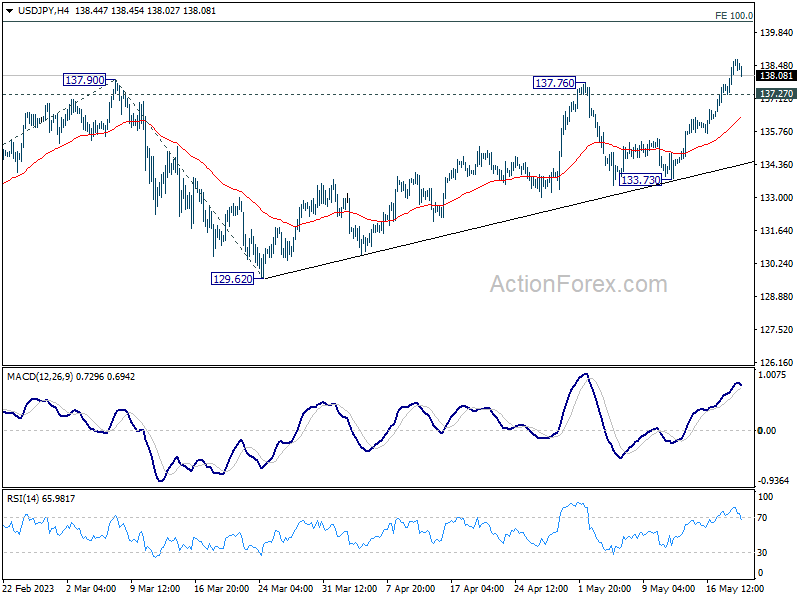
Intraday bias in USD/JPY remains on the upside for now, despite current slight retreat. Current rise is part of the whole rally from 127.20. Next target is 100% projection of 127.20 to 137.90 from 129.62 at 140.32. Break there will target 142.48 fibonacci level. On the downside, below 137.27 minor support will turn intraday bias neutral first.
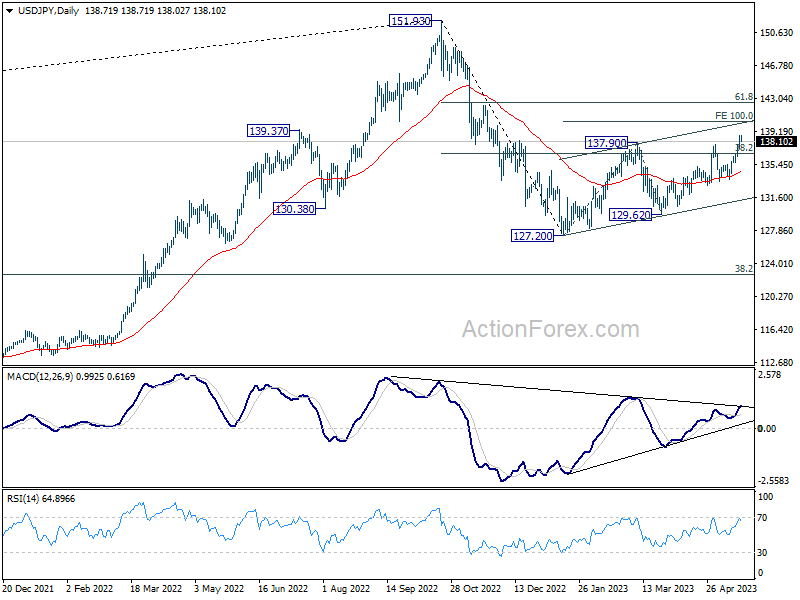
In the bigger picture, price actions from 151.93 high are currently seen as a corrective pattern to the long term up trend. The first leg should have completed at 127.20. Rebound from there is seen as the second leg. Sustained break of 38.2% retracement of 151.93 to 127.20 at 136.34 will bring stronger rise to 61.8% retracement at 142.48. Meanwhile, break of 129.62 will argue that the third leg is starting through 127.20 low.
Yen’s Mild Recovery Overshadowed by Risk-On Sentiment; Euro, Swiss Franc Trail Closely in Underperformance
Japanese yen made a modest recovery today, bolstered by yet another month of robust consumer inflation data. However, this uptick in the currency was held back by strong risk-on sentiment prevalent in Japan, with Nikkei surging to a 33-year high. BoJ's continued commitment to its ultra-loose monetary policy also put a damper on Yen's rise, securing its position as the weakest performer for the week - and by a significant margin at that.
With the week drawing to a close, Euro and Swiss franc are trailing closely behind the Yen as underperformers, followed by Sterling. New Zealand Dollar stands as the week's strongest, receiving a slight boost from promising trade data released today. Canadian dollar, buoyed by earlier in the week's CPI data, anticipates the next move from retail sales figures due later today. Dollar maintains a firm stance, albeit lagging behind Kiwi and Loonie.
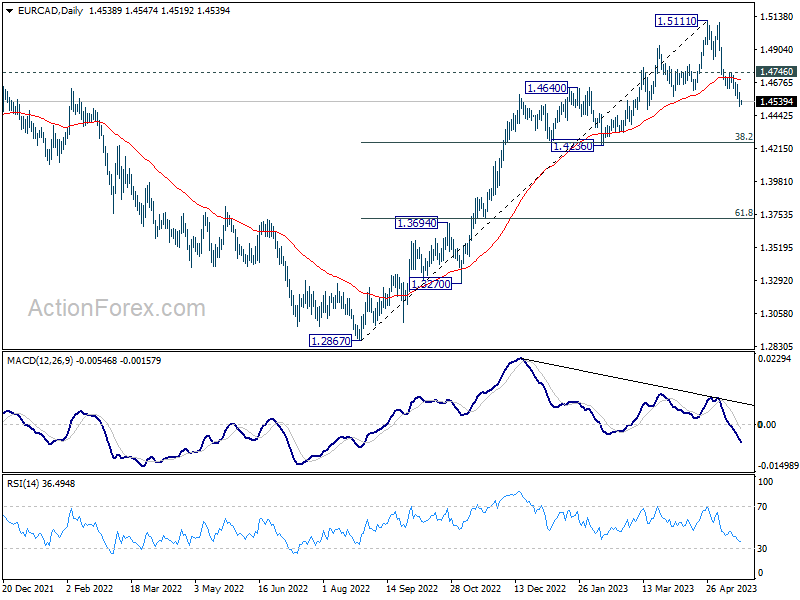
From a technical standpoint, EUR/CAD pair has seen its fall from 1.5111 intensify this week. Given bearish divergence in D MACD, the decline could be viewed as a correction to the overall uptrend from 1.2867. As long as 1.4746 resistance level holds, deeper fall towards 1.4236 cluster support (38.2% retracement of 1.2867 to 1.5111 at 1.4254) is expected. Notably, strong support could emerge here to trigger a rebound, at least on the initial attempt.
In Asia, Nikkei rose 0.77% to 30808.35. Japan 10-year JGB yield rose 0.0177 to 0.403. Hong Kong HSI is currently down -1.28%. China Shanghai SSE is down -0.47%. Singapore Strait Times is up 0.55%. Overnight, DOW rose 0.34%. S&P 500 rose 0.94%. NASDAQ rose 1.51%. 10-year yield rose 0.067 to 3.648.
Japan CPI core rose back to 3.5% in April, core-core hit 42-yr high
April saw Japanese consumer prices accelerating, with CPI accelerated from 3.2% yoy to 3.5% yoy. That put a halt to the slowdown of headline inflation from 4.3% in January.
Even more significantly, core CPI (which excludes fresh food) rose from 3.1% yoy to 3.4%. This metric has been above BoJ's 2% target for an uninterrupted 13 months, signifying persistent inflationary pressure.
In the realm of core-core CPI, which excludes both fresh food and energy, the increase is even starker, rising from 3.8% yoy to 4.1%. This figure is the highest it has been since September 1981, marking a nearly 42-year peak.
Looking at some details, services inflation increased from 1.5% yoy to 1.7%, the highest in 28 years since 1995 (excluding the impact of sales tax hikes). Durable goods prices soared 9.8% yoy, and food prices accelerated from 8.2% yoy to 9.0%, hitting the highest level in almost 47 years since 1976. Energy prices, however, bucked the trend with a yoy decrease of -4.4% yoy.
Despite these inflationary pressures, there is no clear indication that BoJ is preparing to exit its ultra-loose monetary policy. The bank projected CPI to average 1.8% and core CPI at 2.5% for the current fiscal year, but given the current data, it is likely that these projections will be revised upward in the next release.
New Zealand exports rise 10% yoy with China leading, EU tops 12% imports growth
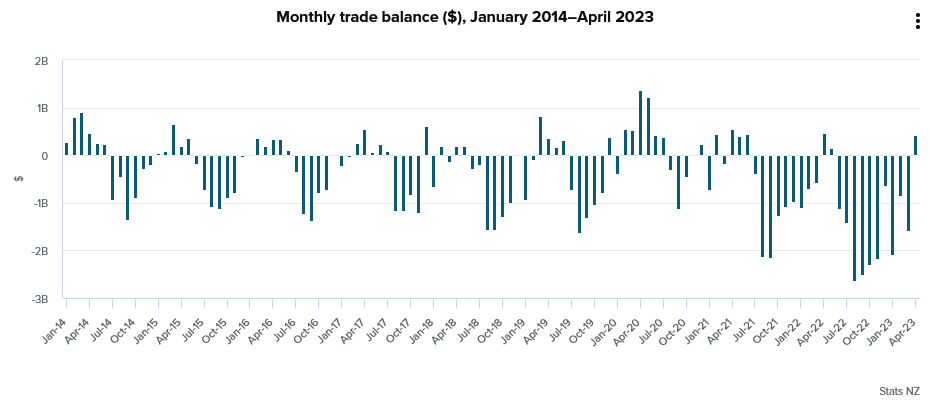
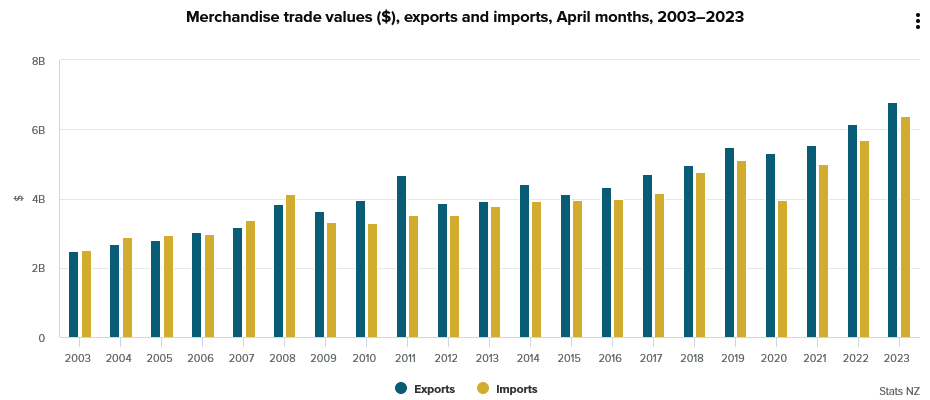
New Zealand's trade balance in April reported a surplus of NZD 427m, defying expected deficit of NZD -1310m. Both imports and exports experienced significant year-on-year growth, with exports rising 10% yoy (NZD 641m) to NZD 6.8B and imports increasing 12% yoy (NZD 683m) to NZD 6.4B.
In the export sector, notable growth was observed in shipments to China, Australia, and the US. Specifically, total exports to China rose by NZD 259m (16% yoy), to Australia by NZD 67m (10% yoy), and to the US by NZD 109m (17% yoy). However, exports experienced a slight downturn to the EU, falling by NZD -2.2m (-0.4% yoy), and a more substantial drop to Japan, decreasing by NZD -53m (-12% yoy).
On the import side, the European Union led the surge with total imports up by NZD 108m (13% yoy). Imports from the US also experienced growth, with an increase of NZD 46m (7.6% yoy). Conversely, imports from China, Australia, and South Korea all fell, with decreases of NZD -29m (-2.4% yoy), NZD -37m (-5.1% yoy), and NZD -28m (-8.3% yoy) respectively.
Looking ahead
ECB will publish monthly economic bulletin today. Canada will release retail sales.
USD/JPY Daily Outlook
Daily Pivots: (S1) 137.75; (P) 138.25; (R1) 139.21; More...
Intraday bias in USD/JPY remains on the upside for now, despite current slight retreat. Current rise is part of the whole rally from 127.20. Next target is 100% projection of 127.20 to 137.90 from 129.62 at 140.32. Break there will target 142.48 fibonacci level. On the downside, below 137.27 minor support will turn intraday bias neutral first.
In the bigger picture, price actions from 151.93 high are currently seen as a corrective pattern to the long term up trend. The first leg should have completed at 127.20. Rebound from there is seen as the second leg. Sustained break of 38.2% retracement of 151.93 to 127.20 at 136.34 will bring stronger rise to 61.8% retracement at 142.48. Meanwhile, break of 129.62 will argue that the third leg is starting through 127.20 low.
Economic Indicators Update
| GMT | Ccy | Events | Actual | Forecast | Previous | Revised |
|---|---|---|---|---|---|---|
| 22:45 | NZD | Trade Balance (NZD) Apr | 427M | -1310M | -1273M | -1586M |
| 23:01 | GBP | GfK Consumer Confidence May | -27 | -30 | ||
| 23:30 | JPY | National CPI Y/Y Apr | 3.50% | 3.20% | ||
| 23:30 | JPY | National CPI Core Y/Y Apr | 3.40% | 3.40% | 3.10% | |
| 23:30 | JPY | National CPI Core-core Y/Y Apr | 4.10% | 3.80% | ||
| 04:30 | JPY | Tertiary Industry Index M/M Mar | -1.70% | -0.10% | 0.70% | 1.70% |
| 06:00 | EUR | Germany PPI M/M Apr | 0.30% | -0.50% | -2.60% | -1.40% |
| 06:00 | EUR | Germany PPI Y/Y Apr | 4.10% | 4.00% | 7.50% | 6.70% |
| 08:00 | EUR | ECB Economic Bulletin | ||||
| 12:30 | CAD | Retail Sales M/M Mar | -1.30% | -0.20% | ||
| 12:30 | CAD | Retail Sales ex Autos M/M Mar | -0.80% | -0.70% |
Cliff Notes: Hawkish Bias to Remain as Inflation Risks Abate
Key insights from the week that was.
The near-term path for interest rates was in the spotlight this week. For Australia, it was chiefly through the lens of the labour market; in the US, the rhetoric of policymakers was the focus.
The May RBA meeting minutes provided a fairly mixed assessment of what was labelled a ‘finely balanced’ decision between a pause and the eventual outcome of a 25bp rate hike. It was interesting to note renewed concern around the medium-term path for inflation, specifically the upside risks – persistent services inflation, strong population growth (as evinced by ongoing strength in permanent and long-term net arrivals) and pressure on rents. Also noted was that, having inflation return to the top of the target range by mid-2025 leaves “little room for upside surprises… given that inflation would have been above the target for around four years by that time”.
The data that followed the minutes however eased expectations of further increases in interest rates, at least for the near-term.
The 0.8% gain in the wage price index over the three month to March raised the annual rate of wage inflation to 3.7%, a level which can still be viewed as relatively comfortable for the RBA. The underlying detail was also constructive, particularly the trend moderation in private sector wages growth (from 1.2% in September to 0.9% in December and 0.8% in March) as well as the fact that the proportion of those getting a wage rise under individual bargaining arrangements in March – which represents the majority of wages growth – was no larger than it was last year.
Meanwhile, the April labour force survey provided the largest surprise in the week, with employment declining by 4.3k and the unemployment rate rising from 3.5% to 3.7% (3.54% to 3.66% at two decimal points). The unique seasonality issues around the timing of Easter holidays and the survey reference period makes it difficult to interpret the underlying trend clearly. Nevertheless, this still represents a shift in tone following robust strength through February and March.
Taken together, these updates are likely to ease the Board’s immediate concerns around upside risks to inflation. Note, the chief risk for policy is centred on the August Board meeting when the next quarter of CPI data will be assessed. We continue to believe the cash rate is sufficiently restrictive to ensure inflation’s return to target, allowing the RBA to remain on hold over 2023 and cut in 2024. But momentum in price and labour data requires continued careful assessment.
Highlighting the impact of recent policy announcements, Westpac-MI Consumer Sentiment fell 7.9% to 79.0, a deeply pessimistic level. While the RBA’s surprise rate hike in May certainly played a role, the Budget also had an adverse effect, with sentiment amongst post-Budget respondents 7.4% lower than those sampled prior. The detail was more positive though, with the difference between self-assessed ‘budget losers’ and ‘budget winners’ favourable versus history, perhaps suggesting that households believe the Government’s measures will deliver some relief on the cost-of-living.
This week in New Zealand, there have been two key releases, our Economics team’s latest Quarterly Economic Overview and the Government’s 2023 Budget. The Overview updates on our New Zealand team’s latest expectations for the economy and the RBNZ, the take-home being that New Zealand’s economy is now expected to avoid recession thanks to resurgent population growth. Tight supply and the increase in demand to come as a result of migration will require the RBNZ to increase rates a little further to a peak of 6.0% at September, with rates then on hold until mid-2024.
This week’s US data was of limited significance. Total advance retail sales surprised to the downside, rising 0.4% in April against an expectation of 0.8%; however, part of the March decline was revised away, from -1.0% to -0.7%, leaving the two-month movement in line with expectations. Control group retail sales meanwhile surprised to the upside, gaining 0.7%; but this beat was partly offset by a negative revision to March, to a decline of -0.4%. Overall, nominal retail sales growth remains positive but modest. April’s housing data was meanwhile decidedly mixed, starts up 2.2% after a 4.5% decline in March as permits fell another 1.5% following a 3.0% decline in March. Constructively, the NAHB housing index provided evidence of a stabilisation in home builder confidence at weak levels, the index rising from 45 to 50 in May.
The focus for market participants was instead on a slew of comments from FOMC members. Each speaker brought their own perspective and degree of hawkishness, but their collective intent was clear: to keep financial conditions contractionary while upside inflation risks linger. In our view, the FOMC does not need to hike again to get inflation back near target over the coming year; but it does need to hold policy at a restrictive setting for the remainder of 2023. If the leading indicators for shelter prove correct, then annualised inflation will be back around 2.0% by December as slack builds in the labour market. From then on, the focus of the FOMC will pivot to the weak state of activity and downward skew of risks. From December 2023 to December 2024, 225bps of rate cuts are expected.
Also of note this week was China’s activity data for April. As was the case last week, the market was looking for weakness and found it in disappointing industrial production and fixed asset investment, respectively 3.6% and 4.7% year-to-date versus 2022. A degree of disappointment is unsurprising for investment in early-2023, with private investment yet to fire and the pipeline for housing construction only beginning to build, residential sales having risen 11.8% year-to-date against 2022. However, the strength of exports to Asia; China’s continued structural development; and the capacity of Chinese consumers, retail sales up 8.5% year-to-date, give us confidence that GDP growth can print above 6.0% in 2023 and hold between 5.0% and 6.0% in 2024 and 2025. At a time of weakness for the developed-world, this would be an exceptional result.
Technical Outlook and Review
DXY:
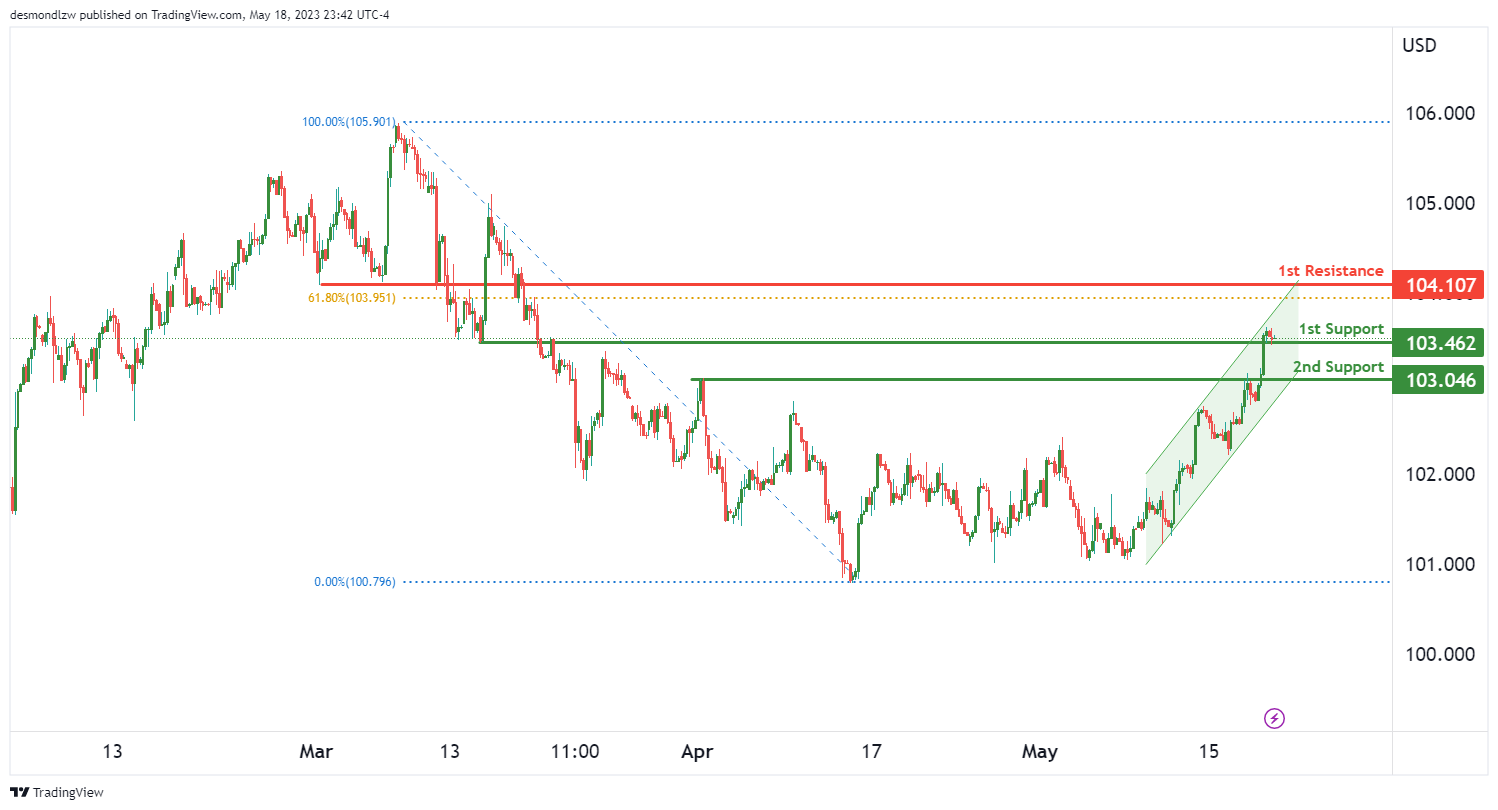
The current momentum of the DXY chart is weakly bullish, but with low confidence. The price movement within a bullish ascending channel contributes to this weak bullish outlook, and we could potentially see a continuation of this upward trend towards the 1st resistance.
The 1st support level is positioned at 103.46 and is considered an overlap support. This type of support is often formed by a price reversal area and can represent a strong buying interest that could potentially prevent a downward movement.
Beneath this, we find the 2nd support level at 103.04. It’s classified as a pullback support. This level could provide an additional barrier for any potential bearish price action and can serve as a backup if the price fails to maintain above the 1st support level.
The 1st resistance level is located at 104.10. This level is known as a pullback resistance, and it aligns with the 61.8% Fibonacci retracement level. It can act as a potential hurdle for the price and could attract selling interest, potentially limiting any further bullish progression.
EUR/USD:
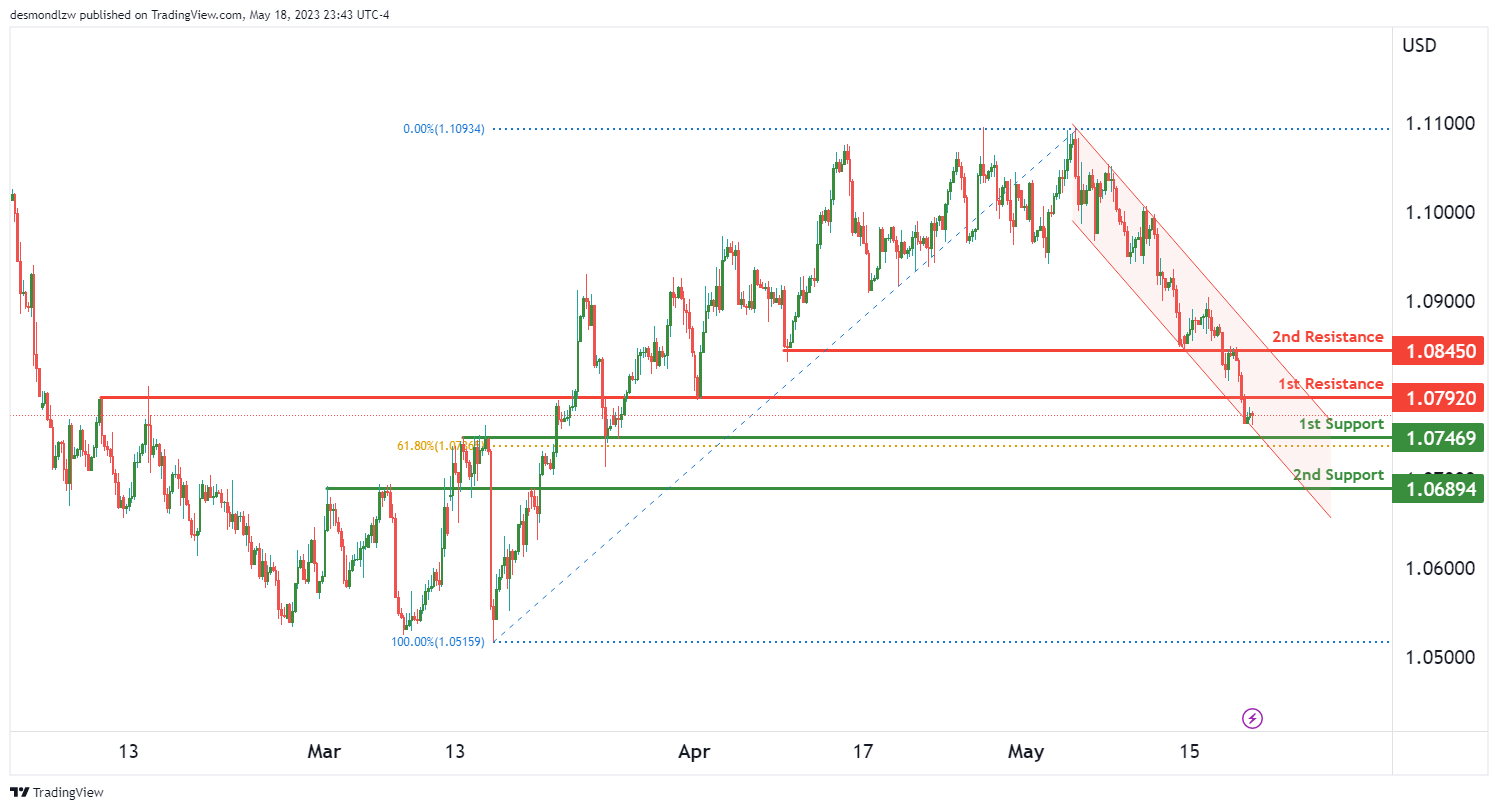
The current momentum of the EUR/USD chart is weakly bearish, but with low confidence. The price is moving within a bearish descending channel, suggesting the potential for further downward movement. It is likely that the price could react bearishly off the 1st resistance and drop towards the 1st support level.
The 1st support level is located at 1.0746, identified as an overlap support and coincides with the 61.8% Fibonacci retracement level. Overlap supports often form at price reversal areas and represent strong buying interest, providing a potential barrier to downward price action.
Further below, the 2nd support is found at 1.0689. This pullback support could offer an additional level of protection against further downward movement. If the price breaks below the first support, this level could act as a backup.
The 1st resistance is located at 1.0792. This overlap resistance could potentially limit upward price action, possibly attracting selling interest.
Above that, the 2nd resistance is at 1.0845. This is another overlap resistance that could provide a significant challenge for any bullish movement.
GBP/USD:
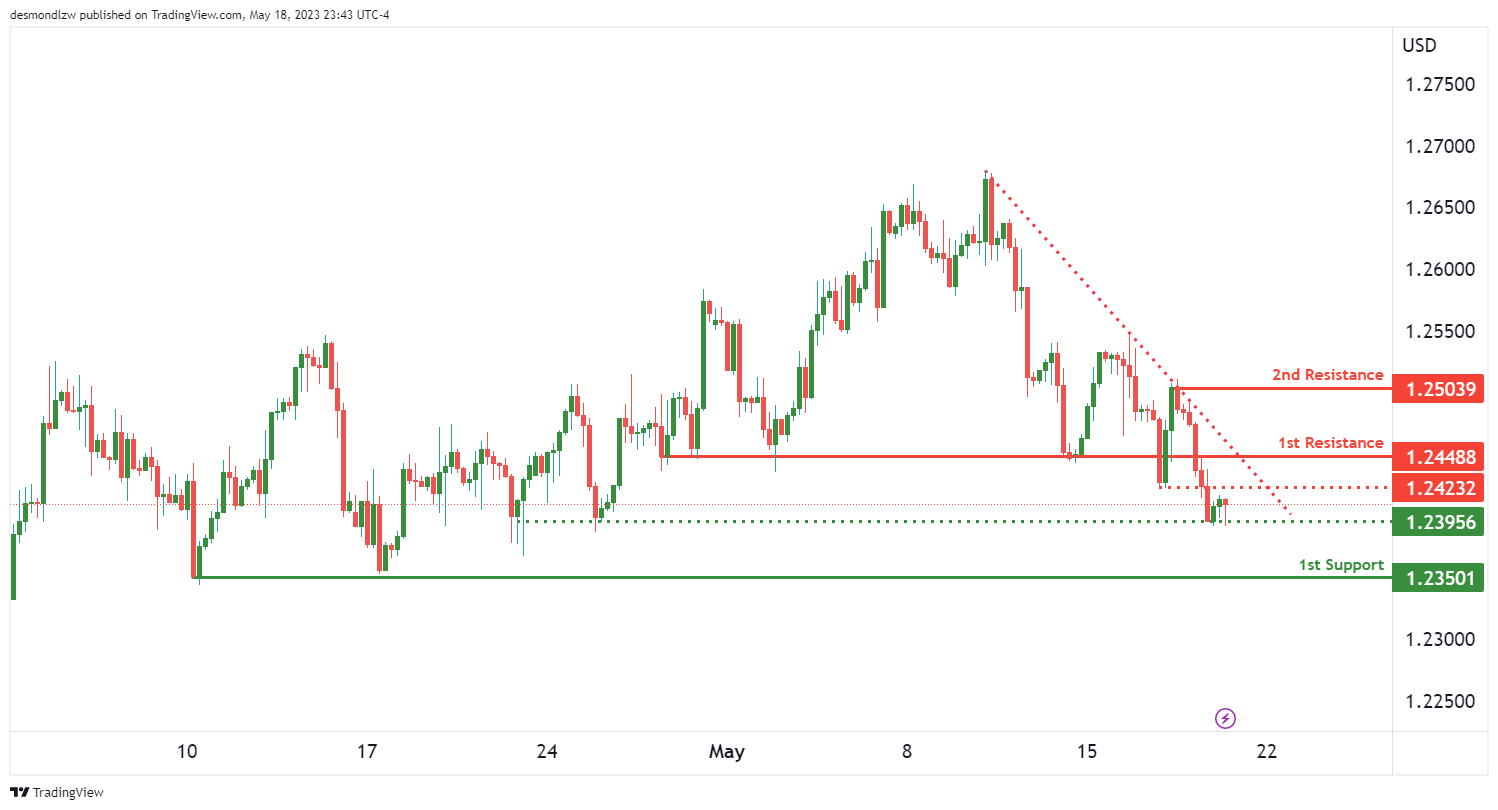
The GBP/USD chart is exhibiting a bearish momentum, with the price below a major descending trend line, suggesting potential continuation of the bearish trend.
The price could potentially make a continuation towards the 1st support level. The 1st support is located at 1.2350, which is considered a strong level as it has served as multi-swing low support in the past.
Below that, the intermediate support is at 1.2395, which is also multi-swing low support, signifying its potential strength in holding the price from falling further.
The 1st resistance is located at 1.2448. This pullback resistance could potentially limit upward price action and may attract selling interest. Above that, the intermediate resistance level is at 1.2423. As pullback resistance, it could limit any bullish move.
Further above, the 2nd resistance is at 1.2503. This swing high resistance level might serve as a significant barrier to the price if it attempts to move upward.
In a bearish environment, these resistance levels might act as potential targets for short positions, while support levels might act as levels where the price could bounce or slow its bearish momentum.
USD/CHF:
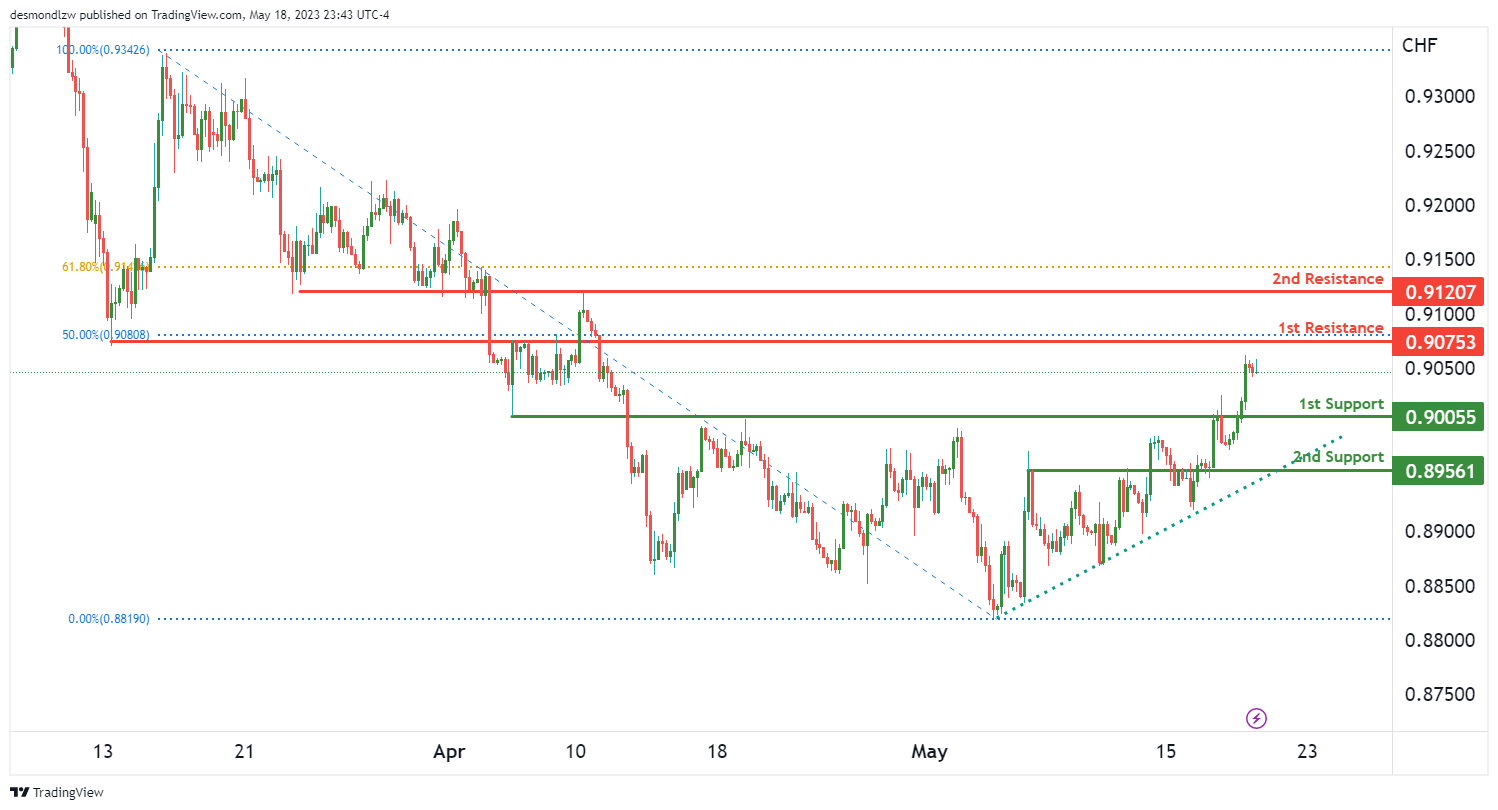
The USD/CHF pair, it becomes clear that the overall momentum of the chart is bullish. An important factor contributing to this momentum is the price’s position above a major ascending trend line. This indicates that further bullish momentum may be on the horizon.
Despite the overall bullish momentum, there’s potential for a short-term drop to the 1st support at 0.9005 before price makes a bounce back upwards. This support level is an overlap support, providing a solid base for a potential rebound.
However, should the price break below the 1st support, it might seek the next level of support at 0.8956. This level is also an overlap support, and could serve as a fallback for the price, providing additional support should the price continue its short-term decline.
Looking upwards, the first resistance to keep in mind is at 0.9075. This level serves as a pullback resistance and also aligns with a 50% Fibonacci retracement. Should the price bounce from the 1st support and rally upwards, this resistance level could pose a significant barrier.
If price successfully overcomes the 1st resistance, it could then aim for the 2nd resistance up at 0.9120. This level is not only an overlap resistance but also lines up with a 61.8% Fibonacci retracement, making it a significant barrier for the price
USD/JPY:
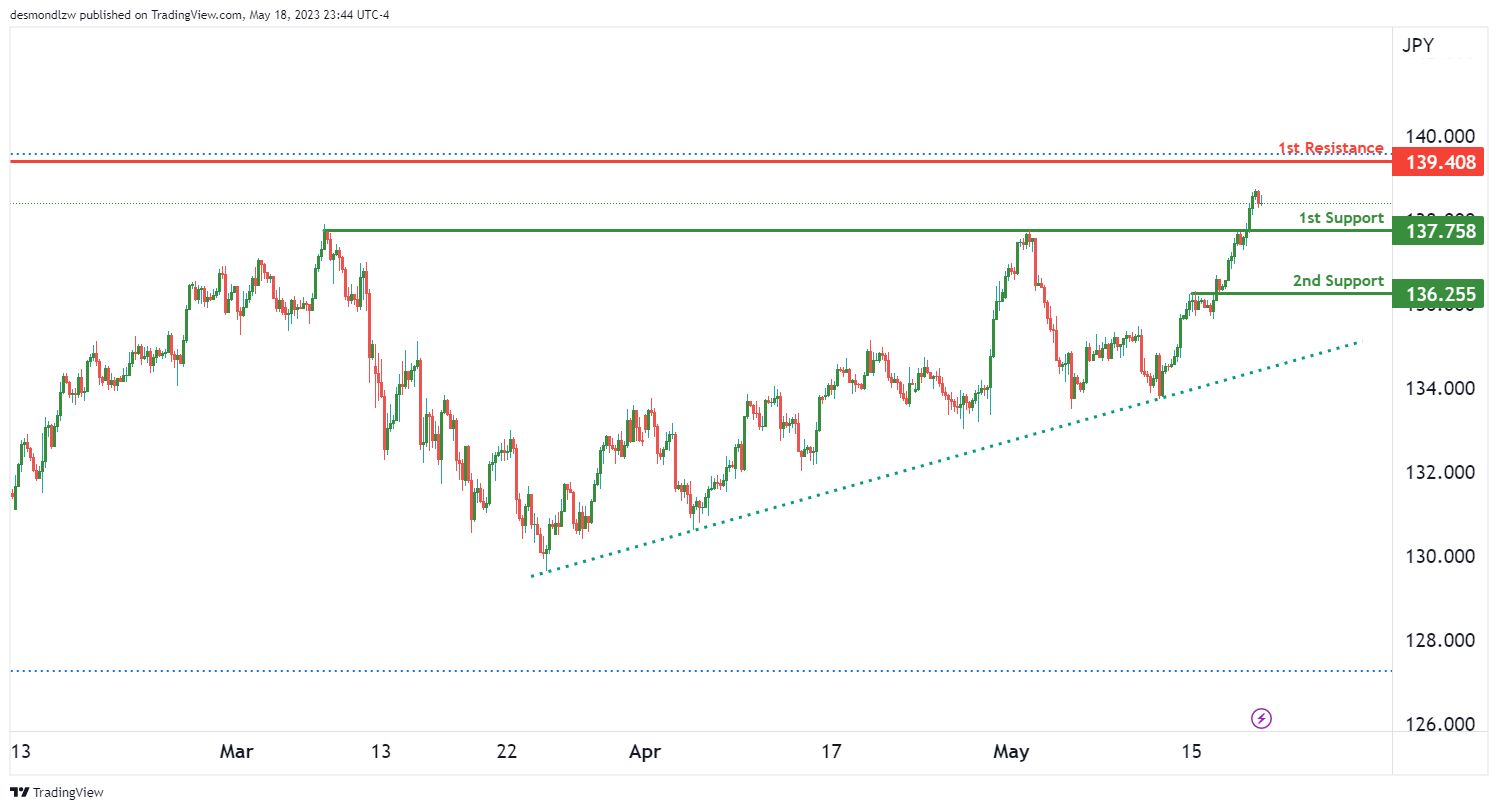
The USD/JPY pair clearly showcases a bullish overall momentum. One of the significant factors contributing to this momentum is the fact that the price is currently positioned above a major ascending trend line. This suggests that there may be more bullish momentum to come.
In terms of potential price movement, it seems possible that we may witness a bullish continuation towards the first resistance level.
Looking downwards, the first support level to keep an eye on is at 137.75. This level has been identified as a pullback support, suggesting it may hold strong against a potential price dip.
If, however, the price does descend further, the next significant support level would be at 136.25. This level is recognized as an overlap support and could provide an additional safety net should the price continue to fall.
On the flip side, if the price continues its upward trajectory, the first significant resistance to be mindful of is at 139.40. This level has been marked as a swing high resistance, indicating it may serve as a significant barrier to a continued rise in price.
In light of the current bullish momentum, traders may be anticipating a climb in price from the support level to the resistance level. As with any financial market analysis, however, these scenarios are based on current conditions and may change with the evolution of the market
AUD/USD:
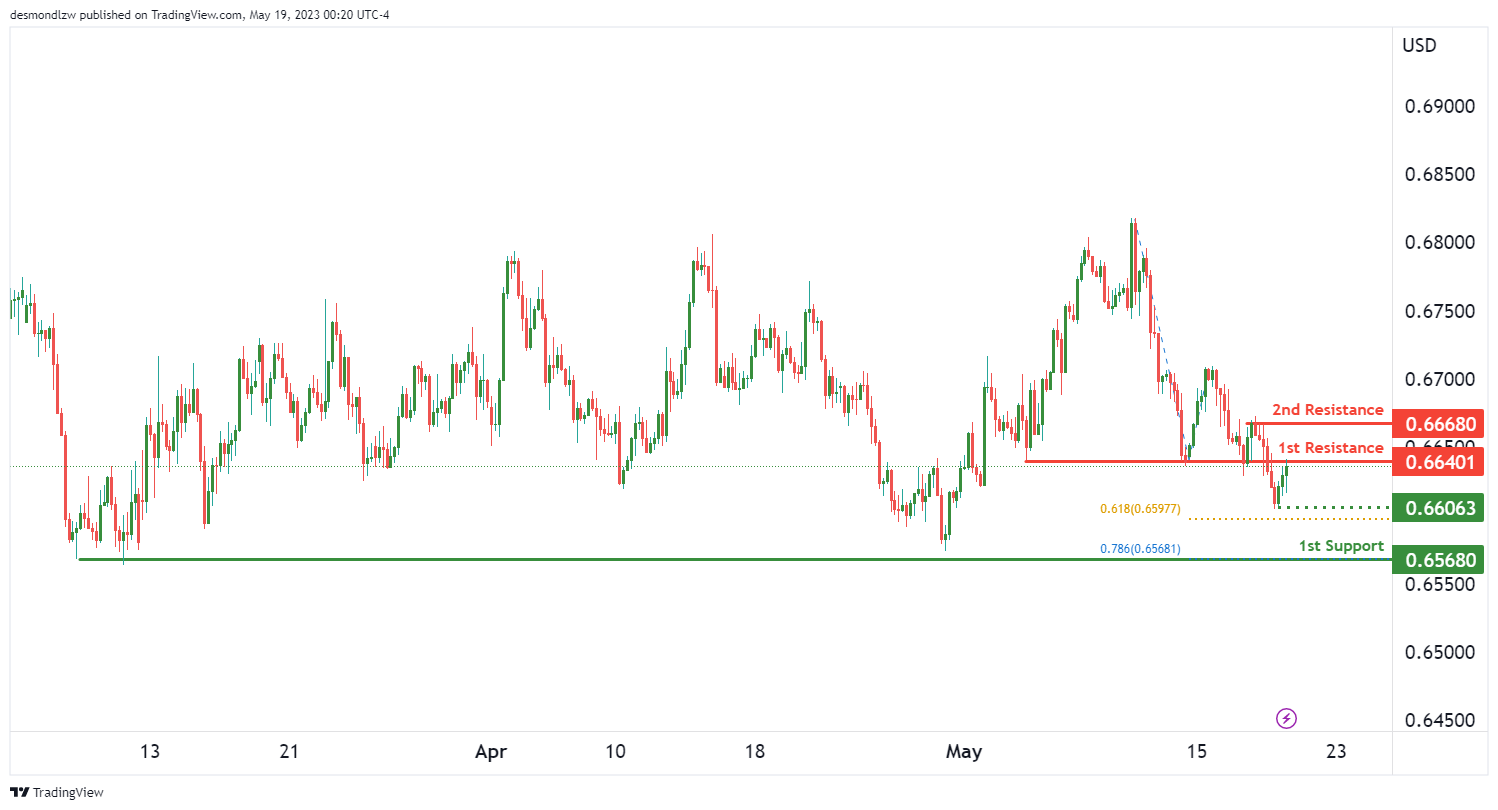
The AUD/USD pair has been exhibiting a distinct bearish momentum of late. Based on the chart analysis, we anticipate the possibility of a bearish reaction off the 1st resistance, leading to a drop down to the 1st support level.
Looking downwards, the first level of support to watch is 0.6568. This level has proven to be a multi-swing low support, adding to its credibility. Further enhancing its significance, it aligns with a 61.8% Fibonacci projection.
In the event of a steeper descent, we can look towards an intermediate support at 0.6606. This level, marked as a swing low support, aligns with a 78.6% Fibonacci projection, adding further weight to its potential role in offering price support.
Conversely, if the price was to rebound upwards, we have marked the first resistance at 0.6640. This level has acted as an overlap support in the past, indicating it could now offer resistance to a rising price.
Should the price manage to surpass the 1st resistance, the next challenge would come at the 2nd resistance level of 0.6668. This level is a multi-swing high resistance and is anticipated to offer a substantial barrier to further price increases.
NZD/USD
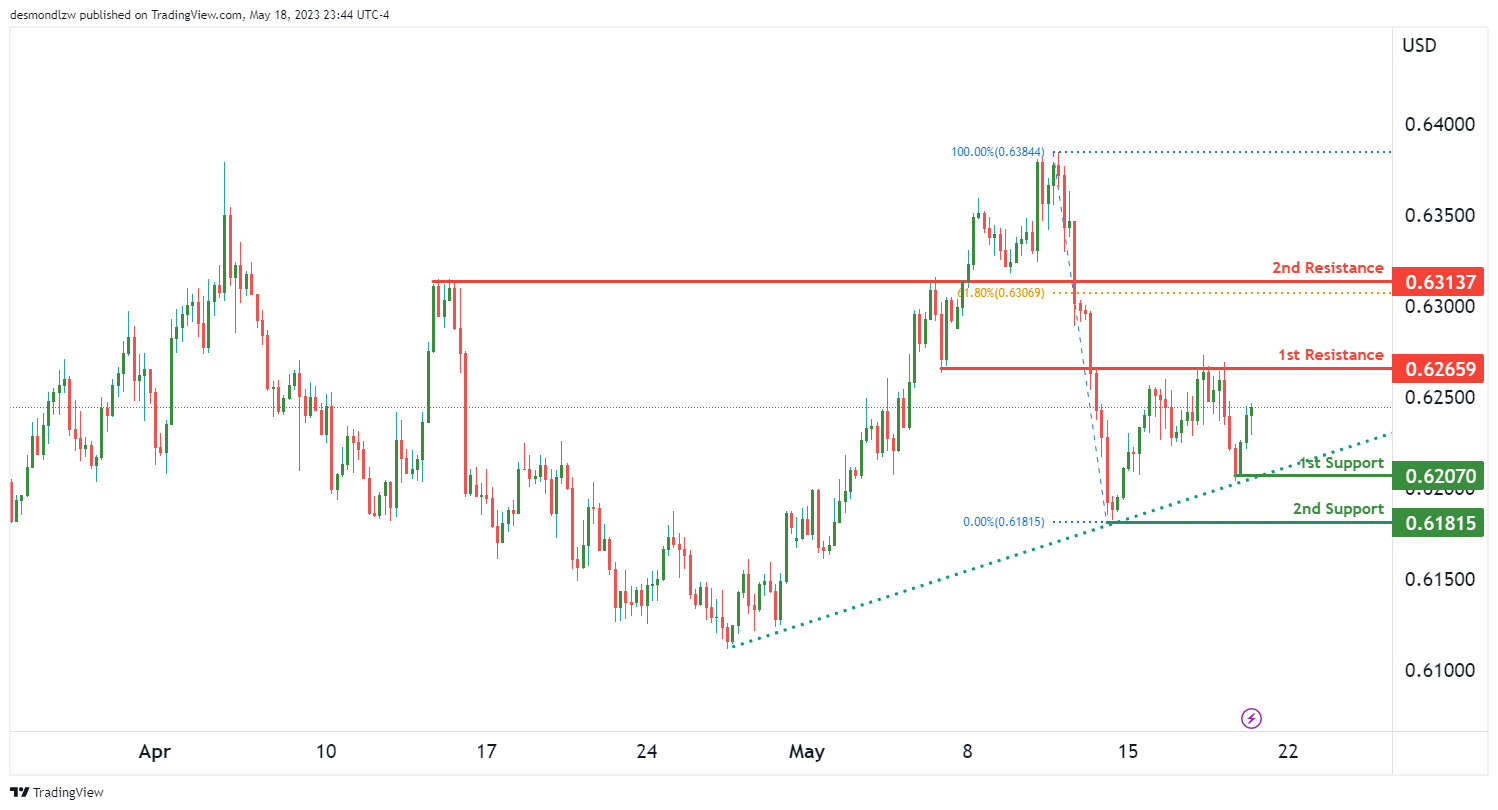
The NZD/USD pair is currently displaying a bullish momentum on the chart. This momentum is largely due to the price positioning itself above a major ascending trend line, which suggests the potential for further bullish momentum.
In the foreseeable future, there could potentially be a bullish continuation towards the 1st resistance level.
In terms of downward possibilities, the 1st support level lies at 0.6207. This point has been identified as a swing low support, and could provide a solid base should there be a temporary downturn in the upward trend.
Should the price fall below the 1st support, it could seek solace at the 2nd support level of 0.6181. This level, recognized as a swing low support, could serve as a safety net for further price drops.
On the upside, the 1st resistance stands at 0.6265. This level, noted as an overlap resistance, could potentially limit upward movement in price.
If the price manages to break through the 1st resistance, the next significant level would be the 2nd resistance at 0.6313. Not only does this level serve as a pullback resistance, it also lines up with a 61.8% Fibonacci retracement, giving it added importance.
USD/CAD:
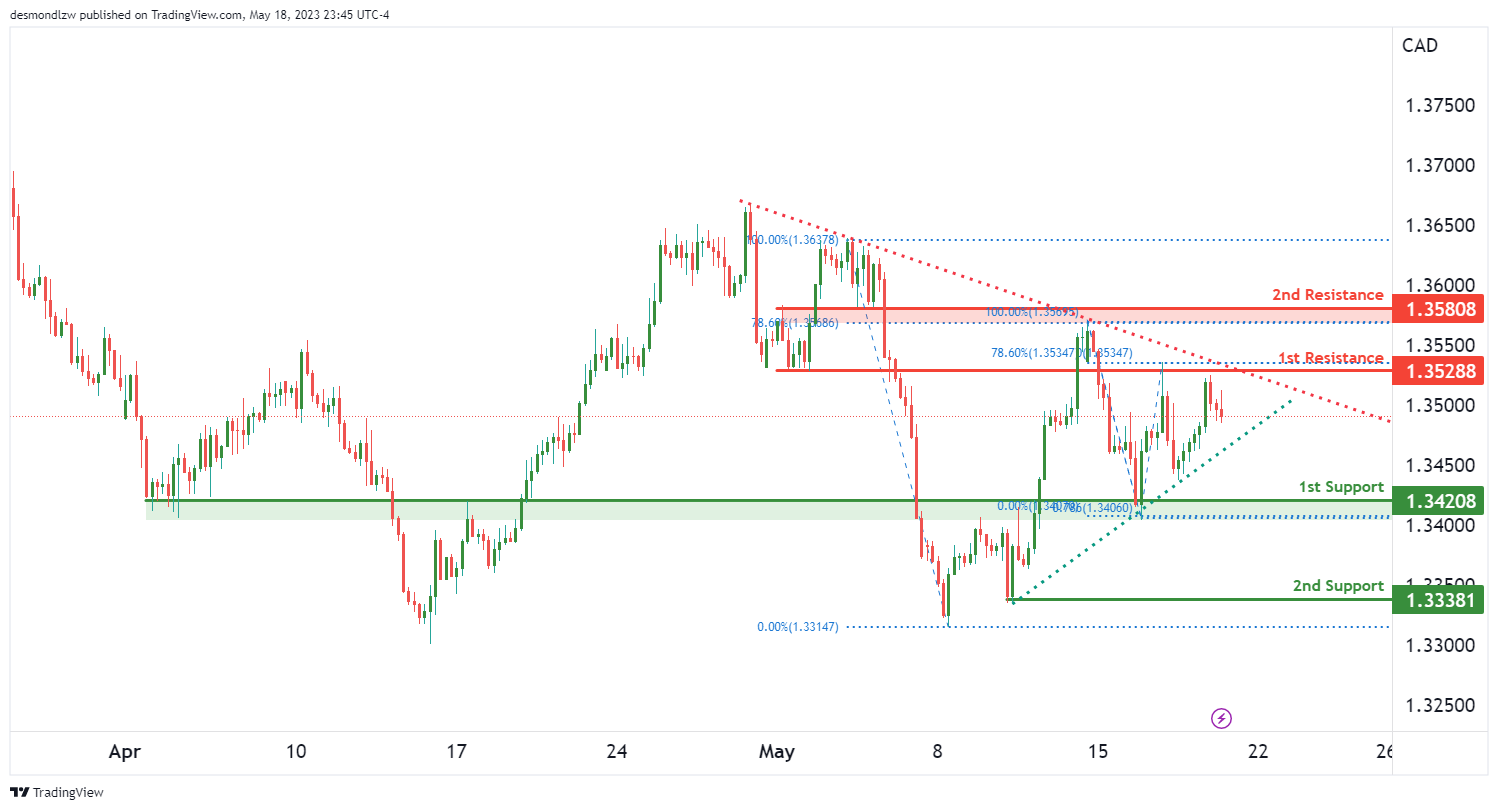
Currently, the USD/CAD pair is exhibiting a bearish momentum on the chart. In light of this, we could potentially expect a bearish continuation towards the 1st support level.
Examining the lower side, the 1st support is positioned at 1.3420. This point has been identified as an overlap support, a factor that could bolster its ability to curb a downward price movement.
Should the price slide beyond the 1st support, it could find a footing at the 2nd support level of 1.3338. Recognized as a swing low support, this level could serve as a safety net for further price descents.
Contrarily, if the price were to rally, the 1st resistance level stands at 1.3528. Not only does this level present as an overlap resistance, it also aligns with a 78.6% Fibonacci retracement, enhancing its potential to limit an upward price push.
If the price manages to break through the 1st resistance, the subsequent challenge would come at the 2nd resistance level of 1.3580. This level, also an overlap resistance, coincides with a 78.6% Fibonacci retracement, reinforcing its possible role as a barrier to further price ascents.
An additional feature of note in the chart is a symmetrical triangle pattern. This pattern represents a period of consolidation before the price is forced to breakout or breakdown. A break above the upper trendline of the pattern could signal a bullish breakout, while a break below the lower trendline might indicate a bearish breakdown.
DJ30:
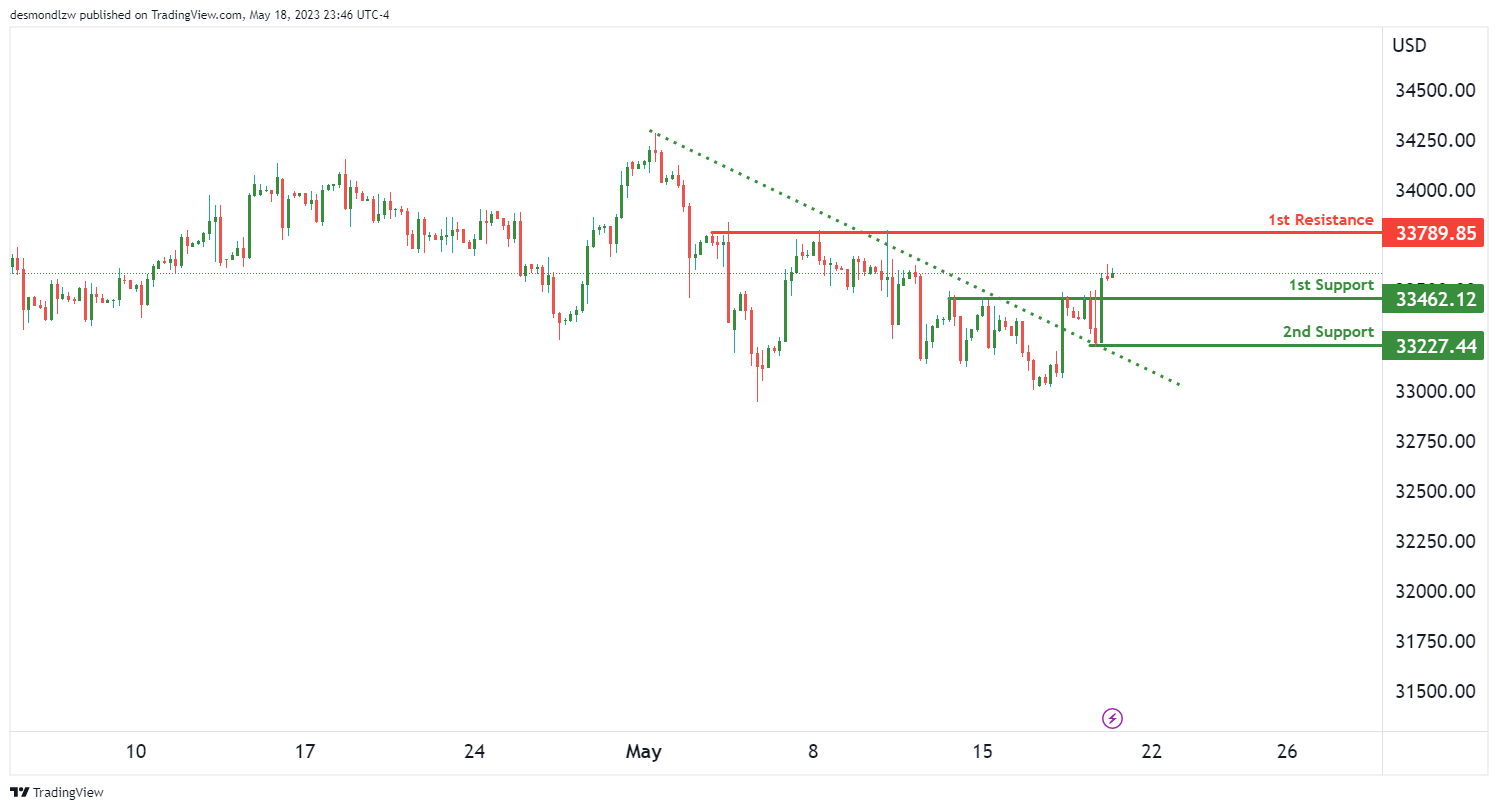
The DJ30 index chart is presently exhibiting a bullish momentum. A significant factor contributing to this momentum is that the price has broken above a descending resistance line, triggering a potential bullish move.
Given the current momentum, we could potentially anticipate a bullish continuation towards the 1st resistance level.
On the lower side, the 1st support is positioned at 33462.12. Identified as a pullback support, this level could offer a strong base, aiding in slowing down any potential downward reversals.
Should the price fall below the 1st support, it could find a footing at the 2nd support level of 33227.44. Recognized as a swing low support, this level might act as an additional buffer against further price declines.
On the flip side, if the price continues its upward trajectory, it will encounter the 1st resistance at 33789.85. This level serves as a multi-swing high resistance, suggesting its potential to limit upward price movements.
Given the prevailing bullish momentum, traders could expect an upward movement from support to resistance. However, these are potential scenarios, not guarantees. As always, traders are advised to keep a close eye on these crucial levels and adjust their trading strategies accordingly.
GER30:
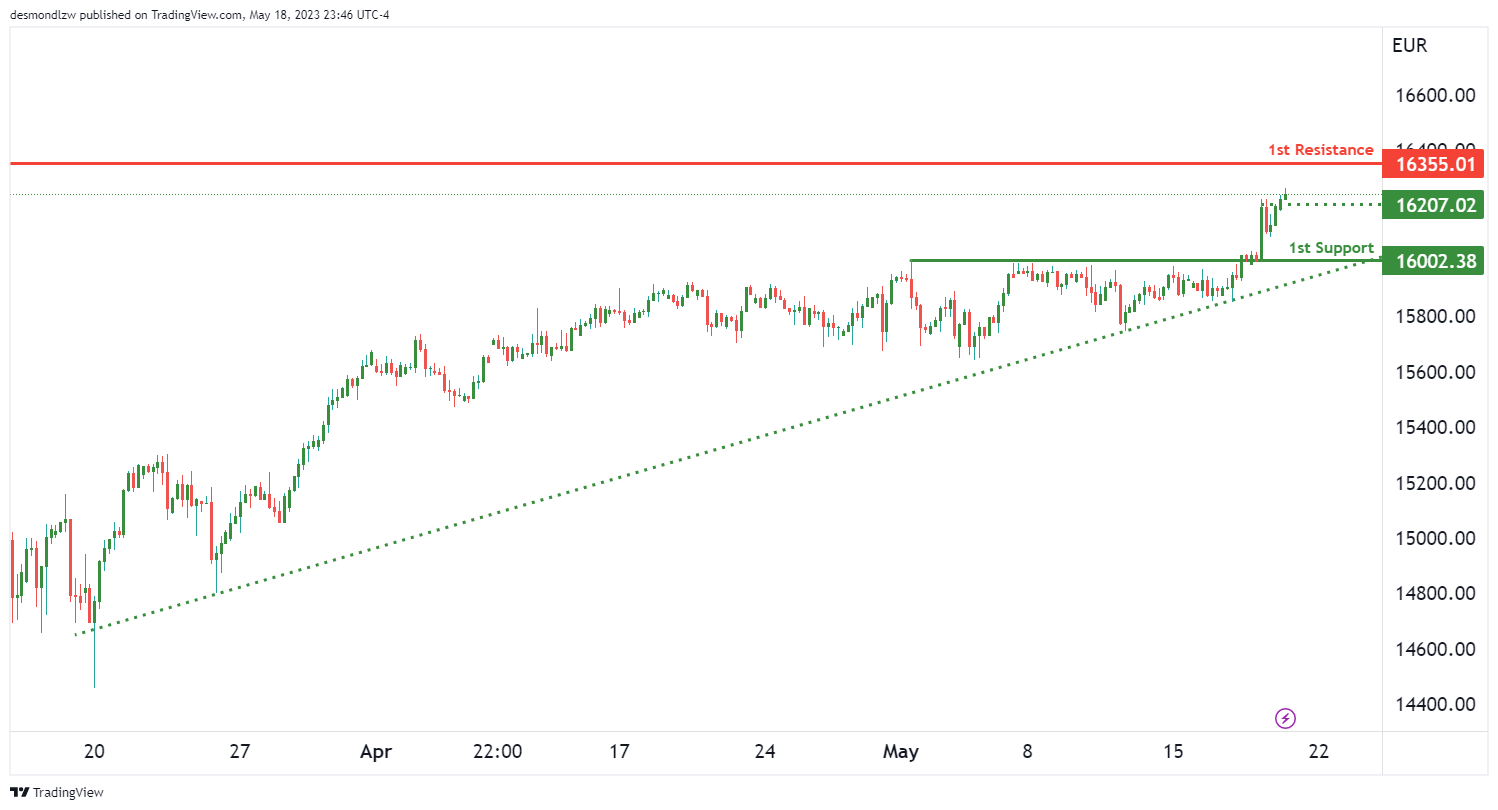
Currently, the GER30 index chart is demonstrating a bullish momentum. A significant contributing factor is that the price remains above a major ascending trend line, suggesting potential for additional bullish momentum in the future.
If this trend continues, we might anticipate a bullish continuation towards the 1st resistance level.
On the downside, the 1st support level is situated at 16002.38. Recognized as a pullback support, it could provide a robust cushion to mitigate any potential downward retracements.
An intermediate support is located at 16207.02. This level, also identified as a pullback support, might offer an additional layer of protection against potential price dips.
On the upward trajectory, the 1st resistance is positioned at 16355.01. This level, a multi-swing high resistance, could potentially limit further price ascensions.
BTC/USD:
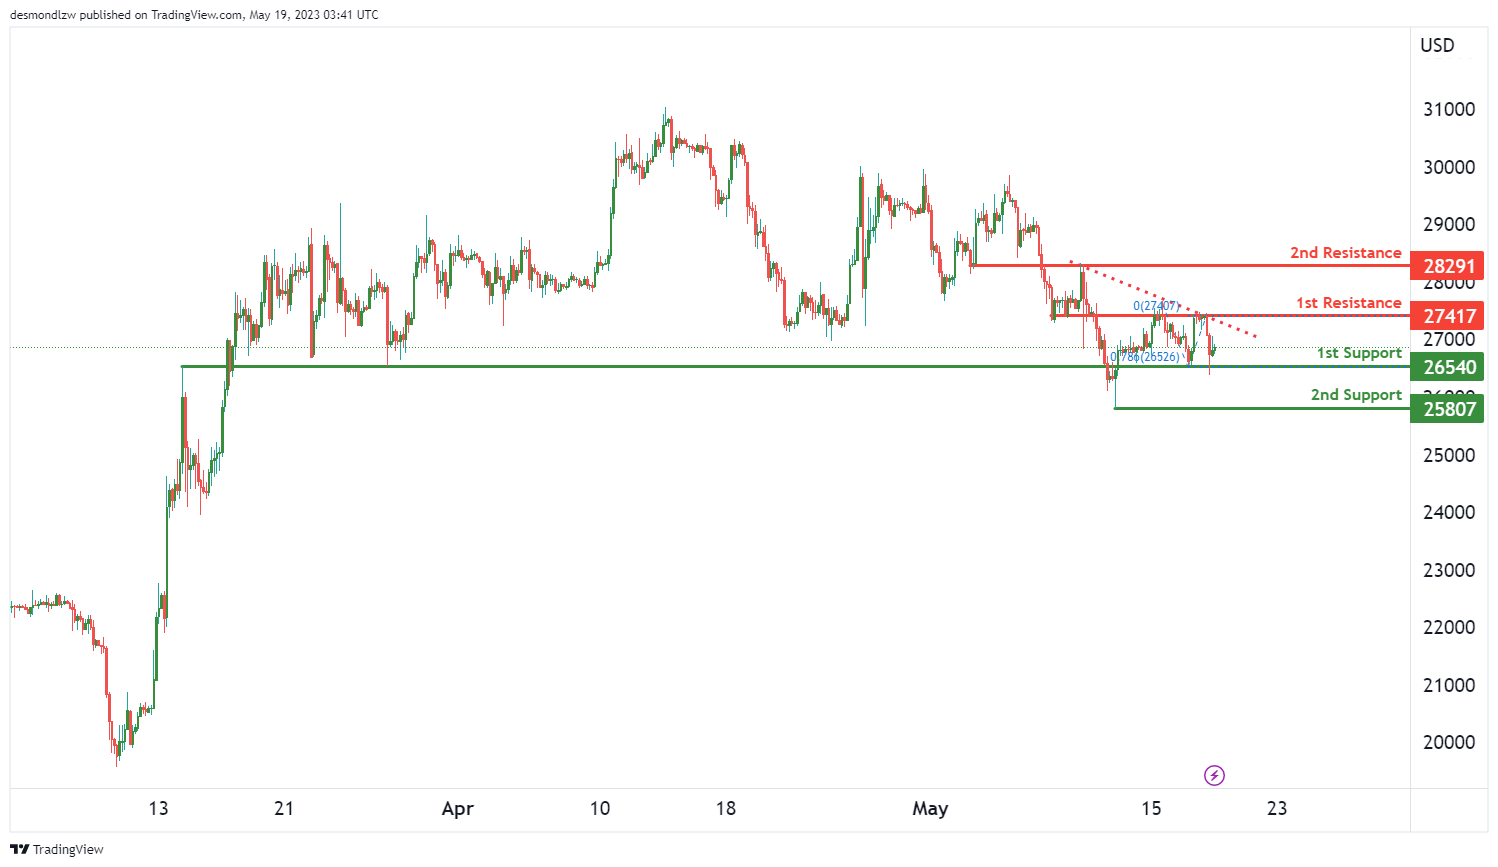
The current BTC/USD chart is signalling a bearish momentum. The key factor contributing to this is that the price lies below a major descending trend line, suggesting a bearish continuation is on the horizon.
If this trend persists, we might anticipate a bearish reaction off the 1st resistance, which could potentially push the price down to the 1st support level.
The 1st support level is found at 26540. This level, recognised as an overlap support, might serve as a solid platform to mitigate any potential bearish retracements.
Further down, the 2nd support level is identified at 25807. As a swing low support, it could provide an additional cushion against potential price drops.
On the upside, the 1st resistance is set at 27417. This overlap resistance could possibly curb further price increases.
Further up, the 2nd resistance level is at 28291. This level, also an overlap resistance, might offer additional resistance to any bullish movements.
US500
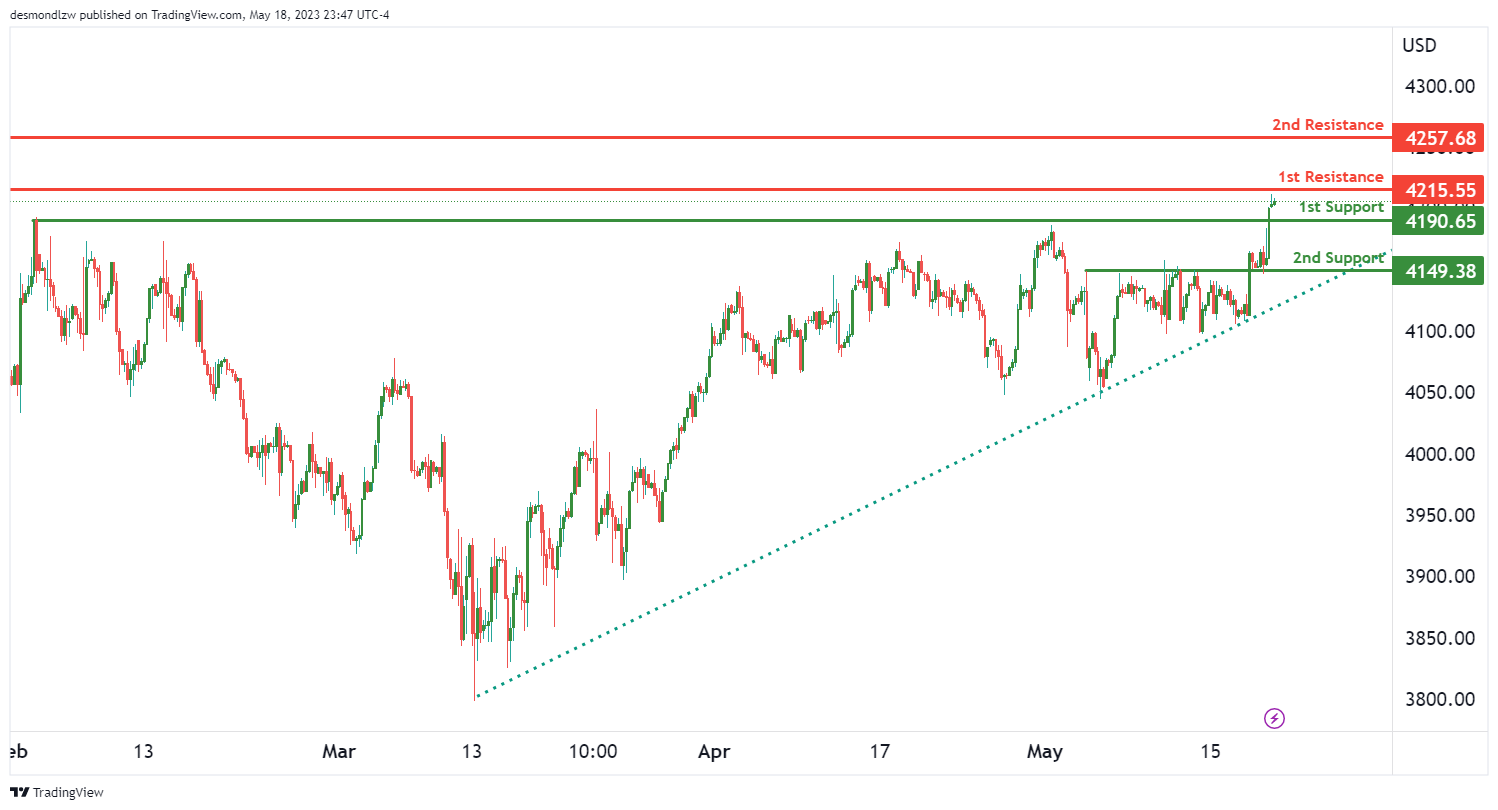
The US500 chart, a bullish momentum can be discerned. The primary factor feeding this momentum is the price position above a major ascending trend line, indicating potential continuation of this bullish trend.
In the short term, the price could potentially drop further to the 1st support level before experiencing a bounce back, leading to a rise towards the 1st resistance level.
The 1st support level is currently at 26540. This level acts as a pullback support, serving as a reliable platform to absorb potential bearish retracements.
Further below, the 2nd support level stands at 4149, identified as an overlap support. This could provide an additional buffer against potential price decreases.
On the upside, the 1st resistance is found at 4126. This swing high resistance could act as a cap to further bullish advancements.
Moreover, the 2nd resistance level is set at 4258, also a swing high resistance, potentially offering additional resistance against bullish movements.
ETH/USD:
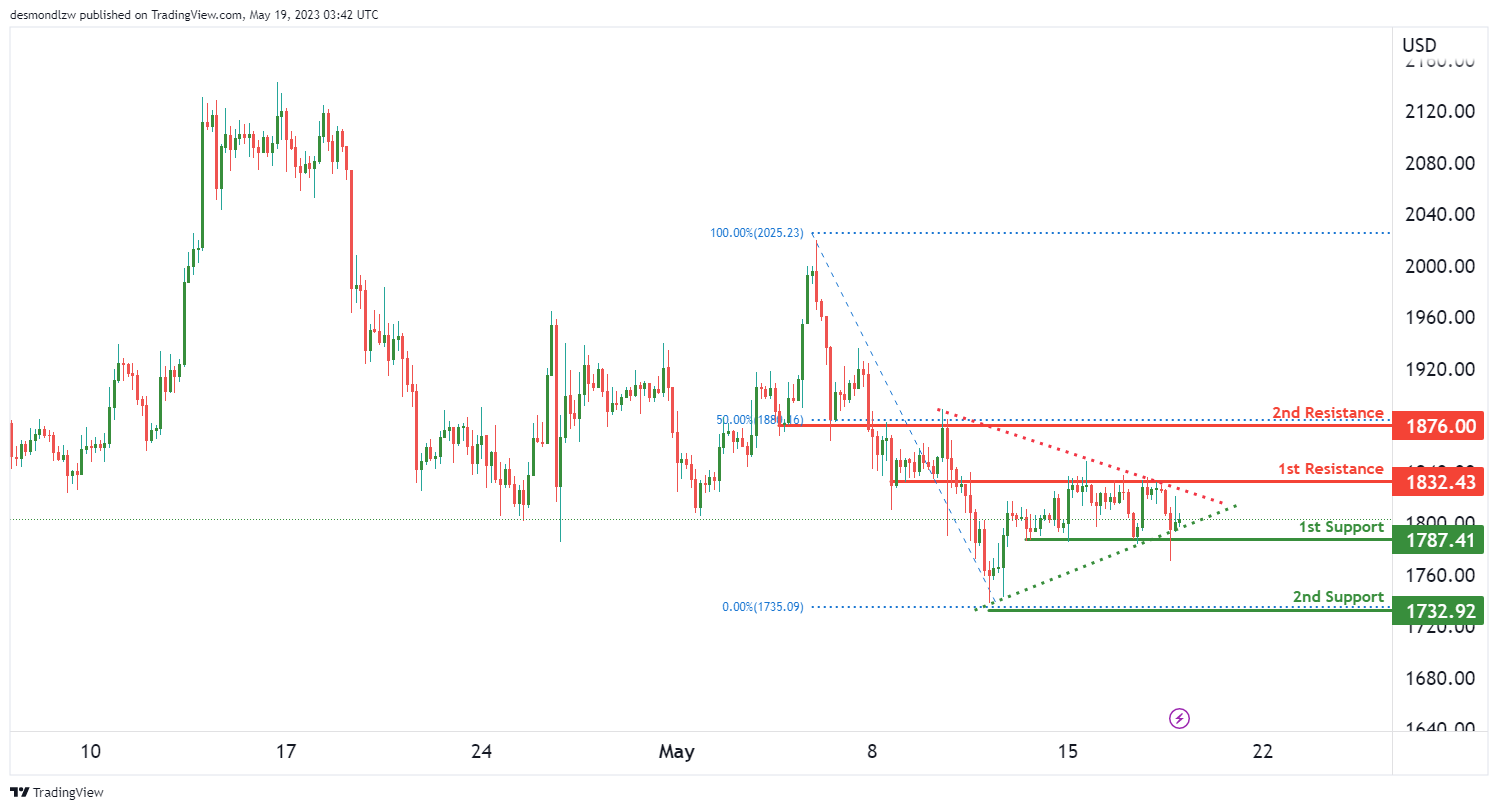
The ETH/USD chart, we’re currently witnessing a neutral trend. The price has been oscillating without a clear direction and could potentially fluctuate between the 1st resistance and 1st support level, indicating a period of indecision in the market.
The 1st support level is marked at 1787.41, serving as a multi-swing low support, which means it has been tested multiple times, enhancing its reliability as a robust buffer against bearish movements.
Below this, the 2nd support level at 1732.92 acts as an overlap support. It is another essential level that could prevent further price declines.
On the flip side, the 1st resistance level is situated at 1832.43. This overlap resistance could provide a ceiling to any immediate bullish surge.
The 2nd resistance level is slightly higher, at 1876.00. It’s noteworthy because it’s an overlap resistance as well as a 50% Fibonacci retracement level, indicating a potential area where the price might face difficulty in breaking through.
Interestingly, the price action is currently forming a symmetrical triangle chart pattern, often associated with a period of consolidation before a breakout or breakdown occurs. This pattern could lead to a bullish breakout if the price breaks above the upper trendline, or a bearish breakdown if the price dips below the lower trendline.
WTI/USD:
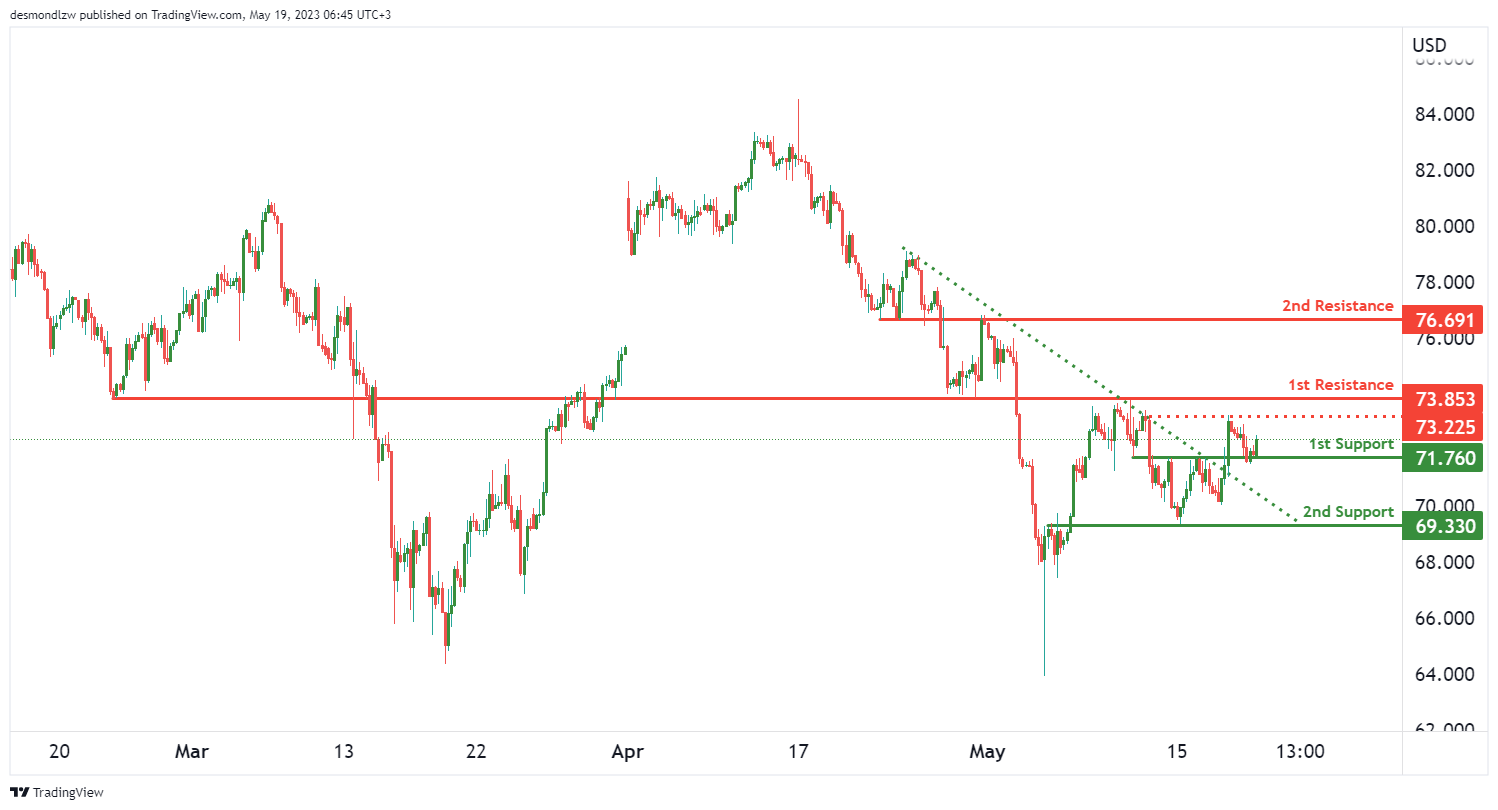
The WTI chart, we observe a bullish momentum. A key factor contributing to this positive trend is the price’s break above a descending resistance line, triggering a potential bullish move.
The current situation suggests that there could potentially be a bullish continuation towards the 1st resistance.
The 1st support level is established at 71.76, which is considered an overlap support. This level represents a price at which the market has previously shown significant buying interest, and it may serve as a critical barrier against a downward price movement.
Further down, we have the 2nd support level at 69.33, another overlap support. This level marks a further zone where buyers might show up in force to prevent a deeper price decline.
On the resistance side, the 1st resistance level is set at 73.85. This overlap resistance could potentially slow down or halt any immediate bullish advances.
Higher still, we have the 2nd resistance level at 76.69. This level is also an overlap resistance and could serve as an obstacle to further bullish momentum.
In between the two primary resistance levels, we find the intermediate resistance at 73.22. This multi-swing high resistance could provide some temporary resistance to the price during its upward journey.
XAU/USD (GOLD):
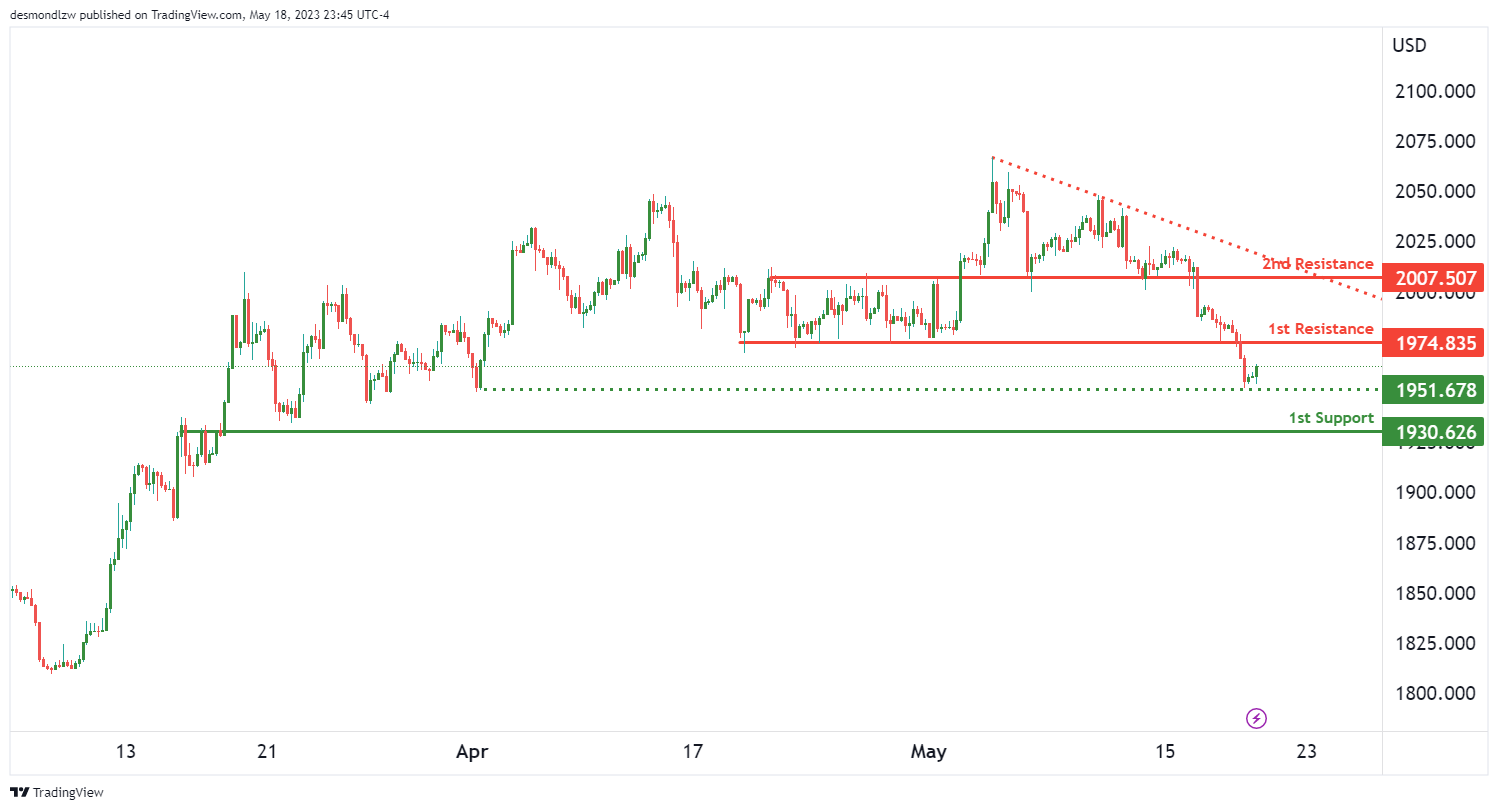
The XAU/USD chart indicates a bearish momentum. The price positioning below a major descending trend line suggests that bearish momentum is in play and could potentially lead to further decline.
Under this bearish outlook, we could witness a bearish reaction off the 1st resistance level, causing the price to drop to the 1st support level.
The 1st support level is found at 1930.62, classified as an overlap support. This level is significant as it has previously shown a substantial buyer response that could potentially halt or slow down any further downward momentum.
Above this, there’s the intermediate support level at 1951.67, distinguished as a multi-swing low support. This level could serve as a temporary halt to a potential decline, possibly attracting buying interest.
In terms of resistance, the 1st resistance level is at 1974.83, which is considered a pullback resistance. This level represents a barrier that the price may struggle to surpass in its current trajectory.
Higher up, we find the 2nd resistance level at 2007.50, also viewed as a pullback resistance. This level could provide further hindrance to any possible short-term bullish attempts.
New Zealand exports rise 10% yoy with China leading, EU tops 12% imports growth
New Zealand's trade balance in April reported a surplus of NZD 427m, defying expected deficit of NZD -1310m. Both imports and exports experienced significant year-on-year growth, with exports rising 10% yoy (NZD 641m) to NZD 6.8B and imports increasing 12% yoy (NZD 683m) to NZD 6.4B.
In the export sector, notable growth was observed in shipments to China, Australia, and the US. Specifically, total exports to China rose by NZD 259m (16% yoy), to Australia by NZD 67m (10% yoy), and to the US by NZD 109m (17% yoy). However, exports experienced a slight downturn to the EU, falling by NZD -2.2m (-0.4% yoy), and a more substantial drop to Japan, decreasing by NZD -53m (-12% yoy).
On the import side, the European Union led the surge with total imports up by NZD 108m (13% yoy). Imports from the US also experienced growth, with an increase of NZD 46m (7.6% yoy). Conversely, imports from China, Australia, and South Korea all fell, with decreases of NZD -29m (-2.4% yoy), NZD -37m (-5.1% yoy), and NZD -28m (-8.3% yoy) respectively.
Japan CPI core rose back to 3.5% in April, core-core hit 42-yr high
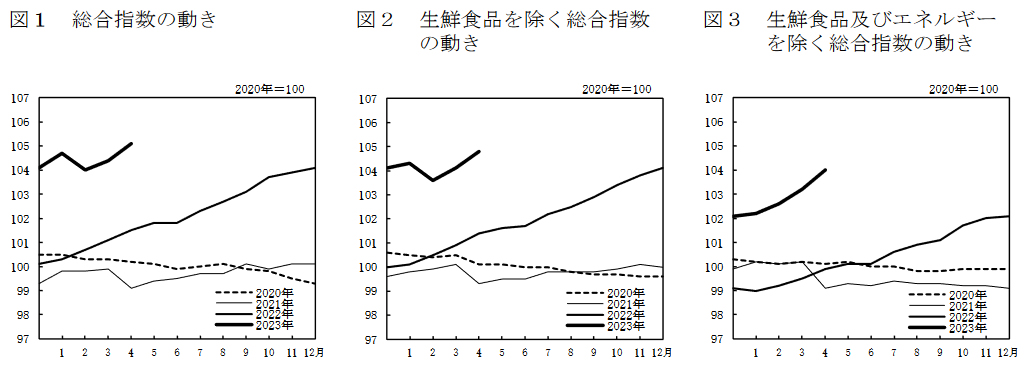
April saw Japanese consumer prices accelerating, with CPI accelerated from 3.2% yoy to 3.5% yoy. That put a halt to the slowdown of headline inflation from 4.3% in January.
Even more significantly, core CPI (which excludes fresh food) rose from 3.1% yoy to 3.4%. This metric has been above BoJ's 2% target for an uninterrupted 13 months, signifying persistent inflationary pressure.
In the realm of core-core CPI, which excludes both fresh food and energy, the increase is even starker, rising from 3.8% yoy to 4.1%. This figure is the highest it has been since September 1981, marking a nearly 42-year peak.
Looking at some details, services inflation increased from 1.5% yoy to 1.7%, the highest in 28 years since 1995 (excluding the impact of sales tax hikes). Durable goods prices soared 9.8% yoy, and food prices accelerated from 8.2% yoy to 9.0%, hitting the highest level in almost 47 years since 1976. Energy prices, however, bucked the trend with a yoy decrease of -4.4% yoy.
Despite these inflationary pressures, there is no clear indication that BoJ is preparing to exit its ultra-loose monetary policy. The bank projected CPI to average 1.8% and core CPI at 2.5% for the current fiscal year, but given the current data, it is likely that these projections will be revised upward in the next release.
USD/JPY Regains Bullish Momentum Above 137.50
Key Highlights
- USD/JPY started a fresh increase above the 137.00 resistance.
- It broke many hurdles near 137.50 and 13780 on the 4-hour chart.
- EUR/USD turned red and declined below 1.0800.
- Gold price struggled to stay above the key $1,975 support zone.
USD/JPY Technical Analysis
The US Dollar started a decent increase from the 133.50 support zone against the Japanese Yen. USD/JPY climbed above the 136.00 and 137.00 resistance levels.
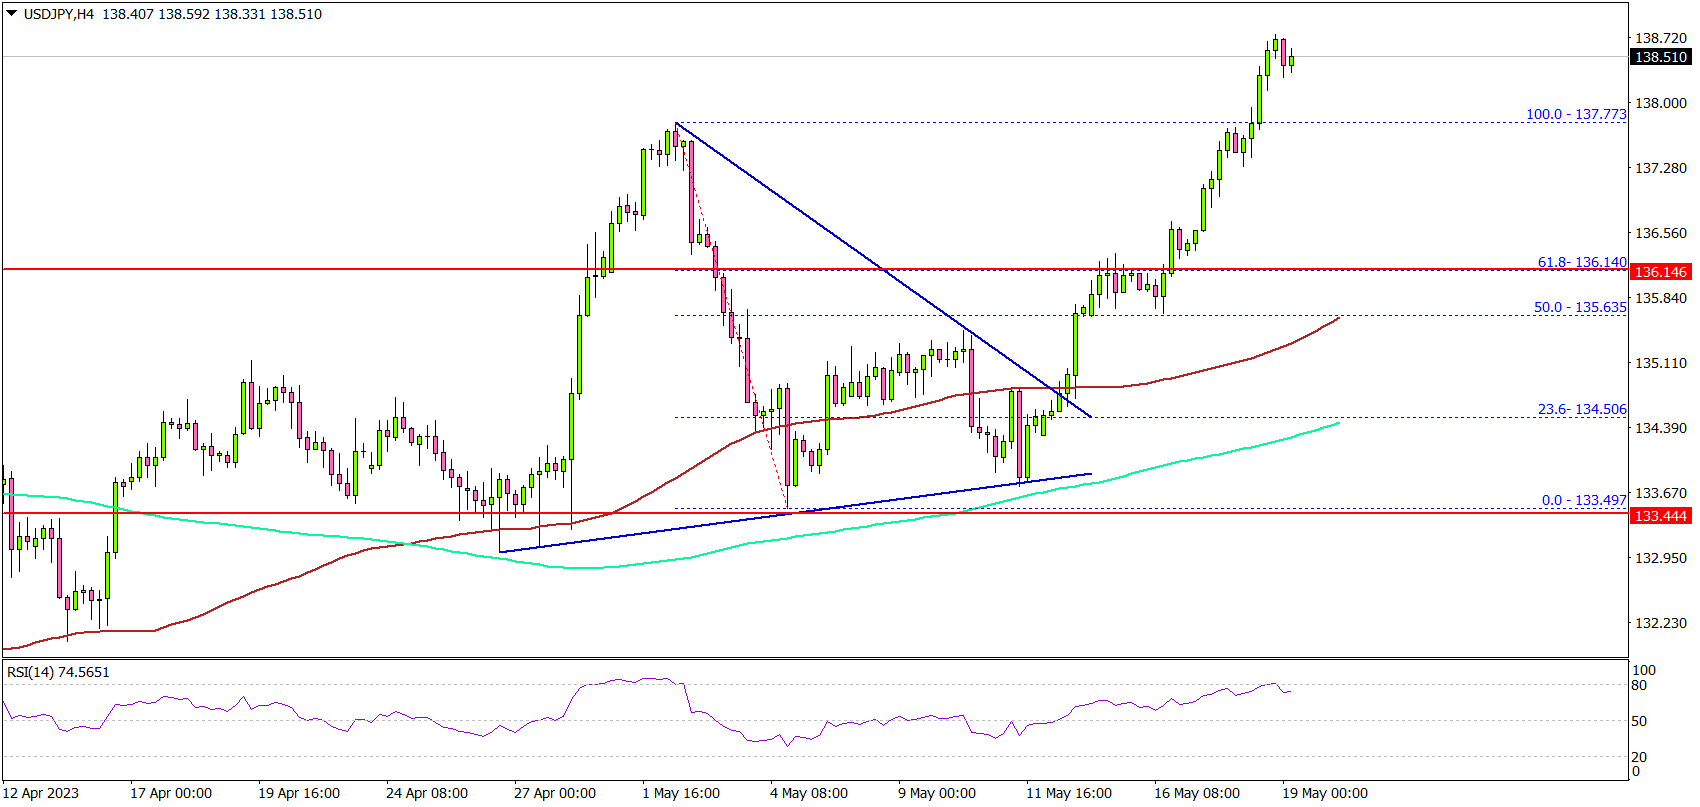
Looking at the 4-hour chart, the pair settled well above the 137.00 level, the 100 simple moving average (red, 4 hours), and the 200 simple moving average (green, 4 hours).
There was a clear move above the 137.80 resistance zone and the last swing high at 137.77. If the bulls remain in action, the pair could rise toward the 138.80 level. The next major resistance is near 139.20, above which the pair could rise toward the 140.00 level.
On the downside, the pair might find bids near 137.50. The next major support is near the 137.20 level. If there is a downside break below the 137.20 level, the pair could test the 136.50 support level. The next major support sits near the 136.00 level.
Looking at EUR/USD, the pair gained bearish momentum and traded below the 1.0800 level. If the bears remain in action, the pair could test 1.0680.
Economic Releases
- Canadian Retail Sales for March 2023 (MoM) – Forecast -1.4%, versus -0.2% previous.