Sample Category Title
USD/CAD Daily Outlook
Daily Pivots: (S1) 1.3416; (P) 1.3476; (R1) 1.3515; More....
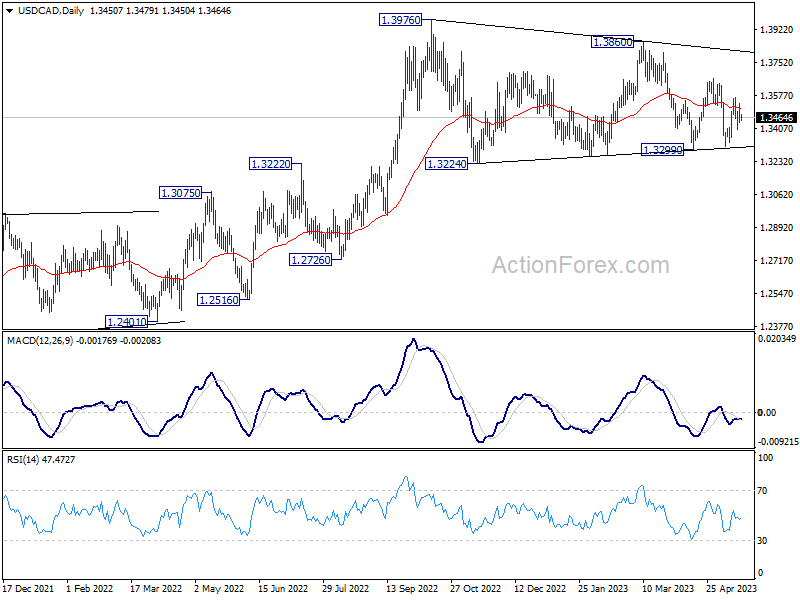
Outlook in USD/CHF remains unchanged as range trading continues. Intraday bias stays neutral for the moment. Overall, the pair is seen as extending the triangle consolidation pattern from 1.3976. Above 1.3566 will resume the rebound towards 1.3666 resistance and then 1.3860. However, firm break of 1.3313 support will invalidate this view and indicate that deeper correction is underway.
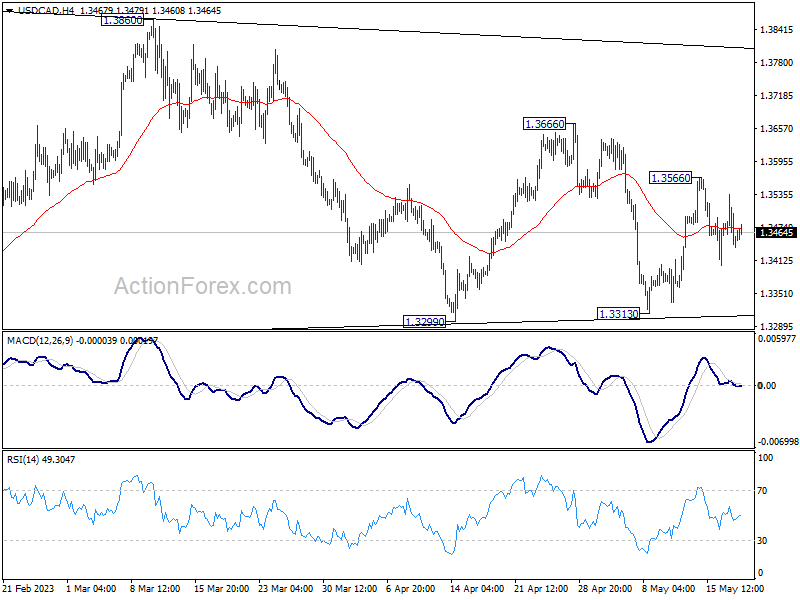
In the bigger picture, as long as 55 W EMA (now at 1.3321) holds, up trend from 1.2005 (2021 low) is still in favor to resume through 1.3976 at a later stage. However, sustained trading below the EMA and 38.2% retracement of 1.2005 to 1.3976 at 1.3233 will raise the chance of bearish reversal. Deeper should then be seen to 61.8% retracement at 1.2758 next.
As Dollar Attempts a Comeback, Are Markets Wrong About Fed?
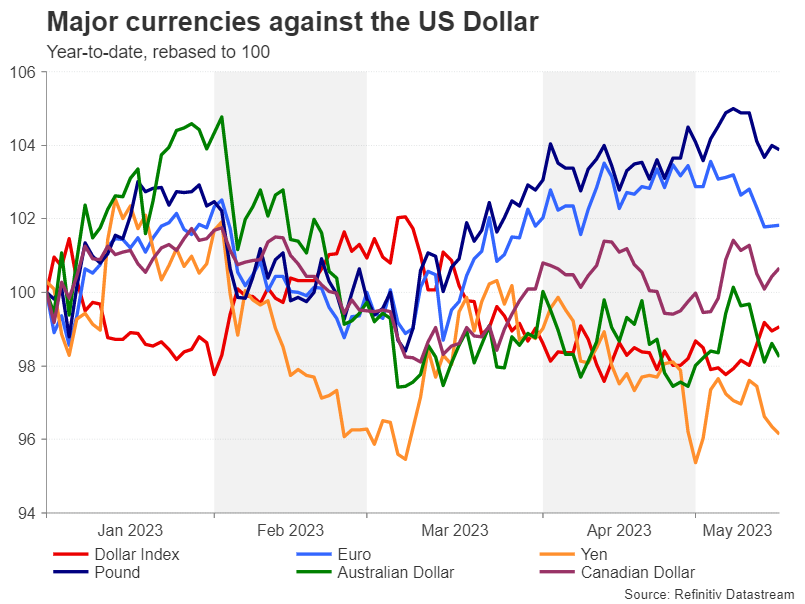
The US dollar is showing signs of life again, notching up its best week since September of last year and reaching a five-week high against the euro. From a technical perspective, the dollar index – a gauge measuring the US currency against a basket of six peers – has a few more hurdles to climb before it can claim to have emerged from its bearish phase, while from a fundamentals standpoint, the Federal Reserve is getting closer to hitting the pause button on its rate hiking cycle. So, is this latest bounce a false signal or are the groundworks being laid for a trend reversal?
The elusive Fed pivot
Markets started betting on a Fed pause long before policymakers even hinted that they were approaching the end of their tightening cycle. Speculation about the timing of a Fed pivot dominated the market theme in late 2022 and has reached fever pitch in 2023. Some might argue that the Fed has already pivoted, having downshifted twice to smaller increment rate hikes. The next step therefore might well be the long-awaited pause.
The biggest clue to wrapping up the rate increases came at the May policy decision when the clause “The Committee anticipates that some additional policy firming may be appropriate” was removed from the FOMC statement. However, this wasn’t quite the pause signal that impatient traders had been hoping for. Whilst opening one door, Chair Jerome Powell refused to shut another, keeping both a hike and pause options firmly on the table.
The message from other policymakers had similarly been that the Fed is entirely data dependent. But in the last few days, things started to take an interesting twist.
A hawkish pause may not be what markets asked for
Several policymakers decided to raise the stakes by expressing their dissatisfaction at the slow progress in core inflation coming down. Fed governors Michelle Bowman and Philip Jefferson, who has been nominated by President Biden to become the next Vice Chair, were among those casting doubt on the prospect of an imminent end to the tightening process. But others, like the Atlanta Fed’s Raphael Bostic, flagged an inclination to pause.
The problem for the dollar is that although it has gained some ground from the renewed hawkish tone, Fed fund futures have barely responded. Investors are currently pricing in a slightly less than 20% probability of a 25-bps rate rise at the June meeting and expect the Fed to deliver at least two cuts of the same size by December.
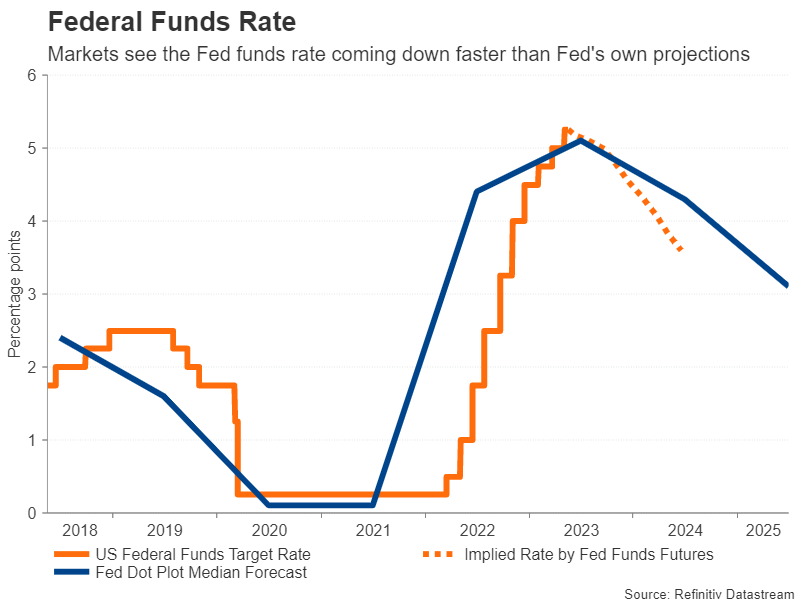
Such misalignments between the market view and the Fed’s rarely ends well and investors should be worried. Even if the Fed does pause in June, one thing is clear – policymakers will be doing so with a bias to tighten again should inflation remain sticky. This then almost certainly rules out a rate reduction this year. So why are investors convinced that the Fed will cut rates?
Is the US headed for a credit crunch?
Markets initially started to price in a lower Fed funds rate over fears that the central bank will overtighten and induce a recession. But more recently, it is concerns about America’s fragile banking system that is driving those fears rather than overtightening. There is some evidence to suggest that credit conditions have tightened significantly following the turmoil in March that led to the failure of several regional banks.
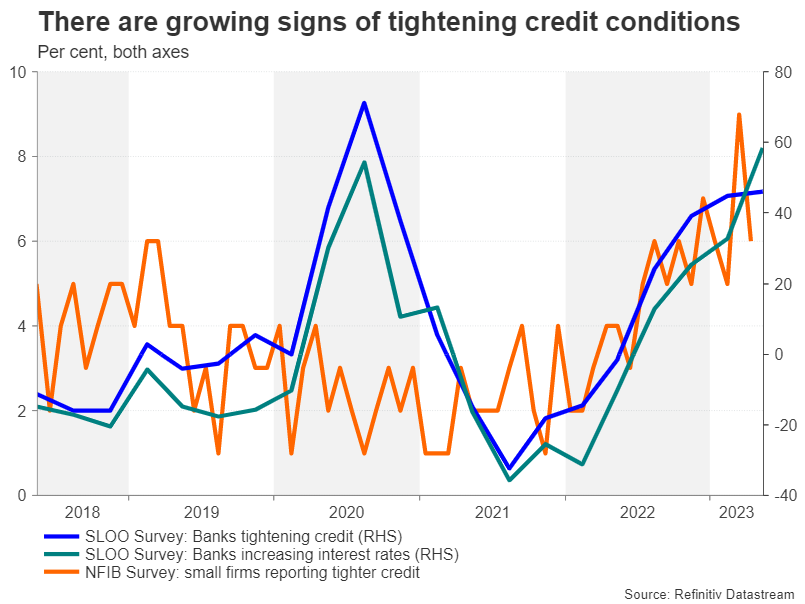
With the Fed far from being ready to switch away from restrictive policy, investors are anticipating the worst. There is one notable flaw to this reasoning as it assumes that the Fed will start slashing rates as soon as the US economy hits recession regardless of whether or not inflation has fallen fast enough by then. Yet, all the indications are that Powell is willing to sacrifice short-term pain to get inflation back to the Fed’s 2% goal as quickly as possible.
Safe haven boost
This also doesn’t explain why dollar bulls have been reawakened. Although it is true that the dollar has been attracting support lately from a mixed run of data, which have been inconclusive when it comes to how fast the economy, and the labour market specifically, is cooling, the main factor pushing it higher has been safe-haven flows.
Fresh concerns about China’s post-pandemic recovery and a real possibility of a recession in Germany have alarmed investors in recent days, while the ongoing stalemate over a bi-partisan deal in the US Congress to raise the debt ceiling has also contributed to the increased risk aversion over the past week.
But none of these are solid foundations for a bullish reversal in the dollar, hence, it is too early to draw any conclusions, even as the dollar index is flirting with its 50-day moving average.
The problem of sticky inflation
Much of the dollar’s slide this year had been based on expectations of a transatlantic divergence in monetary policy, with the European Central Bank and Bank of England raising rates into the summer and the Fed’s May hike being the last.
But investors have seemingly gotten carried away by the improving inflation picture. As impressive as the drop in America’s headline CPI rate has been, underlying inflation remains elevated. The decline in both the CPI and PCE core measures appears to have stalled, and this hasn’t gone unnoticed at the Fed. There is also the continued resilience of the jobs market that the Fed just can’t get its head around.
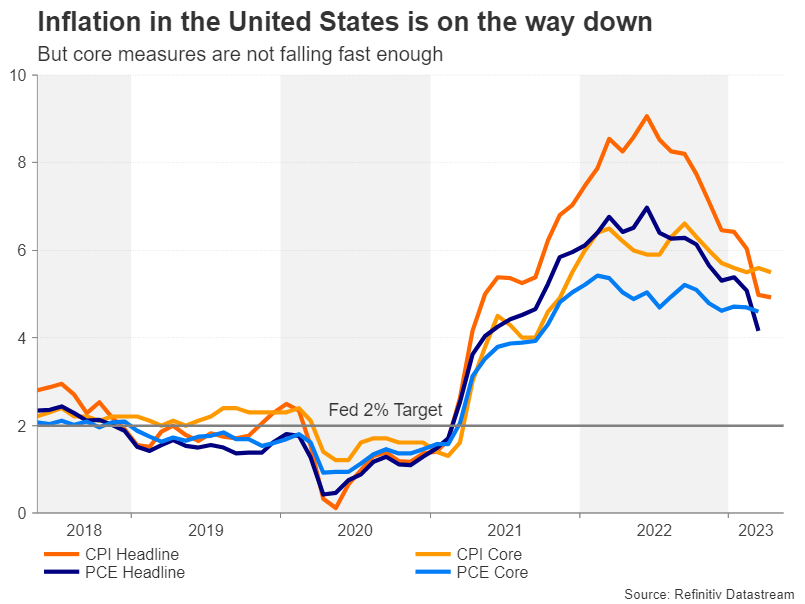
Policymakers will want to see a lot more progress on both fronts before they can even start thinking about cutting rates. The question now is, what’s it going to take for traders to reassess their rate cut bets, or is it the Fed that will have to align its dot plot with the market-implied path?
The Fed vs the markets
After all, the risk of a credit crunch has not completely dissipated and it may take months for the fallout from the banking crisis to fully unravel, in which case, rate cuts would not be so implausible. Unfortunately, the scenario where the Fed isn’t forced to lower rates isn’t particularly appealing either.
Whereas at the start of the tightening campaign, it was the markets telling the Fed that the price hikes were not transitory, the tables have turned and it is investors who now seem to be ignoring the danger that high inflation is proving to be a lot stickier than anticipated.
If core inflation stays stubbornly high over the next few months, there would be nothing stopping the Fed from resuming its rate increases even after a pause, raising the prospect of a prolonged period of stagflation.
US dollar: more downside than upside?
For the dollar, given that the Fed has already been more aggressive than other central banks, some limited upside is probably the best that the bulls can hope for in the event that a credit squeeze does not materialize and the Fed is able to keep rates higher for longer. Such an outcome could see the dollar index revisiting the highs from March right before the banking episode to test its 200-day moving average.
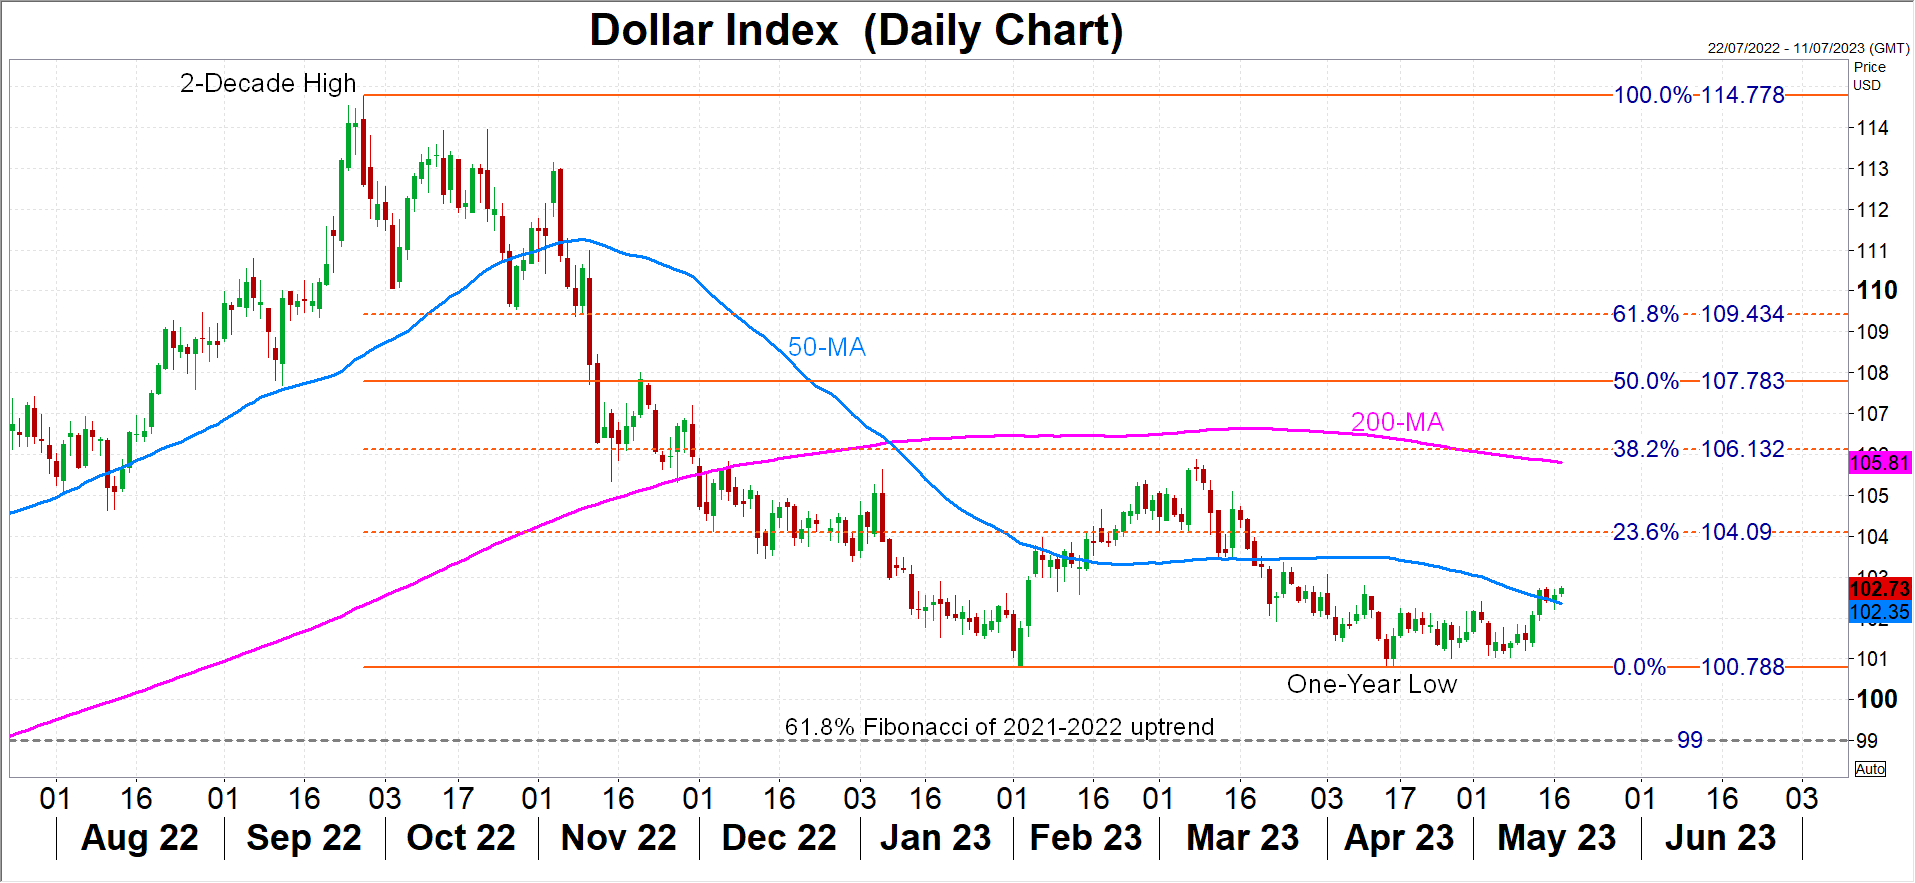
However, the scale of any downside moves may be a little more difficult to predict. As things stand, the uncertainty around the outlook for the global economy and Fed policy is putting a floor under the greenback. But should some of the clouds start to lift and the monetary divergence paths become clearer, with the Fed pivoting before the ECB and the Bank of Japan only just starting to tighten policy, the dollar could suffer more substantial losses.
But even then, the road to all the way down to the January 2021 trough is a very long stretch for the dollar index. The 61.8% Fibonacci retracement of the uptrend that began from this low and ended at a two-decade high in September 2022 may be a more realistic target for the bears.
Is the Downtrend Over for USDCHF?
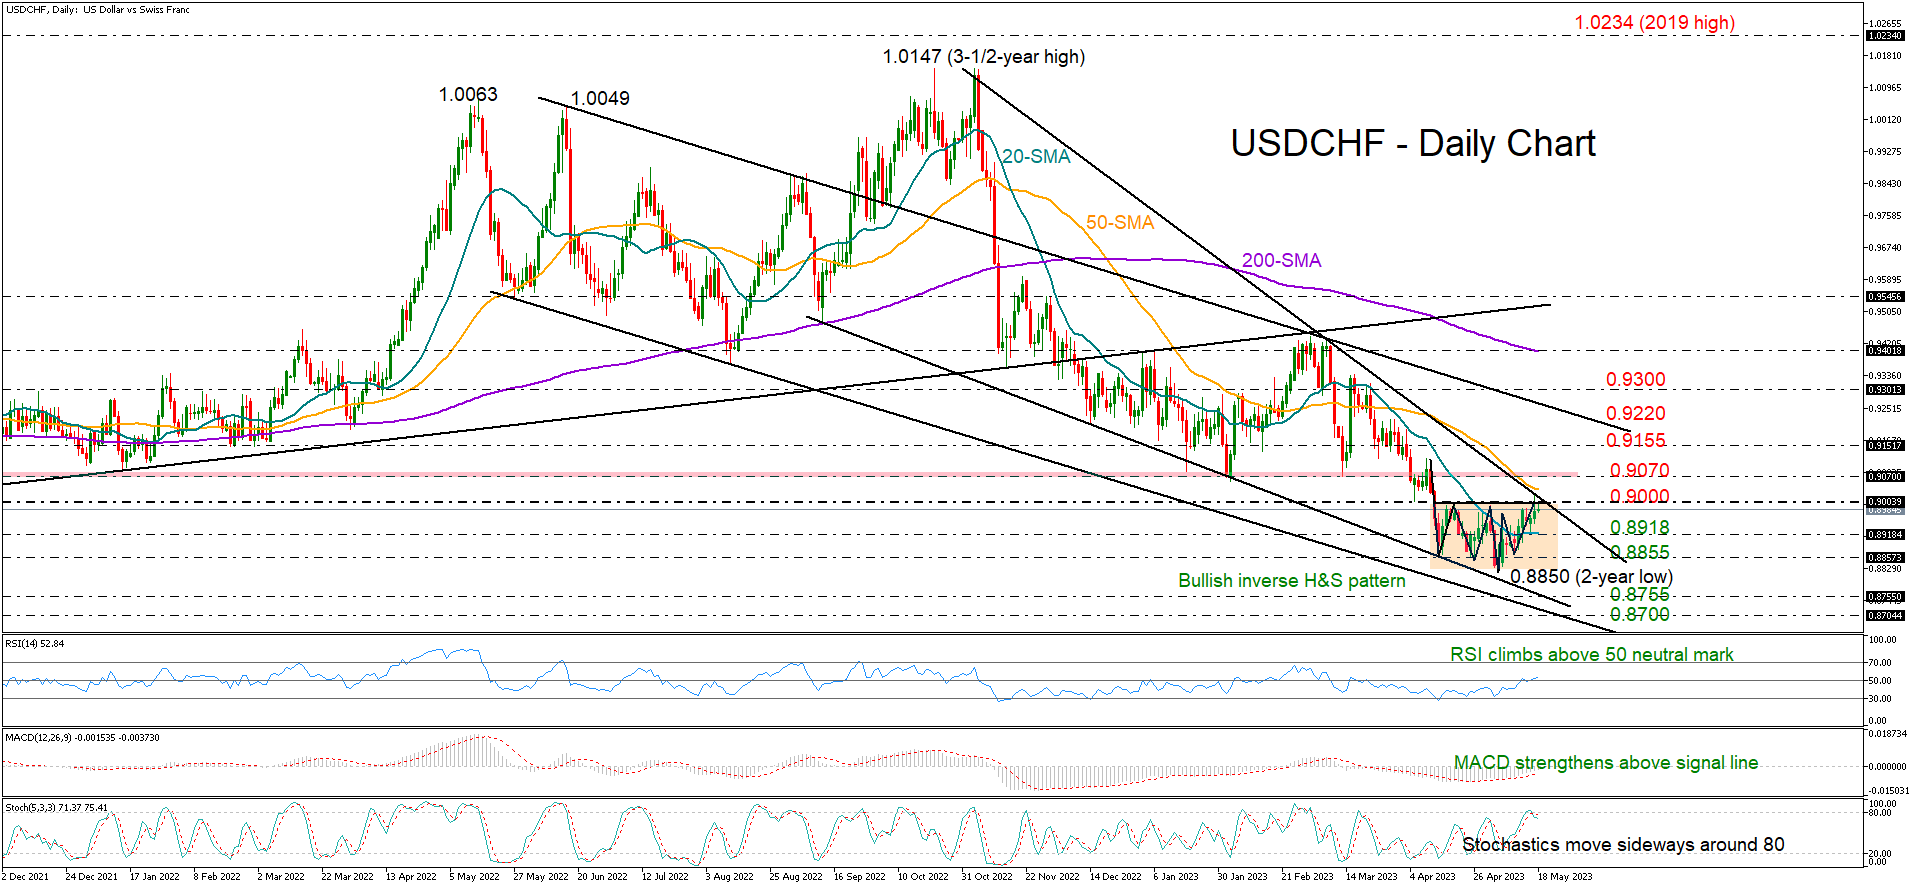
USDCHF has been building a base in the form of an inverse head and shoulders (H&S) pattern around a two-year low of 0.8850 over the past month, boosting hopes for a bullish trend reversal.
Traders are currently waiting to see whether the pair will find enough buyers to confirm the bullish structure above the 0.9000 neckline, and more importantly, mark a new higher high above the crucial 2023 constraining zone of 0.9070. Notably, the descending trendline, which connects the highs from November 2022, is located in the same area.
The RSI and the MACD are sending encouraging signals, with the former stretching its uptrend above its 50 neutral mark and the latter strengthening above its red signal line and towards the positive region. Yet, the Stochastic oscillator is warning that a continuation of the consolidation phase or a downside correction cannot be ruled out as the indicator flatlines near its 80 overbought level.
In the positive scenario, where the price closes above 0.9070, the next obstacle could emerge around 0.9155. Not far above, the resistance line drawn from June’s 2022 peak could be more demanding, around 0.9200. If the price successfully breaches that bar, the spotlight will turn to the 0.9300 psychological mark. Then, the pair will attempt to upgrade the medium-term outlook above the 200-day simple moving average (SMA) at 0.9400 and the March high of 0.9439.
Alternatively, a pullback below 0.9000 could initially halt near the 20-day SMA at 0.8918. If not, the bears will attempt to re-activate the downtrend below the 0.8855-0.8850 region with scope to reach the support line from September at 0.8755. Slightly lower, the longer-term descending line from May could be another ideal area for a pivot.
In a nutshell, USDCHF seems to have set the ground for a positive trend reversal, though only a sustainable recovery above 0.9070 would verify the case.
WTI Tries to Gain Foothold
NZD/USD attempts to rebound
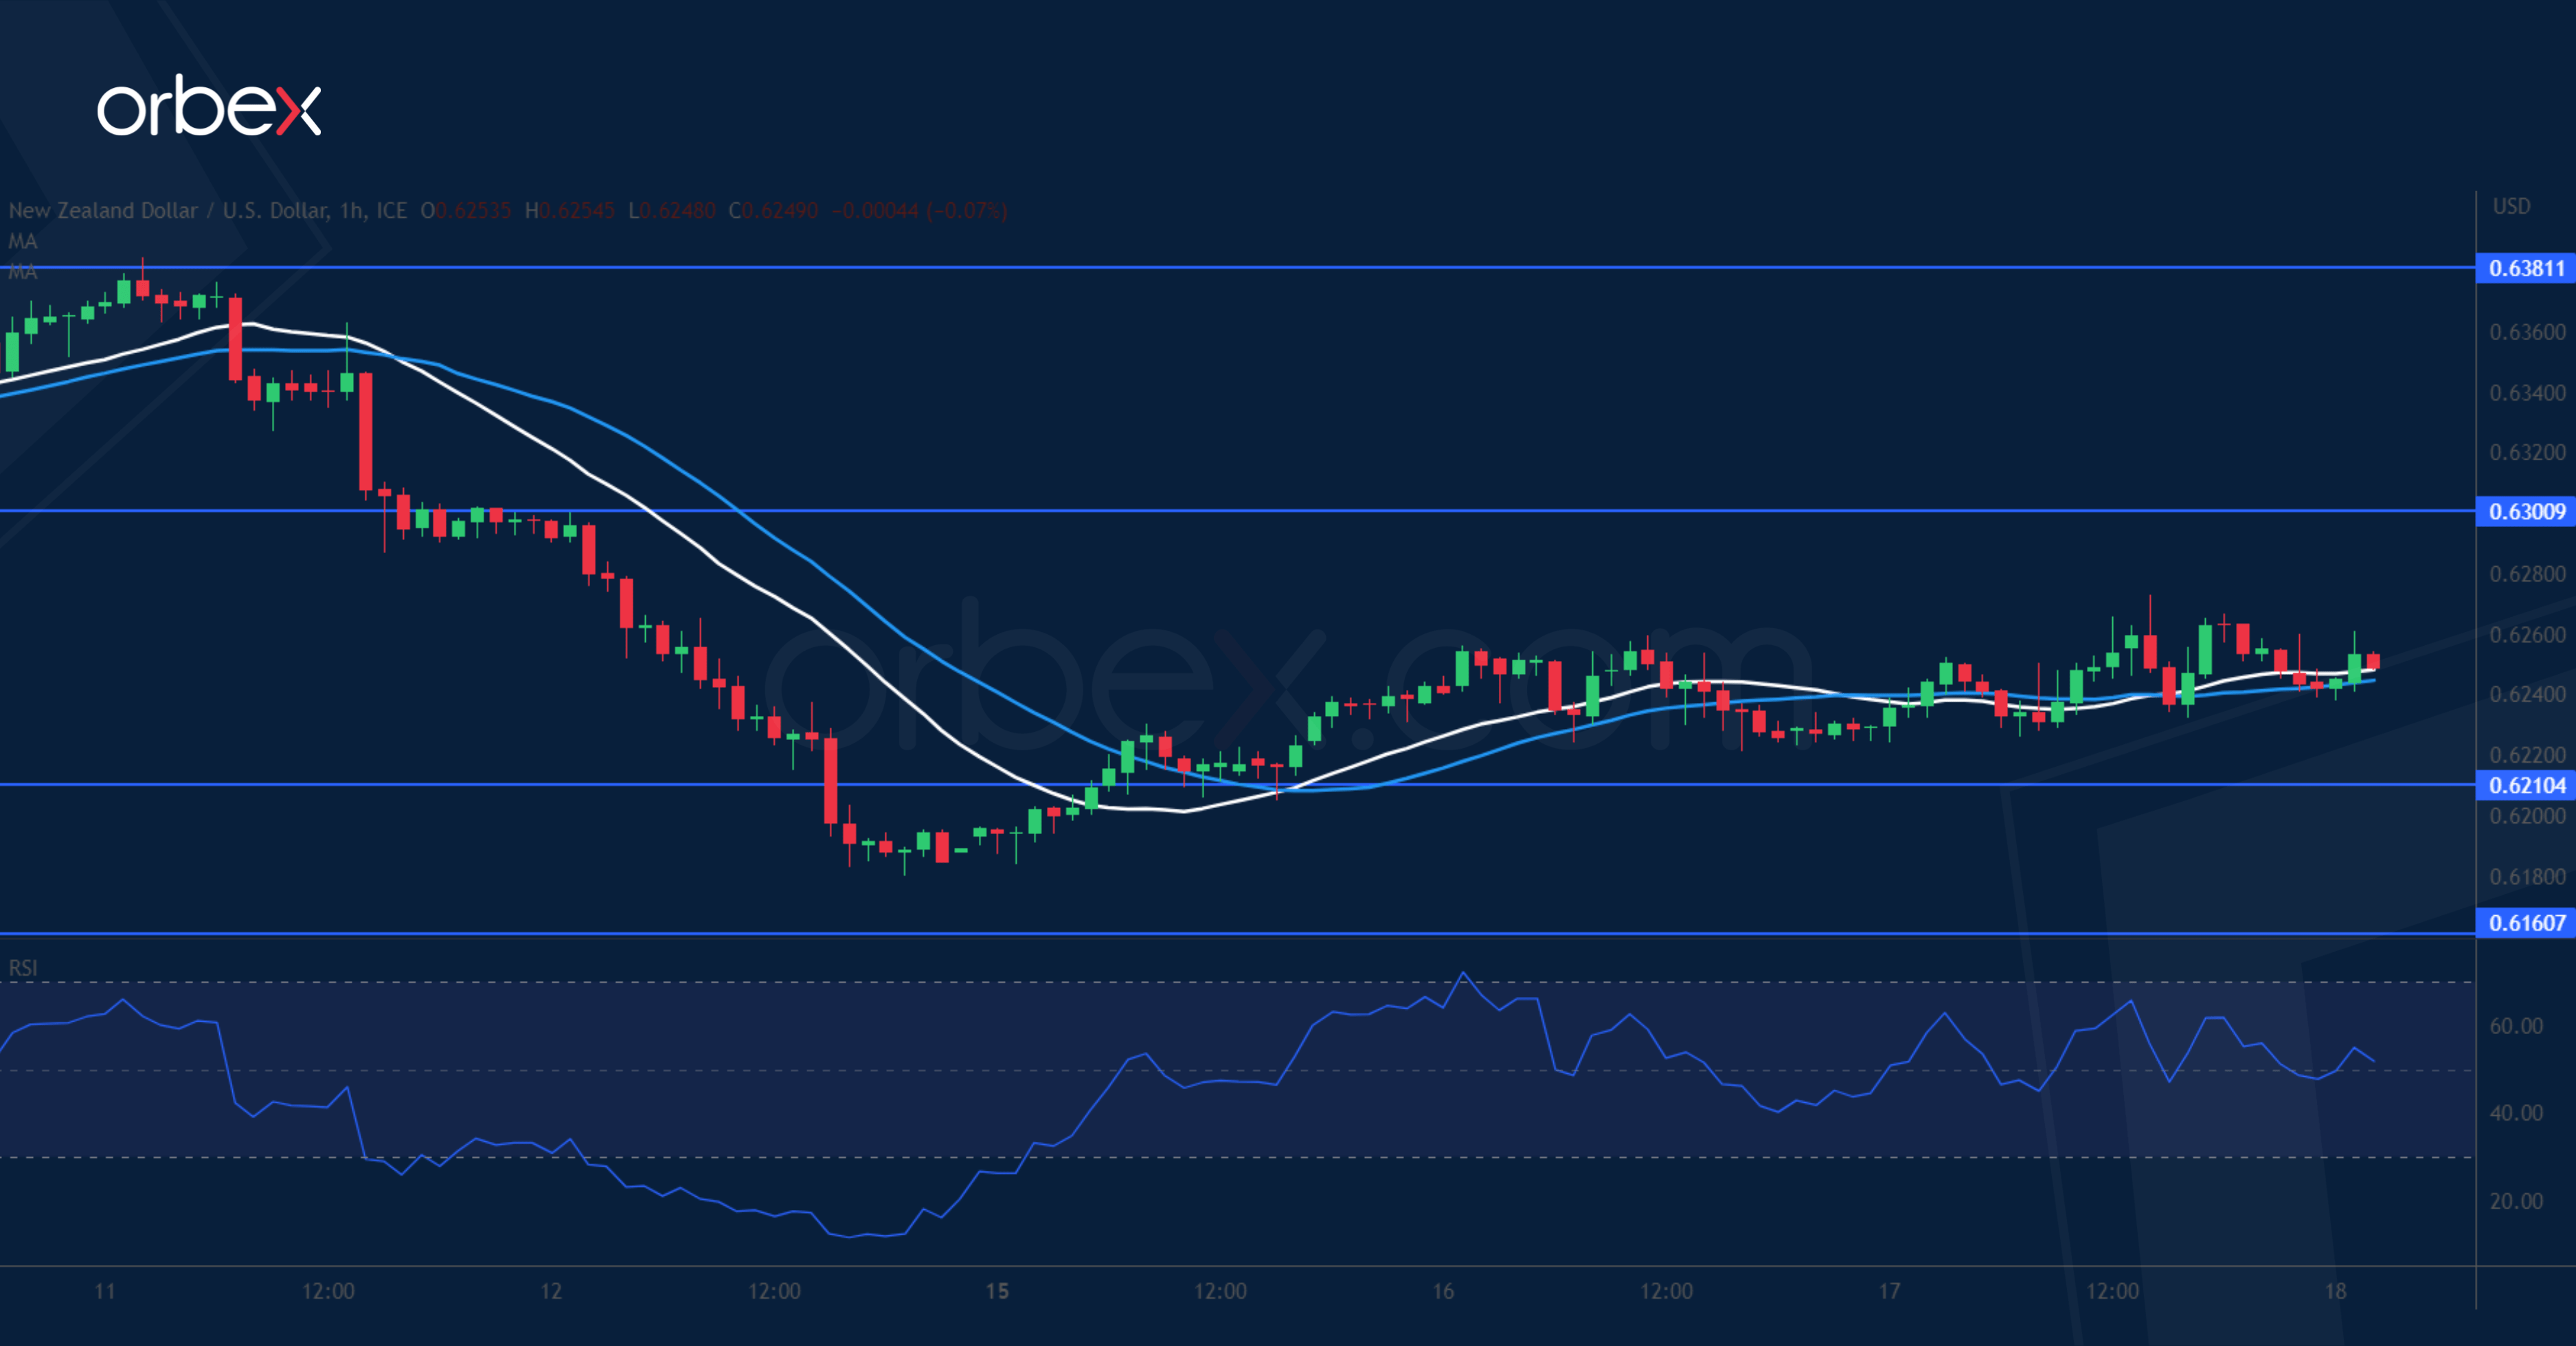
The New Zealand dollar grinds higher thanks to an uptick in the market’s risk appetite. The kiwi has retraced most of the recent gains from its late April rally. The RSI’s deeply oversold condition attracted some bargain hunting bids but these early buyers will need to consolidate their gains and clear 0.6300 before they could hope for a sustained recovery. 0.6210 is the first layer of defence in case of further hesitation. The demand zone 0.6120-0.6160 is important in keeping the rebound valid in the medium-term.
US Oil tests resistance
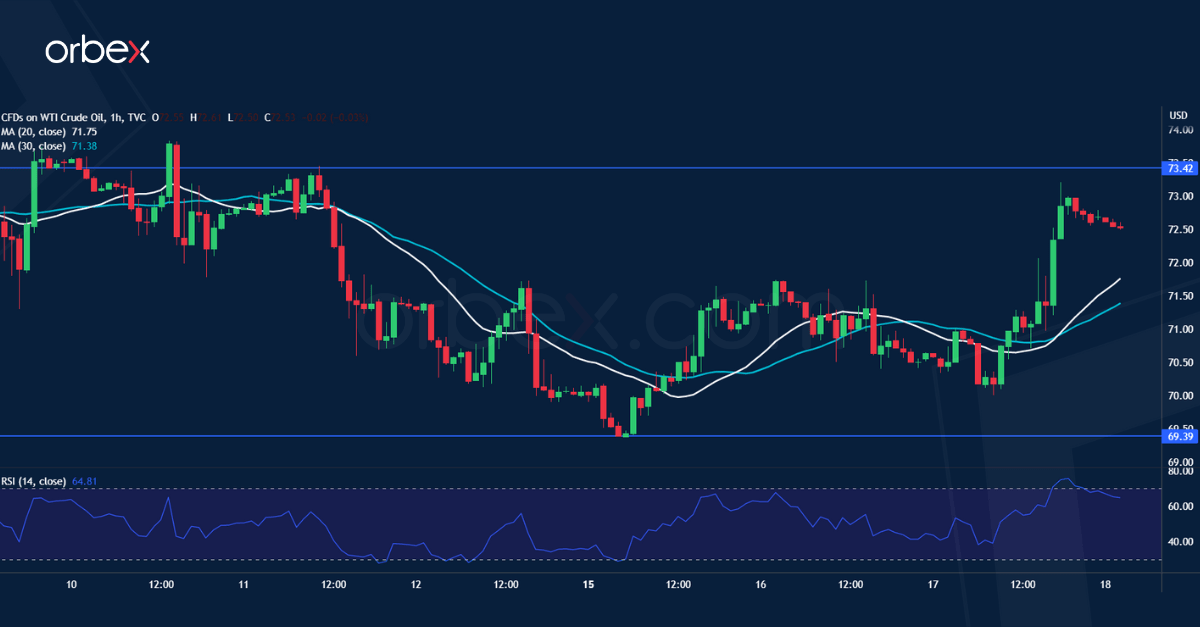
WTI rallied after the IEA expressed optimism about demand in the second half of the year. While a bearish MA cross on the daily chart suggests a lingering selling pressure, the price seems to have found a floor at 69.40 and is testing the previous swing high of 73.40. A bullish breakout would prompt sellers to take some chips off the table, reducing the pressure. Then 76.00 along the 30-day SMA is a major hurdle to lift before a recovery would materialise. On the downside, the daily double bottom at 66.00 is a critical support.
UK 100 struggles for support
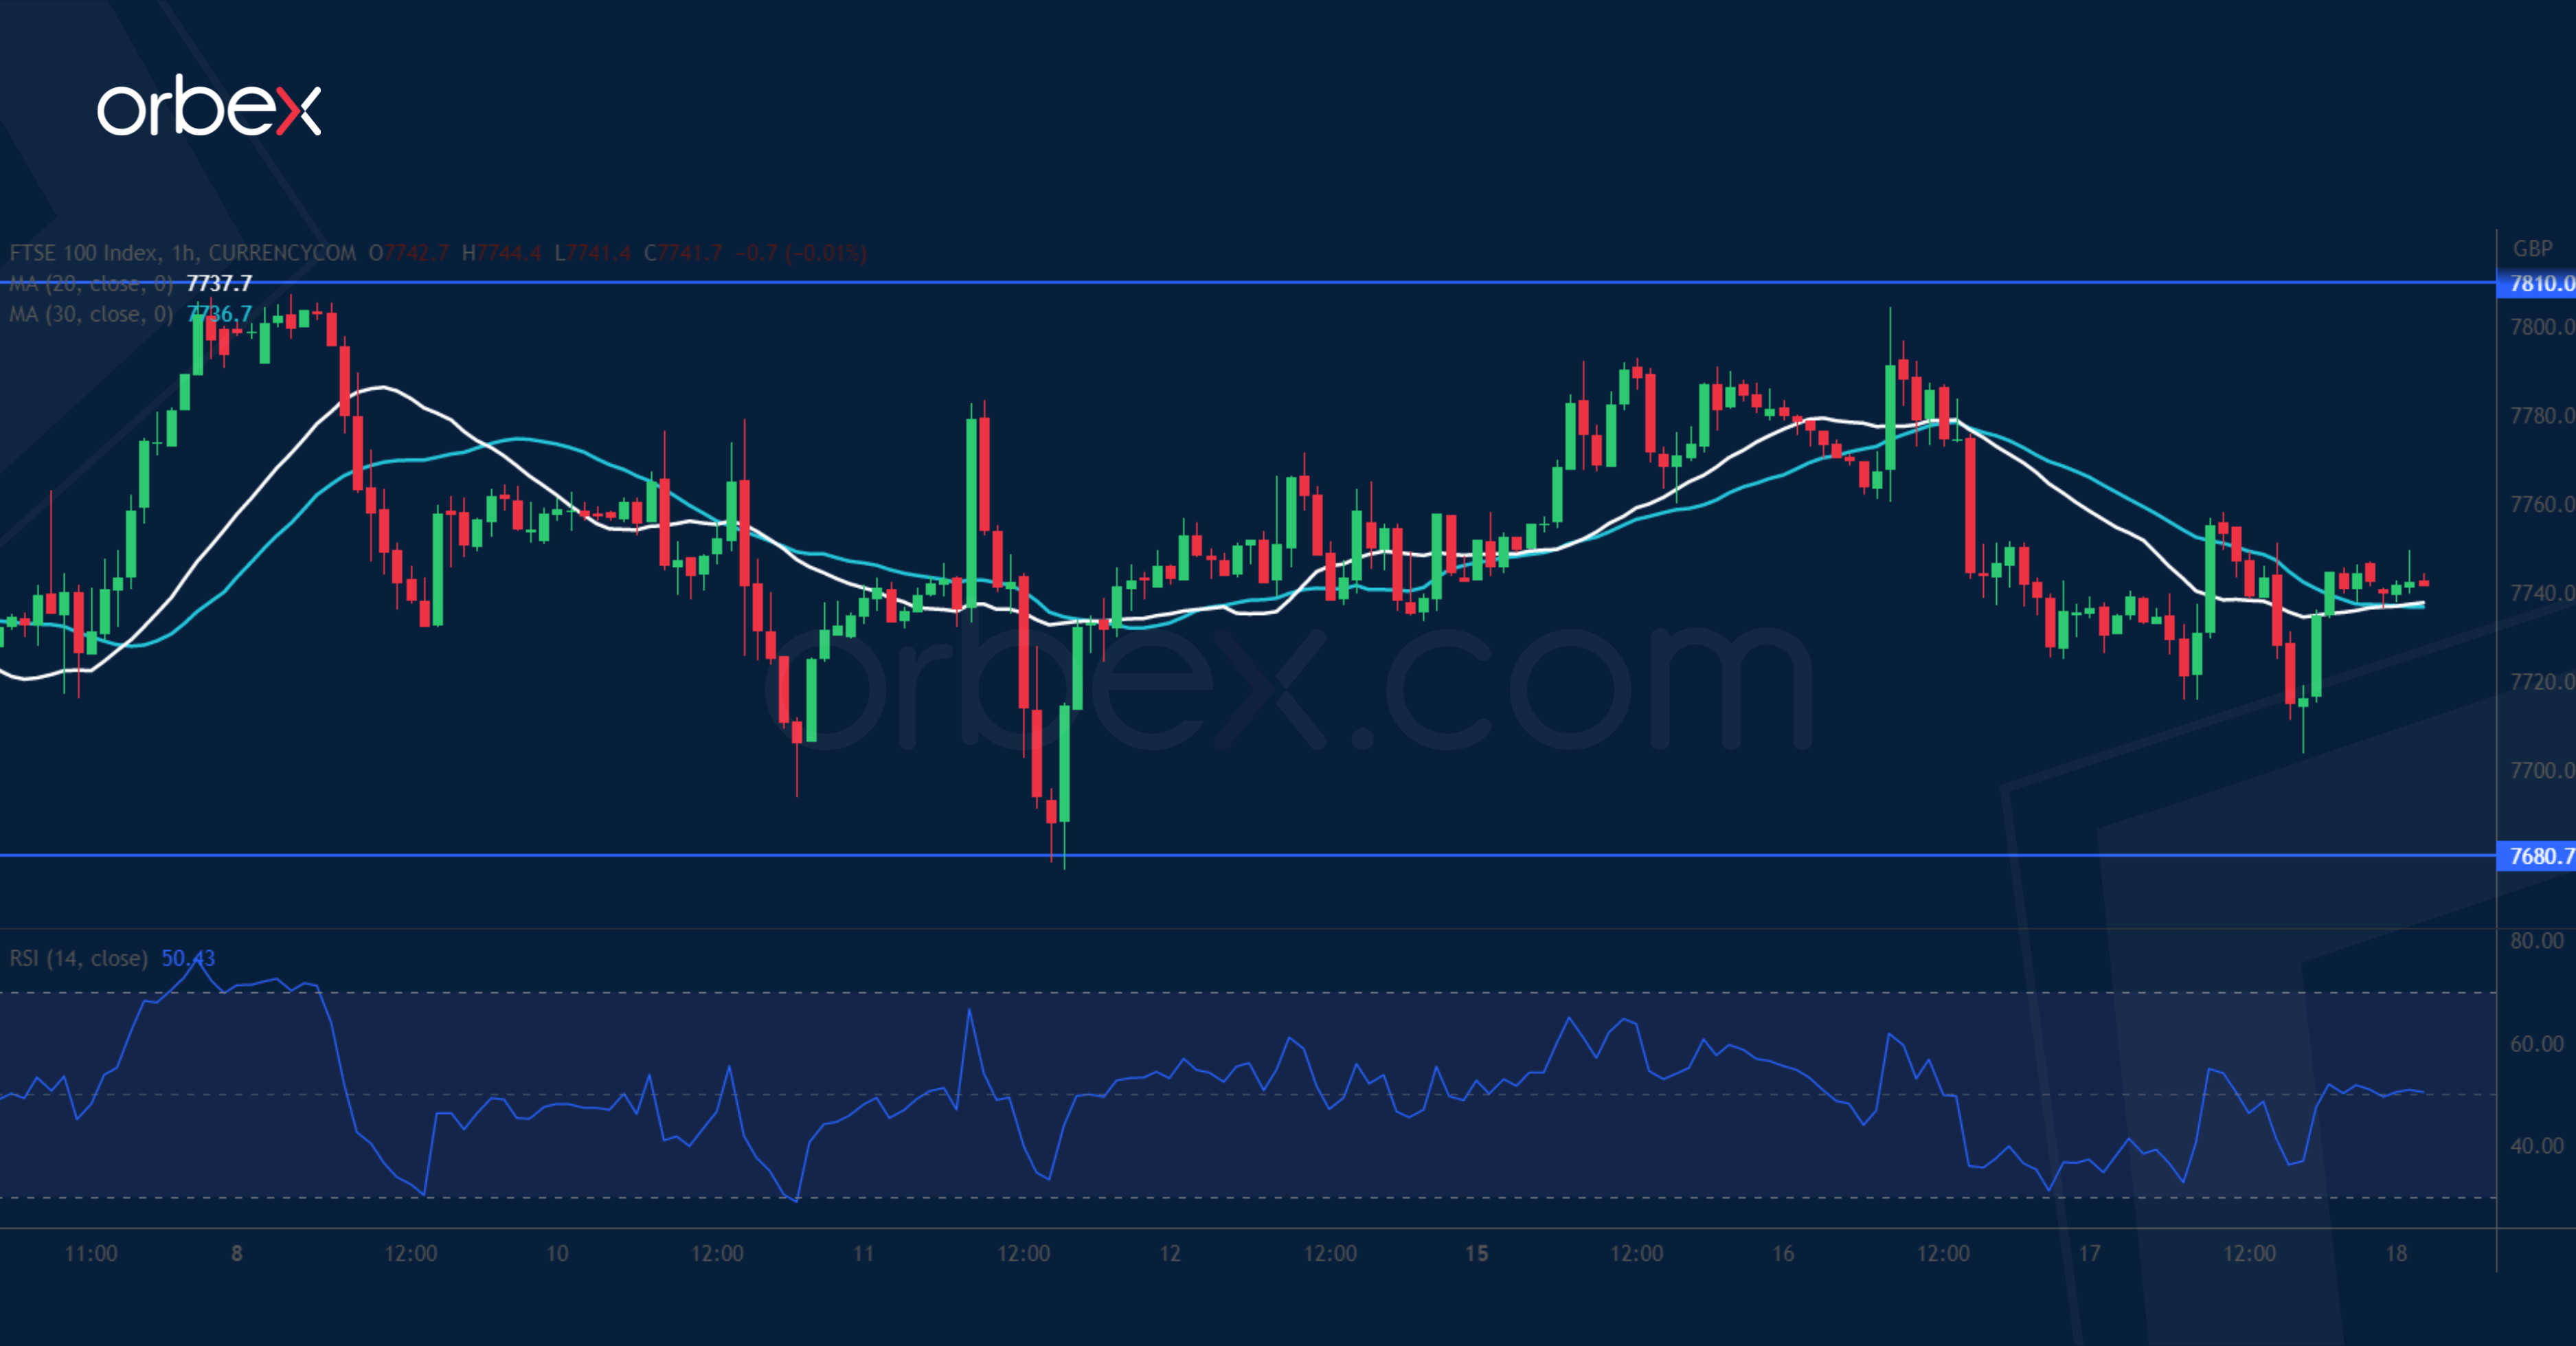
The FTSE 100 edges lower as downbeat reports from blue-chip companies dent sentiment. The index is still in a correction mode after hitting resistance at 7930. The sideways action shows the bulls’ struggle to contain the pullback and their inability to lift offers around the support-turned-resistance of 7810 reveals strong selling interests from fresh sellers and trapped buyers. 7680 is the current support and 7630 is where the bulls would draw a line in the sand, as a breakout would trigger a sell-off towards 7500.
AUD/USD Daily Report
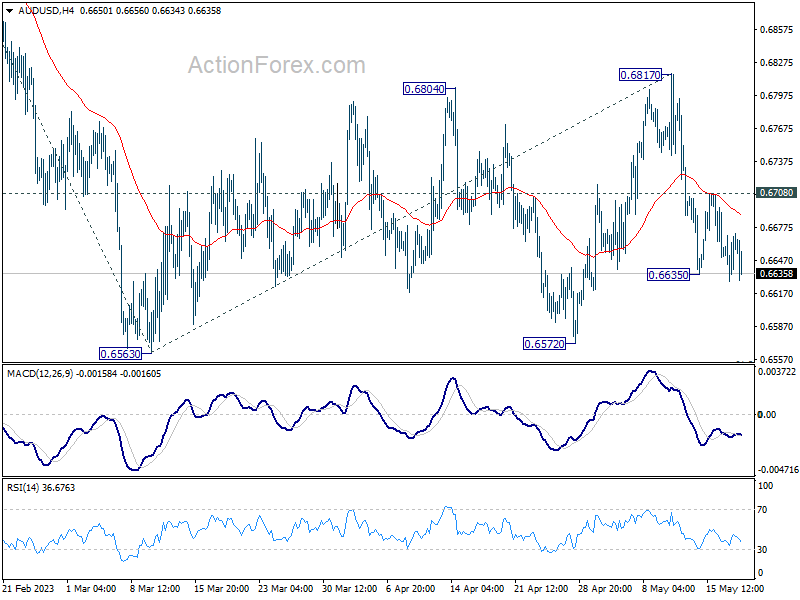
Daily Pivots: (S1) 0.6634; (P) 0.6654; (R1) 0.6678; More...
AUD/USD's fall resumed after brief recovery and intraday bias is back on the downside for retesting 0.6563 low. As noted before, consolidation pattern from 0.6563 could have completed with three waves to 0.6817.Decisive break of 0.6563 will resume larger decline from 0.7156 to 61.8% projection of 0.7156 to 0.6563 from 0.6817 at 0.6451. On the upside, above 0.6708 minor resistance will turn intraday bias neutral again first.
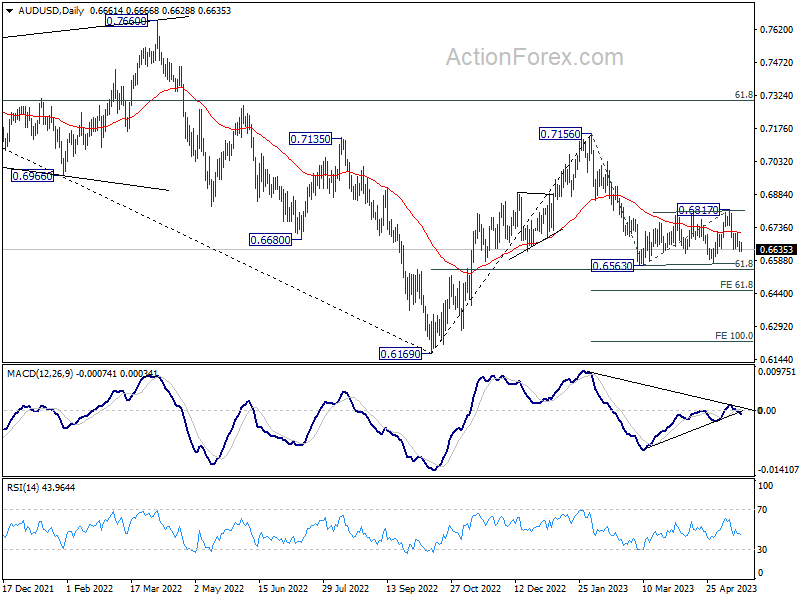
In the bigger picture, the failure to break through 55 W EMA (now at 0.6822) keeps medium term outlook bearish. Firm break of 61.8% retracement of 0.6169 to 0.7156 at 0.6546 will raise the chance of long term down trend resumption through 0.6169 low. This will now be the favored case as long as 0.6817 resistance holds.
Dollar Holds Strong Despite Risk Market Rally: Debt Ceiling Negotiations Offer a Glimmer of Hope
Market sentiment received a significant boost following upbeat news about US debt ceiling negotiations, and yet, Dollar remains resilient, showcasing an impressive strength. US President Joe Biden, following a meeting with Republican House Speaker Kevin McCarthy, presented an air of optimism as discussions continue. "Now we have a structure to find a way to come to a conclusion," said McCarthy, adding "I think at the end of the day we do not have a debt default. I think we finally got the president to agree to negotiate." Biden shared this confidence, stating, "I'm confident that we'll get the agreement on the budget, that America will not default."
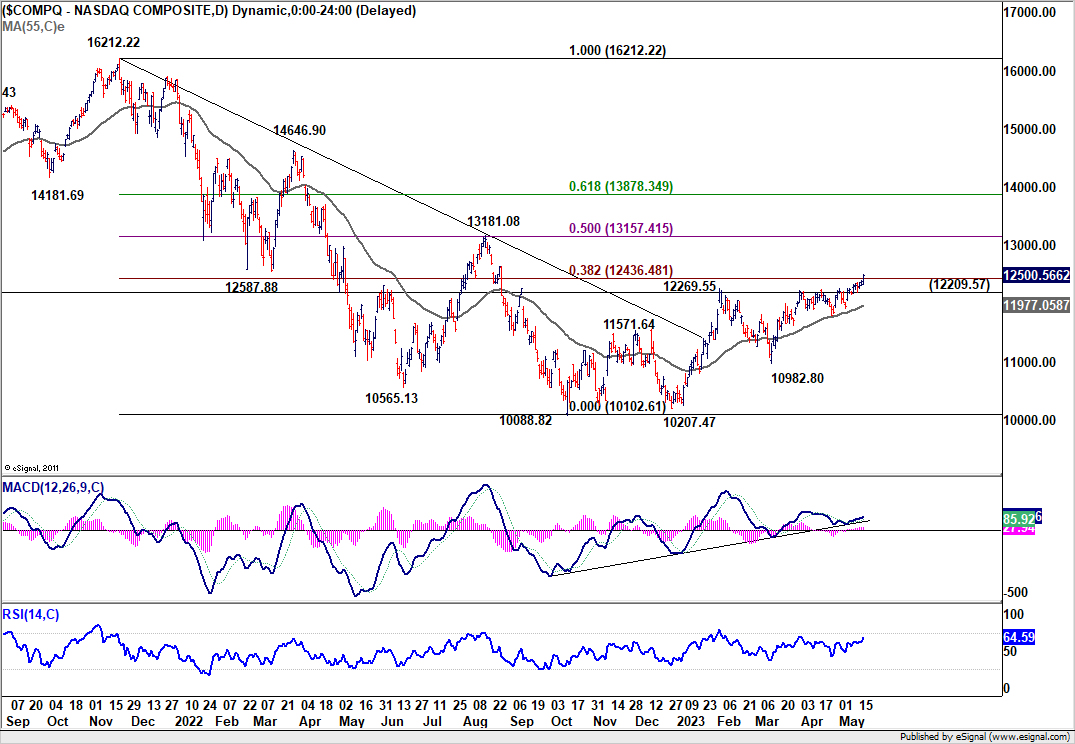
Stocks in the US closed the day in a broad rally, with NASDAQ's performance standing out as the index managed to close above 38.2% retracement of 16212.22 to 10088.82 at 12436.48. This significant bullish development forecasts further rallies as long the 12209.57 support level holds. The index should now aims for 13181.08 cluster resistance, 50% retracement at 13157.41. The burning question is whether Dollar could keep pace with the risk-on trend reflected in the stock market, or revert back to an inverse relationship.
Shifting focus back to the currency markets, Yen retains its position as the week's weakest performer, dragged down by ongoing rallies in US and European benchmark yields. In addition, strong Nikkei index performance seems to amplify Yen's inverse movement. Swiss Franc and Euro are also trailing in performance. Meanwhile, Kiwi and Loonie are faring well, but Aussie is being hampered by disappointing job data. Dollar, on the other hand, is extending its gains against Euro, Swiss Franc, and Yen, while remaining within range against Aussie, Loonie, and Sterling.
In Asia, Nikkei rose 1.60%. Japan 10-year JGB yield rose 0.0207 to 0.390. At the time of writing, Hong Kong HSI is up 0.41%. China Shanghai SSE is up 0.40%. Singapore Strait Times is up 0.40%. Overnight, DOW rose 1.24%. S&P 500 rose 1.19%. NASDAQ rose 1.28%. 10-year yield rose 0.032 to 3.581.
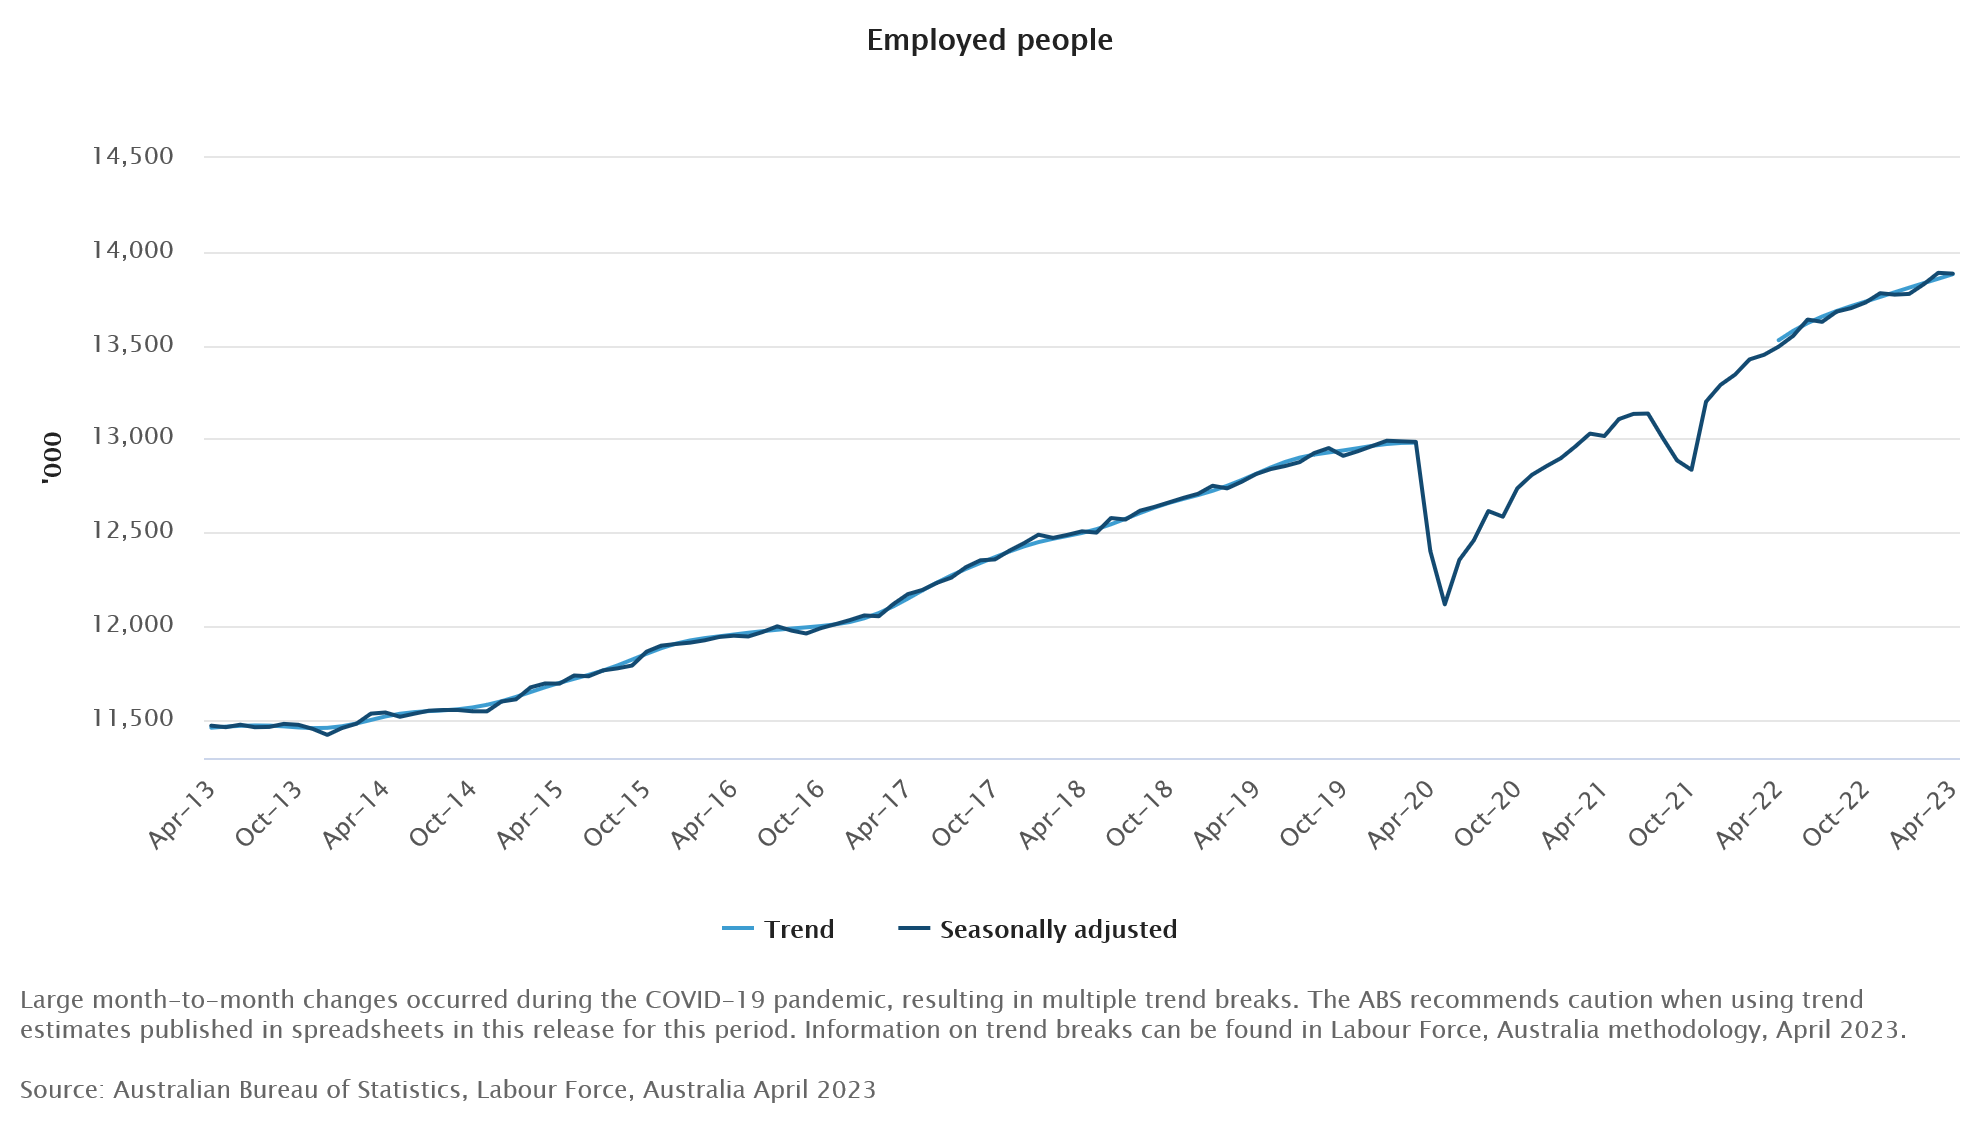
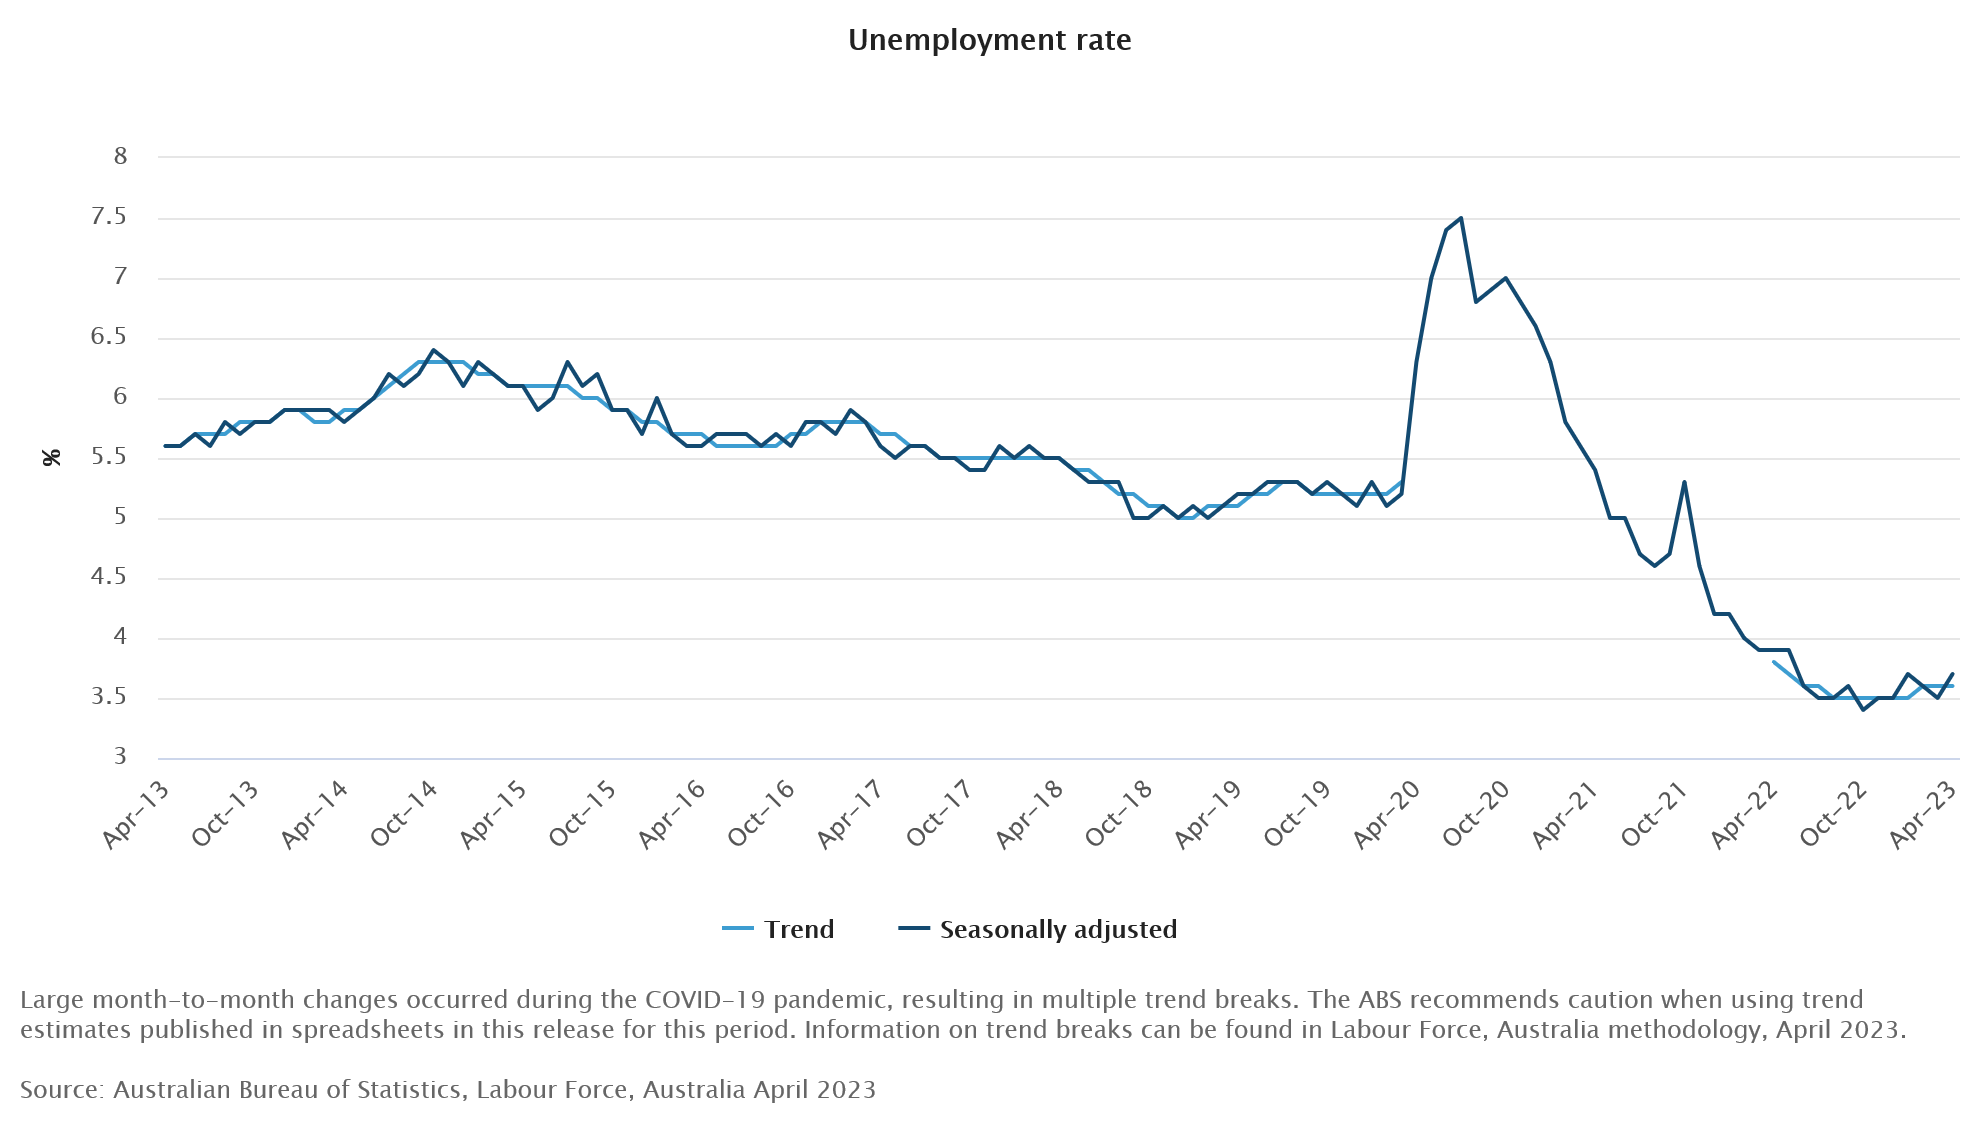
Australia employment down -4.3k in Apr, unemployment rate up to 3.7%
Australia employment contracted -4.3k in April, much worse than expectation of 25k growth. Full time job decreased -27.1k while part-time jobs rose 22.8k. Unemployment rate rose from 3.5% to 3.7%, above expectation of being unchanged at 3.5%. Participation rate dropped -0.1% to 66.7%. Employment-to-population ratio fell -0.2% to 64.2%. Monthly hours worked rose 2.6% mom or 49m hours.
Bjorn Jarvis, ABS head of labour statistics, said: "The small fall in employment followed an average monthly increase of around 39,000 people during the first quarter of this year." Meanwhile, both employment-to-population ratio and participation rate "were still well above pre-COVID-19 pandemic levels and close to their historical highs in 2022".
Japan's exports grow at slowest pace since Feb 2021 despite setting record high for Apr
Japan's exports grew by a modest 2.6% yoy to JPY 8288B in April. Although this represented the lowest growth in exports since February 2021, it still marked the largest export figure for April on record.
A closer examination of the data reveals a shift in trading dynamics. Exports to China fell by -2.9% yoy, marking the fifth consecutive month of decline. The decrease was driven by downturns in shipments of cars, car parts, and steel. Similarly, exports to Asia overall declined by -6.6% yoy, continuing a contraction trend for the fourth month in a row.
However, things looked rosier elsewhere. Exports to the US and EU showed robust growth, rising by 10.5% yoy and 11.7% yoy respectively. This uptick was led by a rebound in exports of cars and car parts, which have seen easing supply constraints.
Contrasting with export trends, imports fell by -2.3% yoy to JPY 8721B, the first annual decline witnessed in 27 months. This decrease was largely attributed to a slump in imports of crude oil and liquefied natural gas. Consequently, Japan recorded a trade deficit of JPY -432B for the 21st month running.
In seasonally adjusted term, the situation presents a slightly different picture. Exports rose by 2.5% mom to JPY 8259B, while imports inched up by 0.1% mom to JPY 9276B. In light of this, trade deficit narrowed to JPY -1017B.
Looking ahead
Canada new housing price index will be released in European session. US will release jobless claims, Philly Fed survey and existing home sales.
AUD/USD Daily Report
Daily Pivots: (S1) 0.6634; (P) 0.6654; (R1) 0.6678; More...
AUD/USD's fall resumed after brief recovery and intraday bias is back on the downside for retesting 0.6563 low. As noted before, consolidation pattern from 0.6563 could have completed with three waves to 0.6817.Decisive break of 0.6563 will resume larger decline from 0.7156 to 61.8% projection of 0.7156 to 0.6563 from 0.6817 at 0.6451. On the upside, above 0.6708 minor resistance will turn intraday bias neutral again first.
In the bigger picture, the failure to break through 55 W EMA (now at 0.6822) keeps medium term outlook bearish. Firm break of 61.8% retracement of 0.6169 to 0.7156 at 0.6546 will raise the chance of long term down trend resumption through 0.6169 low. This will now be the favored case as long as 0.6817 resistance holds.
Economic Indicators Update
| GMT | Ccy | Events | Actual | Forecast | Previous | Revised |
|---|---|---|---|---|---|---|
| 22:45 | NZD | PPI Input Q/Q Q1 | 0.20% | 0.50% | 0.50% | |
| 22:45 | NZD | PPI Output Q/Q Q1 | 0.30% | 0.80% | 0.90% | |
| 23:50 | JPY | Trade Balance (JPY) Apr | 0.80% | -1.08T | -1.21T | |
| 01:30 | AUD | Employment Change Apr | -4.3K | 25K | 53K | 61.1K |
| 01:30 | AUD | Unemployment Rate Apr | 3.70% | 3.50% | 3.50% | |
| 12:30 | CAD | New Housing Price Index M/M Apr | -0.10% | 0.00% | ||
| 12:30 | USD | Initial Jobless Claims (May 12) | 260K | 264K | ||
| 12:30 | USD | Philadelphia Fed Survey May | -20 | -31.3 | ||
| 14:00 | USD | Existing Home Sales Apr | 4.35M | 4.44M | ||
| 14:30 | USD | Natural Gas Storage | 109B | 78B |
Nikkei 225 Technical: At the Risk of a Multi-Week Pull-Back
- Nikkei 225 recorded a month-to-day return of +5.80% for May and hit a 33-year high.
- Nikkei 225 outperformed the MSCI All Country World Index on a year-to-date basis (17% vs. 9%).
- Overbought conditions below 30,835 key resistance.
The Japanese stock market has continued to rally and outperformed the rest of the world. The benchmark Nikkei 225 has recorded a month-to-date return of +5.80% for May at this time of the writing that outperformed significantly against the US S&P 500 (-0.26%), MSCI All Country Asia ex Japan (-0.61%), MSCI Emerging Markets (+0.08%) and STOXX Europe 600 (-0.57%).
The reasons and supporting factors for its potential strategic and tactical outperformance that may persist into the second half of 2023 have been highlighted in detail in my previous articles.
The current medium-term uptrend phase of the Nikkei 225 that is in place since its 4 January 2023 low of 25,661 has hit a 52-week and 33-year high at 30,677. In the lens of technical analysis, the price actions of any liquid tradable financial instruments move in cyclical waveforms and not in a vertical fashion where there will be bouts of shorter-term periodic corrections within a higher degree timeframe trending phase as sentiments’ (both rational and irrational) of market participants adjust accordingly via greed and fear with respect to new relevant information.
Right now, after the recent steep rally of the Nikkei 225 in terms of its speed taken to reach such a current high level now faces a risk of a shorter-term corrective movement to retrace some portion of its medium-term uptrend phase from the 4 January 2023 low.
Japan 225 Technical Analysis – Watch the 30,835 key resistance
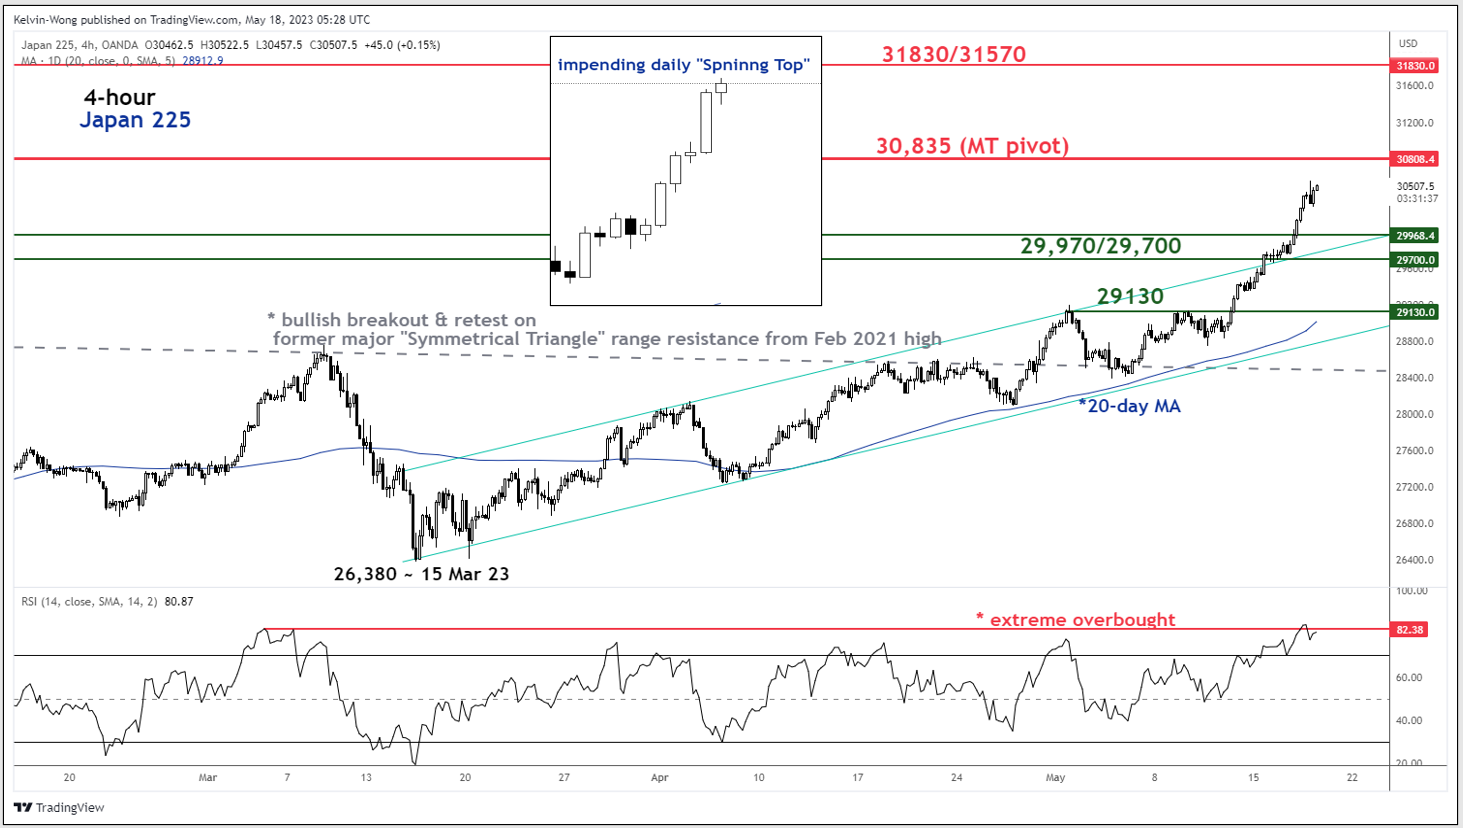
Fig 1: Japan 225 trend as of 18 May 2023 (Source: TradingView, click to enlarge chart)
The Japan 225 Index (a proxy for the Nikkei 225 futures) has formed an impending daily “Spinning Top” bullish exhaustion Japanese candlestick pattern right below a major resistance of 30,835 where the bulls have not managed to stage a breakout on prior two occasions on 15 February 2021 and 13 September 2021.
In the shorter term as seen on the 4-hour, the price actions of the Index have accelerated to the upside on 15 May 2023 via its bullish breakout of the upper boundary of the minor ascending channel from mid-March 2023 and the 4-hour RSI oscillator has reached an extreme overbought level of 82% since 5 March 2023.
These observations suggest an overstretched up move for the Index and the odds have increased for a potential short-term (multi-week) corrective pull-back within a medium-term (multi-month) uptrend phase that is still intact at this junction.
The immediate support to watch will be at 29,970/29,700 and a break below 29,700 exposes the next support at 29,130 which also confluences with the upward-sloping 20-day moving average.
On the other hand, a clearance with a 4-hour close above 30,835 sees the next resistance zone coming in at 31,830/31,570, defined by a cluster of Fibonacci extension levels and the former swing lows area of 18/25 June 1990.
Technical Outlook and Review
DXY:
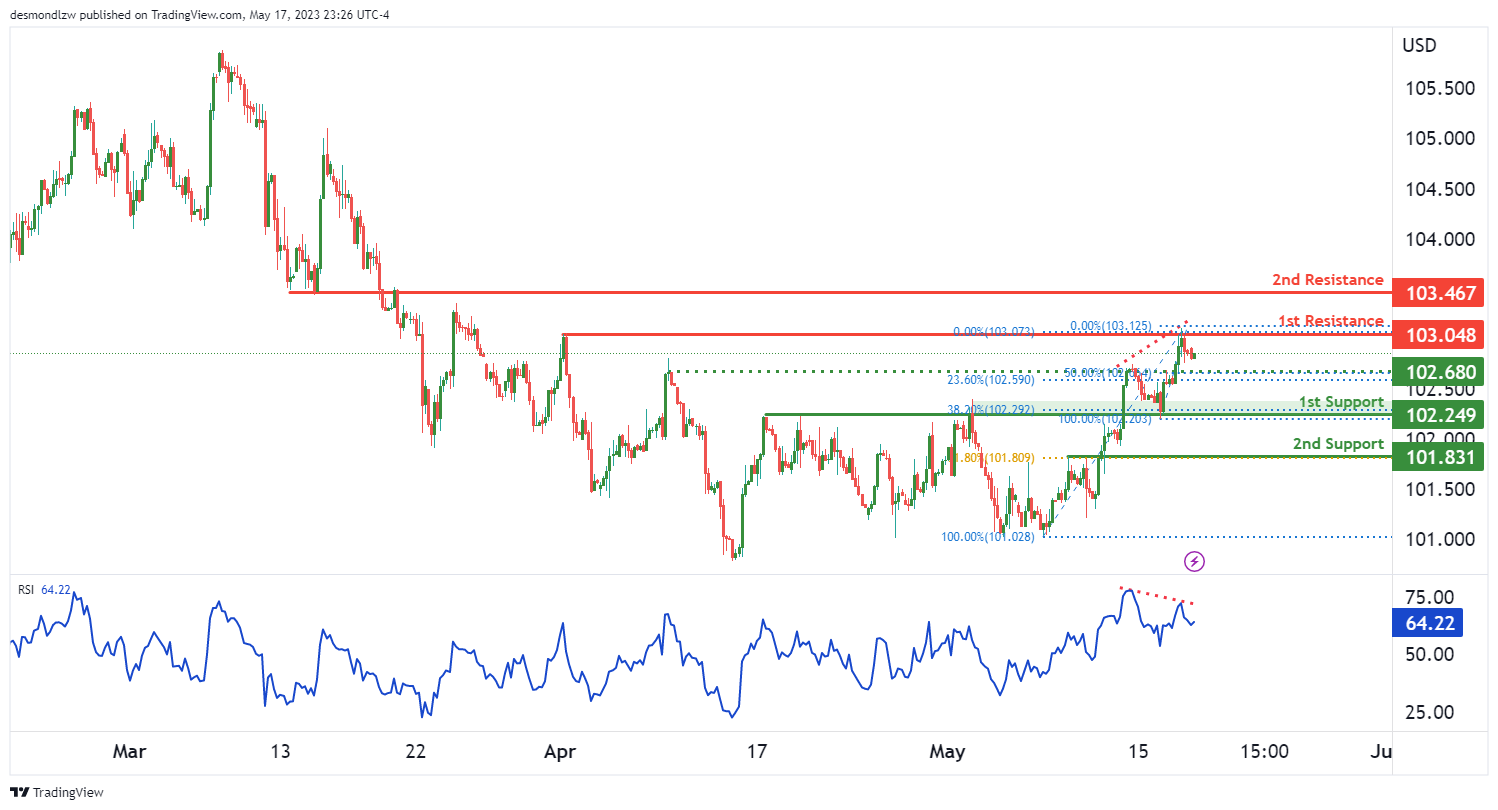
The DXY (US Dollar Index) chart currently indicates bearish momentum, suggesting the potential for further downward movement.
In the near term, there is a possibility of a bearish continuation towards the first support level at 102.24. This level is recognized as an overlap support and coincides with a 38.20% Fibonacci retracement, enhancing its significance.
Additional support can be found at the second support level of 101.83, which is identified as a pullback support and aligns with a 61.80% Fibonacci retracement.
On the resistance side, the first resistance level is at 103.04, characterized as a multi-swing high resistance. There is also a second resistance level at 103.46, considered an overlap resistance.
Furthermore, an intermediate support level at 102.68 is observed, serving as a pullback support. This level exhibits a Fibonacci confluence, with a 23.60% Fibonacci retracement and a 50% Fibonacci retracement.
Supporting the bearish case is the bearish divergence displayed by the RSI indicator compared to the price. This suggests the potential for a rapid decline in price.
EUR/USD:
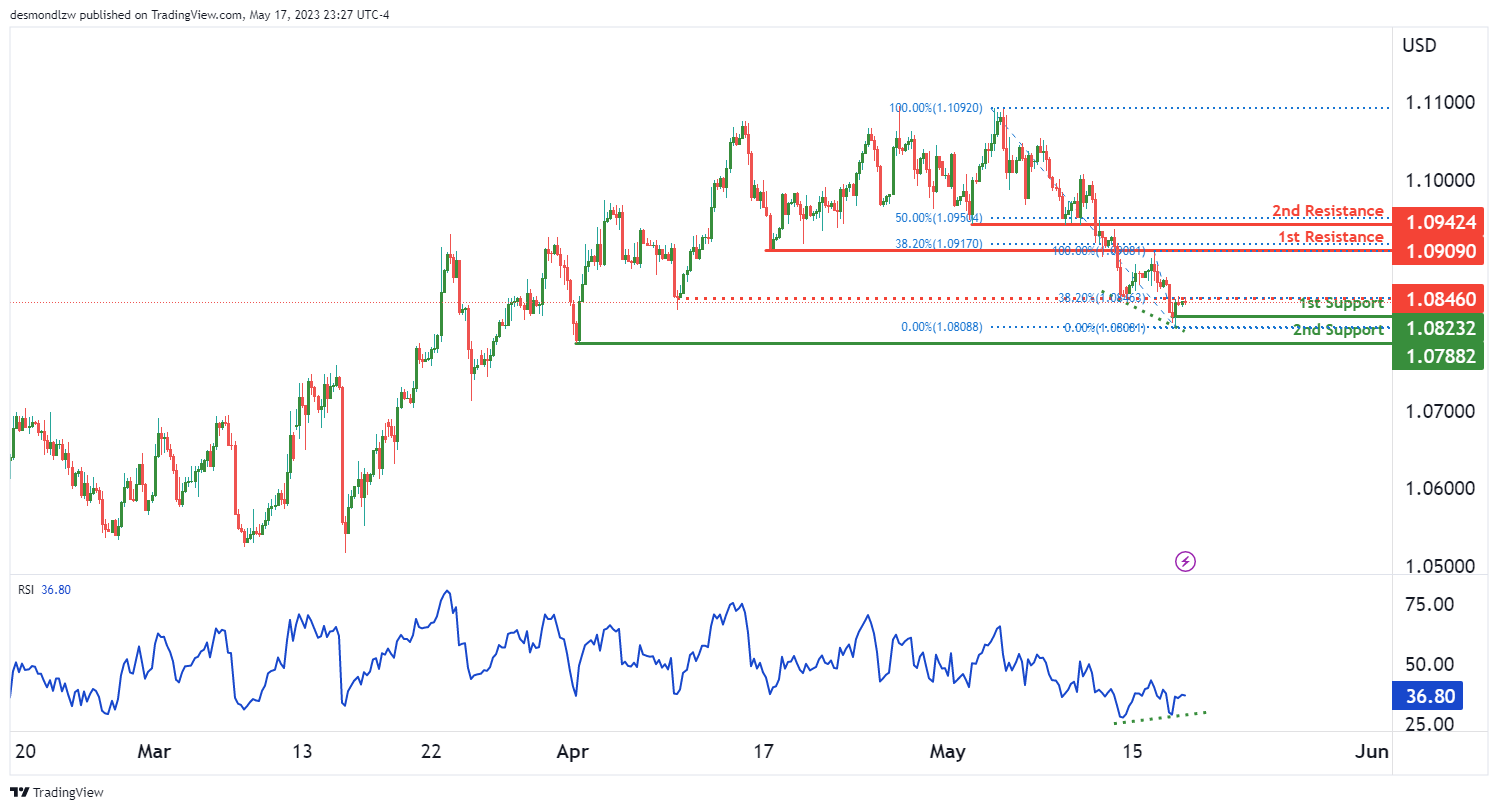
The EUR/USD chart currently demonstrates bullish momentum, indicating the potential for further upward movement.
In the near term, there is a possibility of a bullish continuation towards the first resistance level at 1.0909. This level is characterized as an overlap resistance and coincides with a 38.20% Fibonacci retracement, adding to its significance.
Support levels are also present to provide potential price floors. The first support level is at 1.0823, identified as a swing low support. Additionally, the second support level is at 1.0788, also recognized as a swing low support.
Furthermore, there is an intermediate resistance level at 1.0846, which is an overlap resistance. This level aligns with a 38.20% Fibonacci retracement, further reinforcing its importance.
An additional factor supporting the bullish case is the bullish divergence observed in the RSI indicator when compared to the price. This suggests the potential for a rapid increase in price.
GBP/USD:
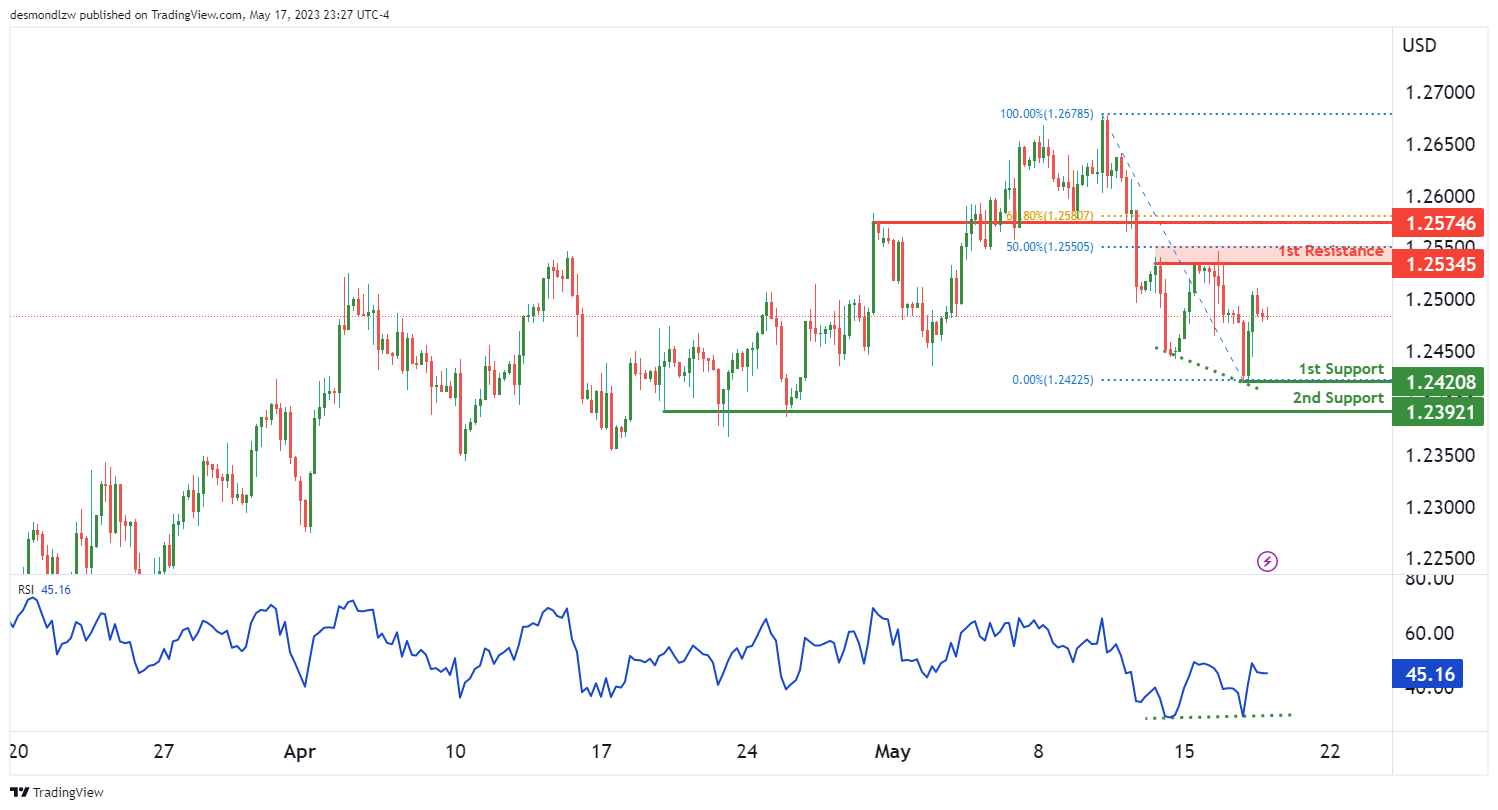
The GBP/USD chart currently exhibits bullish momentum, indicating the potential for further upward movement.
In the near term, there is a possibility of a bullish continuation towards the first resistance level at 1.2534. This level is identified as a multi-swing high resistance and coincides with a 50% Fibonacci retracement, adding to its significance.
Additional support can be found at the second support level of 1.2574, which is recognized as a pullback resistance and aligns with a 61.80% Fibonacci retracement.
On the support side, the first support level is at 1.2420, characterized as a swing low support. There is also a second support level at 1.2392, identified as a multi-swing low support.
In support of the bullish case, the RSI indicator displays bullish divergence compared to the price. This suggests the likelihood of a rapid increase in price.
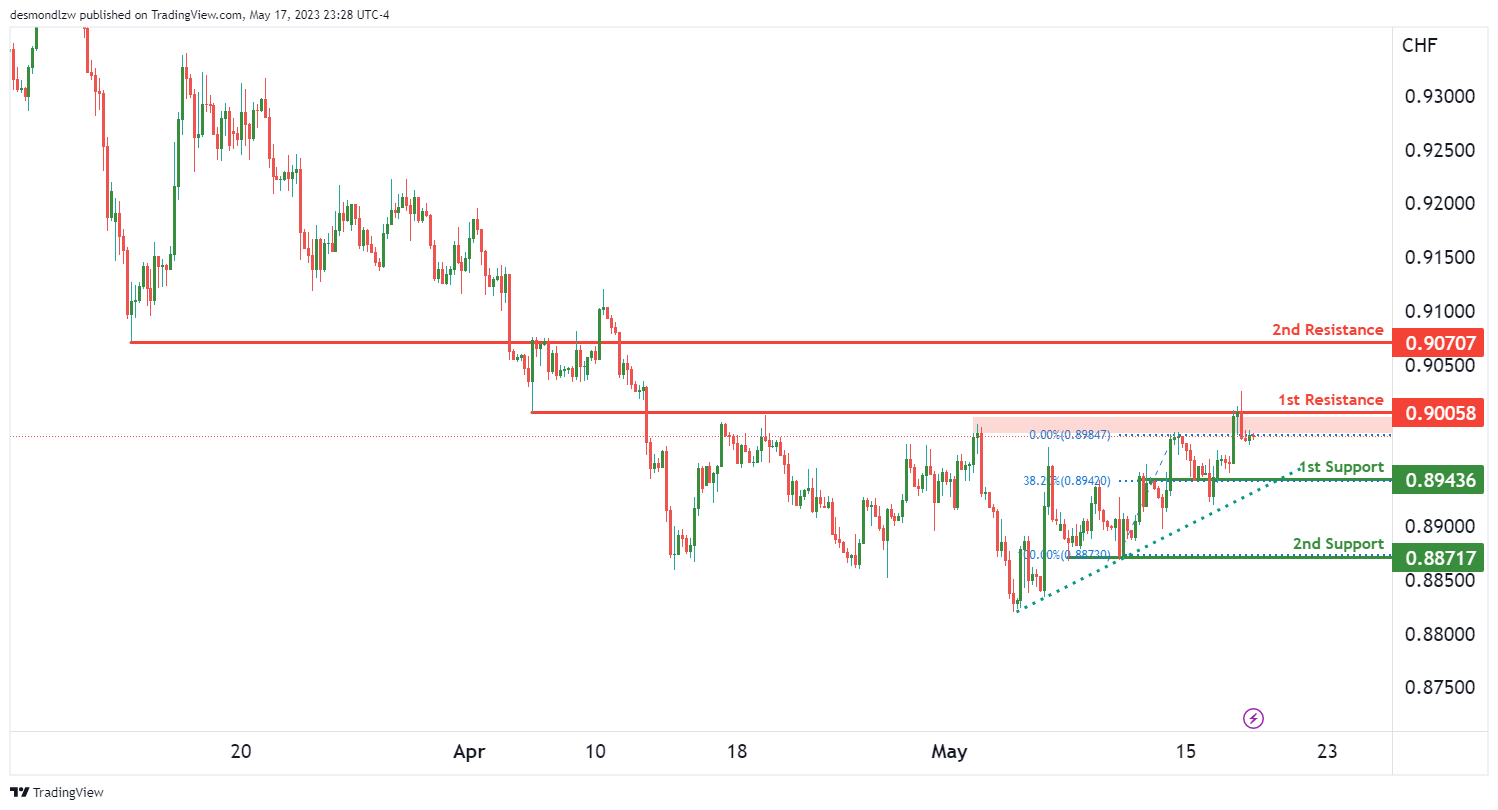
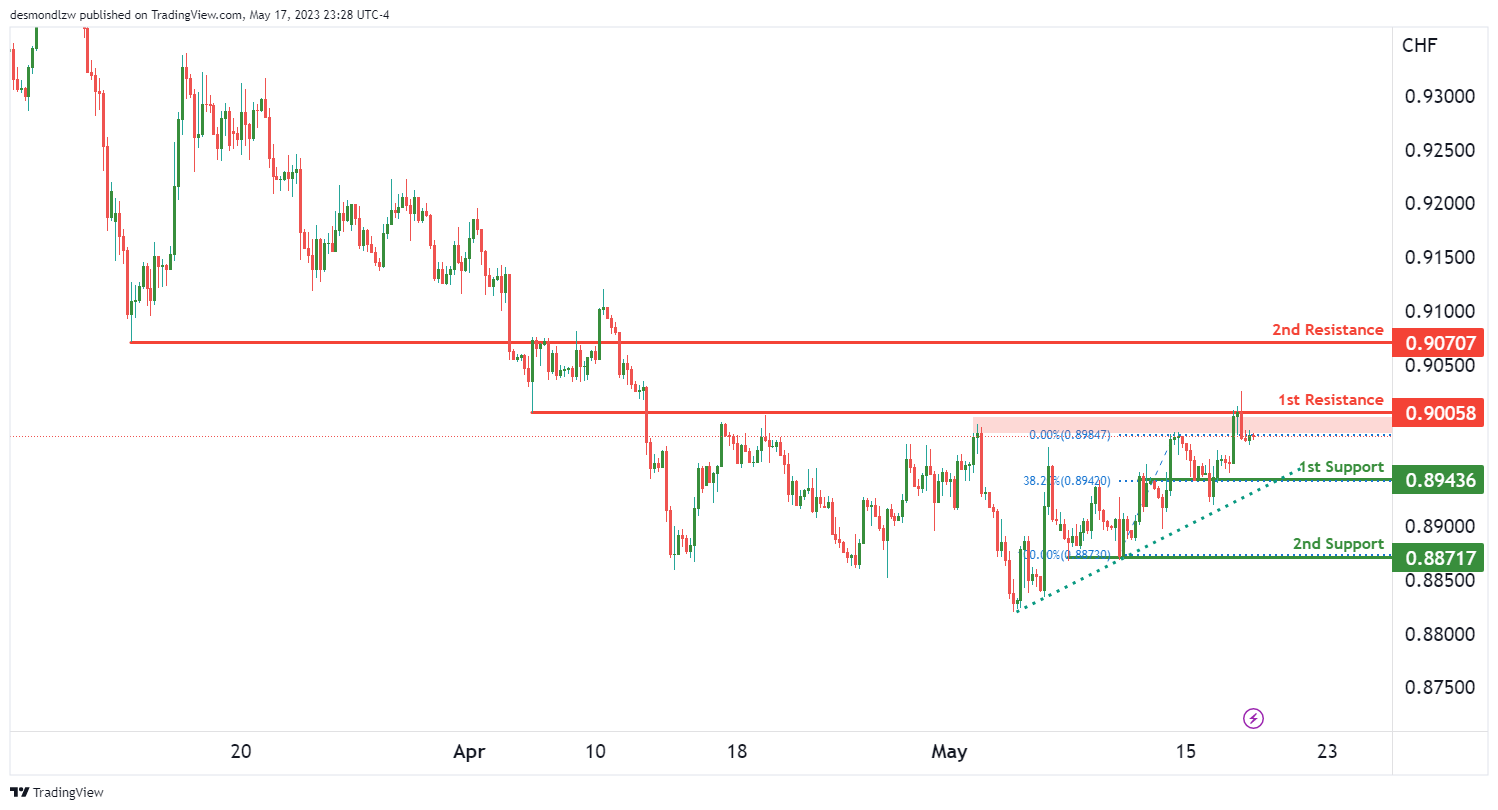
USD/CHF:
The USD/CHF chart currently demonstrates bullish momentum, with price positioned above a major ascending trend line, suggesting the potential for further upward movement.
In the short term, there is a possibility of a drop towards the first support level at 0.8943 before bouncing from that level and rising towards the first resistance.
The first support level at 0.8943 is identified as an overlap support and coincides with a 38.20% Fibonacci retracement, indicating its significance as a potential price floor.
In the event of a further drop, the second support level at 0.8871 can provide additional support. This level is recognized as a multi-swing low support.
On the resistance side, the first resistance level at 0.9950 is an overlap resistance level. Further upward movement could encounter resistance at this level.
There is also a second resistance level at 0.9070, identified as a pullback resistance, which may pose additional hurdles for the price.
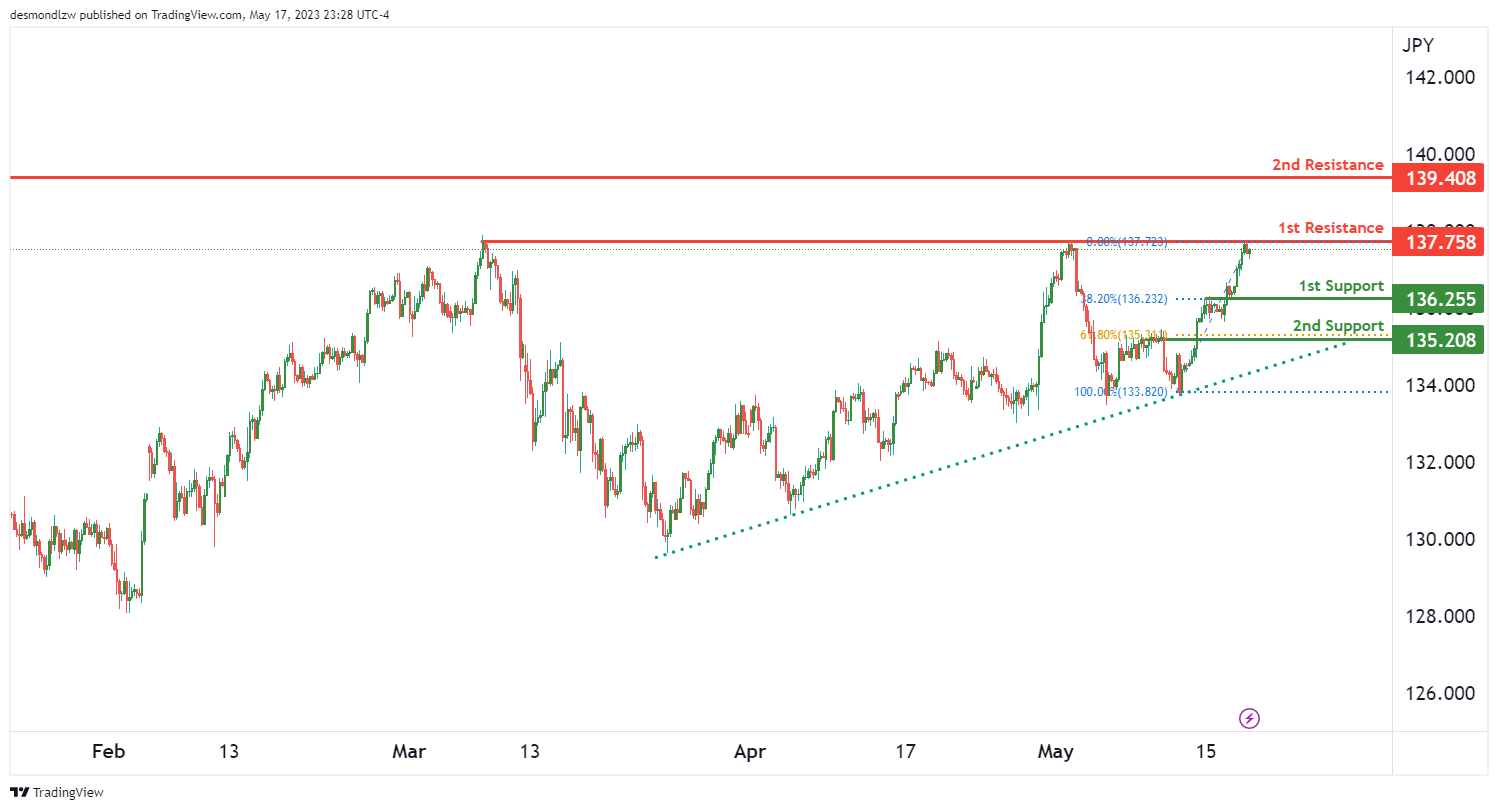
USD/JPY:
The USD/JPY chart is currently showing bullish momentum, with price positioned above a major ascending trend line, suggesting the potential for further upward movement.
In the short term, there is a possibility of a drop towards the first support level at 136.25 before bouncing from that level and rising towards the first resistance.
The first support level at 136.25 is identified as an overlap support and coincides with a 38.20% Fibonacci retracement, indicating its significance as a potential price floor.
In the event of a further drop, the second support level at 135.20 can provide additional support. This level is recognized as a pullback support and coincides with a 61.80% Fibonacci retracement.
On the resistance side, the first resistance level at 137.75 is an overlap resistance level. Further upward movement could encounter resistance at this level.
There is also a second resistance level at 139.40, which is a swing high resistance. This level may pose a significant hurdle for the price.
Considering these factors, the overall momentum of the USD/JPY chart is bullish, suggesting the potential for a drop towards the first support level before a bounce and subsequent rise towards the first resistance level.
AUD/USD:
The AUD/USD chart is currently displaying bullish momentum, indicating the potential for further upward movement.
In line with this bullish momentum, there is a possibility of a bullish continuation towards the first resistance level at 0.6707.
To support this potential upward movement, there are two levels of support. The first support level is at 0.6635, identified as an overlap support. This level may provide a price floor and support any potential pullbacks.
The second support level is at 0.6582, recognized as a swing low support. This level also contributes to the overall bullish bias.
On the resistance side, the first resistance level at 0.6707 is a multi-swing high resistance level. If the price continues to rise, it may encounter resistance at this level.
Additionally, there is a second resistance level at 0.6750, identified as a pullback resistance. This level, coinciding with a 61.80% Fibonacci retracement, could present a stronger barrier for the price.
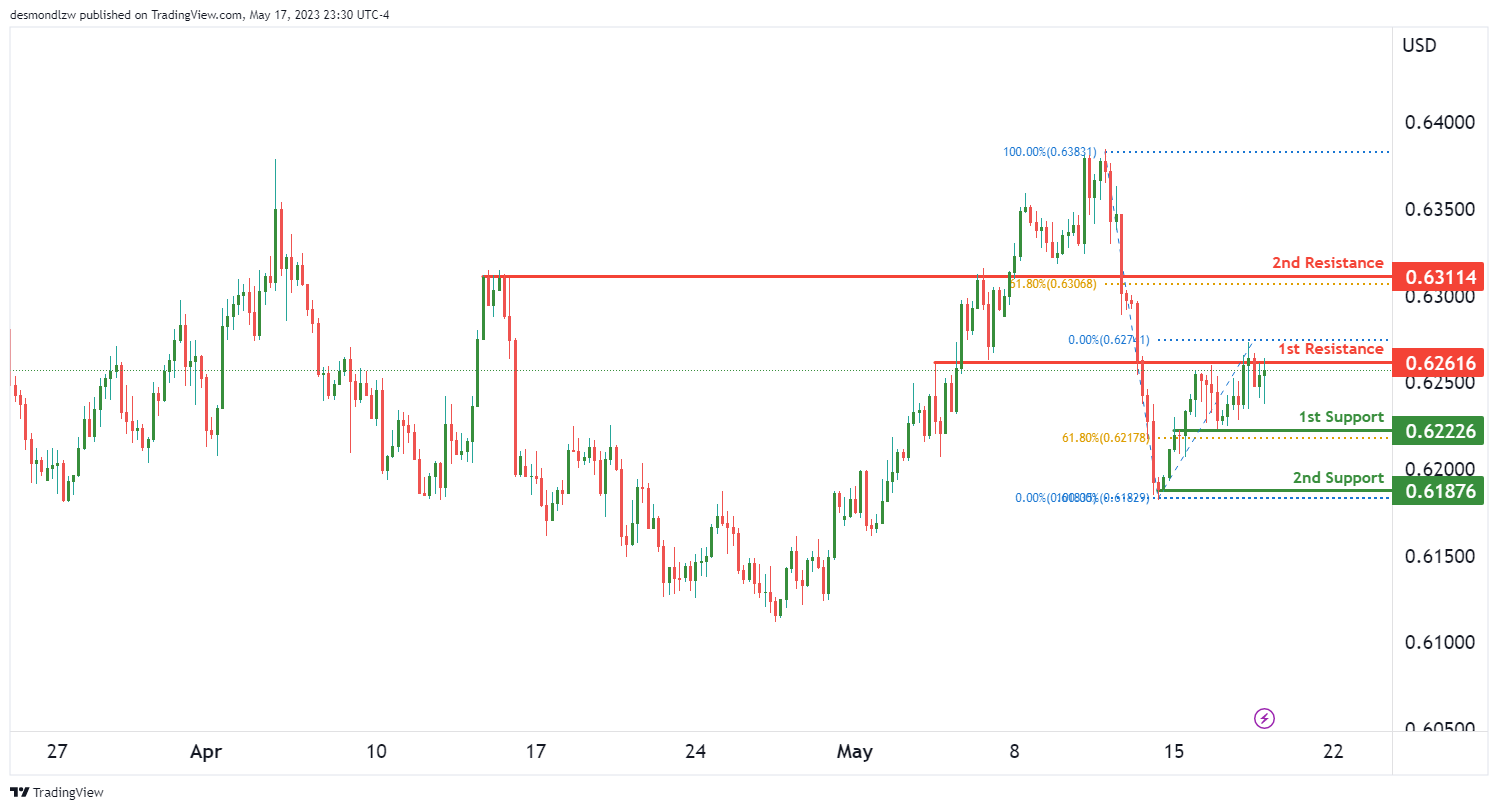
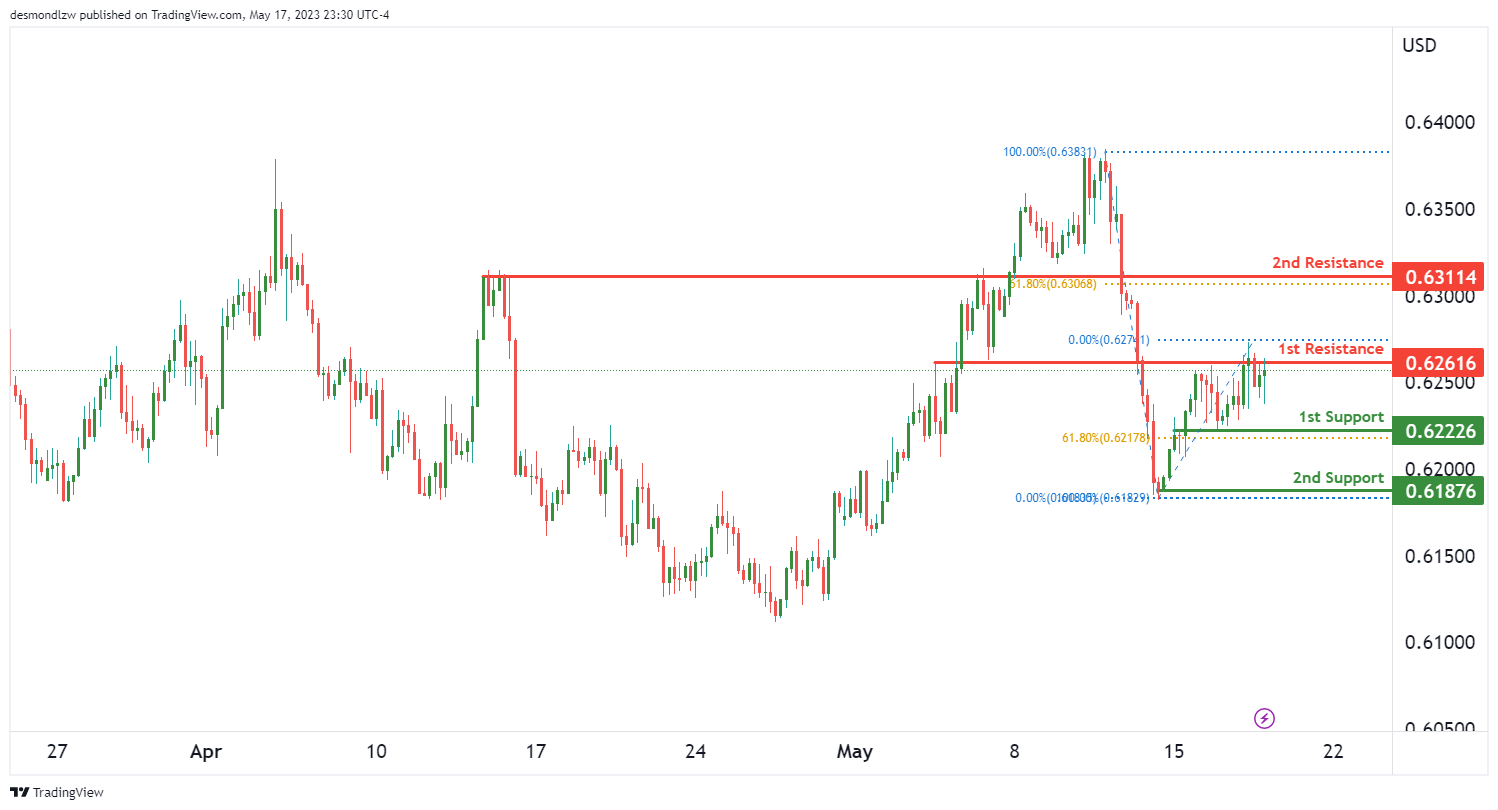
NZD/USD
The NZD/USD chart is currently exhibiting bullish momentum, indicating the potential for further upward movement.
In the short term, there is a possibility of a drop towards the first support level at 0.6222. This support level is identified as an overlap support and coincides with a 61.80% Fibonacci retracement, suggesting it could act as a strong price floor.
If the price reaches the first support and bounces from there, it could potentially rise towards the first resistance level at 0.6261. This resistance level is recognized as an overlap resistance.
Furthermore, there is a second support level at 0.6187, identified as a multi-swing low support, which provides additional support if the price were to drop further.
On the resistance side, the second resistance level at 0.6311 is a pullback resistance. This level, coinciding with a 61.80% Fibonacci retracement, could present a stronger barrier for the price.
Overall, the momentum of the NZD/USD chart is bullish, suggesting the potential for a drop to the first support level in the short term, followed by a bounce and a rise towards the first resistance level.
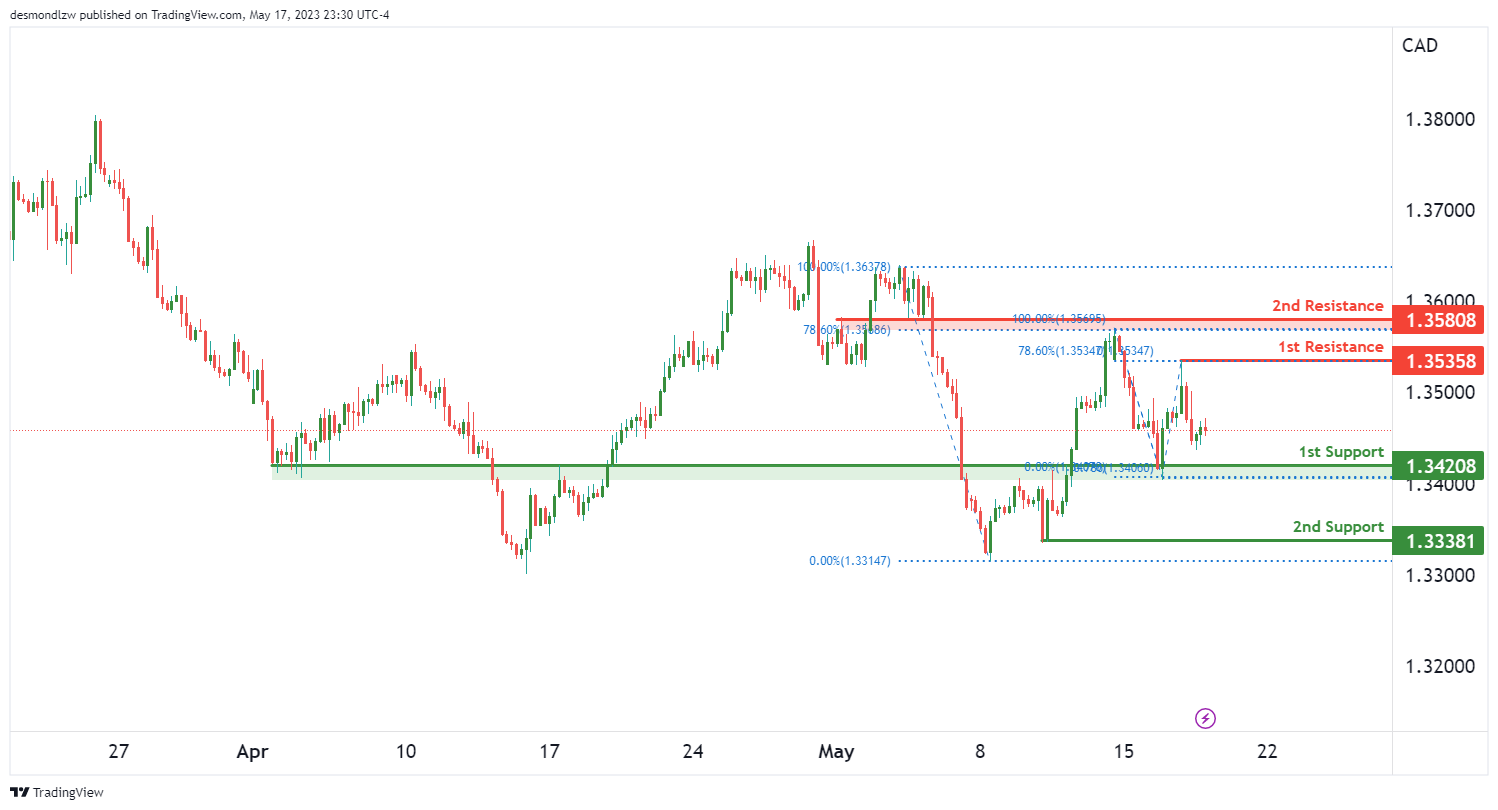
USD/CAD:
The USD/CAD chart is currently exhibiting bullish momentum, indicating the potential for further upward movement.
In the short term, there is a possibility of a bullish continuation towards the first resistance level at 1.3535. This resistance level is identified as a swing high resistance and coincides with a 78.60% Fibonacci retracement, suggesting it could pose a significant challenge for the price.
On the support side, the first support level at 1.3420 is recognized as an overlap support. This level may provide support if the price were to drop.
Additionally, there is a second support level at 1.3338, identified as a swing low support, which provides further support if the price were to drop.
For further upward movement, the second resistance level at 1.3580 is a pullback resistance. This level, coinciding with a 78.60% Fibonacci retracement, could present a stronger barrier for the price.
DJ30:
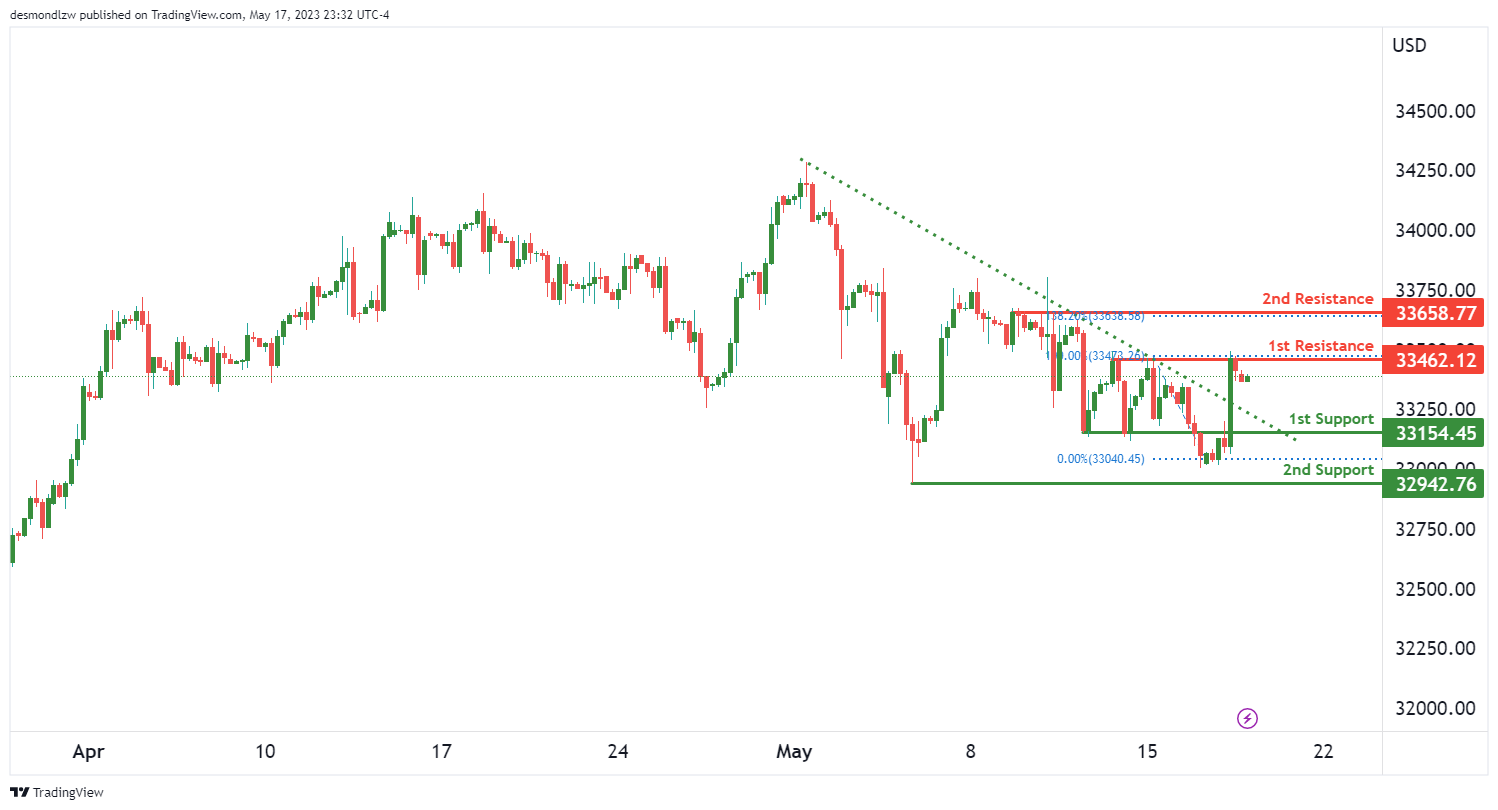
The DJ30 (Dow Jones Industrial Average) chart is currently displaying bullish momentum, suggesting the potential for further upward movement.
One of the factors contributing to this momentum is that the price has broken above a descending resistance line, triggering a potential bullish move.
In terms of potential price action, there is a possibility of a bullish breakout through the first resistance level at 33462.12. This level is identified as a multi-swing high resistance, indicating it could pose a significant challenge for the price. If the price successfully breaks through this level, it may rise towards the second resistance level at 33658.77. This level is also a multi-swing high resistance and coincides with a 138.20% Fibonacci extension, suggesting it could provide strong resistance.
On the support side, the first support level is at 33154.45, which is identified as a pullback support. This level may provide support if the price were to drop. Additionally, there is a second support level at 32942.76, recognized as a swing low support, providing further potential support for the price.
GER30:
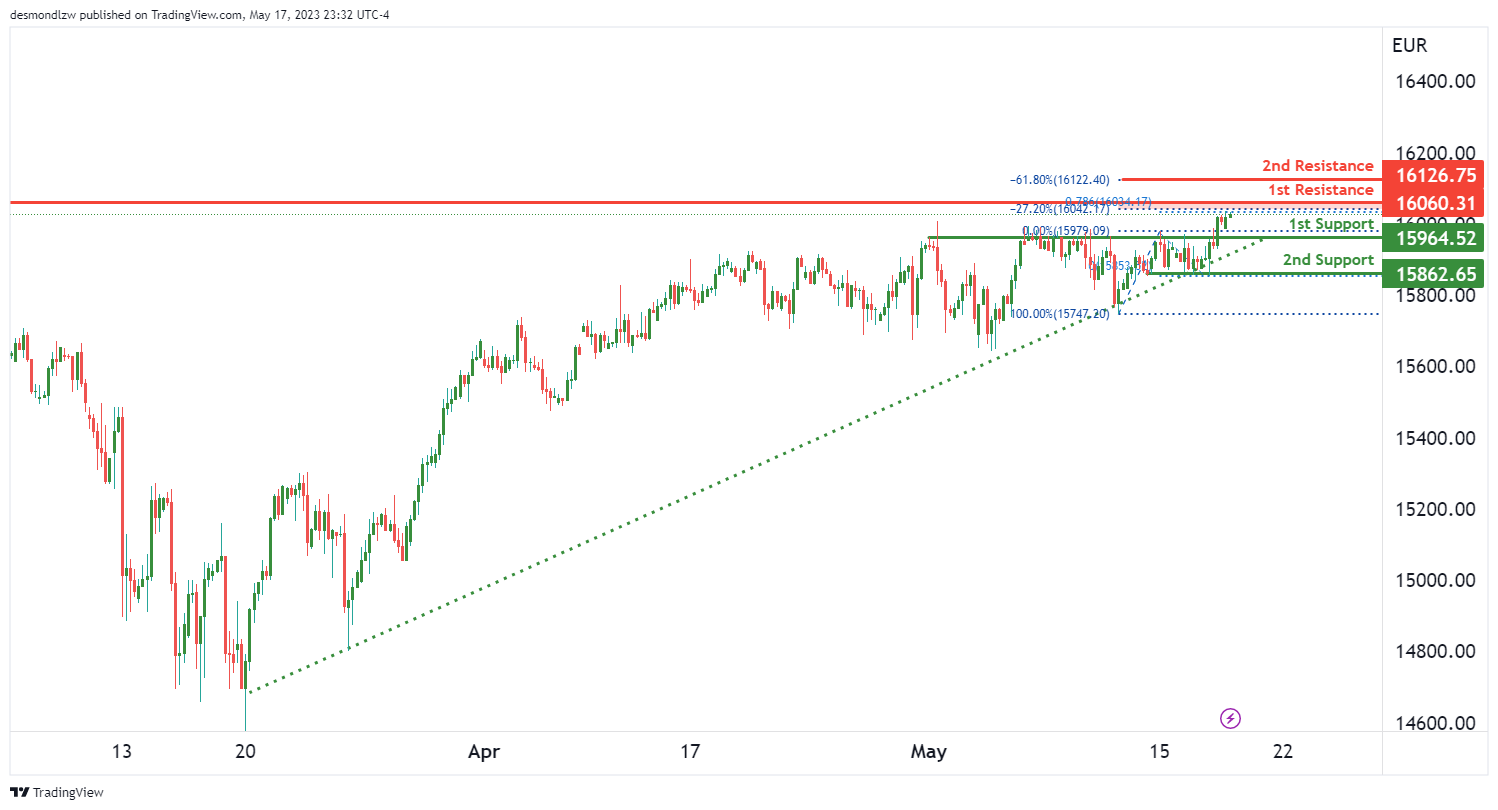
The GER30 (DAX 30) chart is currently showing bullish momentum, indicating the potential for further upward movement.
One of the factors contributing to this momentum is that the price is above a major ascending trend line, suggesting the presence of bullish momentum. Additionally, there is an ascending trend line acting as support, further reinforcing the bullish sentiment.
In terms of potential price action, there is a possibility of a bullish breakout through the first resistance level at 16060.31. This level is identified as a swing high resistance and may pose a challenge for the price. If the price successfully breaks through this level, it could potentially rise towards the second resistance level at 16126.75. This level is associated with a -61.8% Fibonacci expansion, which adds to its significance as a potential resistance level.
On the support side, the first support level is at 15964.52, identified as an overlap support. This level may provide support if the price were to drop. Additionally, there is a second support level at 15862.65, recognized as a multi-swing low support, which could provide additional support for the price.
BTC/USD:
The BTC/USD chart is currently showing bearish momentum, indicating a potential downward movement.
One of the factors contributing to this bearish momentum is that the price is below a major descending trend line, suggesting the presence of ongoing bearish pressure.
In terms of potential price action, there is a possibility of a bearish continuation towards the first support level at 26540. This level is identified as an overlap support and may act as a price floor. If the bearish momentum persists, the price could potentially drop further towards the second support level at 25807, which is recognized as a swing low support.
On the resistance side, the first resistance level is at 27675, identified as an overlap resistance. This level coincides with a 78.60% Fibonacci retracement and a 61.80% Fibonacci projection, indicating it is a significant level of resistance. Additionally, there is a second resistance level at 28291, which is also an overlap resistance.
Overall, the momentum of the BTC/USD chart is bearish, and there is a potential for a bearish continuation towards the first support level.
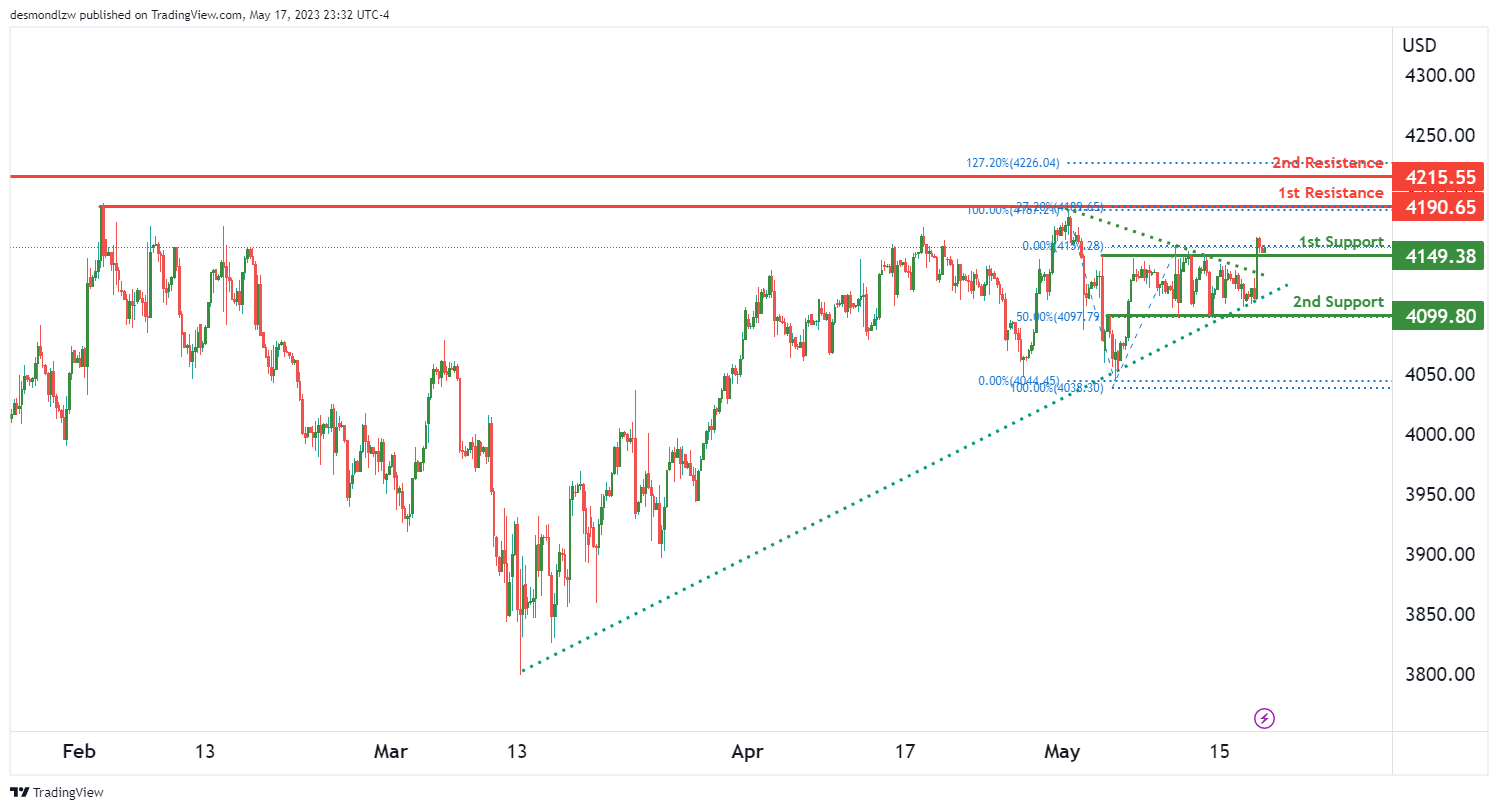
US500
The US500 chart is currently displaying bullish momentum, indicating a potential upward movement.
There is a possibility of a bullish continuation towards the first resistance level at 4190.65. This level is identified as a multi-swing high resistance and could pose a significant challenge for the price. If the bullish momentum continues, the price could potentially rise further towards the second resistance level at 4215.55, which is a swing high resistance and coincides with a 127.20% Fibonacci retracement.
On the support side, the first support level is at 4149.38, identified as a pullback support. This level could potentially act as a price floor. If the price were to drop, the second support level at 4099.80, an overlap support, could provide additional support. It coincides with a 50% Fibonacci retracement, making it a significant level to watch.
Additionally, a symmetrical triangle chart pattern is observed, and a breakout from the upper trendline indicates the start of a new bullish trend.
ETH/USD:
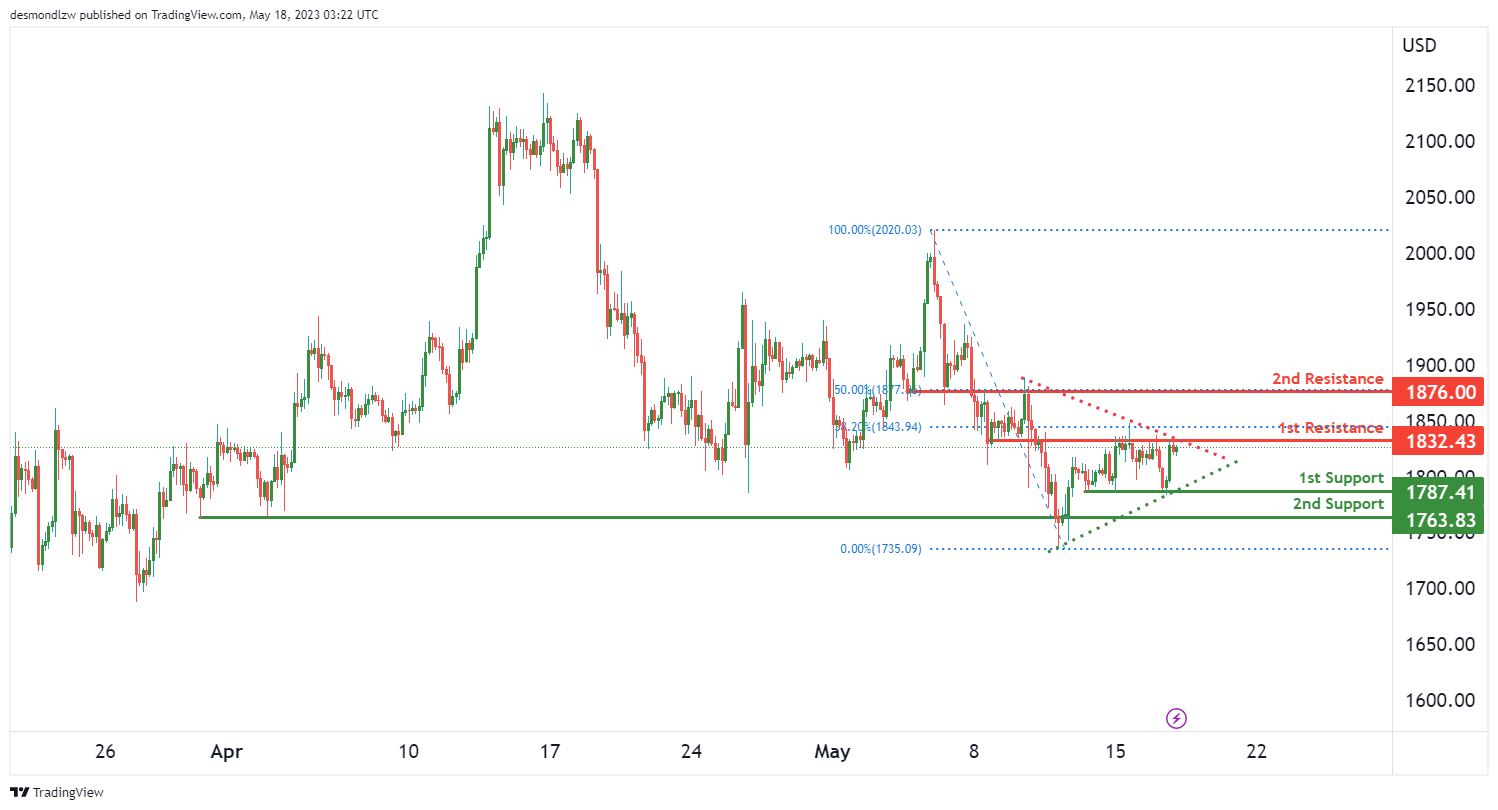
The EUR/USD chart is currently showing neutral momentum, indicating a lack of clear directional bias.
There is a possibility of price fluctuating between the first resistance and first support levels. The first support level is at 1787.41, identified as a multi-swing low support. This level may provide a price floor if the price were to drop. The second support level is at 1763.83, another multi-swing low support, and it coincides with a 50% Fibonacci retracement, making it a significant level to monitor.
On the resistance side, the first resistance level is at 1832.43, identified as an overlap resistance. If the price were to rise, this level could potentially act as a price ceiling. The second resistance level is at 1876.00, another overlap resistance, and it coincides with a 50% Fibonacci retracement.
In addition, a symmetrical triangle chart pattern is observed, which represents a period of consolidation before the price is forced to break out or break down. A break above the upper trendline of the pattern could signal a bullish breakout, while a break below the lower trendline might indicate a bearish breakdown.
WTI/USD:
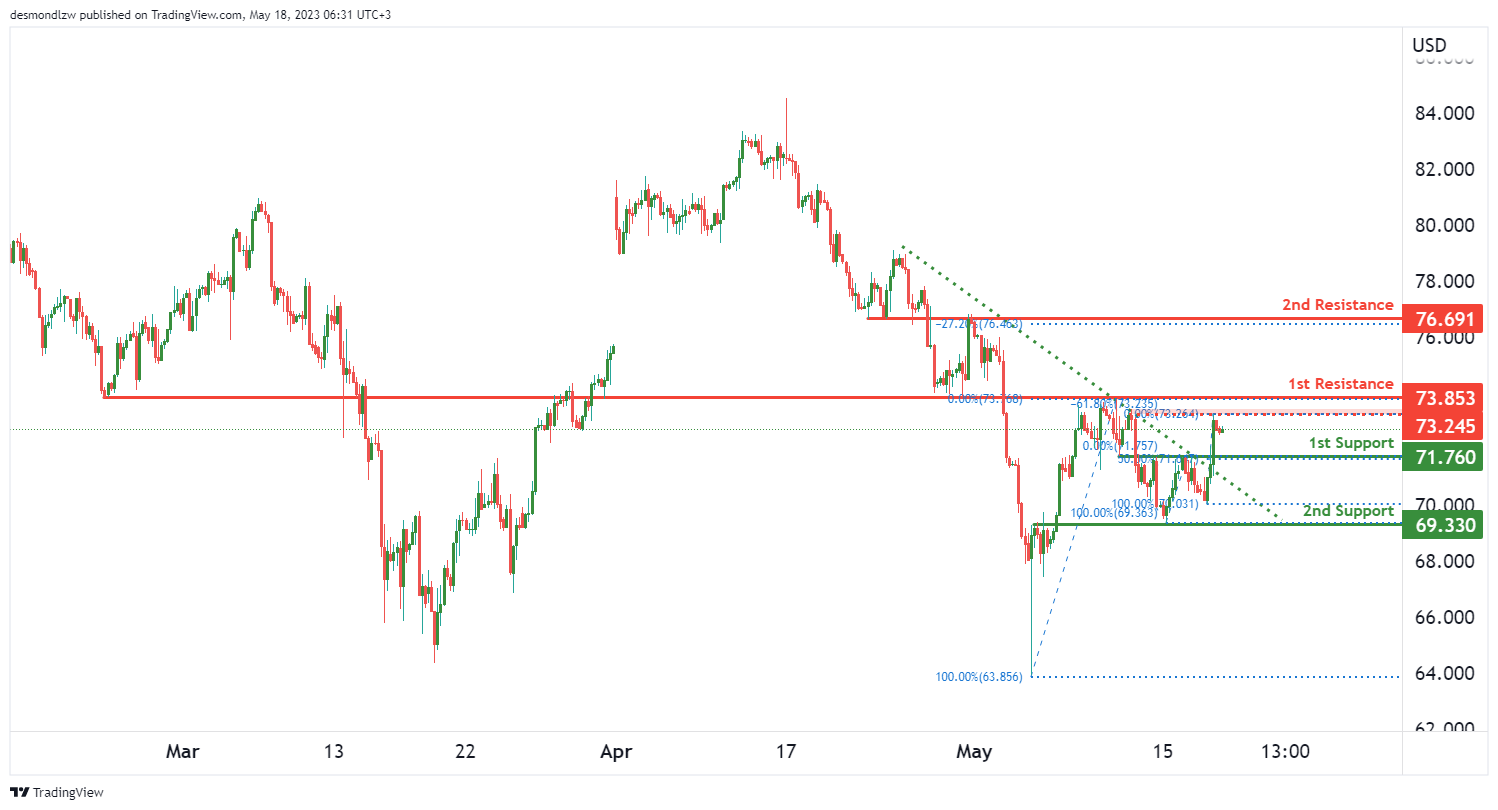
The WTI chart is currently demonstrating bullish momentum, supported by the fact that the price broke above a descending resistance line, triggering a potential bullish move.
In the short term, there is a possibility of the price dropping further towards the first support level at 71.76. This level is identified as a pullback support and coincides with a 50% Fibonacci retracement, making it a significant level to watch. If the price reaches this support level, it could potentially bounce from there.
The second support level is at 69.33, which is an overlap support. This level may also provide support if the price were to drop further.
On the resistance side, the first resistance level is at 73.85, identified as an overlap resistance. If the price were to rise, this level could potentially act as a price ceiling. The second resistance level is at 76.69, another overlap resistance, and it coincides with a -27% Fibonacci expansion.
There is also an intermediate resistance level at 73.24, which has been a significant multi-swing high resistance in the past.
Overall, the momentum of the WTI chart is bullish, and the price could potentially drop to the first support before bouncing and rising towards the identified resistance levels.
XAU/USD (GOLD):
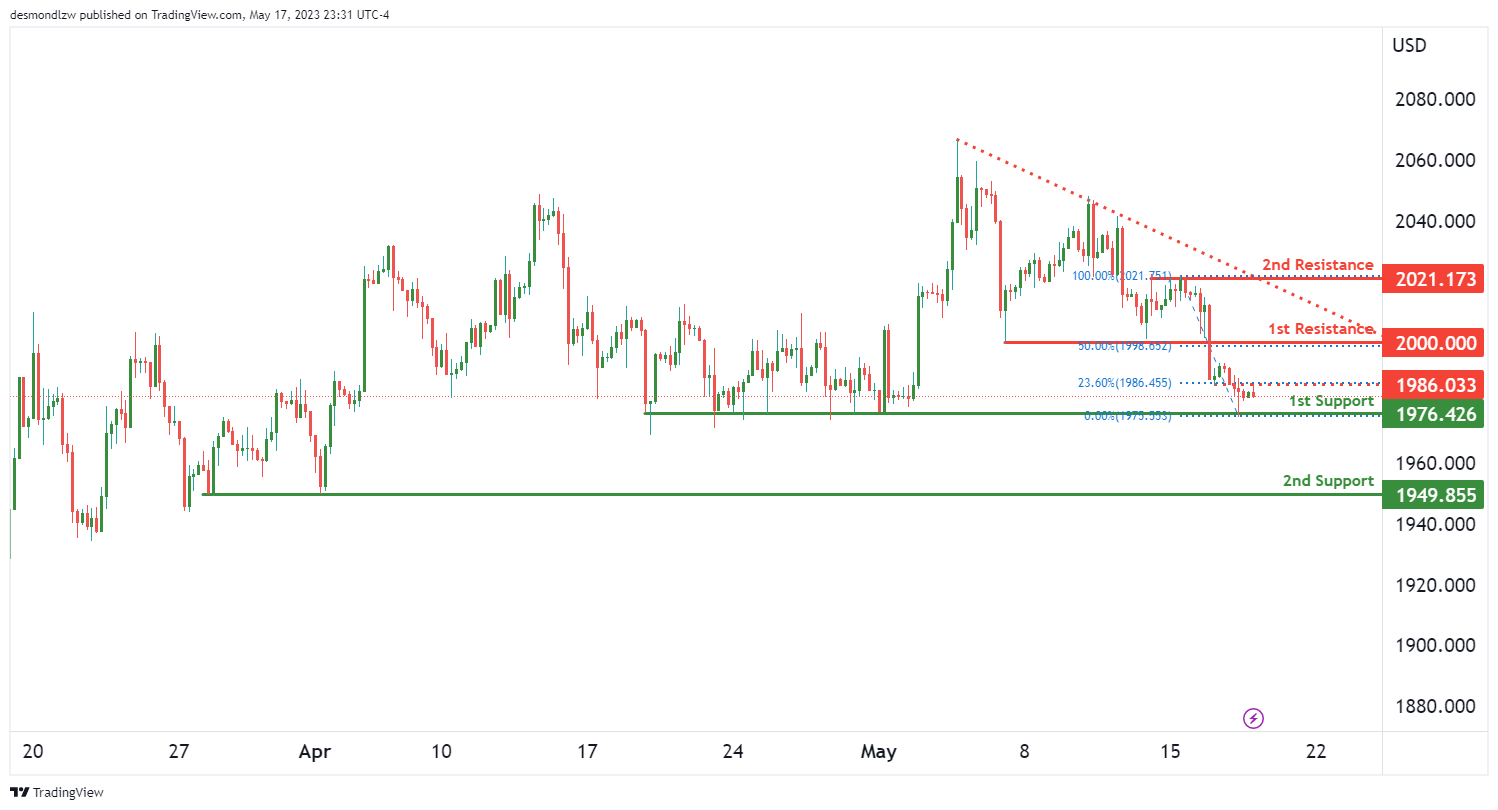
The XAU/USD chart is currently showing bearish momentum, indicated by the fact that the price is below a major descending trend line, suggesting further potential for bearish movement.
In terms of potential price action, there is a possibility of a bearish continuation towards the first support level at 1976.42. This level is identified as a multi-swing low support, indicating its significance. If the price were to drop further, it could find additional support at the second support level at 1949.85, which is another multi-swing low support.
On the resistance side, the first resistance level is at 2000.00, which is a pullback resistance and coincides with a 50% Fibonacci retracement. If the price were to rise, this level may present a significant hurdle. The second resistance level is at 2021.17, identified as a multi-swing high resistance.
Additionally, there is an intermediate resistance level at 1986.00, which is an overlap resistance and coincides with a 23.60% Fibonacci retracement. This level may provide additional resistance if the price attempts to move higher.
Japan’s exports grow at slowest pace since Feb 2021 despite setting record high for Apr
Japan's exports grew by a modest 2.6% yoy to JPY 8288B in April. Although this represented the lowest growth in exports since February 2021, it still marked the largest export figure for April on record.
A closer examination of the data reveals a shift in trading dynamics. Exports to China fell by -2.9% yoy, marking the fifth consecutive month of decline. The decrease was driven by downturns in shipments of cars, car parts, and steel. Similarly, exports to Asia overall declined by -6.6% yoy, continuing a contraction trend for the fourth month in a row.
However, things looked rosier elsewhere. Exports to the US and EU showed robust growth, rising by 10.5% yoy and 11.7% yoy respectively. This uptick was led by a rebound in exports of cars and car parts, which have seen easing supply constraints.
Contrasting with export trends, imports fell by -2.3% yoy to JPY 8721B, the first annual decline witnessed in 27 months. This decrease was largely attributed to a slump in imports of crude oil and liquefied natural gas. Consequently, Japan recorded a trade deficit of JPY -432B for the 21st month running.
In seasonally adjusted term, the situation presents a slightly different picture. Exports rose by 2.5% mom to JPY 8259B, while imports inched up by 0.1% mom to JPY 9276B. In light of this, trade deficit narrowed to JPY -1017B.
Australia employment down -4.3k in Apr, unemployment rate up to 3.7%
Australia employment contracted -4.3k in April, much worse than expectation of 25k growth. Full time job decreased -27.1k while part-time jobs rose 22.8k. Unemployment rate rose from 3.5% to 3.7%, above expectation of being unchanged at 3.5%. Participation rate dropped -0.1% to 66.7%. Employment-to-population ratio fell -0.2% to 64.2%. Monthly hours worked rose 2.6% mom or 49m hours.
Bjorn Jarvis, ABS head of labour statistics, said: "The small fall in employment followed an average monthly increase of around 39,000 people during the first quarter of this year." Meanwhile, both employment-to-population ratio and participation rate "were still well above pre-COVID-19 pandemic levels and close to their historical highs in 2022".