Sample Category Title
BTCUSD Remains Suppressed by 50-SMA
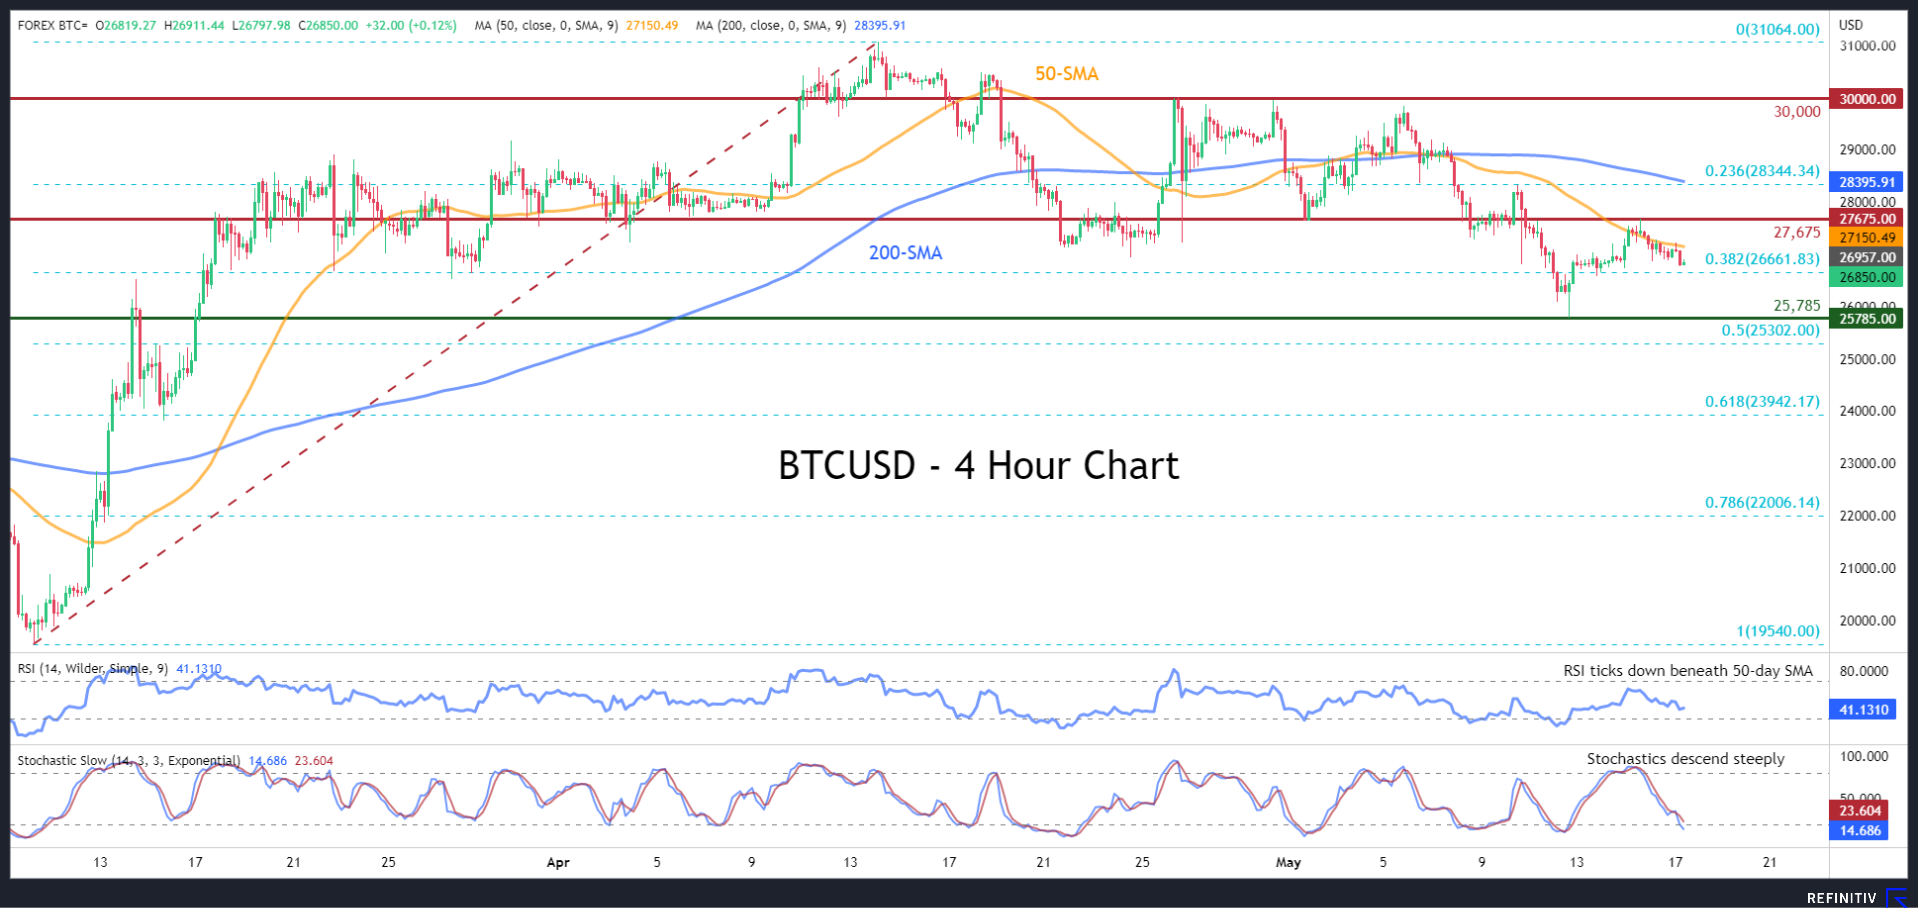
BTCUSD has been generating a structure of lower highs and lower lows after peaking at the 10-month high of 31,064 in mid-April. Even though the digital coin found its feet at the May bottom of 25,785 and attempted a rebound, it has been repeatedly held down by its 50-period simple moving average (SMA).
The momentum indicators currently suggest that near-term risks are tilted to the downside. Specifically, the RSI has flatlined beneath its 50-neutral mark, while the stochastic oscillator is descending sharply near the 20-oversold zone.
Should the 50-period SMA continue to cap the price’s upside, Bitcoin could decline towards 26,661, which is the 38.2% Fibonacci retracement of the 19,540-31,064 upleg. A break below that wall may set the stage for the May bottom of 25,785. Failing to halt there, the price might then challenge the 50.0% Fibo of 25,302.
Alternatively, bullish actions could propel the price towards the recent rejection region of 27,675. If that barricade fails, the spotlight may turn to the 23.6% Fibo of 28,344 before buyers attack the 30,000 psychological mark. Even higher, the 10-month peak of 31,064 could curb any upside moves.
Overall, BTCUSD has been stuck in a bearish pattern since mid-April, while its latest efforts for a recovery have been repelled multiple times by the 50-period SMA. Thus, a clear break above the 50-period SMA is needed to revive bulls’ hopes for a trend reversal.
Will Gold Have Another Bearish Round?
Gold attempted to recover some lost ground earlier in the day, but its bullish efforts proved short-lived around 1,993 in the four-hour chart as the broken support trendline switched to resistance.
The focus has turned back to the key support region of 1,976, which overlaps with the 38.2% Fibonacci retracement of the 1,804-2,079 uptrend. Given the oversold signals coming from the RSI and the Stochastic oscillator, there is a potential for an upside correction or some consolidation near that level. If selling forces persist, the precious metal may seek shelter around February’s peak of 1,960. The 50% Fibonacci level of 1,945 could next protect the market from sellers reaching the crossroads of two key trendlines around 1,925.
On the upside, there are several obstacles which could ruin potential bullish actions. Above the 1,993 mark, the simple moving averages (SMAs) and the 23.6% Fibonacci level could immediately cap the price within the 2,005-2,015 territory. Notably, the short-term descending trendline is placed in the same territory. Then, the steeper support-turned-resistance trendline at 2,028 could be another hurdle, blocking the way towards the crucial 2,048 barrier. Beyond the latter point, all the attention will shift to the record high of 2,079.
All in all, gold is facing a discouraging situation, likely preparing for another bearish round following the pullback from 1,993. Yet, selling pressures might prove limited as the key floor of 1,976 is nearby.
Gold Cools Off After the Rally and Chooses a Path Forward
Gold had made impressive moves yesterday before active trading in New York. Still, comments from Fed officials, combined with the release of relatively strong industrial production data, pushed the price back almost $30 to $1990, where it remains at the time of writing.
The Fed’s Loretta Meister noted yesterday that US interest rates have not yet reached a level where the central bank could stop tightening, given the resilience of inflation. Influential Fed member John Williams noted that inflation is “gradually moving in the right direction” but remains “unacceptably high”.
In addition, the bond markets took a positive view of the outcome of the McCarthy-Biden meeting to discuss the debt ceiling, although no agreement was reached.
The market also reacted positively to the Fed’s report on industrial production growth of 0.5% in April, of which the manufacturing sector added 1%, much higher than expected.
As a result, the market is again pricing in more than a 20% chance of another rate hike in mid-June. These are far from extreme levels, as the probability has been above 30% since the second half of April. Nonetheless, this revision of expectations is creating some pull for the dollar. The dollar index has risen by 2% since last week, putting pressure on precious metals and cryptocurrencies.
As a result of yesterday’s fall, gold has broken out of the bullish range formed at the end of March. Gold is now close to the April lows from which it was then supported.
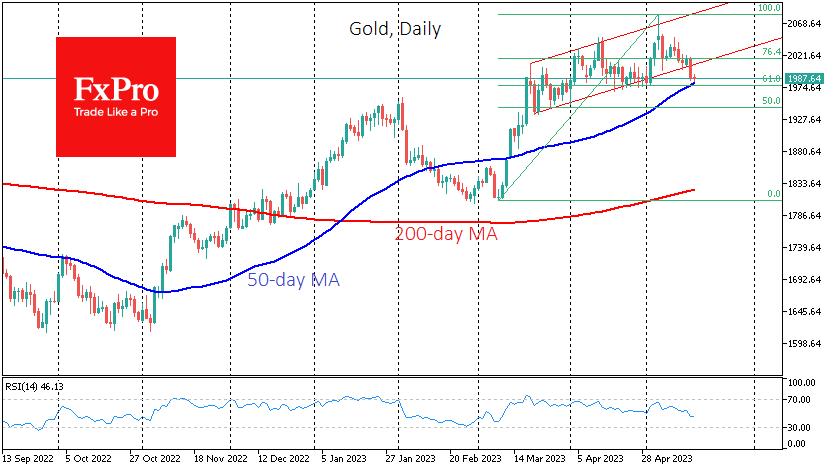
At the same time, gold is approaching its 50-day moving average, above which it rallied at the end of last year and confirmed in March. At just below $1970 is the 61.8% retracement level of the rally from the March lows to the early May highs.
From this perspective, a sharp pullback below $1980 would be an essential signal of a change in market sentiment, forcing a further drop to $1950 (the February high).
However, the fall below the $1980 scenario does not yet appear mainstream. The recent pullback has cleared the overbought conditions on the daily timeframes and opened the way to the upside.
The next advance could take gold to new highs if it finds some support. A technical target for the bulls could be the $2250 level, representing 161.8% of the last two-month rally. The 12-month target for the gold bugs seems to be an ambitious $2640.

Australian Dollar Calm after Wage Growth Accelerates
- Australia wage growth accelerates in Q1
- JP Morgan expects Fed to trim rates
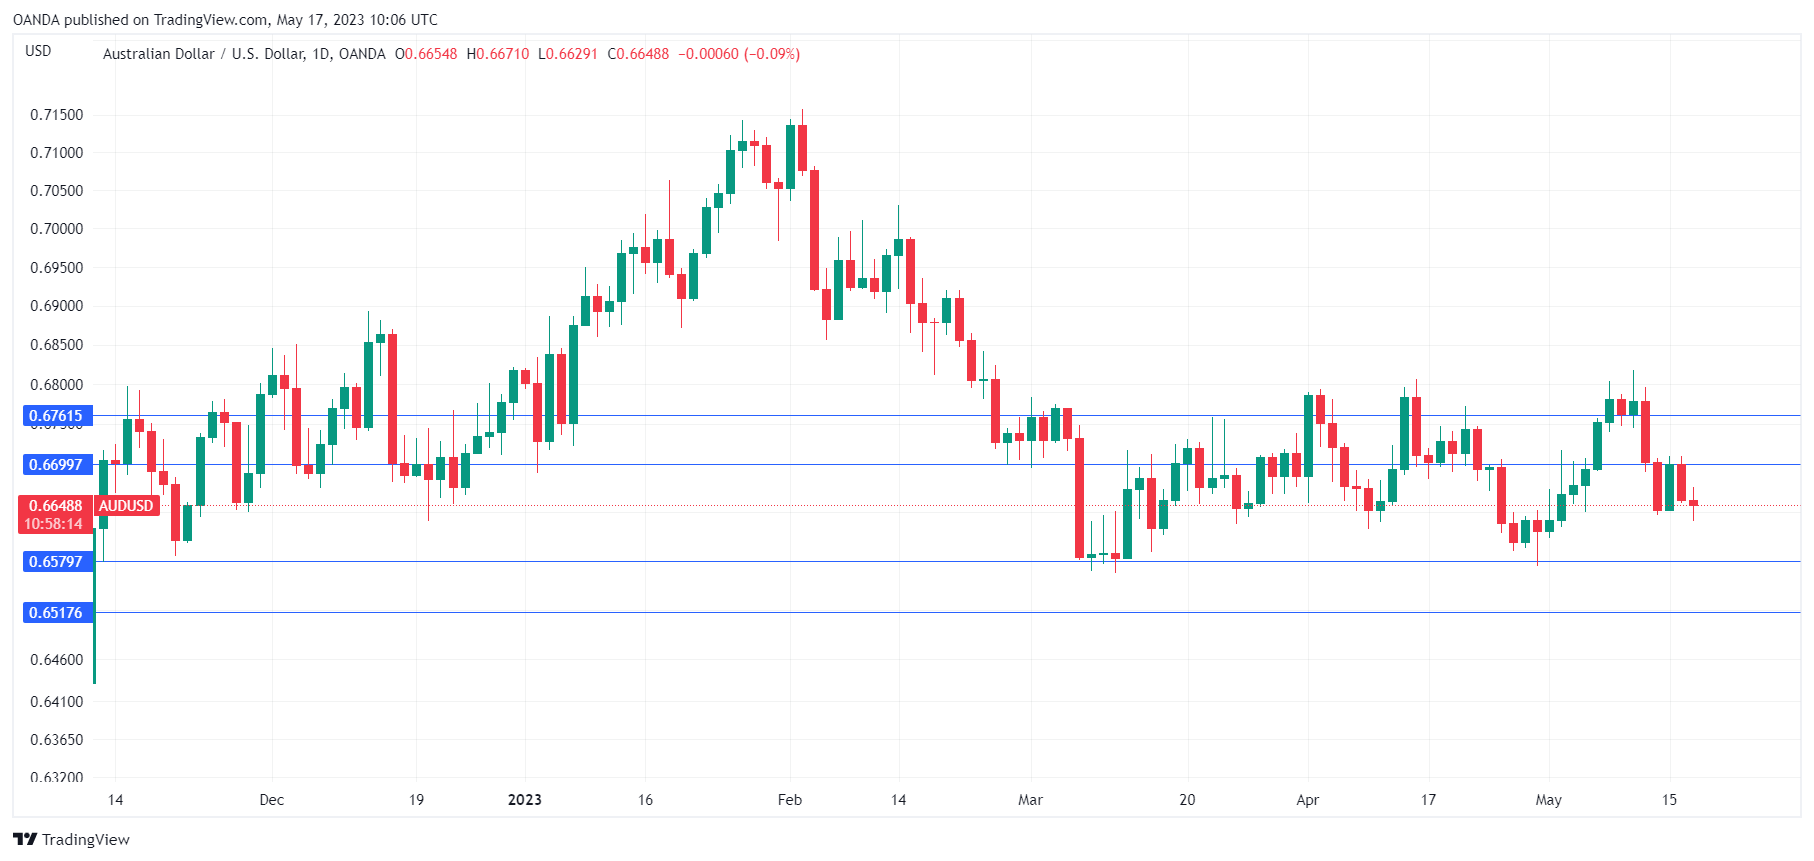
The Australian dollar is steady on Wednesday. AUD/USD is trading at 0.6650 in Europe, down 0.06% on the day.
Australian wage growth rises
Australia’s wage price index jumped in the first quarter. Wage growth rose 3.7% y/y, following an upwardly revised 3.4% in Q4 2022 and above the estimate of 3.6%. On a quarterly basis, wages rose 0.8%, unchanged from Q4 and just below the estimate of 0.9%.
The RBA is determined to bring inflation back down to the 2% target, and 3.7% wage growth is simply too high for the central bank. This supports an argument for the RBA to lift rates at the June meeting (or later down the road). The markets have priced in a 100% probability of a pause in June, according to the ASX RBA Rate Tracker.
The RBA minutes from the May meeting noted that the decision to raise rates was a close one, but concerns about inflation becoming entrenched won out and the Bank hiked by 25 basis points. The minutes didn’t provide much guidance for future moves, with policy makers saying further rates might be required, depending on economic and inflation data.
The Federal Reserve trotted out some members earlier this week to reiterate that no rate cuts are coming, and market pricing for a rate cut before the end of the year have fallen. According to CME’s FedWatch, the odds of a cut in September are 52%, compared to 72% a week ago. Still, there is support for rate cuts. JP Morgan said on Tuesday that “the market is right to be penciling in cuts”, as inflation remains too high and the US was likely headed for a recession.
AUD/USD Technical
- AUD/USD is putting pressure on resistance at 0.6699. This is followed by 0.6761
- 0.6579 and 0.6517 are providing support
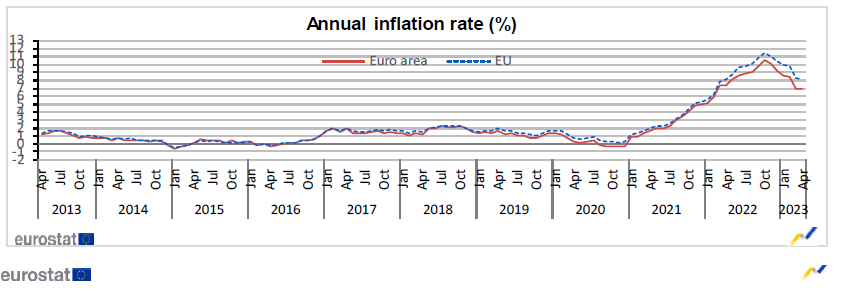
Eurozone CPI finalized at 7% yoy in Apr, CPI core at 5.6% yoy
Eurozone CPI was finalized at 7.0% yoy in April, up from March's 6.9% yoy. The highest contribution to came from food, alcohol & tobacco (+2.75%), followed by services (+2.21%), non-energy industrial goods (+1.62%) and energy (+0.38%). CPI core (excluding energy, food, alcohol & tobacco) was finalized at 5.6% yoy, down from prior month's 5.7% yoy.
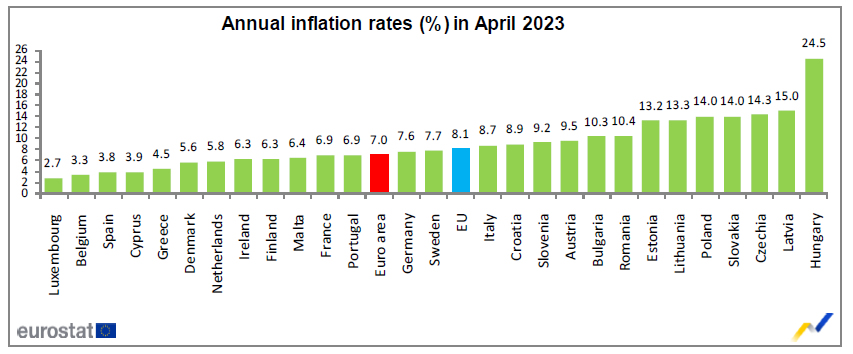
EU CPI was finalized at 8.1% yoy. The lowest annual rates were registered in Luxembourg (2.7%), Belgium (3.3%) and Spain (3.8%). The highest annual rates were recorded in Hungary (24.5%), Latvia (15.0%) and Czechia (14.3%). Compared with March, annual inflation fell in twenty-two Member States and rose in five.
USD/JPY: Key Barriers in Focus But Consolidation Likely to Precede Attack
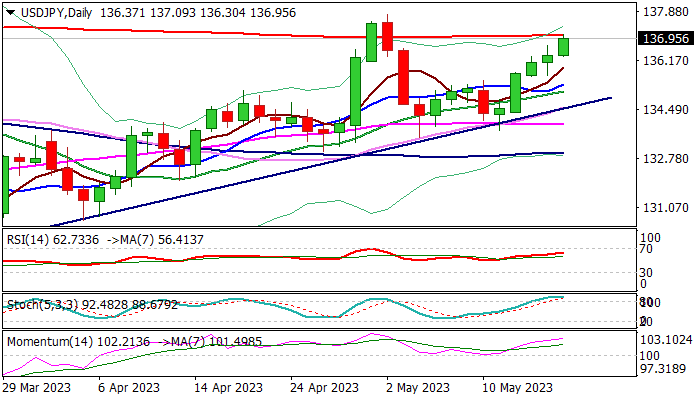
Strong bullish acceleration extends into fifth straight day and cracks 200DMA (137.05), with key barriers at 137.77 (May 2 top) and 137.90 (Mar 8) in focus.
Daily studies in full bullish setup support the action, along with last Thursday’s strong downside rejection at the trendline support/55DMA (which left a bear-trap) and subsequent rally on Friday (up 1%, the biggest daily gain since Apr 28).
Violation of 134.77/90 pivot would generate strong bullish signal for continuation of larger recovery rally from 127.22 (2023 low of Jan 16) and expose targets at 139.58 (50% retracement of 151.94/127.22) and 140.00 (psychological).
However, overbought conditions warn of headwinds which could keep the action on hold for consolidation/limited correction.
Extended dips should find ground above rising 10DMA (135.34) to keep bulls in play for fresh push higher.
Res: 137.54; 137.77; 137.90; 138.17.
Sup: 136.30; 135.93; 135.34; 134.89.
GBP/JPY Daily Outlook
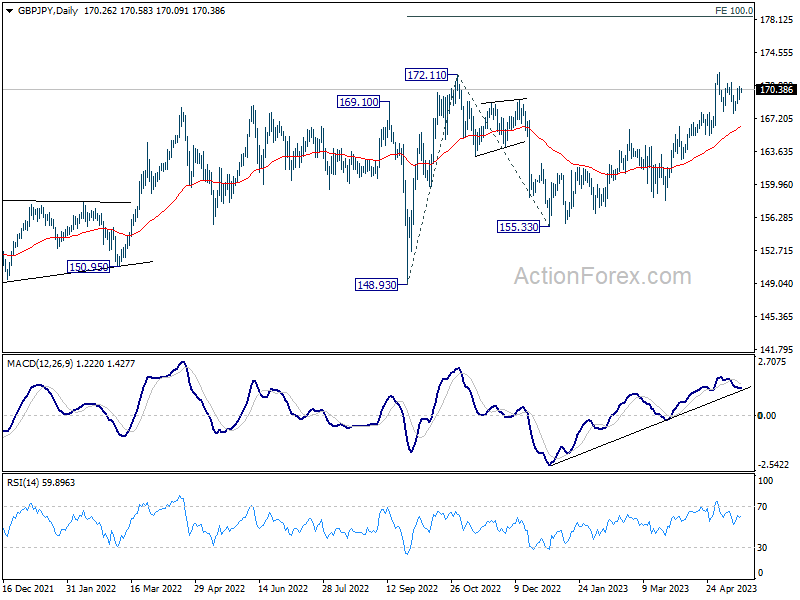
Daily Pivots: (S1) 169.52; (P) 170.17; (R1) 170.94; More...
Intraday bias in GBP/JPY remains neutral first and outlook is unchanged. On the upside, break of 172.30 will resume larger up trend to 100% projection of 148.93 to 172.11 from 155.33 at 178.51. Nevertheless, firm break of 167.95 should confirm short term topping, and turn bias back to the downside for deeper pull back to 165.40 support and possible below instead.
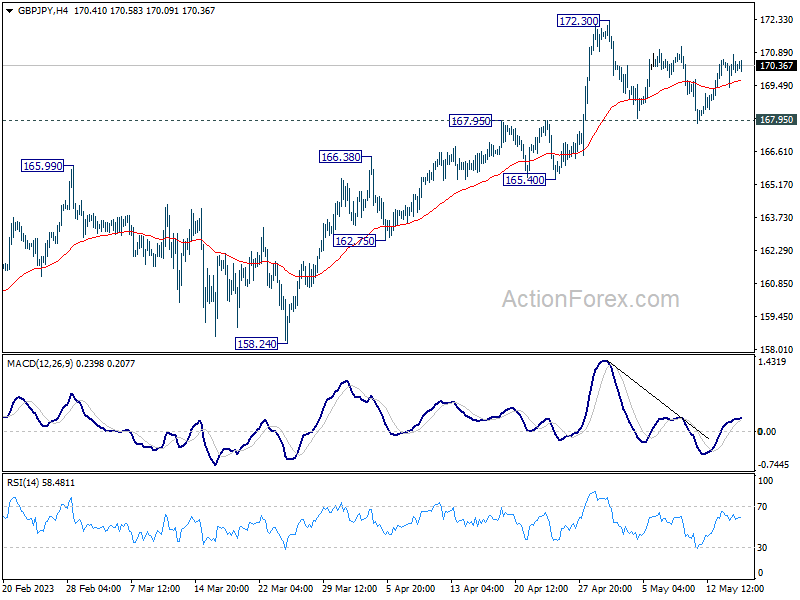
In the bigger picture, focus stays on 172.11 resistance (2022 high). Decisive break there will resume whole up trend from 123.94 (2020 low). Next target will be 161.8% projection of 122.75 (2016 low) to 156.59 (2018 high) from 123.94 at 178.69. Nevertheless, firm break of 165.40 support will indicate rejection by 172.11 and extend the corrective pattern from there with another falling leg.
EUR/JPY Daily Outlook
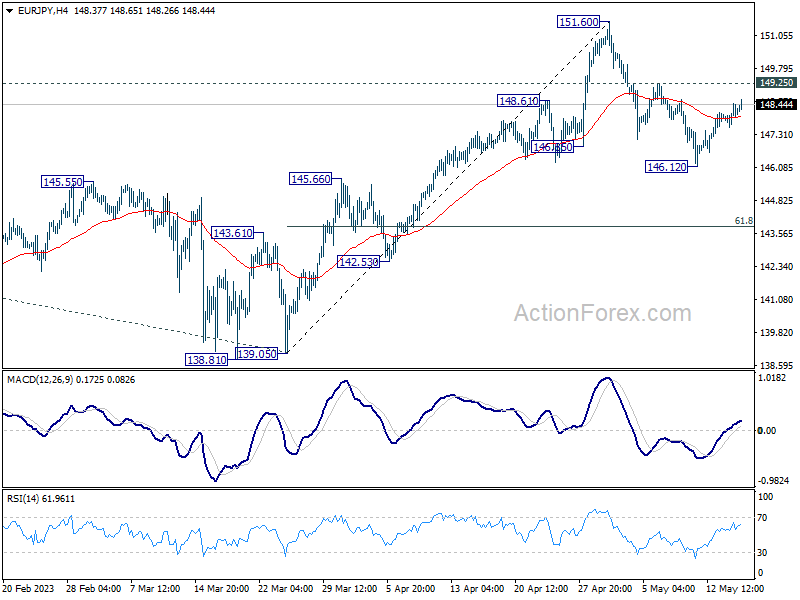
Daily Pivots: (S1) 147.67; (P) 148.09; (R1) 148.56; More....
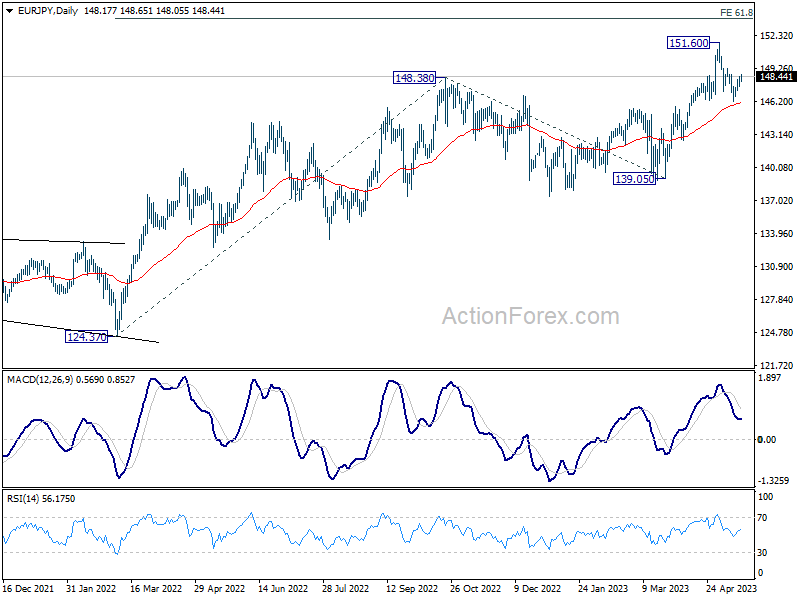
No change in EUR/JPY's outlook and intraday bias stays neutral. Further decline is in favor as long as 149.25 resistance holds. Sustained trading below 55 D EMA (now at 146.01) will bring deeper pull back to 61.8% retracement of 139.05 to 151.60 at 143.84. On the upside, though, firm break of 149.25 will turn bias back to the upside for retesting 151.60 high instead.
In the bigger picture, rise from 114.42 (2020 low) is in progress. Next target is 61.8% projection of 124.37 to 148.38 from 138.81 at 153.64. Sustained break there will pave the way to 100% projection at 162.82. For now, medium term outlook will remain bullish as long as 139.05 support holds, even in case of deep pull back.
EUR/GBP Daily Outlook
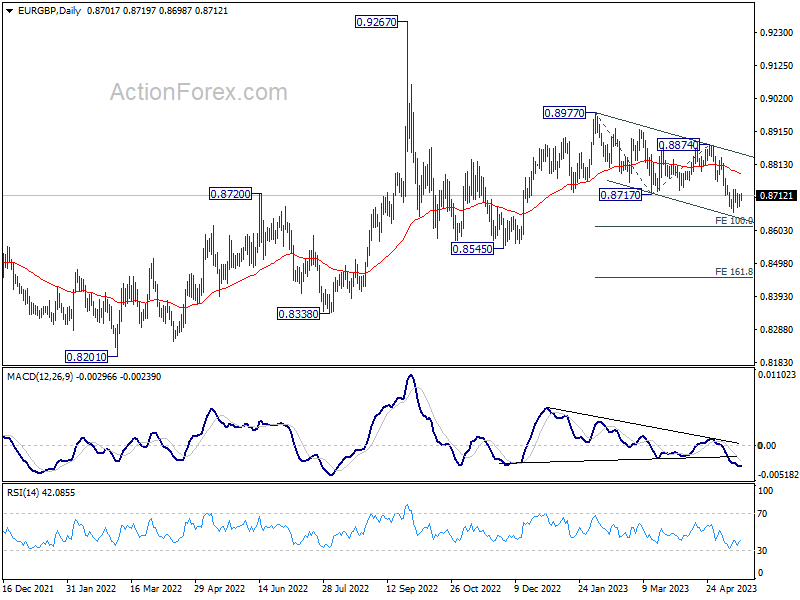
Daily Pivots: (S1) 0.8681; (P) 0.8699; (R1) 0.8720; More...
Intraday bias in EUR/GBP stays neutral as consolidation from 0.8660 is still in progress. Further decline is expected as long as 0.8758 resistance holds. On the downside, break of 0.8660 will resume recent decline to 100% projection of 0.8977 to 0.8717 from 0.8874 at 0.8614. Nevertheless, break of 0.8758 minor resistance will turn bias back to the upside for stronger rebound.
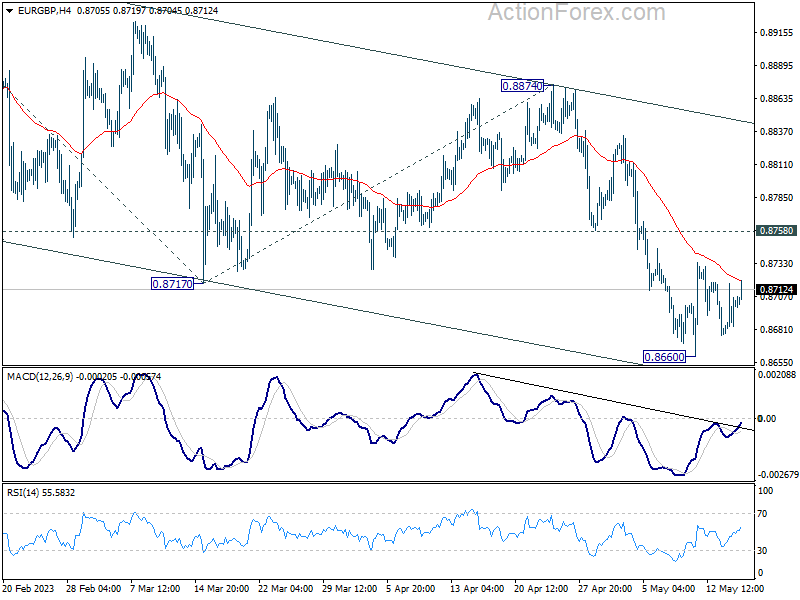
In the bigger picture, current development argues that whole decline from 0.9267 (2022 high) is still in progress. This is part of the long term range pattern from 0.9499 (2020 high). Deeper fall would be seen through 0.8545 support. his will now remain the favored case as long as 0.8874 resistance holds.
EUR/AUD Daily Outlook
Daily Pivots: (S1) 1.6247; (P) 1.6290; (R1) 1.6365; More...
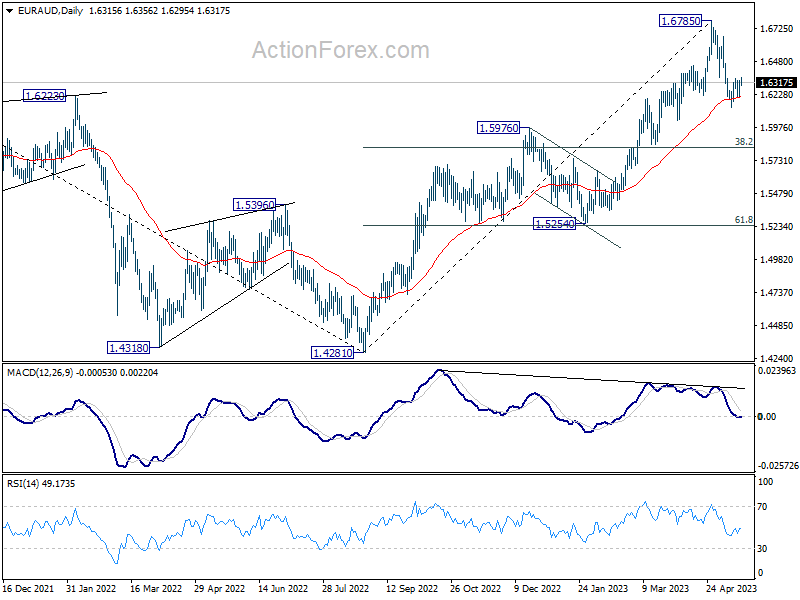
Intraday bias in EUR/AUD remains neutral as it's still bounded in consolidation from 1.6134. Further decline is expected with 1.634 minor resistance intact. Considering bearish divergence condition in D MACD, fall from 1.6785 might be a correction to whole up trend from 1.4281. Break of 1.6134 will target 38.2 retracement of 1.4281 to 1.6785 at 1.5828, which is inside 1.5254/5976 support zone. Nevertheless, sustained break of 1.6354 minor resistance will turn bias back to the upside for retesting 1.6785 high instead.
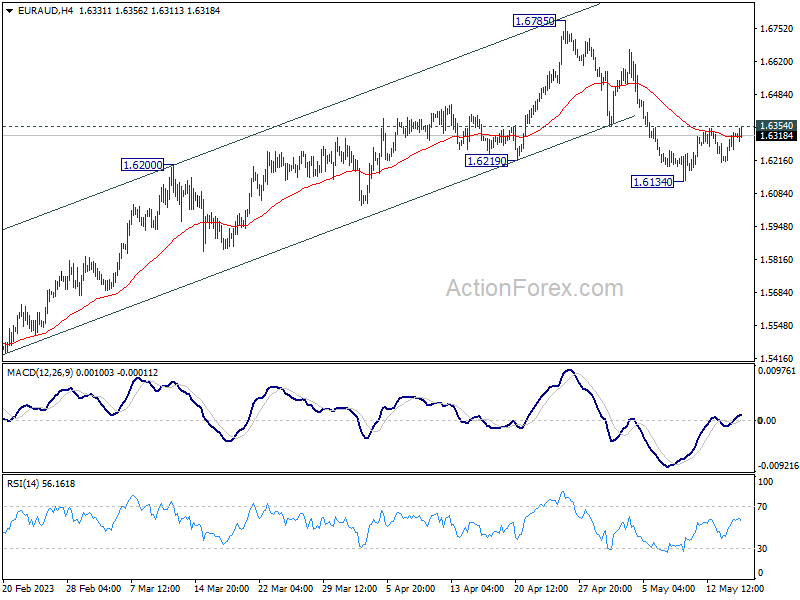
In the bigger picture, whole down trend from 1.9799 (2020 high) should have completed at 1.4281 (2022 low). Further rise should be seen to 61.8% retracement of 1.9799 to 1.4281 at 1.7691 next. For now, outlook will stay bullish as long as 1.5976 resistance turned support holds, even in case of deep pull back.