Sample Category Title
GBP/USD: Bulls Regain Traction and Generate Initial Signal that Correction Has Bottomed
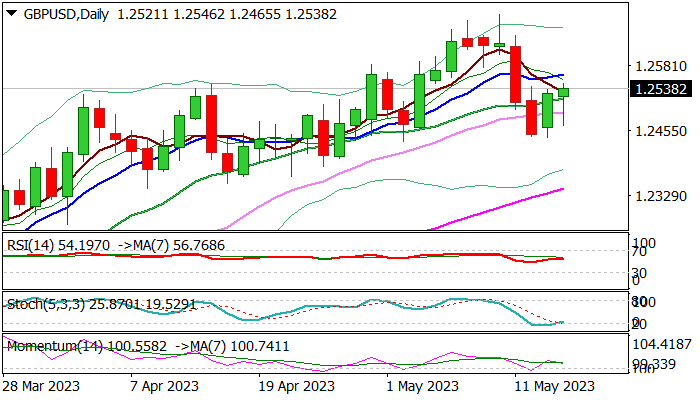
Cable quickly regained ground after post-UK jobs data dip below 1.25 handle, following short-lived negative impact from higher unemployment and jobless claims, as prevailing expectations that the BoE would deliver another rate hike in June continue to underpin pound.
Fresh advance, if sustained, would generate an initial signal that correction from 1.2679 peak (May 10) might be over.
Look for signal on close above cracked Fibo barrier at 1.2534 (38.2% of 1.2679/1.2444), which will require verification on lift and close above 1.2562 (10DMA/50% retracement) and open way for further recovery towards targets at 1.2590 and 1.2624 (Fibo 61.8% and 76.4% respectively) in extension).
This would bring daily MA’s into full bullish setup and contribute to existing signals from bullish momentum and Stochastic reversing from oversold territory.
Today’s long tailed daily candle also signals strong bids, though close above broken 20DMA (1.2517) is needed to keep near-term bias with bulls.
Res: 1.2562; 1.2590; 1.2624; 1.2640.
Sup: 1.2518; 1.2472; 1.2444; 1.2402.
Dollar Index in Defensive after a Double Upside Rejection
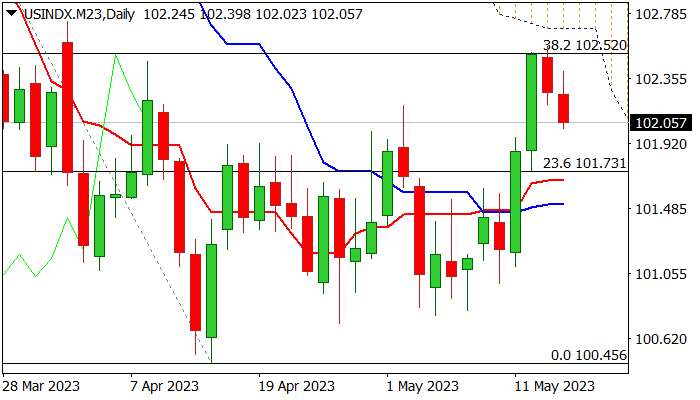
The dollar dipped further on Tuesday morning, extending pullback into second consecutive day after bulls repeatedly failed to break through pivotal Fibo support at 102.52 (38.2% of 105.85/100.45 downleg).
Upside rejection formed a double-top and signals a bull-trap, which adds to the downside pressure.
Conflicting signals on daily chart (strong bullish momentum, overbought stochastic and MA’s in mixed setup) require caution as last week’s strong recovery stalled at a breakpoint zone, also weighed by the nearby base of falling and thickening daily Ichimoku cloud (102.68).
The action failed to violate these barriers and generate fresh bullish signals for further gains, as subsequent pullback shifts near-term risk to the downside, although hopes that bulls may regain ground would be still alive if dips stay above 101.70 (broken Fibo 23.6% / daily Tenkan-sen).
Near-term action remains weighed by uncertainty over debt ceiling crisis, as President Biden was optimistic, while Republicans say that two sides are still far from reaching a deal, ahead of the expected meeting later today.
Res: 102.52; 102.68; 103.15; 103.26.
Sup: 101.91; 101.70; 101.52; 101.09.
S&P500 (SPX) Elliott Wave: Calling The Rally From The Equal Legs Area
In this technical article we’re going to take a quick look at the Elliott Wave charts of SPX published in membership area of the website. As our members know, S&P500 is trading within the cycle from the October 2022 low, which is unfolding as 5 waves structure. We got 3 waves pull back which found buyers right at equal legs area as we expected. In the further text we are going to explain the Elliott Wave Forecast
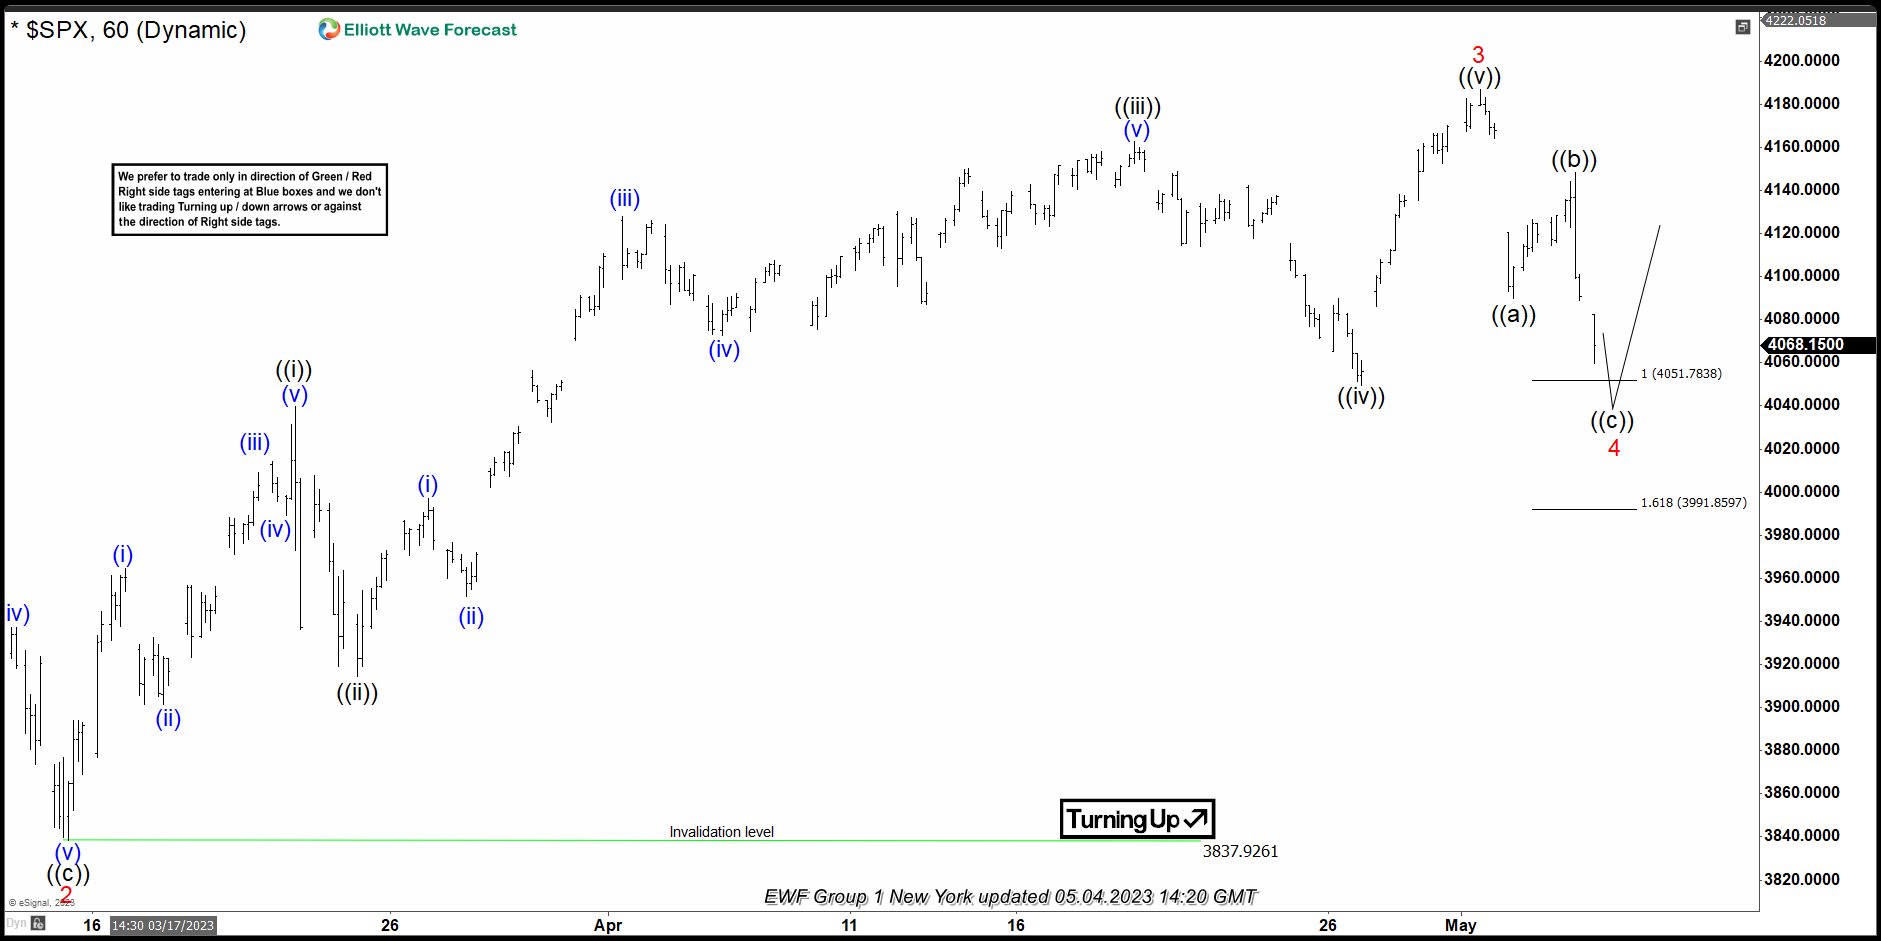
SPX 1h Elliott Wave Analysis 05.04.2023
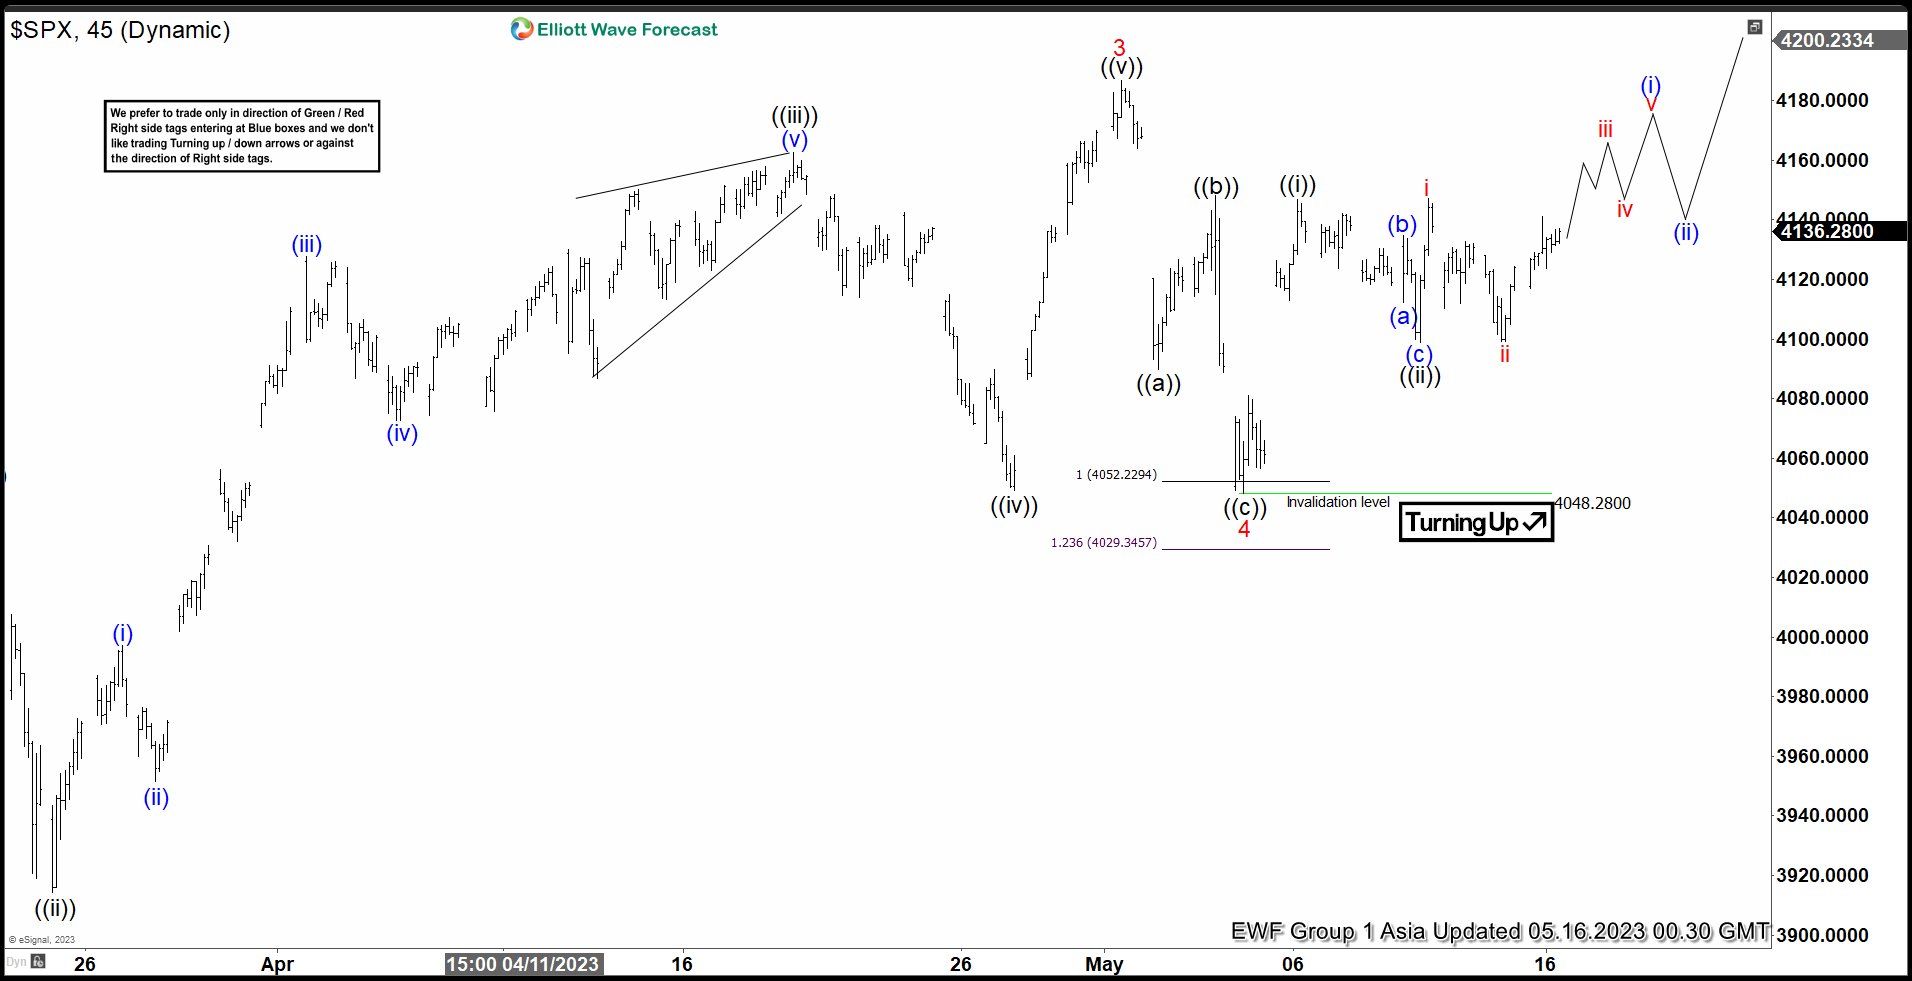
SPX is doing wave 4 red pull back. The index is correcting the cycle from the 3837.92 low. Pull back looks incomplete at the moment. It’s still short of equal legs area that comes at 4051.78-3991.85. At that area SPX should ideally find buyers for further rally in wave 5 red or for a 3 waves bounce at least.
SPX 1h Elliott Wave Analysis 05.16.2023
SPX made extension down toward equal legs area as we expected. Buyers appeared at the marked extreme zone and we are getting good reaction from there. As far as 4048.28 low holds, SPX should ideally keep trading higher in wave 5 red targeting 4218.9-4271.7 area.
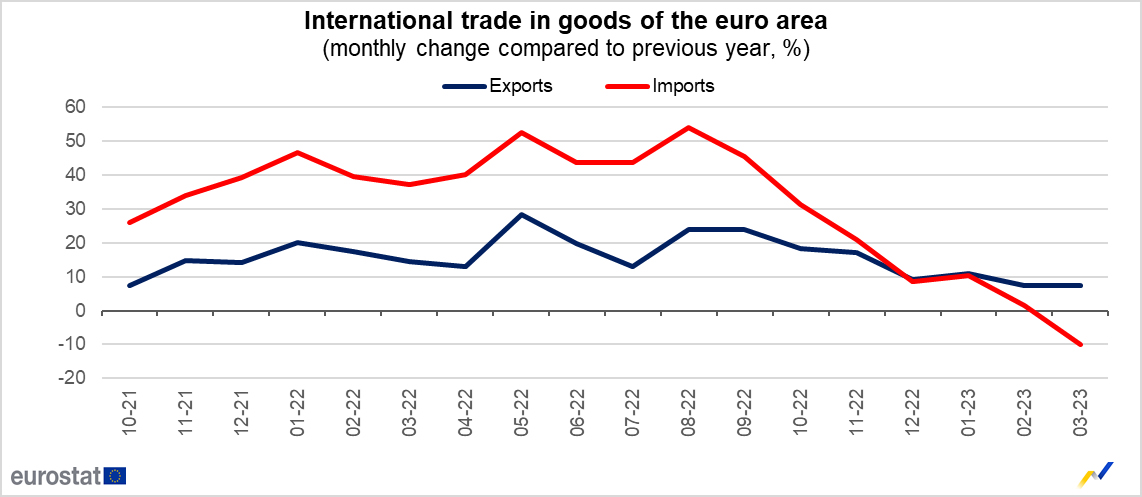
Eurozone imports fell -10% yoy in Mar, exports rose 7.5% yoy
Eurozone goods exports to the rest of the world rose 7.5% yoy to EUR 269.2B in March. Imports fell -10.0% yoy to EUR 243.5B. Trade surplus came in at EUR 25.6B. Intra-Eurozone trade rose 0.6% yoy to EUR 246.4B.
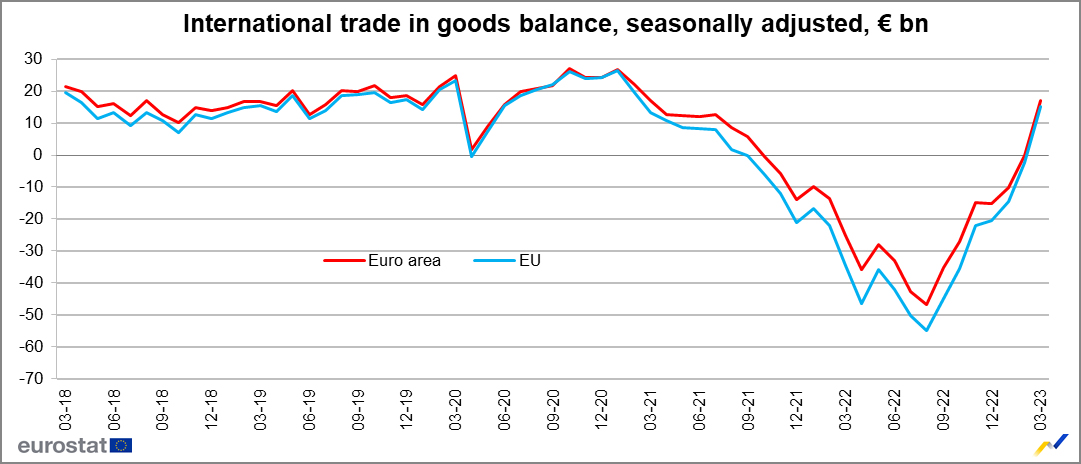
In seasonally adjusted term, goods exports dropped -0.1% mom to EUR 243.3B. Imports dropped -7.1% mom to EUR 226.2B. Trade balanced turned into EUR 17.0B surplus, above expectation of EUR 5.6B. Intra-Eurozone trade dropped from EUR 230.9B to EUR 223.2B.
Germany ZEW dived to -10.7, economy could slip into recession
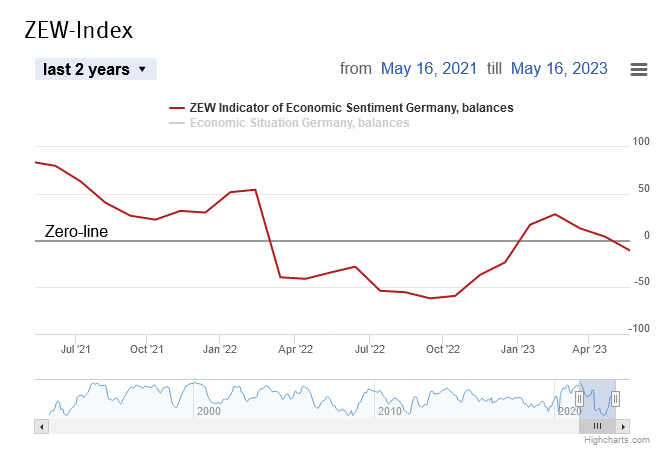
Germany ZEW Economic Sentiment recorded in significantly decline from 4.1 to -10.7 in May, even worse than expectation of -5.0%. Current Situation Index dropped from -32.5 to -34.8.
Eurozone ZEW Economic Sentiment fell form 6.4 to -9.4. Current Situation Index rose 2.7 pts to -27.5.
ZEW President Professor Achim Wambach said:
"The ZEW Indicator of Economic Sentiment has once again fallen sharply. The financial market experts anticipate a worsening of the already unfavourable economic situation in the next six months. As a result, the German economy could slip into a recession, albeit a mild one.
"The sentiment indicator decline is partly due to expectations of further interest rate hikes by the ECB. Additionally, the potential default by the United States in the coming weeks adds uncertainty to global economic prospects".
GBPUSD Trapped Between Key Barriers
GBPUSD attempted to recover some lost ground on Monday after its pullback from the 2021 descending trendline stalled near 1.2442. Despite its latest bullish efforts, the pair could not overcome its 20-day simple moving average (SMA), which has been acting as resistance over the past three days around 1.2520.
Given the falling MACD and the negative slope in the RSI, which is set to cross below its 50 neutral mark, the risk is tilted to the downside rather than the upside. That said, the pair is currently well supported around the ascending trendline drawn from September’s record low at 1.2445. If the bears breach that floor, the 50-day SMA could immediately come to the rescue at 1.2388. Otherwise, the decline could continue towards the 50% Fibonacci retracement of the 2021-2022 downtrend at 1.2285 and the 1.2200 round-level. Another failure here could initially test the 1.2130 barrier before squeezing the price down to the 1.2000 psychological mark and the 200-day SMA at 1.1960.
In the bullish scenario, where the price closes above the 20-day SMA at 1.2520, the spotlight will fall again on the crucial long-term descending trendline seen around 1.2635. Should that ceiling crack this time, with the pair extending its uptrend above the one-year high of 1.2678, the uptrend may stretch up to the 1.2800-1.2860 constraining zone. The 61.8% Fibonacci mark of 1.3000 could be the next destination, while a steeper increase could reach the short-term resistance line from March at 1.3140.
Summing up, GBPUSD seems to be preparing for a new bearish wave following another rejection near a long-term resistance trendline. Yet, the pair may have another opportunity for a rebound, unless the price slips below the upward-sloping trendline at 1.2445 and the 50-day SMA.
Ether and Bitcoin Seek Local Support
Market picture
The total crypto market capitalisation is down 1.7% over the last 24 hours to $1.13 trillion. Bitcoin is down 1.6%, Ether is losing 1%, and among the top altcoins, only Litecoin and Tron show positive dynamics, adding around 0.8%.
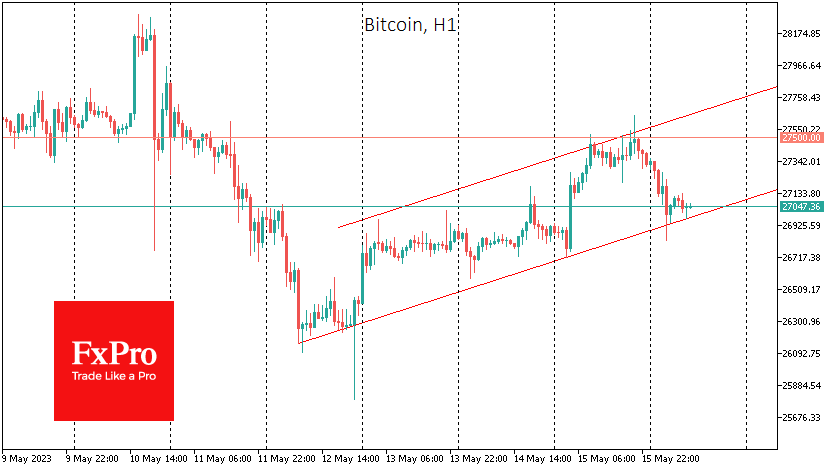
Bitcoin’s advance on Monday stopped near $27.5K, and at the time of writing, the price has rolled back to $27K, the lower boundary of last Friday’s short-term uptrend channel. A break below $ 26.7K could put more pressure on the cryptocurrency.
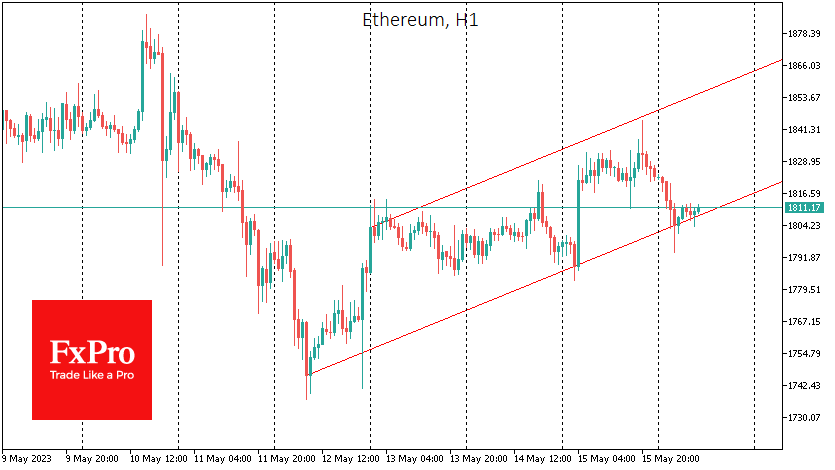
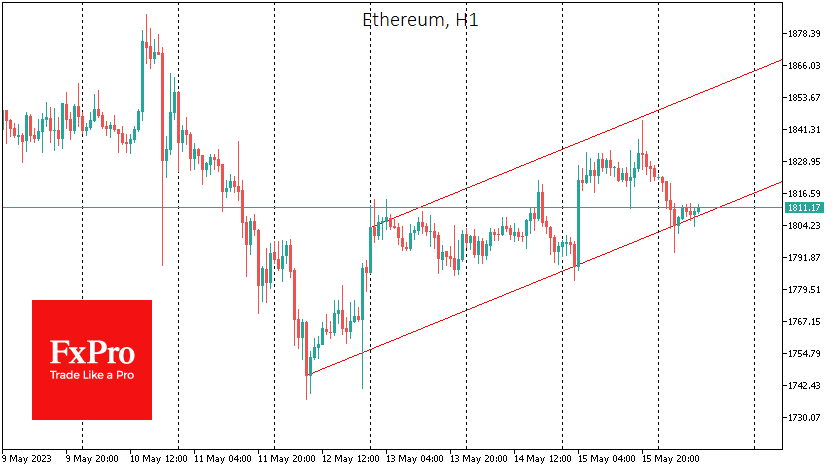
There is also a similar short-term channel in ETHUSD, and a failure from the current $1,810 to $1,780 would mark a new short-term victory for the bears, potentially triggering a downward spike.
According to CoinShares, investments in crypto funds fell by $54 million last week, the fourth consecutive week of outflows. Bitcoin investments fell by $38 million, while Ethereum rose by $0.1 million. Investments in bitcoin short funds fell by $10 million.
News background
According to a Bloomberg survey, Bitcoin has become one of the three most attractive assets amid default risk in the US. About 10% of US investors said they would hedge their risks by buying the first cryptocurrency. The first two positions were taken by gold and US government bonds.
According to Kaiko, the correlation between Bitcoin and Ethereum exchange rates has declined for over two months and fallen below 80%. This is the lowest level in a year and a half. This is due to the banking crisis in the US, which has led to an increase in investment in safe-haven assets, including BTC.
According to Glassnode, the number of investors with 1 BTC or more has exceeded one million.
The popularity of Bitcoin Ordinals and BRC-20 tokens will fade in a few months as they overload the blockchain and lead to higher transaction fees, says JAN3 CEO Samson Mow.
Oil Under Pressure, But Downside Limited
WTI crude oil rebounded on Monday after three sessions of declines in the second half of last week. Oil found support just before the start of active trading in Europe after falling to a 10-day low of $69.40.
Today’s pullback is still within the recent downtrend. Behind the buying is Friday’s data showing a further drop in the number of rigs operating in the US, from 748 last week to 731, the lowest since June last year and the continuation of the downtrend since November last year. This dynamic reflects doubts among US producers about maintaining and increasing oil supply over the six-month to one-year outlook.
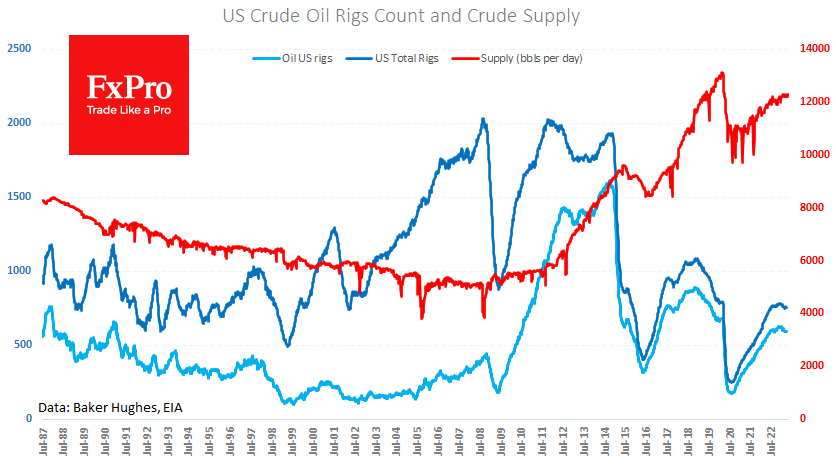
However, while at the end of last year, this sentiment was influenced by fears of a recession in the developed world, it is now more a reaction to deteriorating financial conditions.
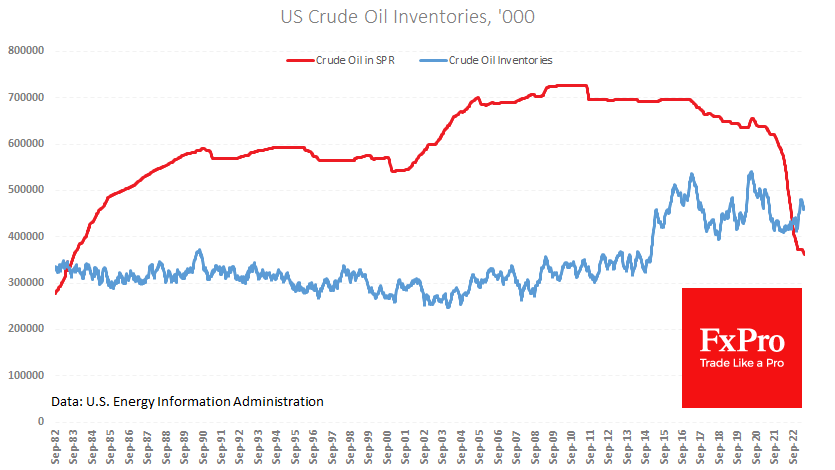
Another explanation from oil producers is worth considering. Over the past five weeks, the US government has returned to selling oil from the Strategic Petroleum Reserve, discouraging producers from making new investments as it tends to lower final prices. Late last week, administration officials confirmed their intention to return to replenishing the reserves this coming summer, but this is not the first time that date has been pushed back.
The sharp fall in oil prices, which peaked at the start of trading on 4 May, looked like a turning point for the market. However, buyers failed to provide sufficient traction, and the pressure on prices soon returned, briefly pushing prices back below $70.
Judging by the emerging short-term technical picture, it is better to be prepared for another test of the $65-67 per barrel WTI area. However, we expect oil to stay within this level, given the monumental task of replenishing US reserves and replacing Russia’s share of oil, shifting the supply/demand balance in favour of the former.
GBP/JPY Daily Outlook
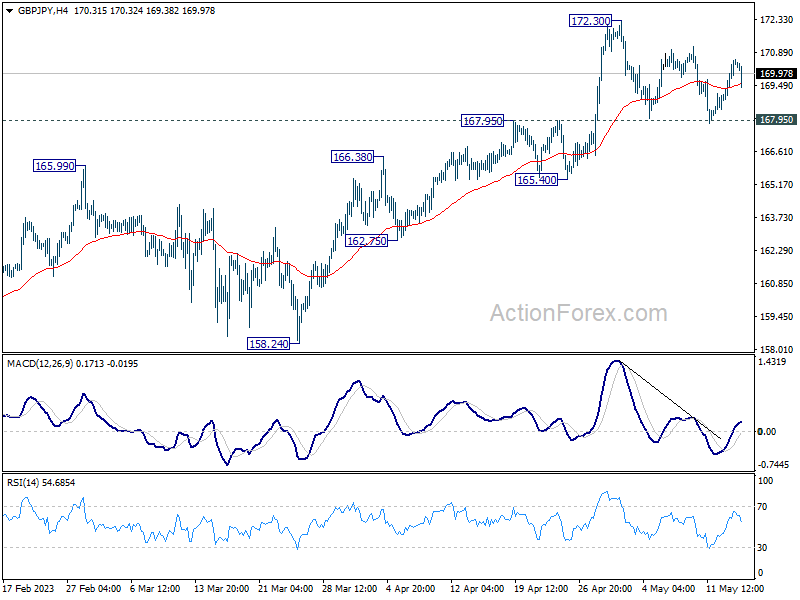
Daily Pivots: (S1) 169.37; (P) 170.00; (R1) 171.14; More...
Range trading continues in GBP/JPY and intraday bias remains neutral. On the upside, break of 172.30 will resume larger up trend to 100% projection of 148.93 to 172.11 from 155.33 at 178.51. Nevertheless, firm break of 167.95 should confirm short term topping, and turn bias back to the downside for deeper pull back to 165.40 support and possible below instead.
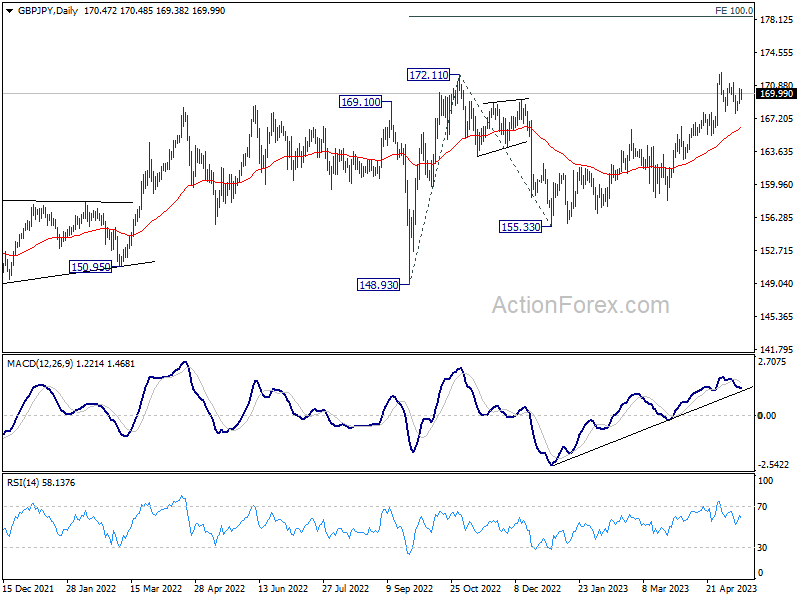
In the bigger picture, focus stays on 172.11 resistance (2022 high). Decisive break there will resume whole up trend from 123.94 (2020 low). Next target will be 161.8% projection of 122.75 (2016 low) to 156.59 (2018 high) from 123.94 at 178.69. Nevertheless, firm break of 165.40 support will indicate rejection by 172.11 and extend the corrective pattern from there with another falling leg.
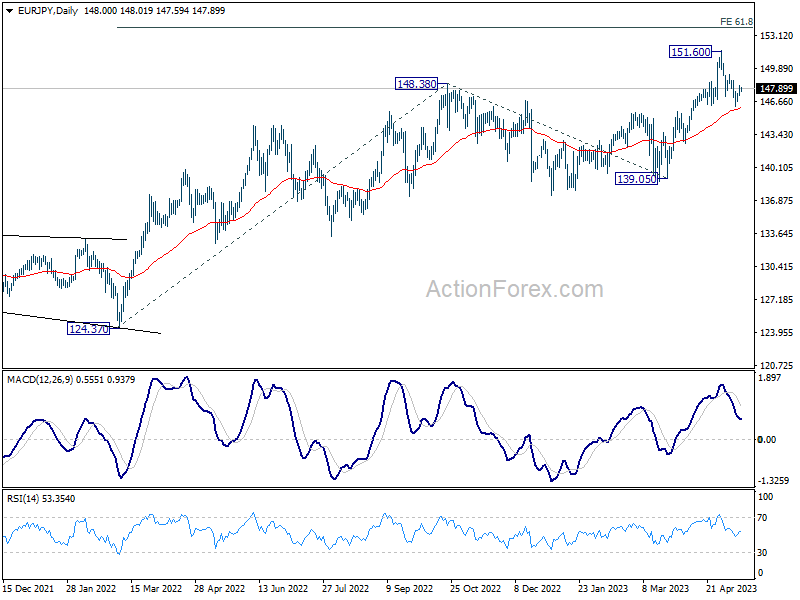
EUR/JPY Daily Outlook
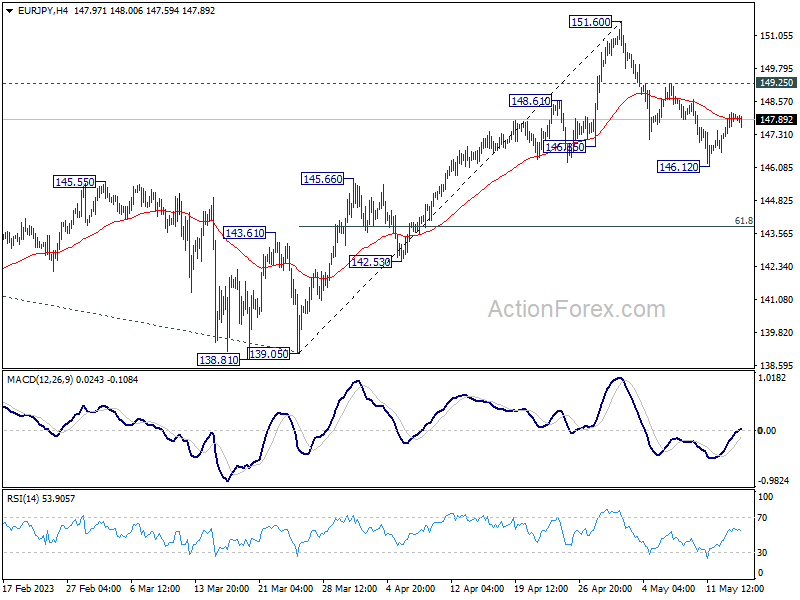
Daily Pivots: (S1) 147.43; (P) 147.80; (R1) 148.39; More....
Intraday bias in EUR/JPY remains neutral first, but further decline is in favor as long as 149.25 resistance holds. Sustained trading below 55 D EMA (now at 146.01) will bring deeper pull back to 61.8% retracement of 139.05 to 151.60 at 143.84. On the upside, though, firm break of 149.25 will turn bias back to the upside for retesting 151.60 high instead.
In the bigger picture, rise from 114.42 (2020 low) is in progress. Next target is 61.8% projection of 124.37 to 148.38 from 138.81 at 153.64. Sustained break there will pave the way to 100% projection at 162.82. For now, medium term outlook will remain bullish as long as 139.05 support holds, even in case of deep pull back.