

Sample Category Title
AUD/JPY Technical: Potential Push Up Within a Major Range
- Two conflicting fundamental factors are driving the short-term movement of the Aussie dollar.
- RBA’s hawkish rhetoric has provided a potential floor but a weak external environment due to China prevents bulls from taking an aggressive stance.
- AUD/JPY key short-term support stands at 90.30 with major range resistance coming in at 92.10/92.80.
The Aussie dollar seems to be trapped by two conflicting fundamental factors in the short to medium-term horizon.
Firstly, the positive factor that supports potential strength in the Aussie dollar comes from the hawkish rhetoric portrayed by Australia’s central bank, the Reserve Bank of Australia (RBA) after its surprise 25 basis points hike on its policy interest rate to 3.85% on 2 May.
Today’s release of the minutes of RBA’s monetary policy meeting for 2 May has revealed that policymakers were concerned about weak productivity growth that would trigger inflation risks, persistently high services inflation, and faster-than-expected rental increases that may require a further rise in interest rates.
In contrast, the current weak external environment is likely to have an adverse impact on the economic growth of Australia due to less demand for its top industrial-related commodities exports such as coal and iron ore.
In addition, the latest macro data from China; Australia’s top trading partner suggests more evidence of a slowdown in its recovery spurt. Both consumer spending and industrial activities grew slower than expected in April. Industrial production grew by 5.6% year-on-year from 3.9% recorded in March but way below the consensus of 10.9%. Retail sales increased by 18.4% year-on-year, below the consensus of 21% but above March’s print of 10.6%.
AUD/JPY Technical Analysis – May see a retest on its 92.10/92.80 major range resistance
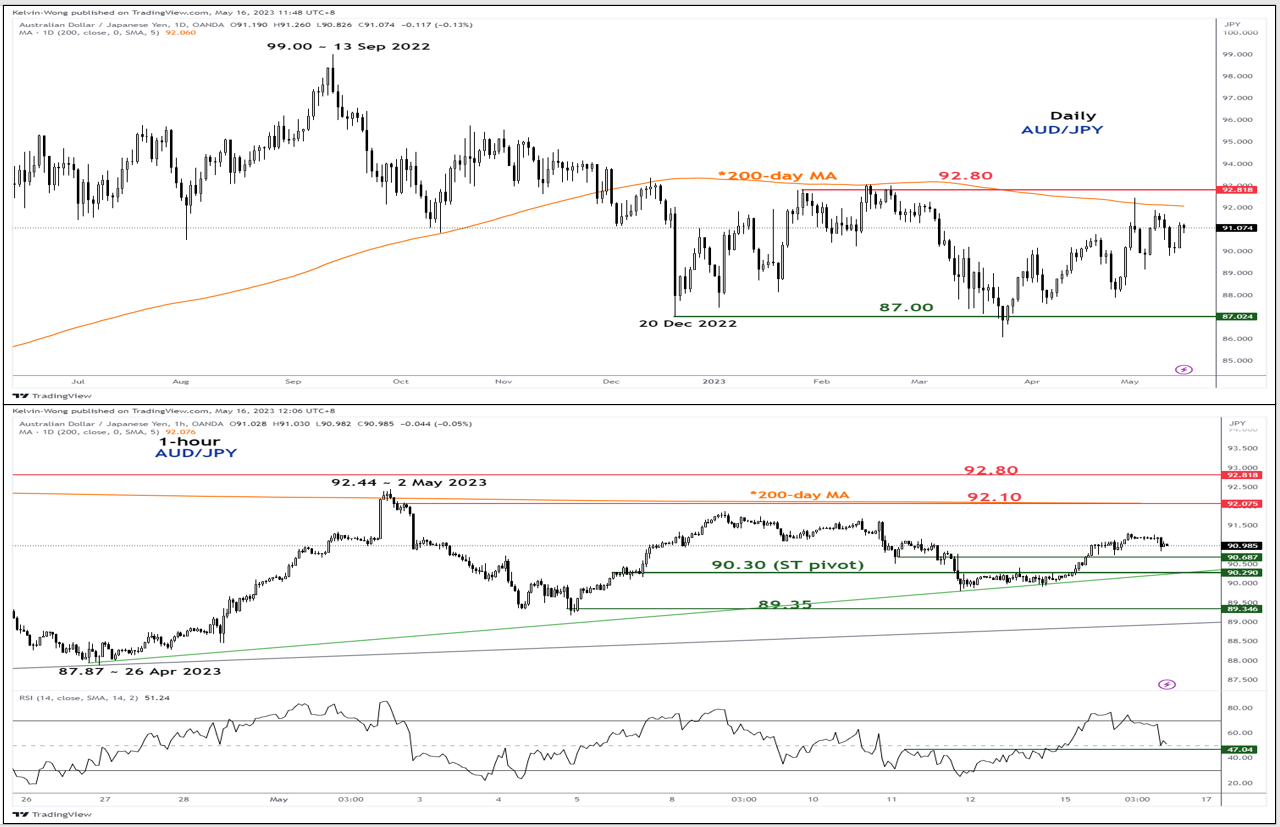
Fig 1: AUD/JPY trend as of 16 May 2023 (Source: TradingView, click to enlarge chart)
Since its 20 December 2022 swing low of 87.00, the AUD/JPY cross pair has evolved into a major sideways range configuration below a key 200-day moving average that is acting as a resistance at a zone of 92.10/92.80 as seen from the daily chart.
In the shorter-term time horizon depicted by the hourly chart, the price actions of AUD/JPY have managed to trace out a series of “higher lows” that is being supported by a minor ascending trendline in place since the 26 April 2023 low of 87.87 that is now acting as a key short-term pivotal support at 90.30.
In addition, the hourly RSI oscillator has just managed to stage a bounce right above its corresponding support at the 47% level which suggests that potential short-term upside momentum remains intact.
The intermediate resistance to watch will be at 92.10. However, a break with an hourly close below 90.30 negates the bullish tone to expose the next support at 89.35 (swing low area of 5 May 2023 & ascending trendline from 24 March 2023 low).
Gold Seen in Consolidation Phase
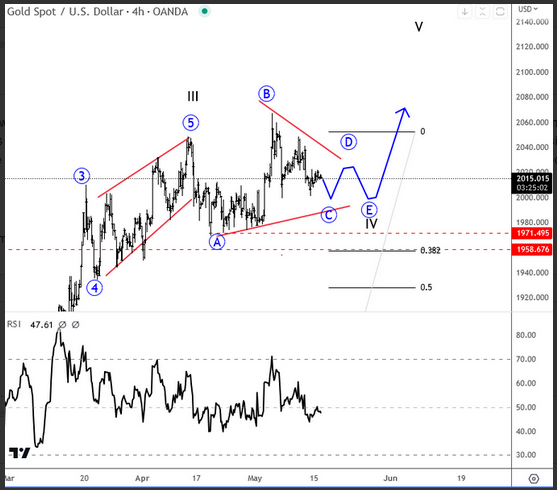
Gold is bullish on higher time frame charts where we expect a break to new ATH high, but ideally, this will occur after the current complex correction is completed. Notice that recovery from 1970 to 2070 was made by three waves, ideally it was wave B as part of a higher degree fourth wave that can be even a triangle. If we are correct then more slow and sideways price action will show up to complete the pattern, ideally still some time this month when we will start looking up towards 2100. If we are correct then 1958 and 1971 levels should hold as a support. If they are broken then the structure and trend will change.
USD Consolidates Recent Gains
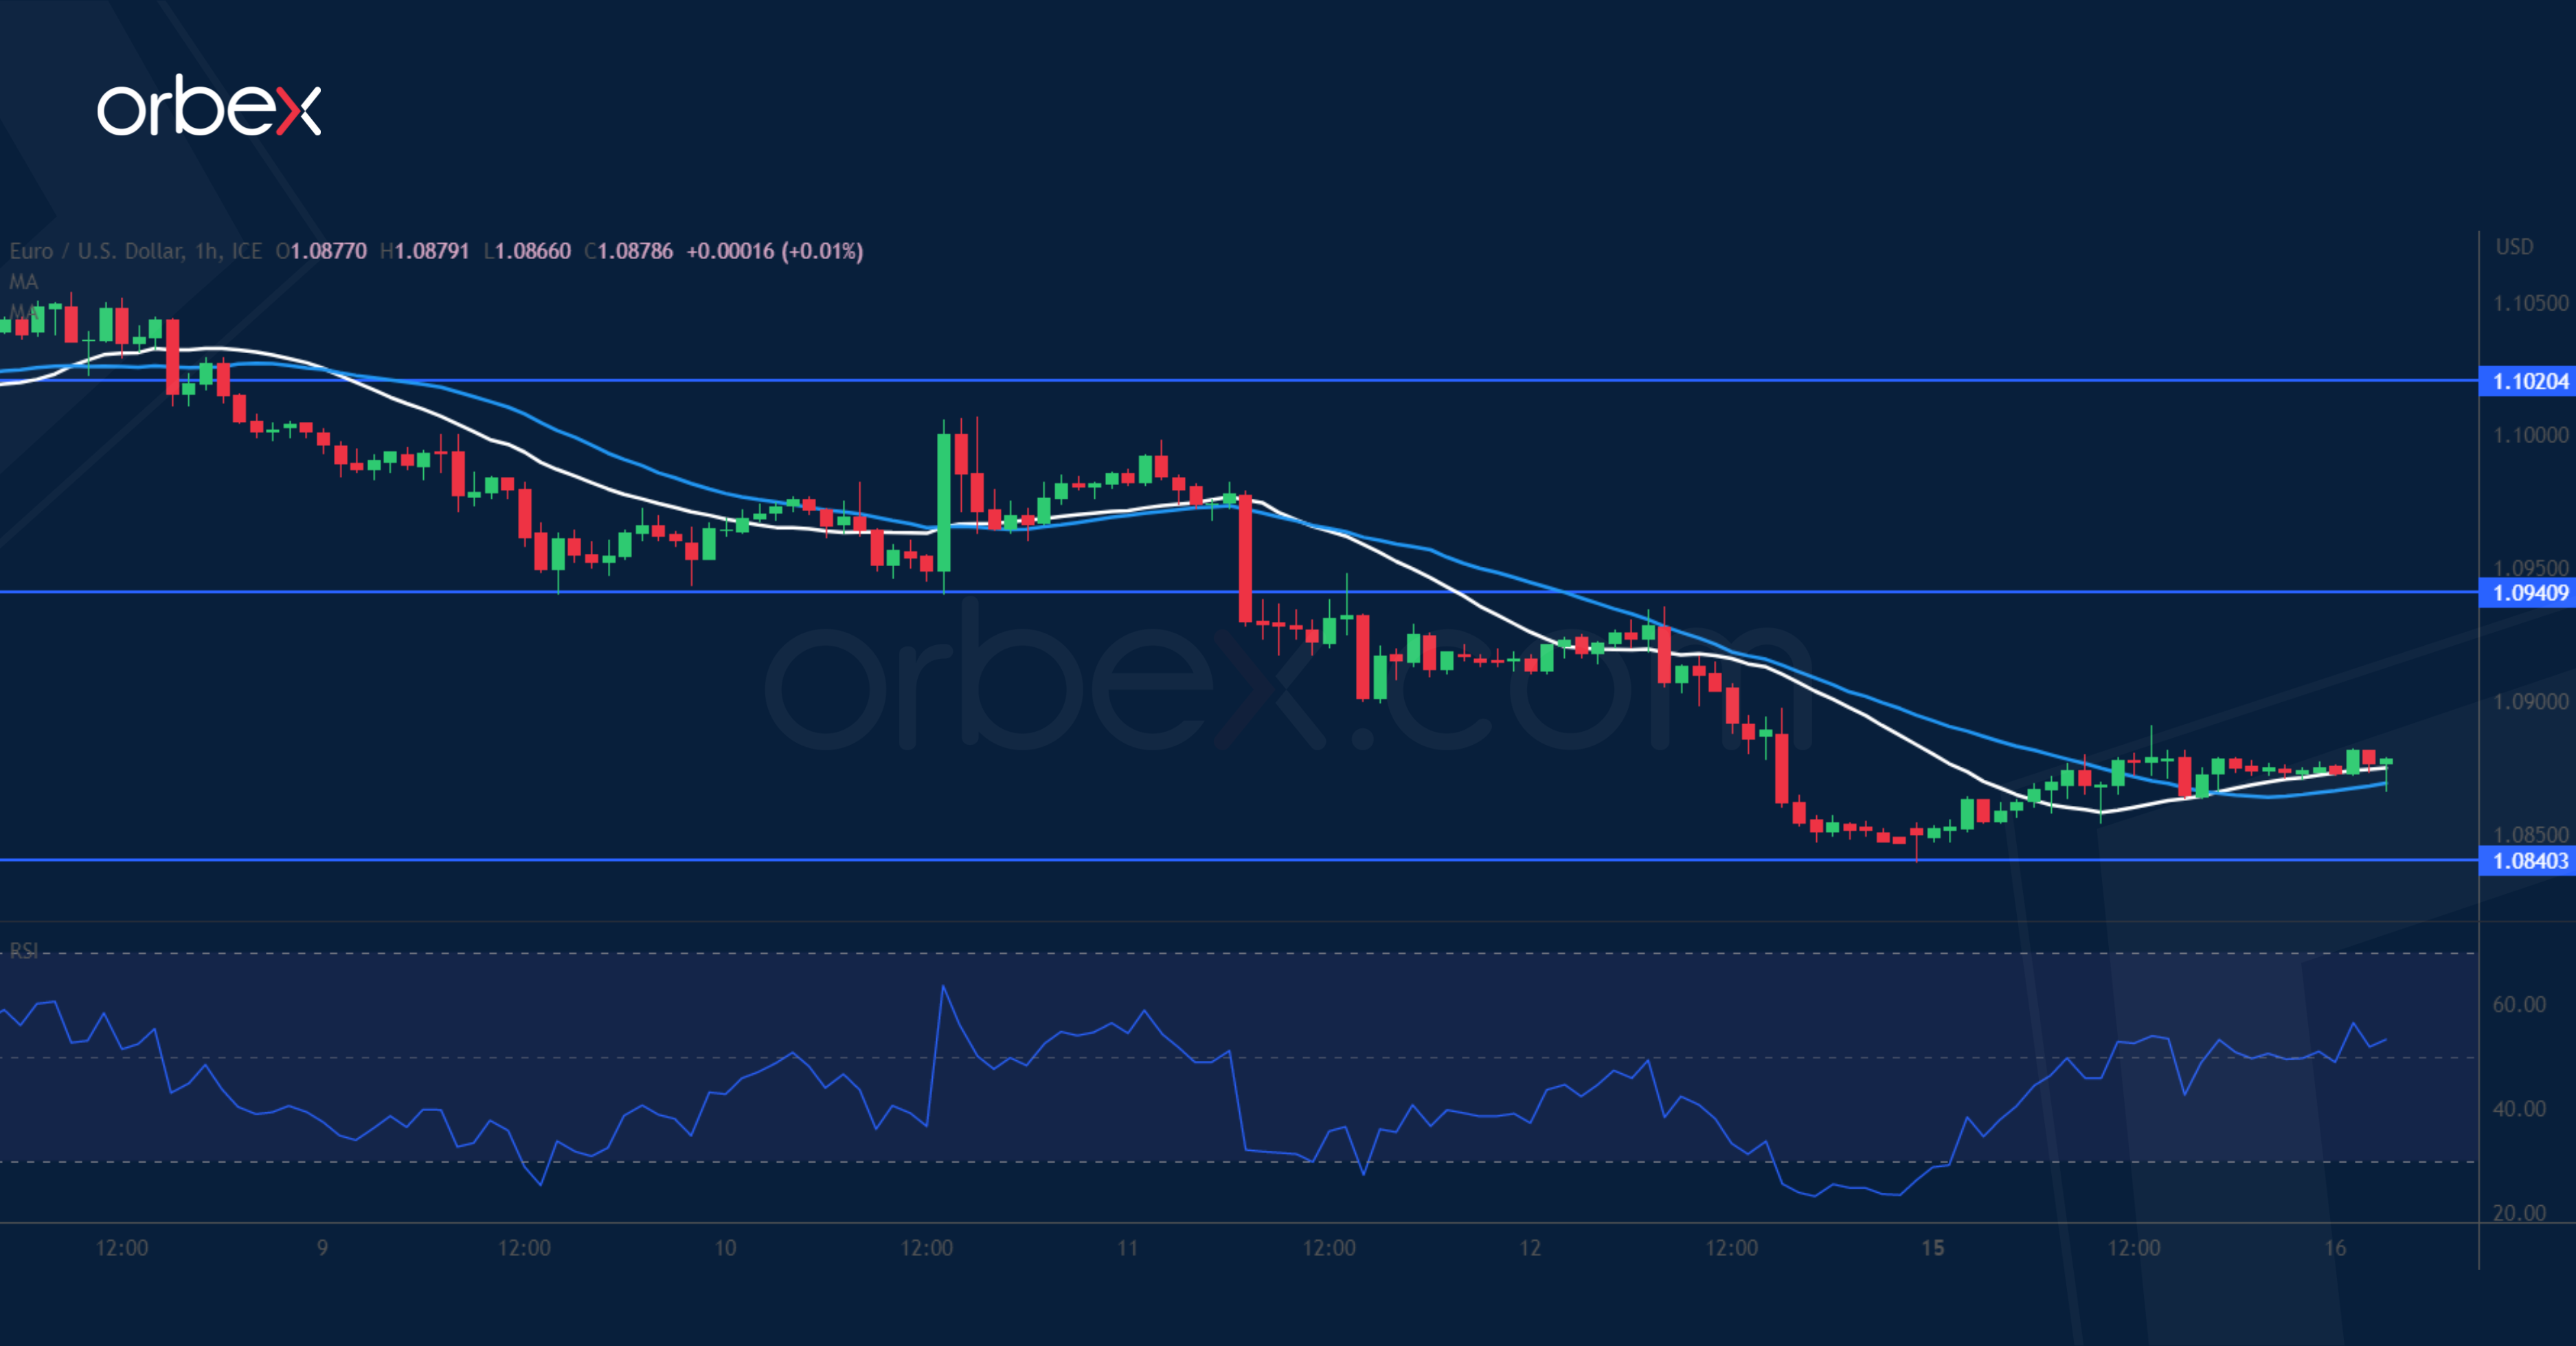
EUR/USD grinds critical floor
The US dollar consolidates amid worries about the debt ceiling stalemate. The euro’s drop below 1.0940 has led short-term buyers to liquidate their positions. The pair is testing 1.0840 from the start of a breakout rally in mi-April. This is a critical floor to maintain the single currency’s lead and a bearish breakout would open the door for a drop towards the March lows of 1.0550. The RSI’s oversold situation has attracted some bargain hunters and they have to clear the support-turned-resistance at 1.0940 to ease the pressure.
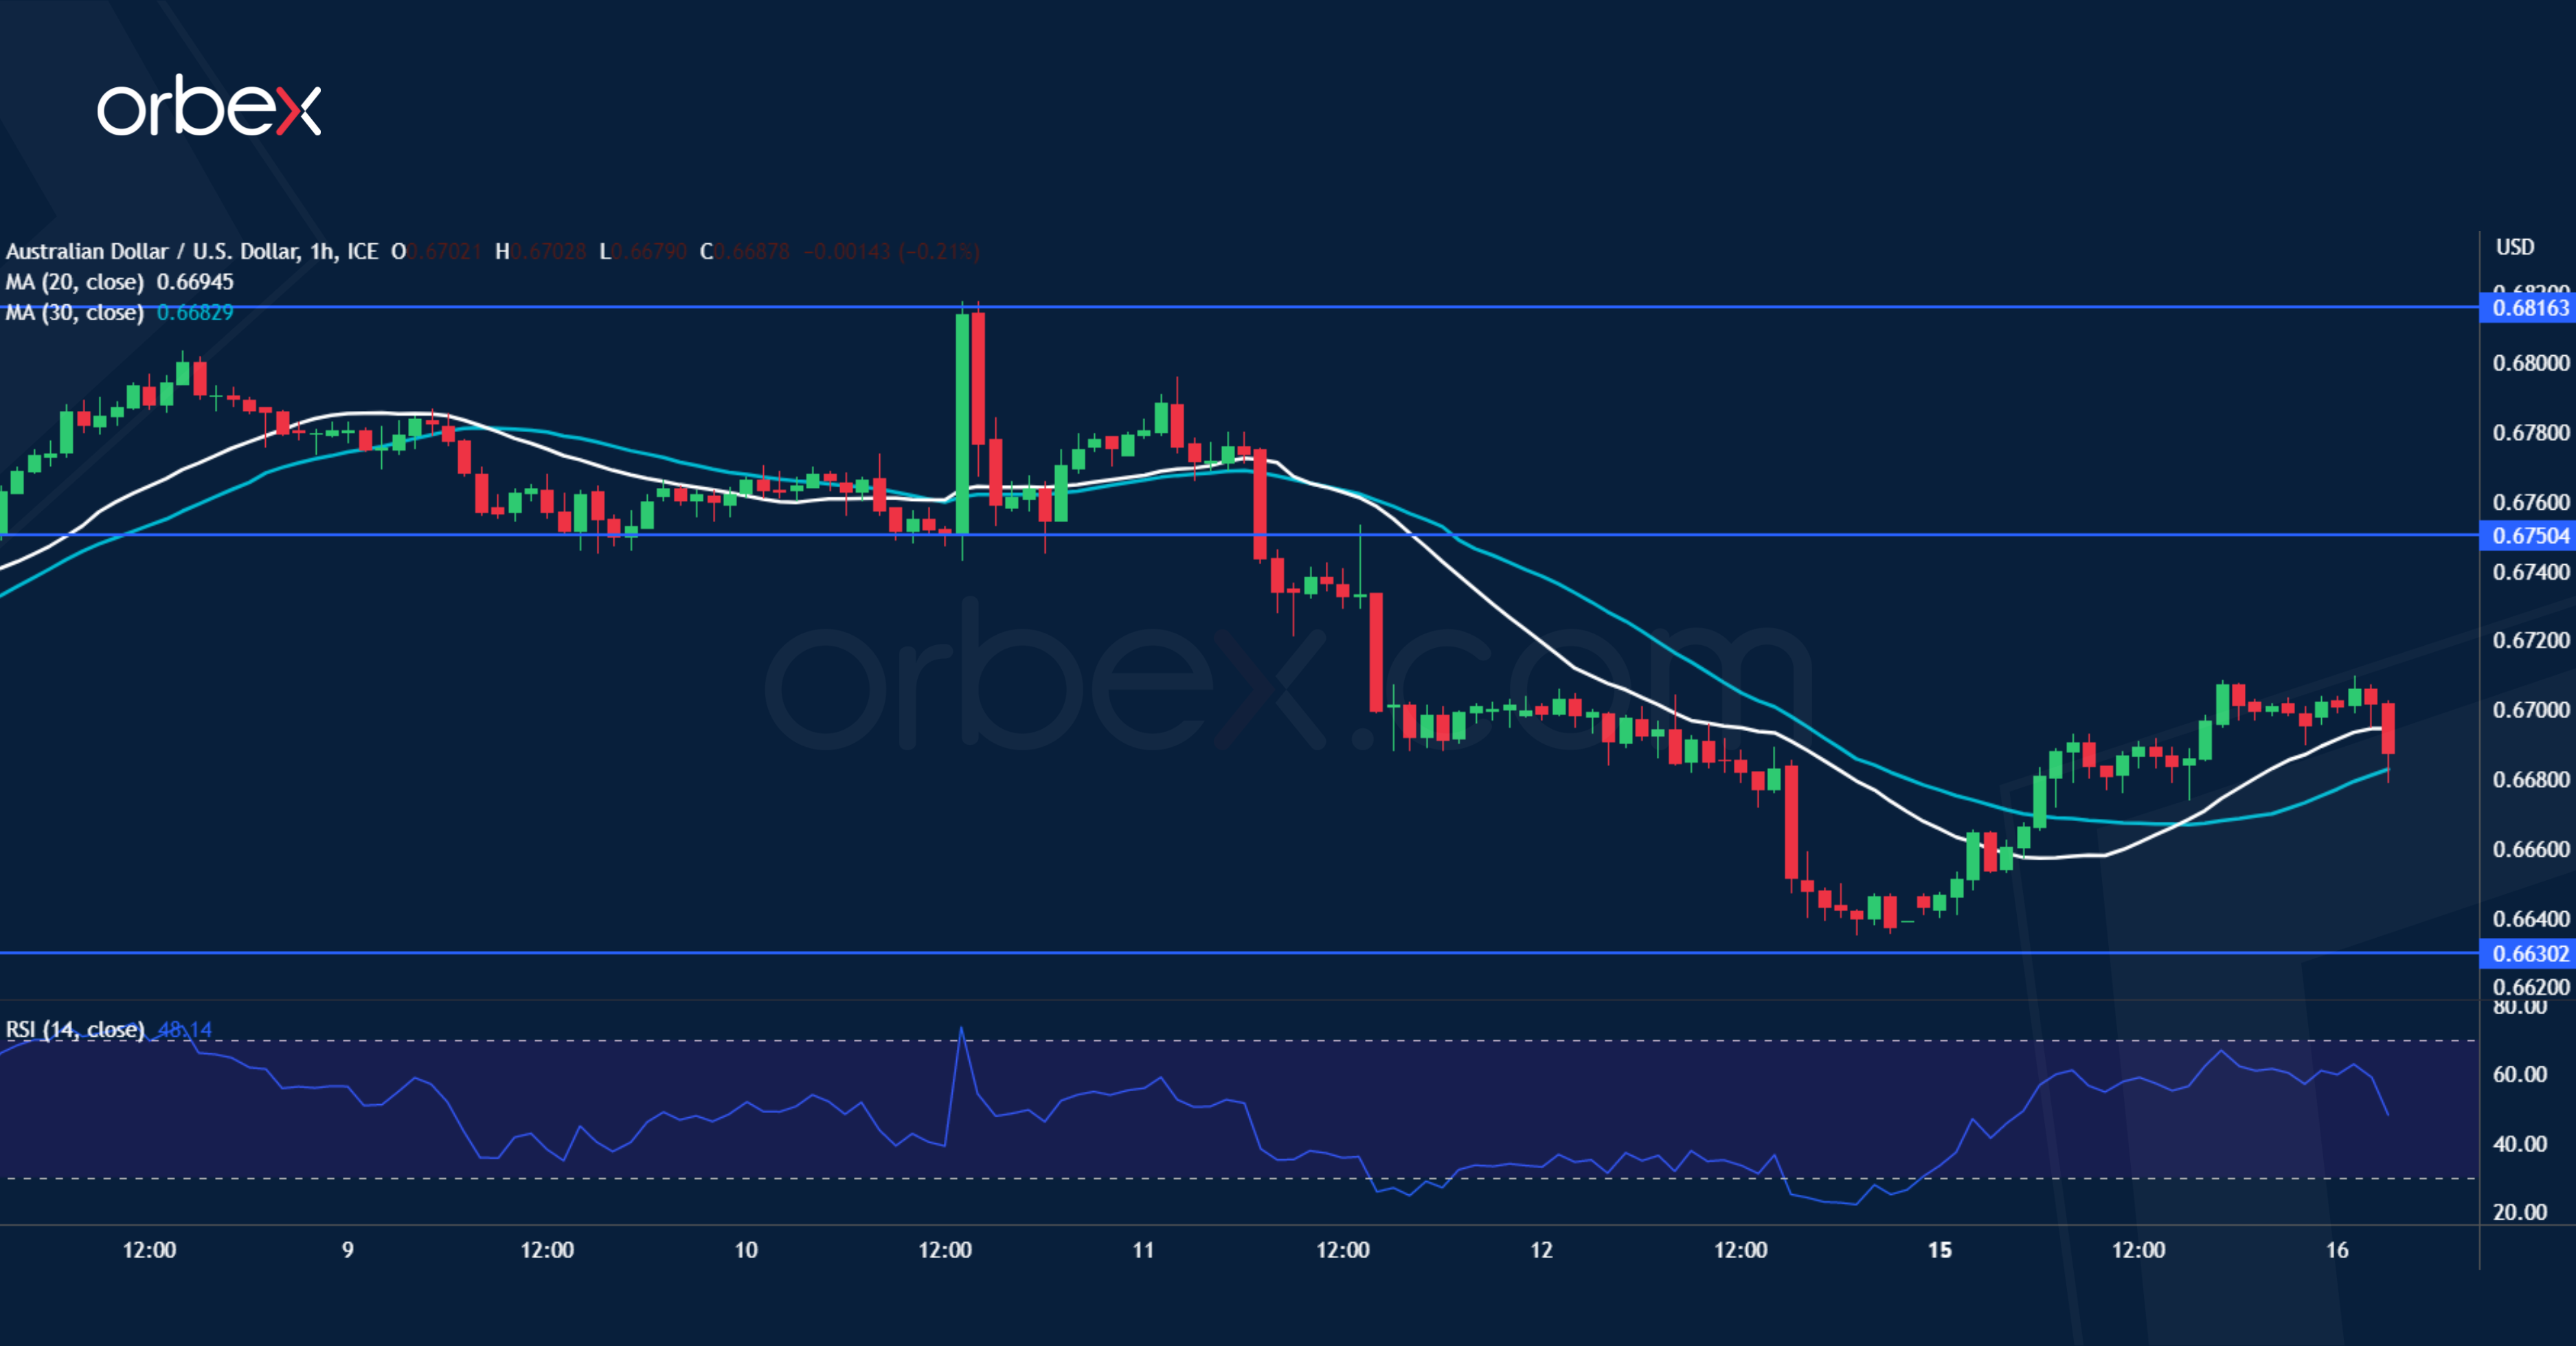
AUD/USD attempts to bounce back
The Australian dollar recouped some losses after hawkish RBA meeting minutes. The pair is striving to hold on to its gains from the rally earlier this month with the base of the bullish breakout at 0.6630 as an important level to keep the aussie’s edge. A close above 0.6700 is an encouraging signal and the bulls will need to lift 0.6750 before they could hope for a sustained extension. On the downside, a bearish breakout would expose the double bottom (0.6580) on the daily chart which is a critical floor in the medium-term.
Dow Jones 30 awaits breakout
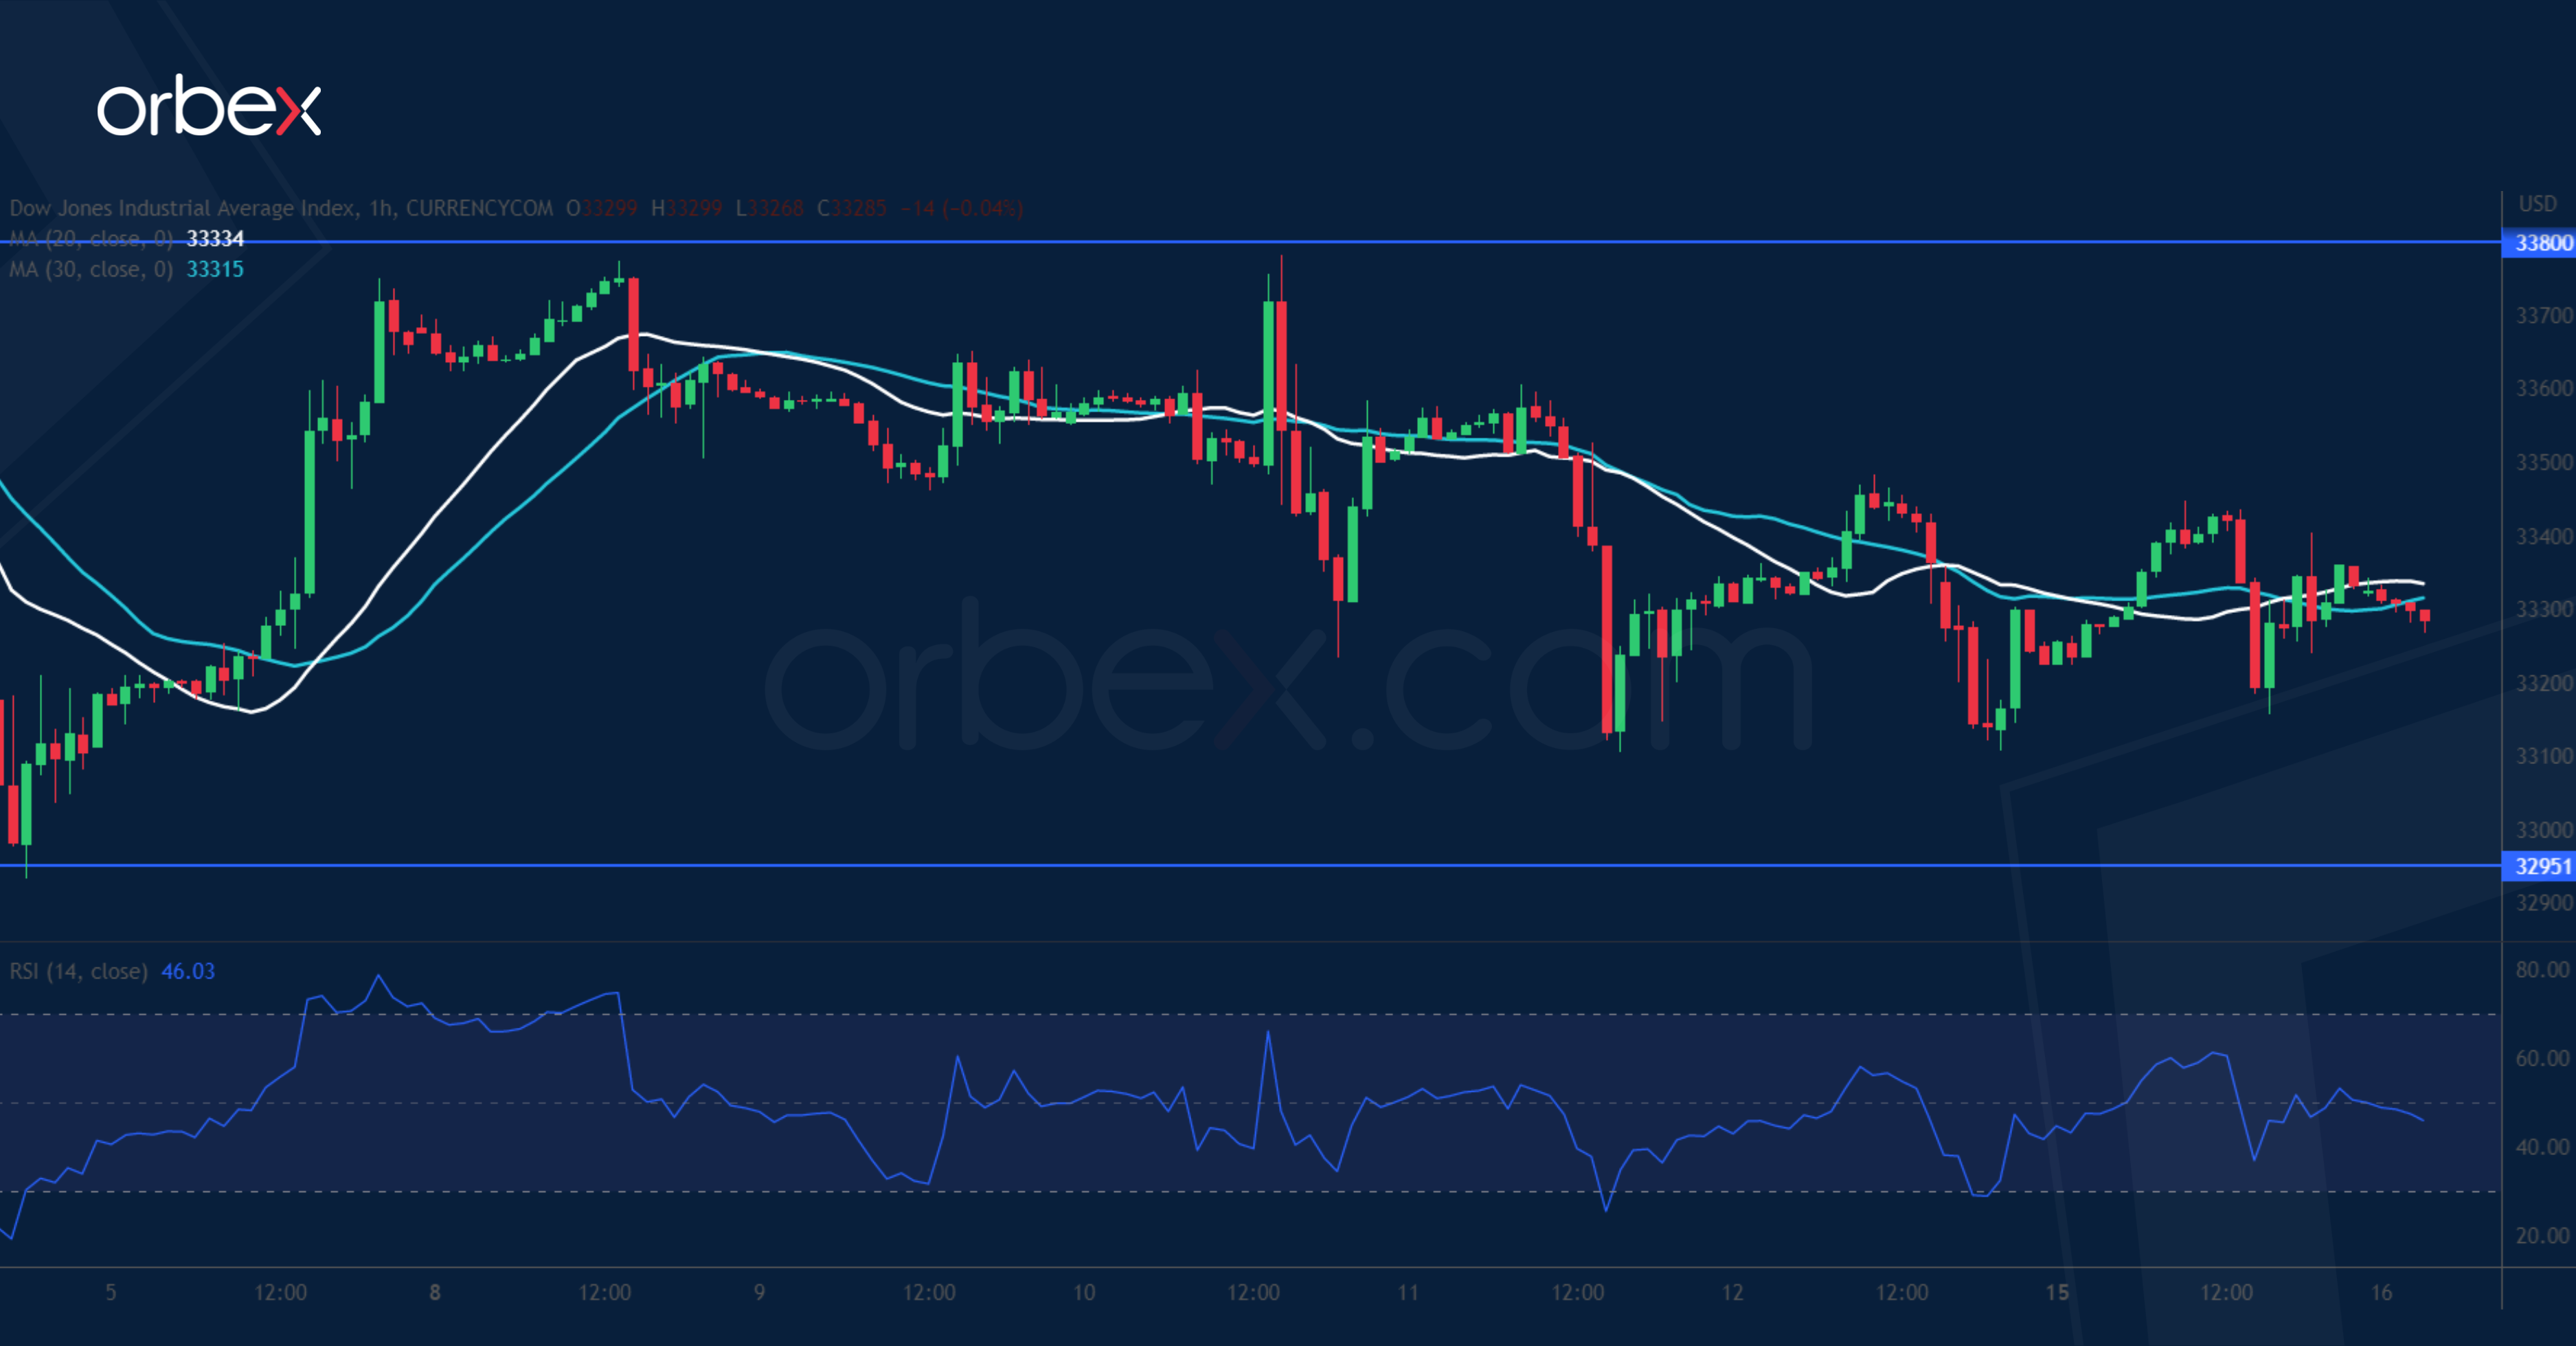
The Dow Jones 30 steadies as traders wait for a breakthrough in the US debt-ceiling talks. The index is still consolidating its gains after breaking above 33500. 32950 is the current support where buyers have stepped in, but 33800 has proven to be a tough level to crack after two consecutive failed attempts. Its breach would bring the price back to the major supply zone around 34300 where a breakout could trigger an extended recovery towards 35000. On the flip side, a deeper correction may send the price to 32300.
Fed Speakers Show Growing Divergence on How to Proceed with Monetary Policy
Markets
Fed speakers show growing divergence on how to proceed with monetary policy. Atlanta Fed Bostic (non-voter) is inclined to pause at the June meeting, but he confirmed that the committee is still out on the issue. If he had a bias between going up or down as a next move, it would still be up. Resilient consumer spending and tight labour markets pose upside inflation risks even as the Fed’s earlier tightening measures will start having a bigger impact. Bostic pointed to the load of data coming out between the May and June policy meetings, which could alter the decision of him and his colleagues. Whatever the outcome in June, Bostic pushed back against the (financial markets’) idea about cutting policy rates soon. His baseline is to keep them at whatever peak rate until well into 2024. Minneapolis Fed Kashkari (voter) stressed that there is still a long way to go before inflation gets back down as the labour market is still hot. Therefore the Fed probably has more work to do and shouldn’t be fooled by a few months of positive (inflation) data. Richmond Fed Barkin (non-voter) told the Financial Times that there’s no barrier in his mind to further increase interest rates if inflation persists, or God forbid accelerates. He doesn’t see the urgency of making a different decision because of financial stability risks. He’s not convinced that the story of waning fiscal stimulus, eroding personal balance sheets, the lagged effects of rate moves, credit tightening and cooling demand will turn into reality which pulls inflation significantly down. Chicago Fed Goolsbee (voter) is on the other side of the aisle. He was close to dissenting last month given turmoil in the banking sector and is in for a pause in June as there’s still a lot of the impact of the 500 bps of Fed rate hikes to come. US Treasuries at the end of the day lost ground with yields adding 2.2 bps (2-yr) to 5.3 bps (30-yr). The German yield curve moved in similar fashion with yields adding 0.7 bps (2-yr) to 4.9 bps (30-yr). Both real rates and inflation expectations increased. EUR/USD recovered from last week’s losses, consolidating around 1.0870. Stock markets overall gained around 0.5%. Today’s eco calendar is stuffed with amongst others German ZEW investor confidence and US retails sales. Central bank speakers are plenty including ECB Lagarde. Another high level political meeting on raising the US debt ceiling serves as a wildcard. Strong UK labour market data this morning fail to inspire sterling after BoE chief economist yesterday hinted to prefer a rate pause at the next policy meeting. EUR/GBP remains just below the 0.87 big figure.
News and views
A series of monthly eco data (April) published this morning showed a rather sluggish post-pandemic recovery in China. At 18.4% Y/Y (8.5% YTD Y/Y) and 5.6% Y/Y (3.6% YTD Y/Y) respectively for retail sales and industrial production, both series disappointed. The high April Y/Y figures mostly mirror a low comparison base due to lockdowns in Shanghai and other cities that heavily impacted growth in April last year. Investment activity was below consensus as well with fixed asset investment rising only 4.7% YTD Y/Y (from 5.1% in March). Property investment even declined (-6.2% YTD Y/Y from -5.8% in March). The jobless rate eased from 5.3% to 5.3%, but a record high 20.4% youth unemployment rate is a high source of concern. The data are raising speculation that the PBOC will have to take additional easing measures to support activity. The yuan weakens slightly further this morning with USD/CNY trading just below 6.96.
The Westpac-Melbourne Institute index showed that Australian consumer confidence tumbled substantially in May. The deterioration was visible in most subcategories of the index. Overall sentiment dropped from 9.4% to -7.9%, with the decline being visible both in current conditions (-4.8% from +10.0%) and expectations (-9.6% from 9.1%). Families turned negative both on their financial conditions and the on the economy. According to the Westpac Chief economist, the decline in sentiment was affected by the announcement of the new Budget and the unexpected RBA decision to further raise the policy rate by 25 bps at its May meeting. Minutes of that RBA May 2 policy meeting revealed that some members wanted a pause and that the arguments were finely balanced but finally higher inflation risks prevailed as inflation was not expected to decline to the top of the 2-3% inflation target till mid-2025. Further increases in the interest rate might still be required, but this will depend on how the economy and inflation will evolve. The Aussie dollar declines modestly this morning from the AUD/USD 0.671 area to 0.6685, but this is probably in part due to lower than expected Chinese data rather than Australia related news.
Chinese April Data Disappoints
Market movers today
Today we will look out for one of the early indicators of May economic activity in Germany with the ZEW index.
The US releases retail sales providing more insights to the state of the US consumer. We also have FOMC members Mester, Williams and Bostic on the wires.
In Sweden, Prospera inflation expectations are published, see more below.
Overnight, the first Q1 GDP estimate is released from Japan. The service sector has improved through Q1 while the manufacturing sector is struggling like we see globally. Consensus has a 0.1% increase.
The 60 second overview
Chinese April data disappoints: As signalled by weak PMI's lately, April activity was weaker than expected. Retail sales increased from 10.6% y/y in March to 18.4% y/y in April but it was less than consensus expectation of 21.9% and it hides over a big monthly drop in April, as the y/y rate is lifted by favourable base effects from the plunge in April seen last year during the Shanghai lockdown. Industrial production also disappointed rising only to 5.6% y/y (consensus 10.9% y/y) from 3.9% y/y, despite similar positive base effects. Home sales were also soft showing a big monthly decline in April. Overall the data clearly suggests, the recovery weakened in April after a very strong Q1.
The coming months will be key for showing whether this is a temporary set-back to a "too strong" Q1 after the reopening or whether it reflects a faltering recovery. Comments from the National Bureau of Statistics showed concern saying that "the property market is in recovery but more efforts are needed" and that "insufficient demand restricts the industrial sector". We are likely to see more monetary policy stimulus soon on the back of these data as inflation is also running close to 0% currently. Chinese stocks were slightly higher overnight as the soft data was already priced in markets.
Weak US data: The US Empire index, the first regional survey for May, dropped sharply from 10.8 to -31.8, close to the recent low in January. The indicator is very volatile so monthly observations should be taken with a grain of salt. Yet, it points to a still weak US manufacturing sector.
Fed's Bostic does not see rate cuts until well into 2024: "My baseline case is we won't really be thinking about cutting until well into 2024," Bostic said Monday in an interview on CNBC. "If you look at most measures of inflation, they're still two times where our target is. And so that's a long distance still to go." "If I had a bias between going up and going down as our next action, I would say we might have to go up." This contrasts with market expectations of 65bp in H2 this year. We expect the Fed to be on hold rest of the year.
New forecasts from the EU Commission: Yesterday, the EU Commission lifted euro area growth forecasts saying that the economy had performed better over the winter. 2023 growth was revised higher to 1.0% from 0.8% and 2024 growth to 1.7% from 1.6%. The Commission sees inflation falling from 5.8% this year to 2.8% in 2024 (Danske Bank 2.1%), and hence still clearly above the ECB's 2% target.
Equities: Global equities higher yesterday despite very weak macro data. Yet another day with little volatility and relatively little market moving news. Markets reacted negatively to the big plunge in the Empire Fed index but moves started to fade the shortly after the surprise. In US, Dow +0,1%, S&P500 +0,3% and Nasdaq + 0,7%. Asian markets are holding on to gains this morning despite weaker than expected data from China. European futures a little higher while US futures are a little lower.
FI: There was a modest rise in global bond yields yesterday combined with a bearish steepening of the global yield curves. However, the spread between the peripherals and Bunds tightened modestly. Furthermore, the German ASW-spreads also tightened and the Bund ASW-spread dipped below 70bp.
FX: Commodity currencies AUD, NZD, CAD and NOK were the biggest winners on the back of a rising oil price in a relatively quiet session yesterday. EUR/USD still trading below the 1.09-mark. USD/JPY climbed above 136. EUR/NOK fell to around 11.53, while EUR/SEK initially appreciated on a soft CPI print from Sweden but later retraced and ended the session lower below 11.25. GBP strengthened and took EUR/GBP below 0.87.
Nordic macro
In Sweden, Prospera May money market inflation expectations will be released. In recent months 1y CPIF expectations have stabilized at 4%, while 2 and 5 y expectations have risen slightly to 2.4 % and 2.2 %, respectively. We expect to see a resumption of the downward trend on all horizons as other survey data suggests declining corporate selling price expectations.
Agreement on US Debt Ceiling Unlikely Before Last Minute
US stocks kicked off the week on a slightly positive note on the back of weak economic data – that fueled the Federal Reserve’s (Fed) pause expectations, glim hope that the debt ceiling talks between Joe Biden and Kevin McCarthy could lead to resolution and on Microsoft gaining EU approval to buy Activision.
But all of the latter are weak reasons to jump on a bullish trade because,
1. the New York Empire State Manufacturing index slumped to -31.80 in May, versus a slump to around -3.70 expected by analysts. Slowing activity brings forward the idea that the Fed will stop hiking interest rates on slowing growth, but Minneapolis Fed head Kashkari warned investors that the Fed will tighten more, Atlanta Fed’s Bostic said the Fed should hold, but in no case cut the rates this year, while Chicago Fed’s Goolsbee didn’t want to promise a pause in June. He said that he watches the data and remains ‘extra mindful of the hikes’ impact on credit conditions.
While a June Fed hike is still off the table, activity on Fed funds futures hint that investors see higher odds for a rate hike next month. The probability of a 25bp hike now stands at 19%. But of course, the data and how the debt ceiling talks go will be crucial in what the Fed could and would do.
2. Even though investors bought hope of a possible breakthrough on US debt ceiling impasse when Biden and McCarthy meet today, McCarthy warned that they ‘are nowhere near reaching a conclusion’. The negotiations will likely remain tight as Republicans ask decent spending cuts to accept a debt ceiling relief, while Biden is not willing to compromise on spending into the election year. Therefore, even if Biden was to blink, he’d better do it at the last minute – to show his electors that he did his best to avoid an otherwise unavoidable default. Anything else would probably be a political mistake.
In this context, there is little chance we will see a resolution to the US debt ceiling issue today. And that’s certainly why the US 2-year yield pushed higher yesterday despite the scary NY manufacturing index read. The 2-year yield is again in a tight range around 4%, with looming risks to the upside in the short-run, which could lead to an interesting buying opportunity at discount for investors who bet that the US won’t default on its payments and that the Fed will loosen its policy later this year.
P.S For investors, a default means US government not servicing the debt. Period. Investors don’t care much whether the US government workers will get paid or not. They just care about whether the US will be able to service its debt. So here, there is a nuance. And even in an extreme case, like in 2013 when we saw the US government shut for weeks, it wasn’t considered a default because 1. US didn’t default on its debt payments, so for investors, frankly speaking, there was no default whatsoever. Ut even politicians didn’t call the 2013 government shutdown a default, they said it was just a ‘lapse in appropriations’. So even in case of a government shutdown, the US can avoid a proper default.
3. Microsoft won the EU approval to buy Activision. The European Commission says its analysis shows that the huge $69bn acquisition would not harm competition because Microsoft will let its cloud rivals offer titles such as Call of Duty on their own platforms for 10 years, the US and UK regulators are not convinced. The British regulators clearly said they stand by their decision that it’s not a go!
Weak Chinese data
The latest economic data released in China showed that retail sales and industrial production grew slower than expected in April, while fixed asset investment unexpectedly fell. Crude oil traded past $71pb yesterday on news that People’s Bank of China boosts liquidity to fuel growth in China, but as long as the hard data is not there to confirm improved activity, it will be hard for oil bulls to justify an advance above the 50-DMA, which stands a touch below the $75pb.
Moving forward
Investors will keep an eye on European growth and sentiment data, the US retail sales figures and Home Depot earnings. In the coming days, other US retailers including Target and Walmart are due to announce earnings to give a sense of how US consumers are coping with the sticky-high inflation.
The latest GDP report revealed surprisingly resilient consumer spending – which in return puts a positive pressure on inflation expectations, and Fed bets. Therefore, any further resilience in retailer earnings would keep the Fed hawks alert.
AUD/USD Daily Report
Daily Pivots: (S1) 0.6658; (P) 0.6684; (R1) 0.6725; More...
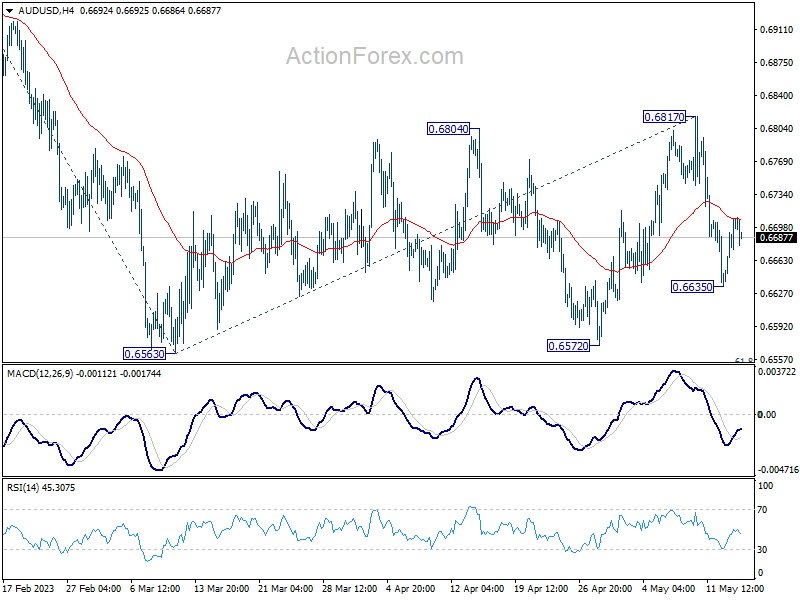
Intraday bias in AUD/USD is turned neutral first with current recovery. But risk will stay on the downside as long as 0.6817 resistance holds. Consolidation pattern from 0.6563 could have completed with three waves to 0.6817. Below 0.6635 will bring retest of 0.6563 low first. Decisive break there will resume larger decline from 0.7156 to 61.8% projection of 0.7156 to 0.6563 from 0.6817 at 0.6451.
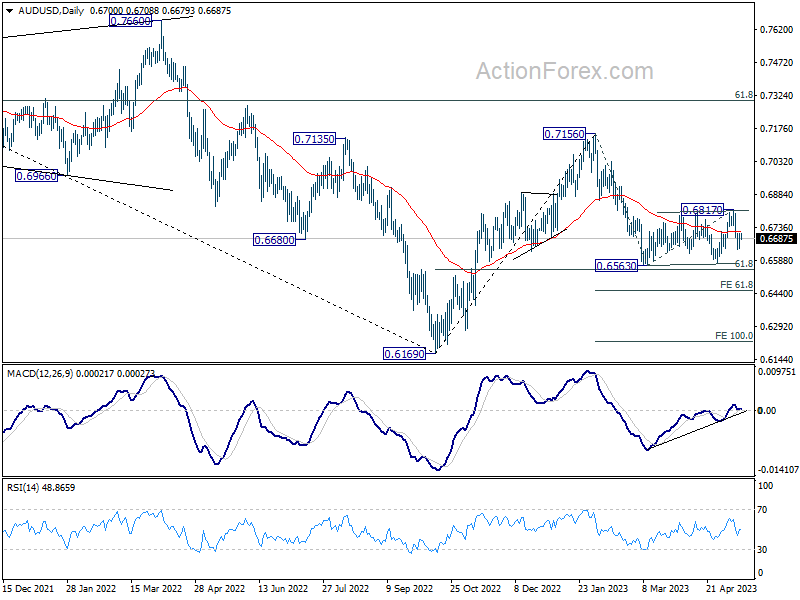
In the bigger picture, the failure to break through 55 W EMA (now at 0.6822) keeps medium term outlook bearish. Firm break of 61.8% retracement of 0.6169 to 0.7156 at 0.6546 will raise the chance of long term down trend resumption through 0.6169 low. This will now be the favored case as long as 0.6817 resistance holds.
Australian Dollar Tumbles on Weak Consumer Sentiment and China Data
Australian Dollar took a dive in today's Asian trading session, reeling from a sharp decline in consumer sentiment and a slew of weaker-than-anticipated economic data from China. Despite the headwinds facing Aussie, New Zealand Dollar held its ground, buoyed by Westpac's predictions of continued monetary tightening by RBNZ from the present 5.25% to 6.00% in the coming months.
Meanwhile, Canadian Dollar, like its Australian counterpart, is on a downward trajectory as the second weakest performer of the day so far. Dollar trails close behind, undermined by uncertainty surrounding debt ceiling negotiations. Conversely, Japanese Yen is riding high, closely following Kiwi as the day's second strongest currency, with Euro and Swiss Franc not far behind. British Pound is demonstrating mixed performance as it anticipates job data from the UK.
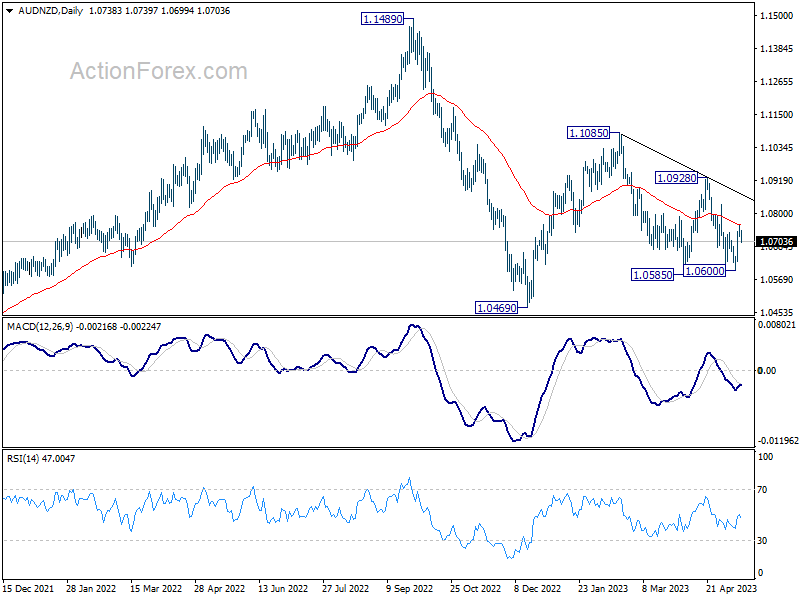
Technically, AUD/NZD's recovery from 1.0600 might have hit a ceiling at 55 D EMA. Risk is mildly back on the downside for now. Firm break of 1.0600 support should resume the decline from 1.1085 through 1.0585 towards 1.0469 low. Nevertheless, another rise would likely push AUD/NZD through 55 D MA (now at 1.0760) to 1.0928 resistance instead.
Overnight, DOW rose 0.14%. S&P 500 rose 0.30%. NASDAQ rose 0.66%. In Asia, at the time of writing, Nikkei is up 0.84%, continuing its march to 30k handle. Hong Kong HSI is up 0.39%. China Shanghai SSE is up 0.01%. Singapore Strait Times is down -0.05%.
Fed's Barkin questions "whether we need to do more"
Richmond Fed President Thomas said yesterday that he is unconvinced that inflation will taper off rapidly with only a marginal economic slowdown. Barkin stated, "You could tell yourself a story where inflation comes down relatively quickly ... with only a modest economic slowdown."
He quickly added, "But I'm not yet convinced ... I do wonder whether we're not going to need more impact on demand to bring inflation down to where we need to go."
Barkin stayed open-minded about Fed's policy direction at the upcoming June 13-14 meeting. Despite having raised the policy rate by 5 percentage points since March 2022, Barkin isn't ruling out the possibility of another hike.
In terms of the labor market, Barkin noted the shift from what he described as "red hot" to merely "hot." He asserted, "On the unemployment side, I think you could fairly say it's moved from red hot to hot, right? There's nothing about 3.4% unemployment that feels ... cool."
Despite the gradual effects of rate hikes beginning to show, Barkin emphasized that the job market remains robust and inflation persistent. He admitted, "I'm still seeing data that suggests a hot job market and enduring inflation," leading him to believe inflation could persist longer than market measures suggest. Therefore, he concluded, "I'm still looking to ask myself the question whether we need to do more."
Separately, Minneapolis Fed President Neel Kashkari said the central bank probably has "more work to do on our end, to try to bring inflation back down," adding that "we should not be fooled by a few months of positive data."
BoE Pill: Self-sustaining, second-round-effect momentum could keep inflation high
BoE Chief Economist, Huw Pill, voiced his concern about the enduring momentum of inflation in the UK during an online event yesterday. Pill warned of the risk of a self-sustaining inflation cycle, where despite the dissipation of key short-term inflation drivers like rising energy and food costs, businesses and workers would continue to seek substantial price and wage increases.
He said, "The risk is ... that self-sustaining, second-round-effect momentum within the UK economy keeps inflation running at above-target levels."
This trend could still align with a significant drop in headline inflation, Pill noted, but he expressed concern that headline inflation could stagnate at around 4% or 5% over the next two to three years.
"That's still compatible with quite a big fall in headline inflation, but maybe headline inflation - other things equal - getting stuck at that 4%, 5% level over the next two or three years," he clarified.
Meanwhile, Pill also highlighted the potential of AI to increase productivity and, subsequently, living standards. He emphasized, "Using AI to make ourselves more productive is one example of how we can do that to boost living standards. This is a win-win if we all get better off because we're all more productive."
RBA Minutes: Further hikes may still be required
Minutes of RBA's May meeting revealed a detailed discussion where Board members weighed the pros and cons of keeping cash rate unchanged or increasing it by 25 basis points. Despite the fine balance of arguments, the Board saw it fit to raise the interest rates by 25bps to 3.85%, due to upside risks in inflation and tight labour market.
Data available in the month leading up to the meeting confirmed significant inflationary pressures and highlighted upside risks to the inflation outlook. The Board was concerned that if these risks materialised, it would "further delay the return of inflation to target levels" and potentially trigger a "damaging shift in inflation expectations".
While acknowledging considerable uncertainties surrounding the economic outlook, particularly with respect to household consumption, the Board's strong commitment to price stability and the necessity of anchoring inflation expectations tipped the scales in favour of a rate hike.
Looking forward, the Board indicated that "further increases in interest rates may still be required", depending on the evolution of the economy and inflation.
Australian consumer sentiment plunges in May following unexpected RBA rate hike
Australia Westpac Consumer Sentiment Index dropping sharpy by -7.9% from 85.8 to 79.0 in May. This decline brings the index close to the grim levels observed in March, which were the lowest since COVID-19 outbreak in 2020 and, prior to that, since the severe recession of early 1990s.
The unexpected decision by RBA to raise the cash rate by an additional 0.25% in May, as well as the Federal Budget, were cited by Westpac as the two main factors impacting consumer sentiment over the last month.
Westpac stated, "Interest rates were again a key driver of the May survey. The RBA raised the official cash rate by a further 0.25% at its May meeting in the week before the survey. The move came as a major surprise to markets and most commentators, clearly stoking consumer fears of more increases to come."
Looking ahead, Westpac predicts that RBA will likely pause in June, awaiting further data on inflation and the state of the economy. While the bank's central view anticipates the current cash rate will remain at its peak due to economic weakness and clear progress toward the Board's inflation target, it acknowledges that the risks are still "evenly balanced".
China's industrial production, retail sales miss expectations; youth unemployment hits record high
China's industrial production growth fell short of expectations in April, with a year-on-year increase of 5.6% yoy, significantly under expectation of 10.1% growth. Despite missing the mark, the growth rate outpaced March's 3.9% yoy rise and marked the fastest expansion since September 2022.
Retail sales also grew less than expected, posting 18.4% yoy rise, which fell short of anticipated 20.1% yoy growth. The figure was largely inflated due to a low comparison base, as retail sales plummeted by -11.1% yoy in April of the previous year due to severe lockdowns. On a monthly basis, retail sales contracted by -7.8% mom from March.
Fixed asset investment growth also came in below expectations 4.7% ytd yoy growth, underperforming expectation of 5.2%.
Urban jobless rate ticked down from 5.3% to 5.2%. However, unemployment among 16-24 age group spiked to a record high of 20.4%, up from 19.6% in the previous month. This exceeded the previous record of 19.9% set in July 2022.
The National Bureau of Statistics (NBS) stated, "In general, in April, the national economy continued to recover, and positive factors accumulated and increased. But we must also see that the international environment is still complex and severe, domestic demand is still insufficient, and the endogenous driving force for economic recovery is not yet strong."
Looking ahead
UK emplyment and Germany ZEW economic sentiment are the main focus in European session. Eurozonne will also release Q1 GDP revision and trade balance. Later in the day, Canada CPi will take center stage with US retail sales.
AUD/USD Daily Report
Daily Pivots: (S1) 0.6658; (P) 0.6684; (R1) 0.6725; More...
Intraday bias in AUD/USD is turned neutral first with current recovery. But risk will stay on the downside as long as 0.6817 resistance holds. Consolidation pattern from 0.6563 could have completed with three waves to 0.6817. Below 0.6635 will bring retest of 0.6563 low first. Decisive break there will resume larger decline from 0.7156 to 61.8% projection of 0.7156 to 0.6563 from 0.6817 at 0.6451.
In the bigger picture, the failure to break through 55 W EMA (now at 0.6822) keeps medium term outlook bearish. Firm break of 61.8% retracement of 0.6169 to 0.7156 at 0.6546 will raise the chance of long term down trend resumption through 0.6169 low. This will now be the favored case as long as 0.6817 resistance holds.
Economic Indicators Update
| GMT | Ccy | Events | Actual | Forecast | Previous | Revised |
|---|---|---|---|---|---|---|
| 01:30 | AUD | RBA Meeting Minutes | ||||
| 02:00 | CNY | Industrial Production Y/Y Apr | 5.60% | 10.10% | 3.90% | |
| 02:00 | CNY | Fixed Asset Investment YTD Y/Y Apr | 4.70% | 5.20% | 5.10% | |
| 02:00 | CNY | Retail Sales Y/Y Apr | 18.40% | 20.10% | 10.60% | |
| 06:00 | GBP | Claimant Count Change Apr | 31.2K | 28.2K | ||
| 06:00 | GBP | ILO Unemployment Rate (3M) Mar | 3.80% | 3.80% | ||
| 06:00 | GBP | Average Earnings Including Bonus 3M/Y Mar | 5.10% | 5.90% | ||
| 06:00 | GBP | Average Earnings Excluding Bonus 3M/Y Mar | 6.80% | 6.60% | ||
| 09:00 | EUR | Eurozone Trade Balance (EUR) Mar | 5.6B | -0.1B | ||
| 09:00 | EUR | Eurozone GDP Q/Q Q1 P | 0.10% | 0.10% | ||
| 09:00 | EUR | Germany ZEW Economic Sentiment May | -5 | 4.1 | ||
| 09:00 | EUR | Germany ZEW Current Situation May | -35.3 | -32.5 | ||
| 09:00 | EUR | Eurozone ZEW Economic Sentiment May | 2.3 | 6.4 | ||
| 09:00 | EUR | Eurozone Employment Change Q/Q Q1 P | 0.30% | 0.30% | ||
| 12:30 | CAD | Manufacturing Sales M/M Mar | 0.70% | -3.60% | ||
| 12:30 | CAD | CPI M/M Apr | 0.50% | 0.50% | ||
| 12:30 | CAD | CPI Y/Y Apr | 4.10% | 4.30% | ||
| 12:30 | CAD | CPI Median Y/Y Apr | 4.30% | 4.60% | ||
| 12:30 | CAD | CPI Trimmed Y/Y Apr | 4.10% | 4.40% | ||
| 12:30 | CAD | CPI Common Y/Y Apr | 5.50% | 5.90% | ||
| 12:30 | USD | Retail Sales M/M Apr | 0.80% | -0.60% | ||
| 12:30 | USD | Retail Sales ex Autos M/M Apr | 0.50% | -0.40% | ||
| 13:15 | USD | Industrial Production M/M Apr | 0.00% | 0.40% | ||
| 13:15 | USD | Capacity Utilization Apr | 79.70% | 79.80% | ||
| 14:00 | USD | Business Inventories Mar | 0.10% | 0.20% | ||
| 14:00 | USD | NAHB Housing Market Index May | 45 | 45 |
Technical Outlook and Review
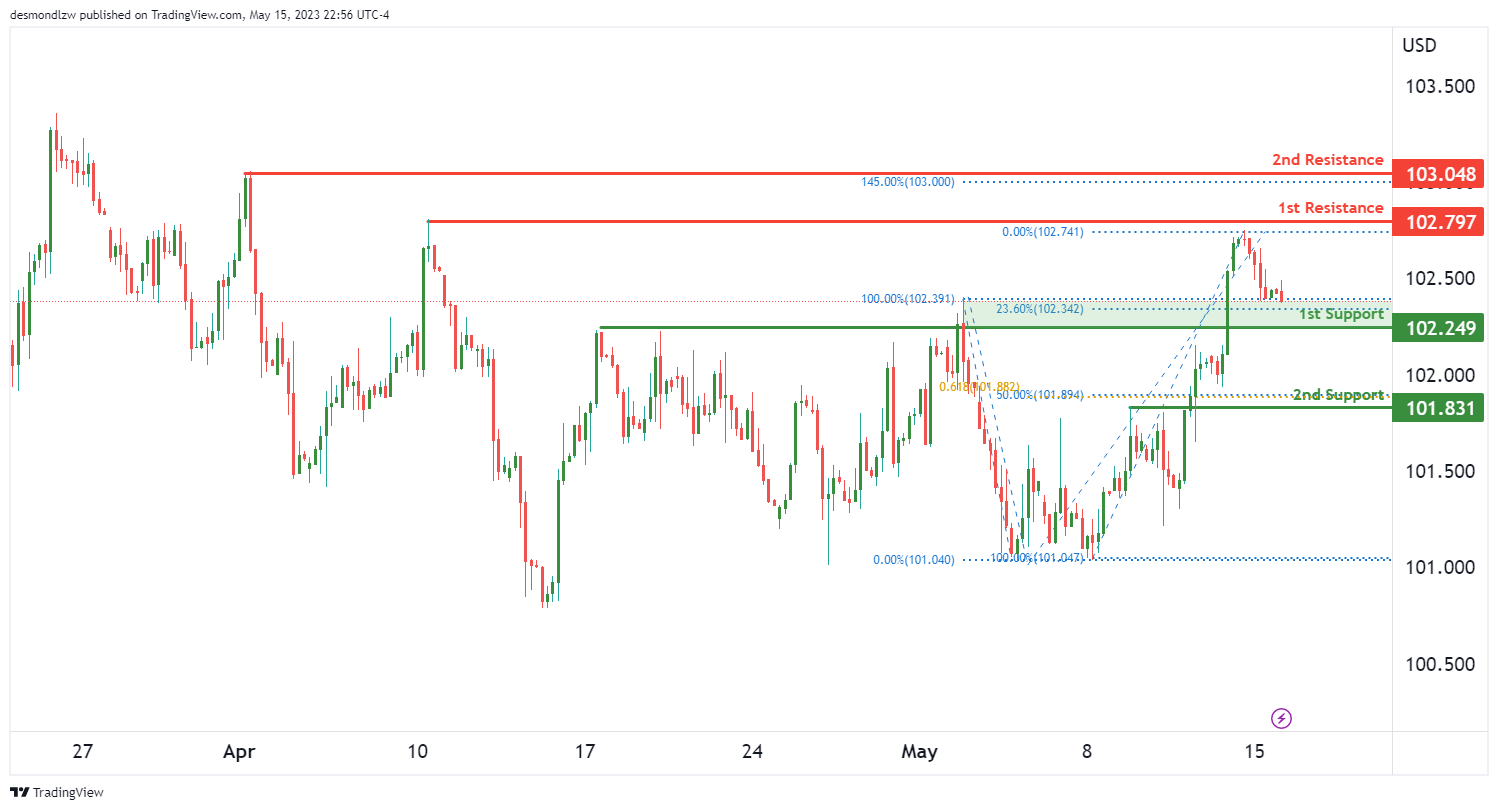
DXY:
The Dollar Index (DXY) is currently observing a significant bullish momentum, suggesting a potential continued upward movement. The bullish tendency could potentially lead the price to bounce off the first support and head towards the first resistance.
Our first support stands at 102.24. This key level serves as a pullback support, indicating a strong potential for price stability. Additionally, it aligns with a 23.6% Fibonacci retracement, further suggesting the robustness of this support level.
If the price manages to rebound from the first support, it could potentially rise towards the first resistance level, which is situated at 102.79. This level is a swing high resistance, suggesting it could be a significant barrier to further price increases.
However, should the price fail to maintain above the first support, our second support at 101.83 could come into play. This level also serves as a pullback support. Additionally, it is a point of Fibonacci confluence, coinciding with both a 61.8% Fibonacci projection and a 50% Fibonacci retracement, making it a crucial level to monitor.
Looking beyond the first resistance, our second resistance stands at 103.04. This level, a swing high resistance, coincides with a 145% Fibonacci extension, indicating it could be a significant hurdle for bullish momentum.
EUR/USD:
The EUR/USD pair is currently experiencing a pronounced bearish momentum with high confidence, suggesting a potential continued downward movement. The strong bearish tendency is indicated by the price’s position below the bearish Ichimoku cloud and a major descending trend line, suggesting that further bearish momentum is likely.
Our first resistance stands at 1.0909. This level serves as a pullback resistance, aligning with a 23.6% Fibonacci retracement. This suggests that it might be a significant barrier to any potential upward movement. If the price reacts bearishly off this first resistance, it could potentially drop towards the first support level.
The first support is found at 1.0846, a multi-swing low support level. This suggests a strong potential for price stability at this level. It is crucial to monitor the market’s reaction at this point, as a significant break below could further bolster the bearish momentum.
Should the price fail to maintain above the first support, our second support at 1.0792 could come into play. This level serves as a swing low support, making it a critical level to watch for potential price rebounds.
Looking beyond the first resistance, our second resistance stands at 1.0942. This level is an overlap resistance, suggesting that it could present a significant hurdle for any bullish momentum.
GBP/USD:
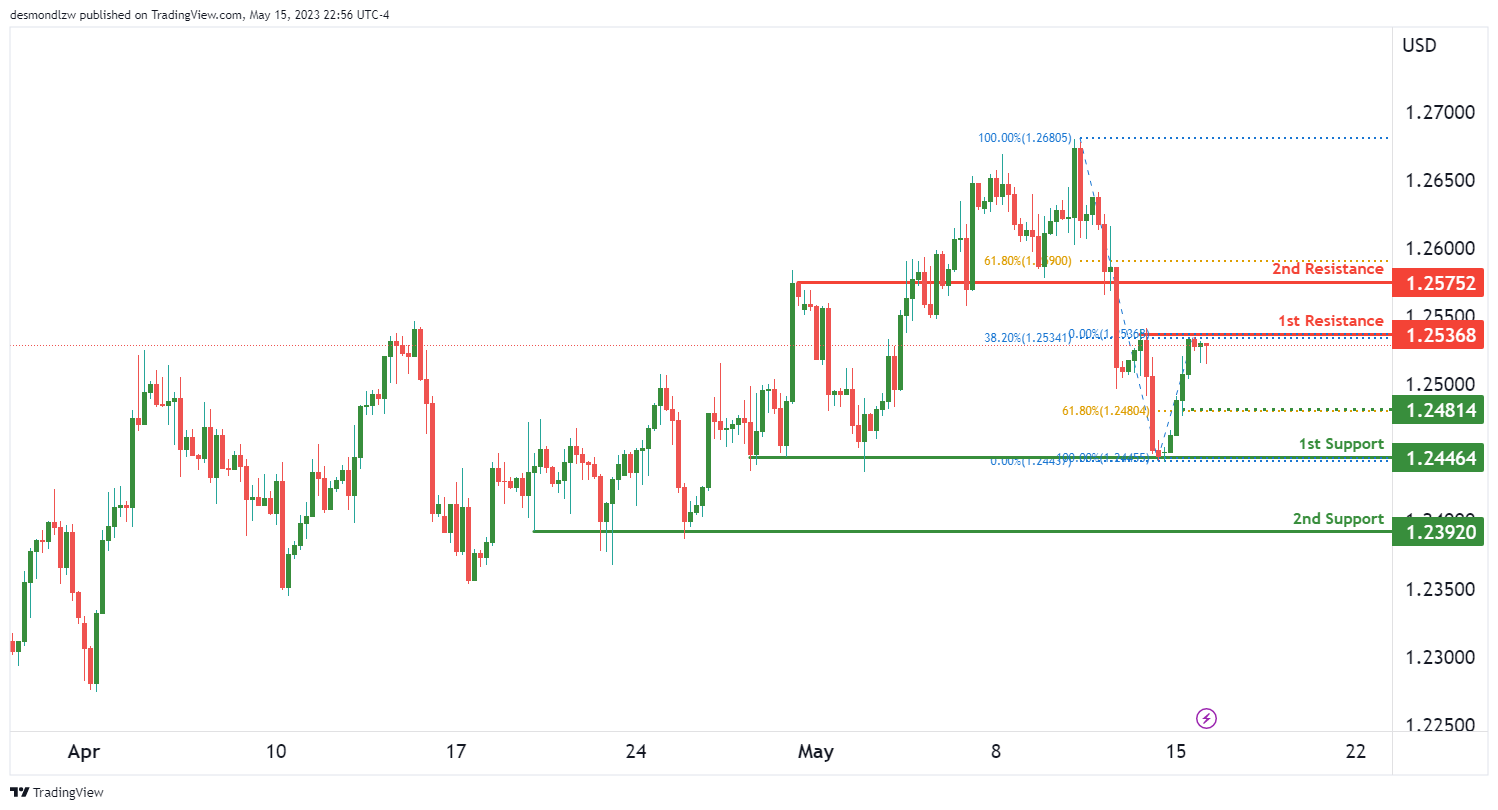
The GBP/USD pair is currently observing a notable bearish momentum, indicating the possibility of a downward trend continuation. There’s a potential for the price to react bearishly off the first resistance level, leading to a potential drop towards the first support level.
Our first resistance stands at 1.2536, serving as a multi-swing high resistance and coinciding with a 38.2% Fibonacci retracement. This suggests that it might present a significant barrier to any upward price movements.
In the event of a bearish reaction from this first resistance, the price could potentially descend towards the first support level, situated at 1.2446. This level serves as a multi-swing low support, indicating a strong potential for price stability at this point.
However, should the price fail to hold above the first support, our second support at 1.2392 could come into play. This level also serves as a multi-swing low support, making it a crucial level to watch for potential price rebounds.
Beyond the first resistance, our second resistance is at 1.2575. This level is a pullback resistance and aligns with a 61.8% Fibonacci retracement, suggesting that it could pose a significant hurdle for any potential bullish momentum.
Additionally, there is an intermediate support level at 1.2464, which is a swing low support, further emphasizing the bearish bias of the current price movement.
USD/CHF:
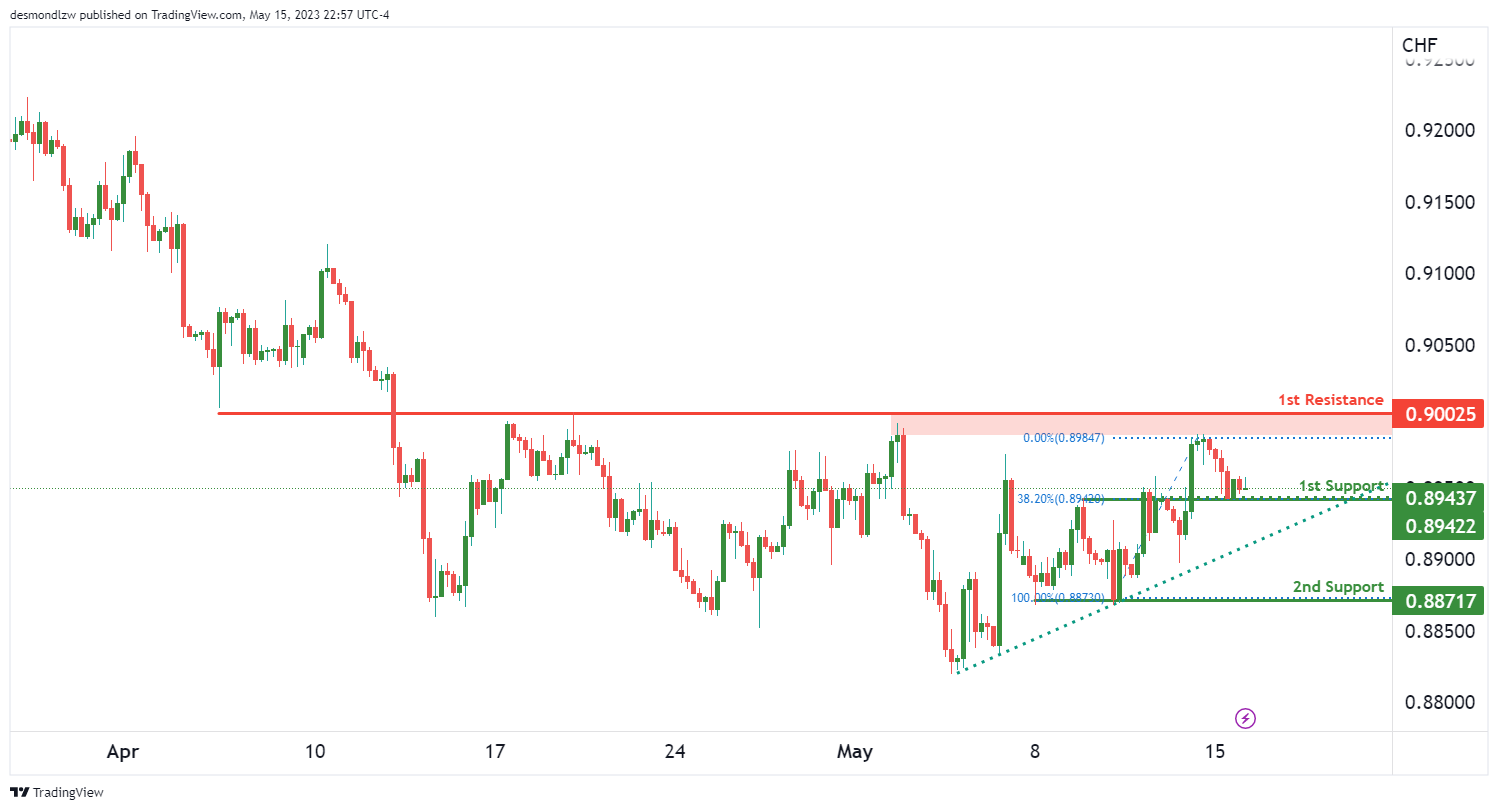
The USD/CHF pair is currently demonstrating notable bullish momentum, indicating a potential continuation of the upward trend. This bullish tendency is further suggested by the price’s position above a major ascending trend line, suggesting that further bullish momentum is likely.
Our first support level stands at 0.8943, which serves as an overlap support and aligns with a 38.2% Fibonacci retracement. This suggests a strong potential for price stability at this level. In the event of a bullish bounce from this first support, the price could potentially rise towards the first resistance level at 0.9002.
The first resistance level is an overlap resistance, suggesting that it might pose a significant barrier to further price increases.
However, should the price fail to maintain above the first support, the second support at 0.8871 could come into play. This level serves as a multi-swing low support, making it a crucial level to watch for potential price rebounds.
USD/JPY:
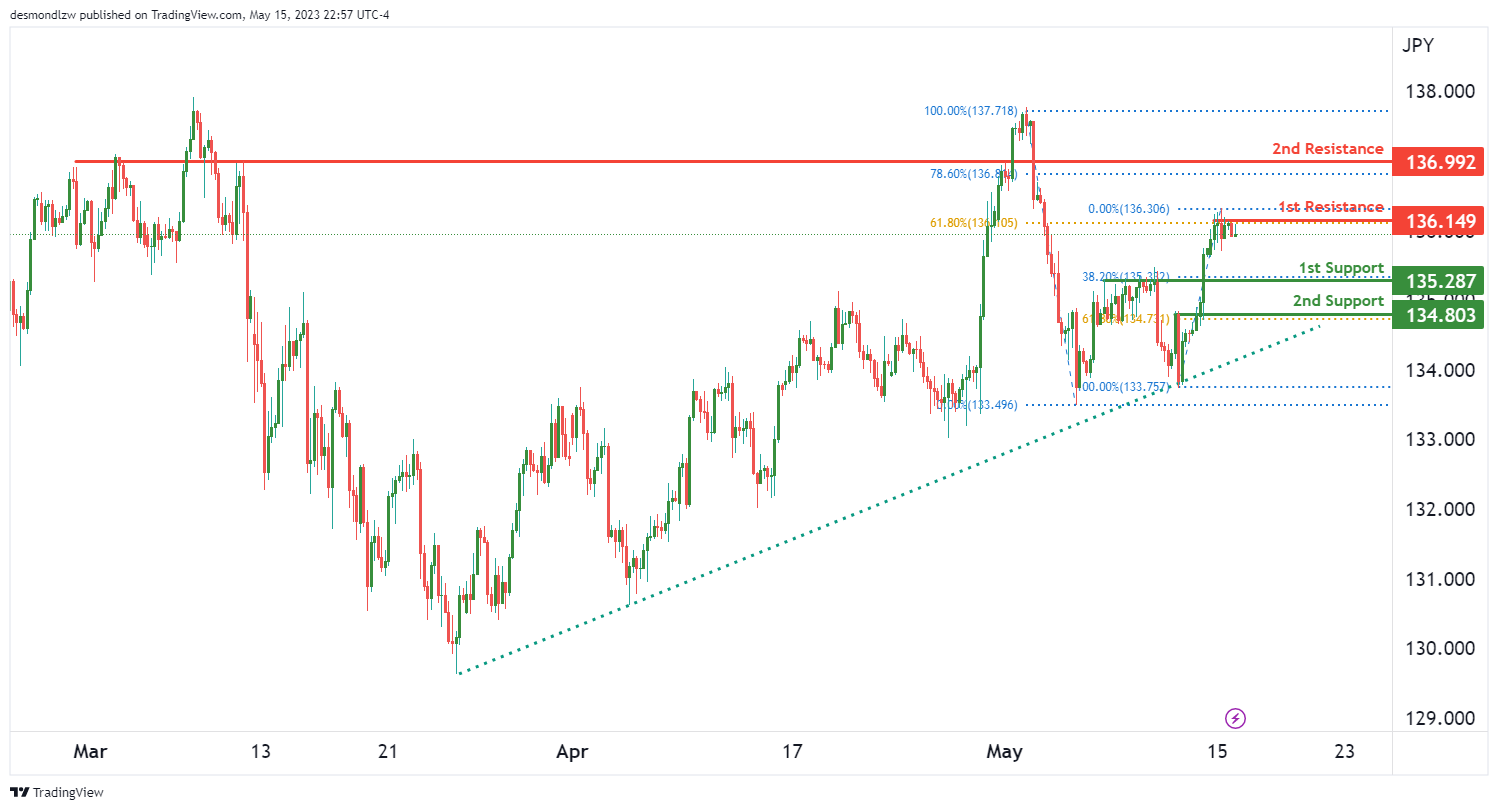
The USD/JPY pair is currently demonstrating strong bullish momentum, indicating the potential for a continuation of the upward trend. This bullish tendency is further suggested by the price’s position above a major ascending trend line, suggesting further bullish momentum is likely.
Our first support level stands at 135.28, which serves as a pullback support and coincides with a 38.2% Fibonacci retracement. This suggests a strong potential for price stability at this level.
However, in light of the current bullish momentum, the focus is on the potential for the price to break through the first resistance level, situated at 136.14. This level serves as a multi-swing high resistance and aligns with a 61.8% Fibonacci retracement, suggesting it might present a significant barrier to further price increases. A bullish breakthrough of this level could potentially lead to a rise towards the second resistance level.
The second resistance stands at 136.99 and is characterized as a pullback resistance. It also coincides with a 78.6% Fibonacci retracement, suggesting that it could pose a significant hurdle for any potential bullish momentum.
In the event the price fails to maintain above the first support, the second support at 134.80 could come into play. This level serves as an overlap support and coincides with a 61.8% Fibonacci retracement, making it a crucial level to watch for potential price rebounds.
AUD/USD:
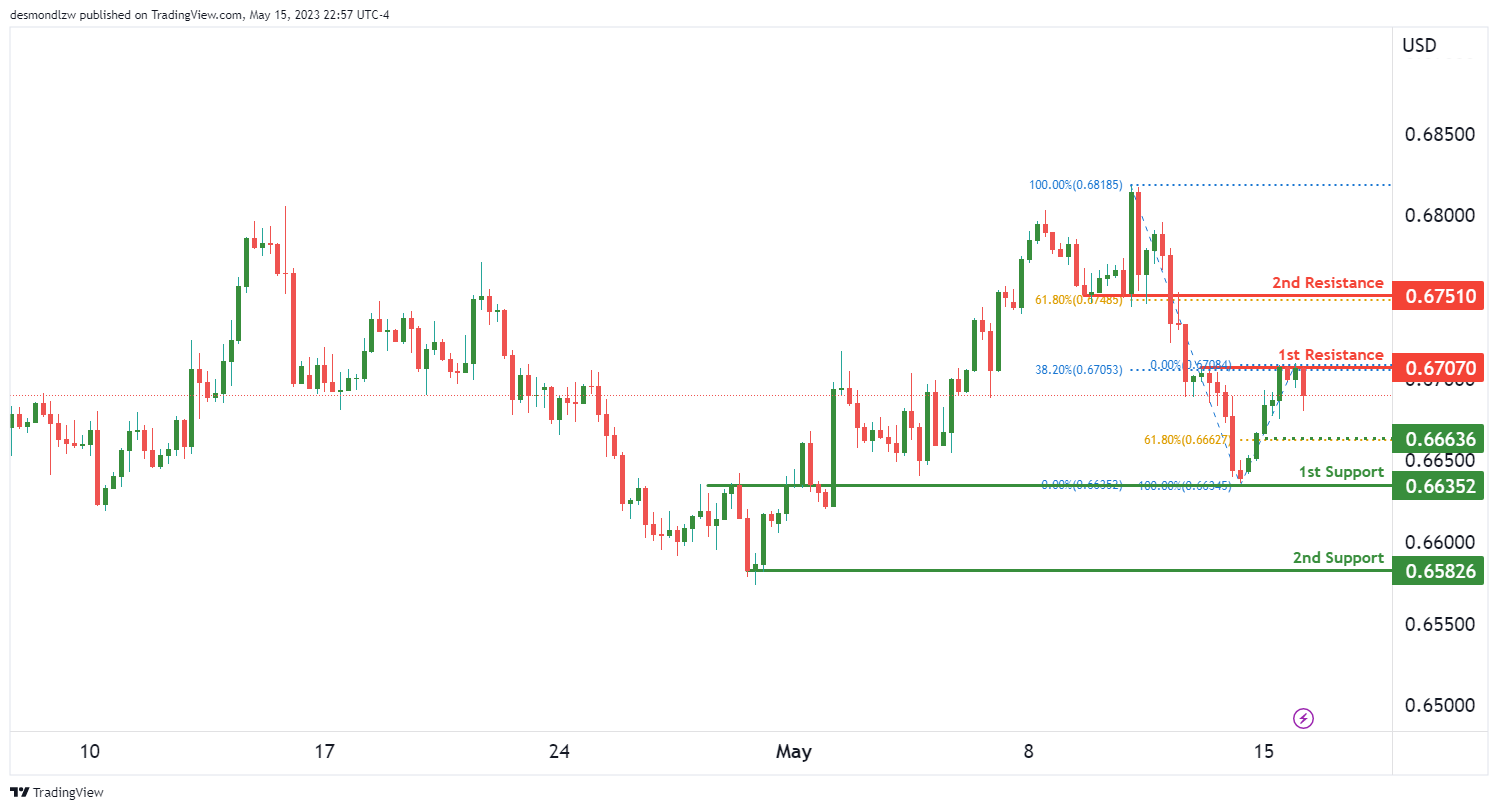
The AUD/USD pair is currently demonstrating significant bearish momentum, indicating a possible continuation of the downward trend. There’s a potential for the price to continue bearishly towards the first support level.
Our first support level is located at 0.6635, which serves as an overlap support, suggesting a strong potential for price stability at this point. A bearish continuation from the current price levels might lead the price towards this first support.
However, should the price fail to maintain above the first support, our second support at 0.6582 could come into play. This level serves as a multi-swing low support, making it a crucial level to watch for potential price rebounds.
Looking upwards, our first resistance stands at 0.6707. This level is a multi-swing high resistance and aligns with a 38.2% Fibonacci retracement, suggesting that it might present a significant barrier to any upward price movements.
Beyond the first resistance, our second resistance is at 0.6751. This level is a pullback resistance and coincides with a 61.8% Fibonacci retracement, suggesting that it could pose a significant hurdle for any potential bullish momentum.
Additionally, there is an intermediate support level at 0.6663, which aligns with a 61.8% Fibonacci retracement, further emphasizing the bearish bias of the current price movement.
NZD/USD
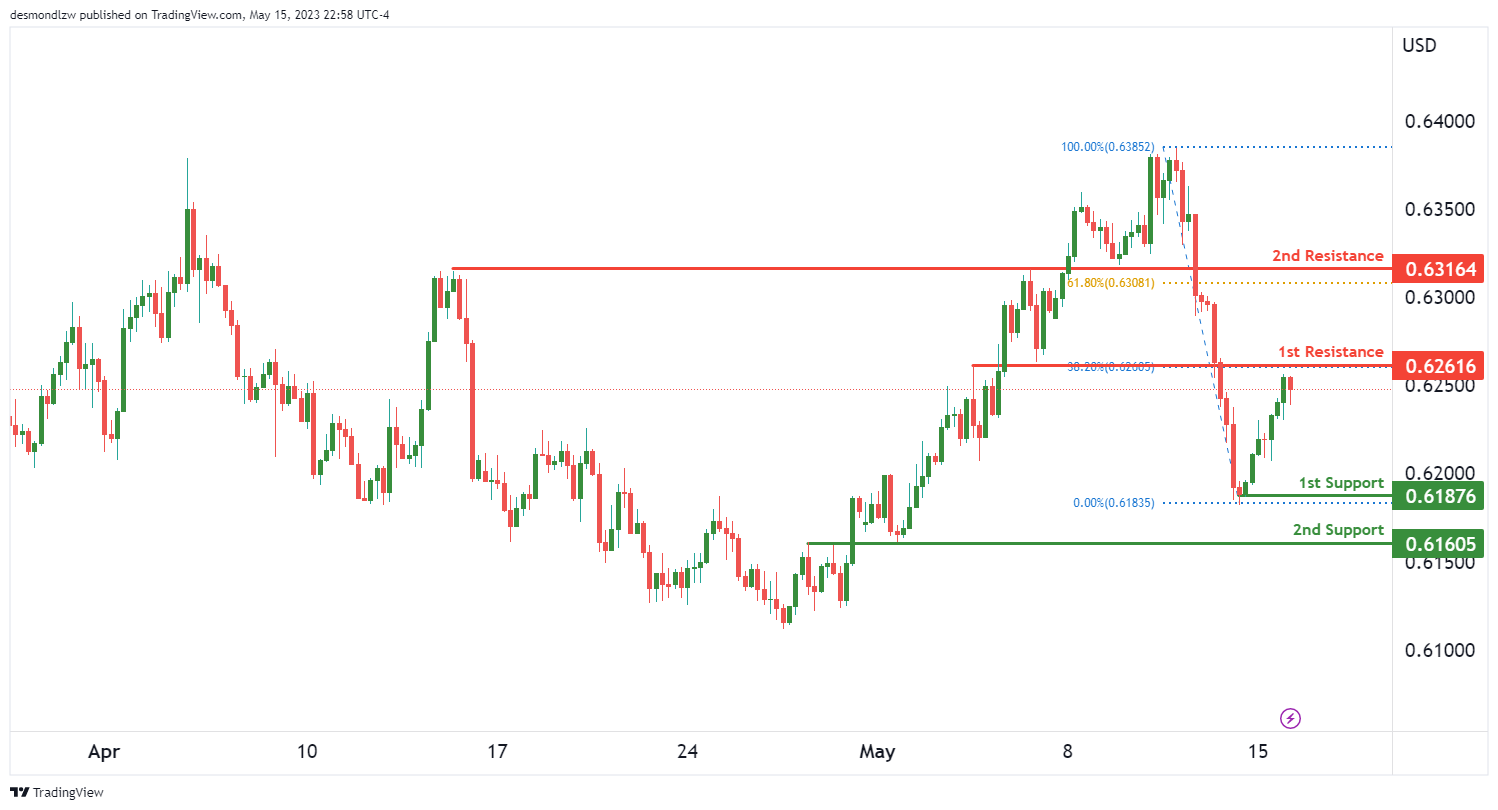
The NZD/USD pair is currently showing significant bearish momentum, indicating a possible continuation of the downward trend. There’s a potential for a bearish reaction off the first resistance, leading to a drop towards the first support level.
Our first support level is located at 0.6187, functioning as a swing low support. This suggests a strong potential for price stability and may serve as a pivot for any potential bullish reversal.
However, should the price fail to maintain above the first support, our second support at 0.6160 could be activated. This level serves as an overlap support and coincides with a 38.2% Fibonacci retracement, making it a significant level to watch for potential price rebounds.
Looking upward, our first resistance is at 0.6261. This level acts as a pullback resistance and coincides with a 61.8% Fibonacci retracement, suggesting that it may present a substantial barrier to any upward price movements.
Beyond the first resistance, our second resistance is at 0.6316. This level is a pullback resistance, suggesting it could pose a significant hurdle for any potential bullish momentum.
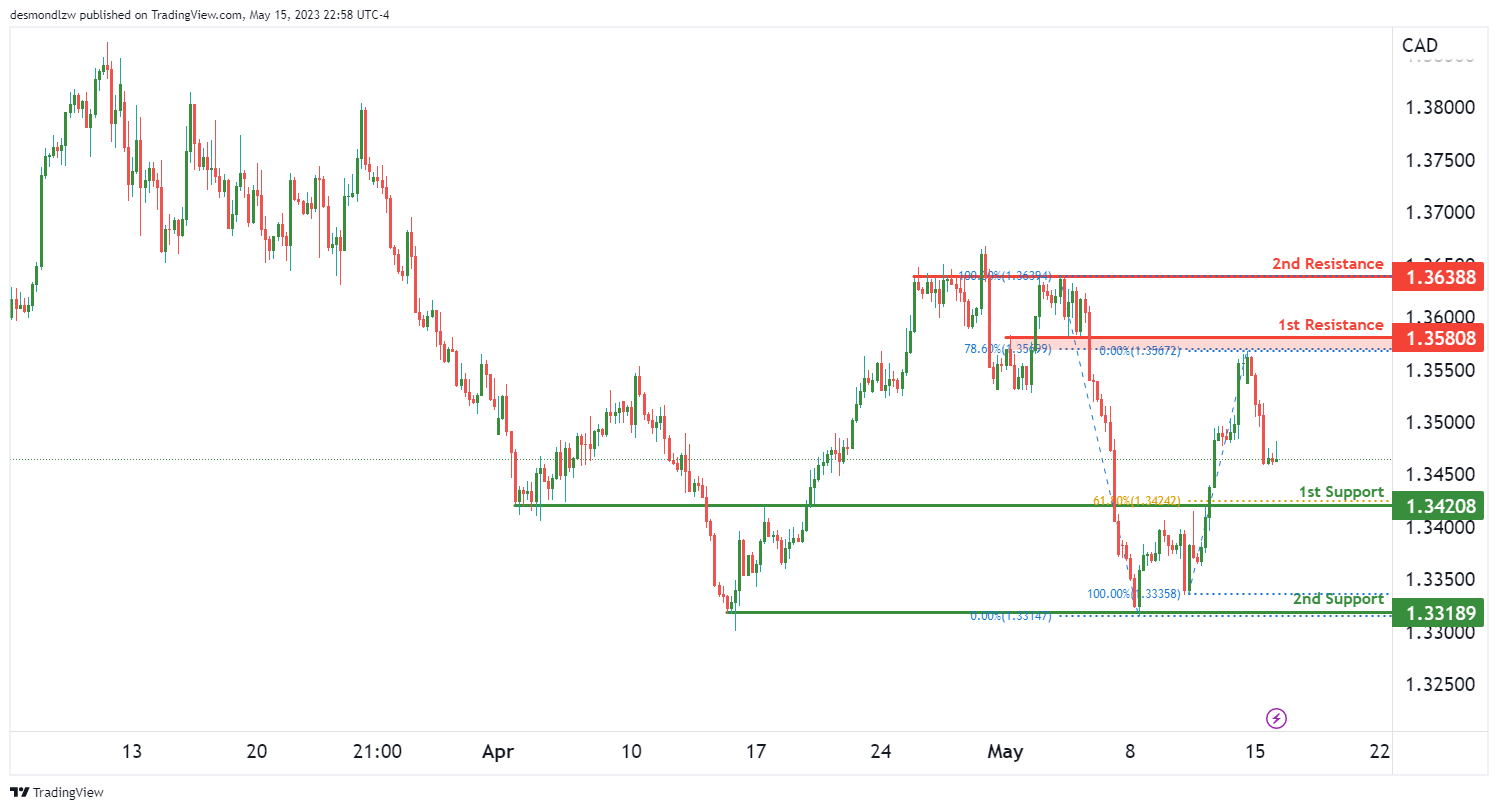
USD/CAD:
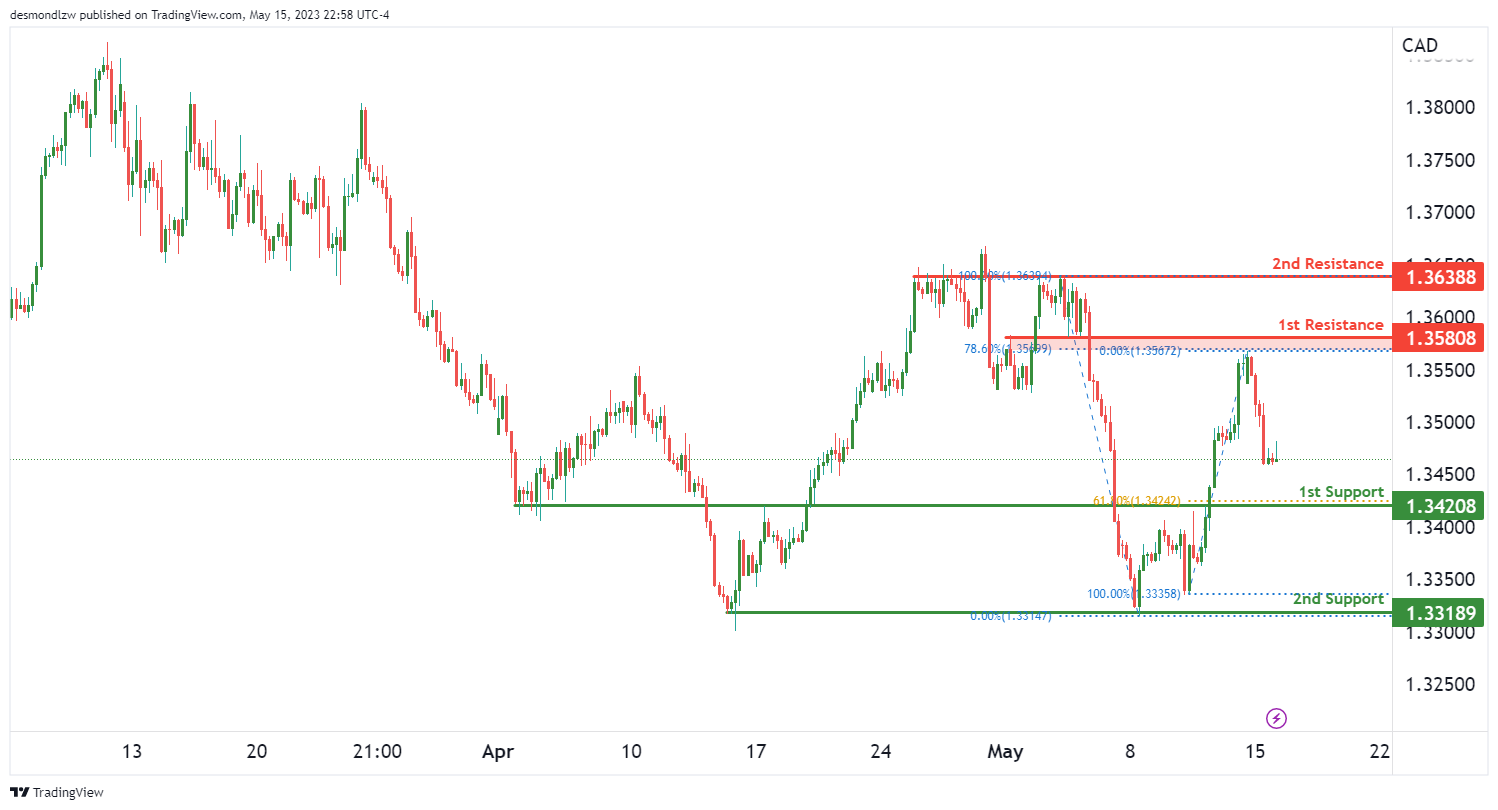
The USD/CAD pair is currently demonstrating significant bearish momentum, suggesting a possible continuation of the downward trend. There’s potential for a bearish continuation towards the first support level.
Our first support level is located at 1.3420, acting as a pullback support and coinciding with a 61.8% Fibonacci retracement. This suggests a strong potential for price stability and may serve as a pivot point for any potential bullish reversal.
However, should the price fail to hold above the first support, our second support at 1.3318 could come into play. This level serves as a multi-swing low support, making it a significant level to watch for potential price rebounds.
Looking upwards, our first resistance stands at 1.3580. This level acts as an overlap resistance and aligns with a 78.6% Fibonacci retracement, suggesting it might present a significant barrier to any upward price movements.
Beyond the first resistance, our second resistance is at 1.3638. This level is a multi-swing high resistance, suggesting it could pose a significant hurdle for any potential bullish momentum.
DJ30:
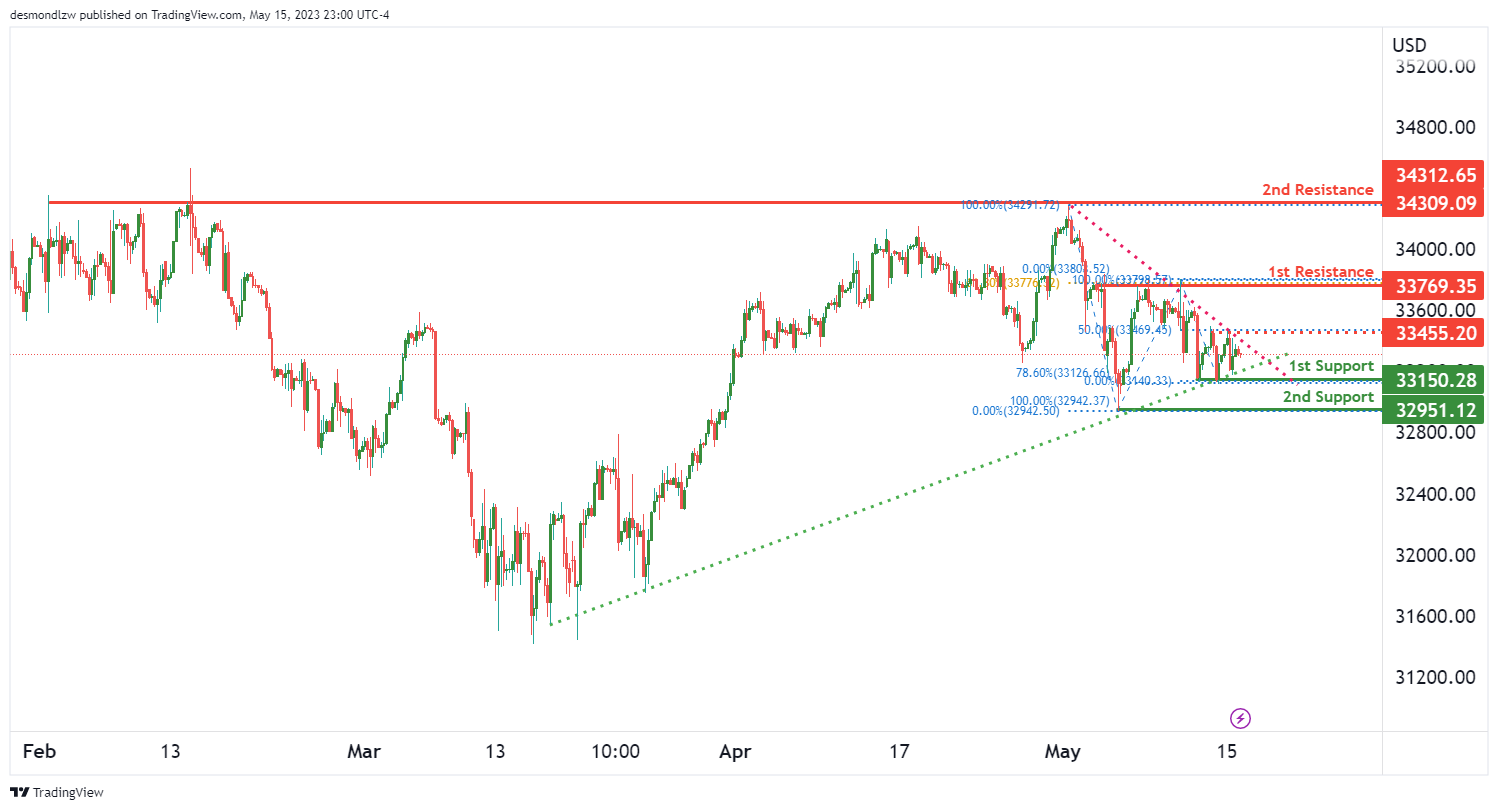
The Dow Jones Industrial Average (DJ30) currently exhibits a neutral momentum, leaving the market in a state of anticipation. The DJ30 might potentially fluctuate between the first resistance and the first support level, suggesting that neither the bulls nor the bears have a strong hold over the market direction.
The first support level stands at 33150.28, acting as a pullback support and aligning with a 78.6% Fibonacci retracement. This level could offer considerable support to the index, should it face any downward pressure.
Should the index breach the first support, the second support at 32951.12 could come into play. This level is a swing low support, and its significance lies in its ability to potentially halt further losses.
On the upside, the first resistance is at 33769.35, acting as a multi-swing high resistance and coinciding with a 61.8% Fibonacci retracement. This level could pose a challenge for the bulls, and any significant move above this level could signal a shift in the market sentiment.
Further up, the second resistance at 34309.09, another multi-swing high resistance, could provide a robust barrier to any sharp bullish momentum.
Intriguingly, the DJ30’s recent price action has formed a symmetrical triangle chart pattern, often seen as a period of consolidation before a significant breakout or breakdown. A break above the upper trendline of this pattern could signal a bullish breakout, while a break below the lower trendline might indicate a bearish breakdown.
GER30:
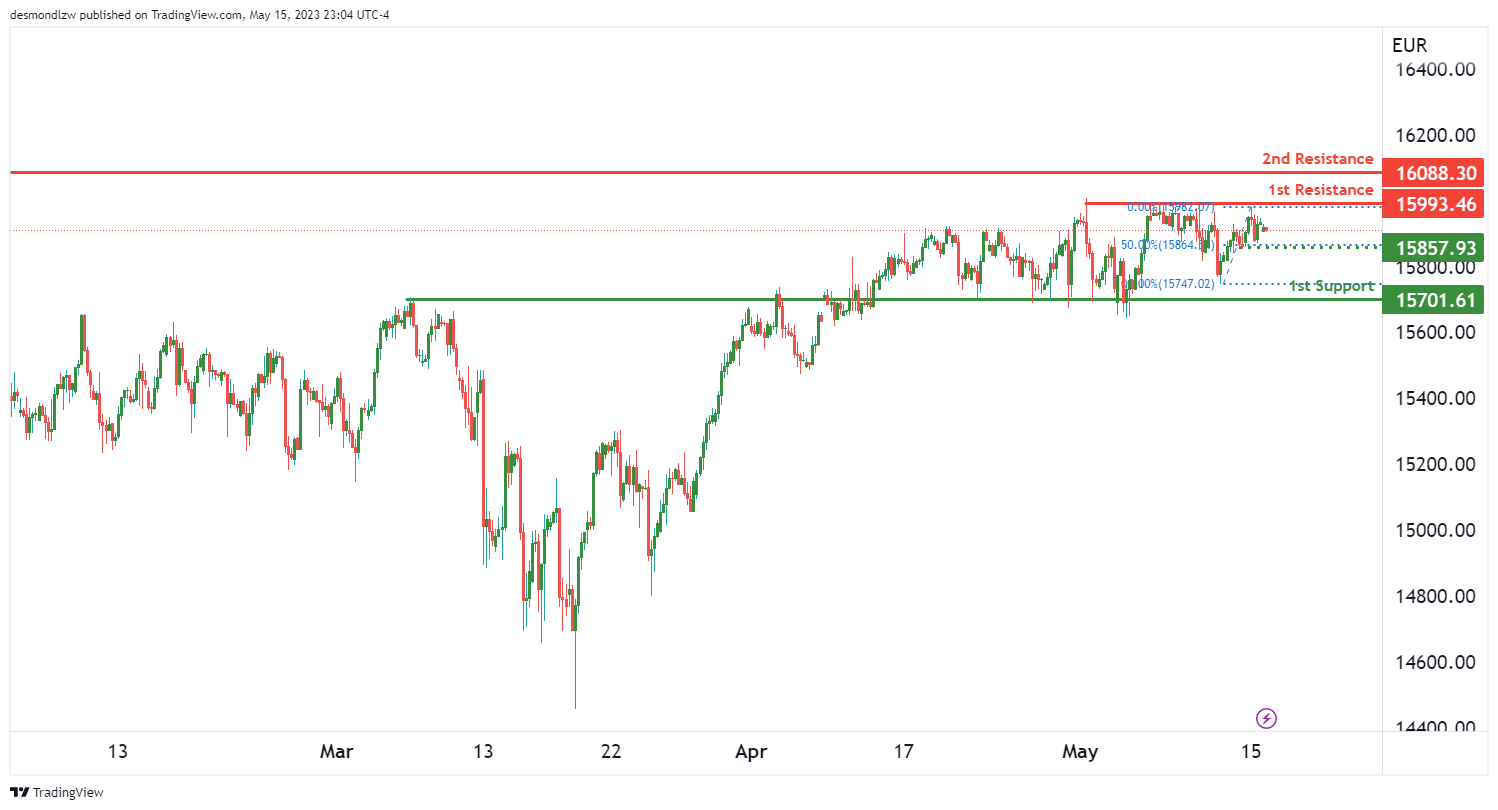
The GER30, or the DAX 30 Index, currently finds itself in a neutral momentum, indicating an ongoing tussle between the bulls and the bears. The market might potentially see the GER30 fluctuate between the first resistance and the first support level, highlighting a state of balance between upward and downward forces.
The first support level is located at 15701.61, functioning as an overlap support. This level is significant as it represents a price point where the market previously found enough demand to halt a downward move and start an upward one. Hence, it could act as a robust floor, propping the GER30 up if downward pressures materialize.
On the upside, the first resistance stands at 15993.46, a multi-swing high resistance. This level denotes a point where the GER30 previously faced selling pressure strong enough to halt an upward move and start a downward one. It could serve as a substantial ceiling, challenging any bullish attempts to push higher.
A further upward push might encounter the second resistance at 16088.30, a swing high resistance. This level marks a previous high point on the chart, which might again attract selling pressure.
BTC/USD:
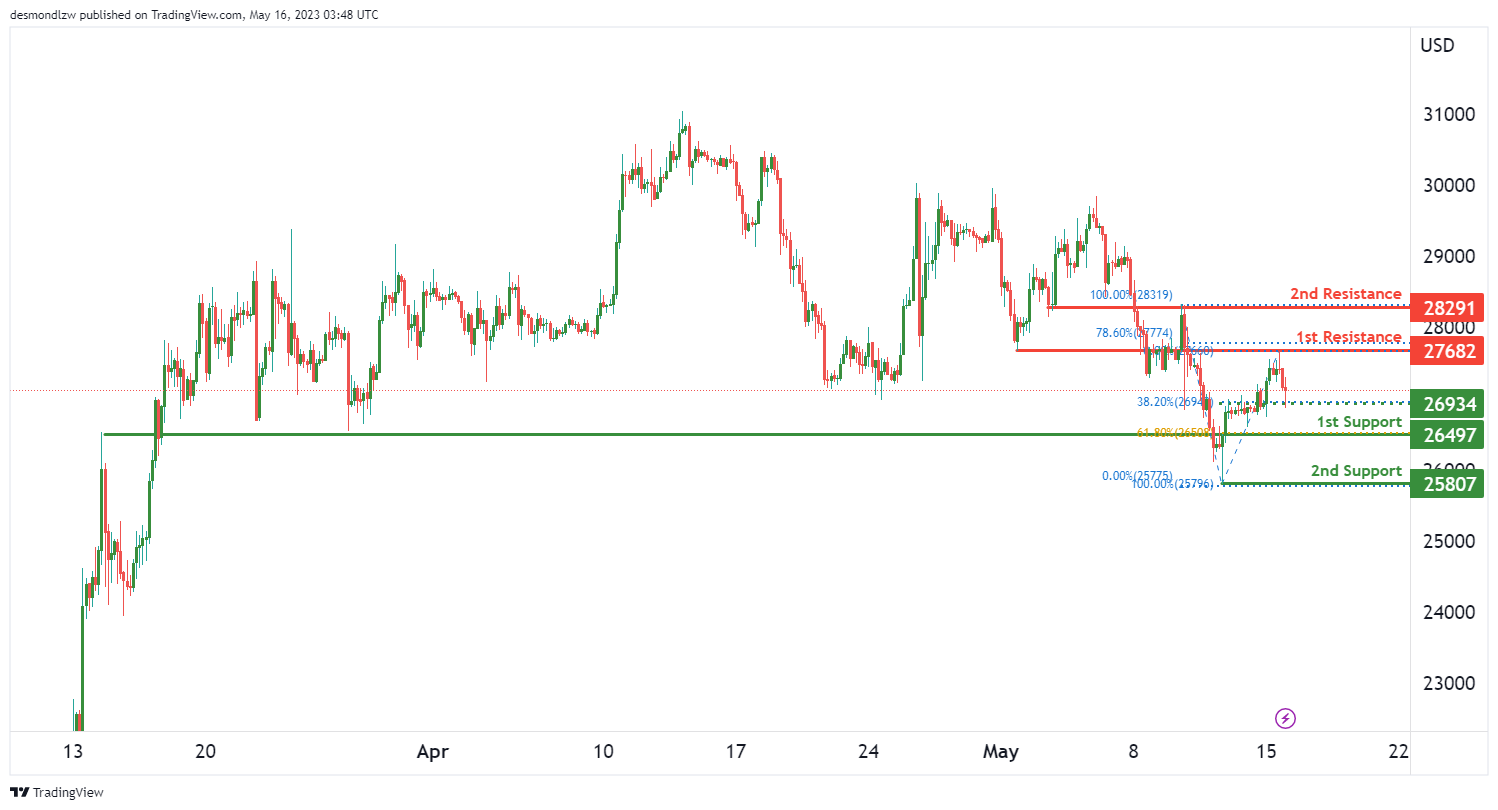
The overall momentum of the BTC/USD (Bitcoin/US Dollar) pair is currently bearish, suggesting a likely continuation of the downward move towards the first support level.
The first support is seen at 26497.00, which serves as a pullback support and aligns with the 61.80% Fibonacci retracement level. This key technical level, derived from the Fibonacci sequence, is often used by traders to anticipate areas of possible support or resistance.
A further drop could test the 2nd support at 25807.00, a level marked by a previous swing low. Here, the market had once found enough buying pressure to stop a downward trend and begin an upward move. As such, it could be a challenging barrier for the bears.
On the upside, the first resistance is placed at 27682.00, characterized as an overlap resistance and coinciding with the 78.60% Fibonacci retracement. This level denotes a previous price zone where selling pressure overcame buying pressure, hence it could potentially impede any bullish attempts.
Beyond that, the second resistance is located at 28291.00, another overlap resistance, indicating a price zone that has acted as both support and resistance in the past.
An intermediate support level is also observed at 26934.00, functioning as an overlap support and lining up with the 38.20% Fibonacci retracement. This level could act as a safety net for any steeper falls.
US500
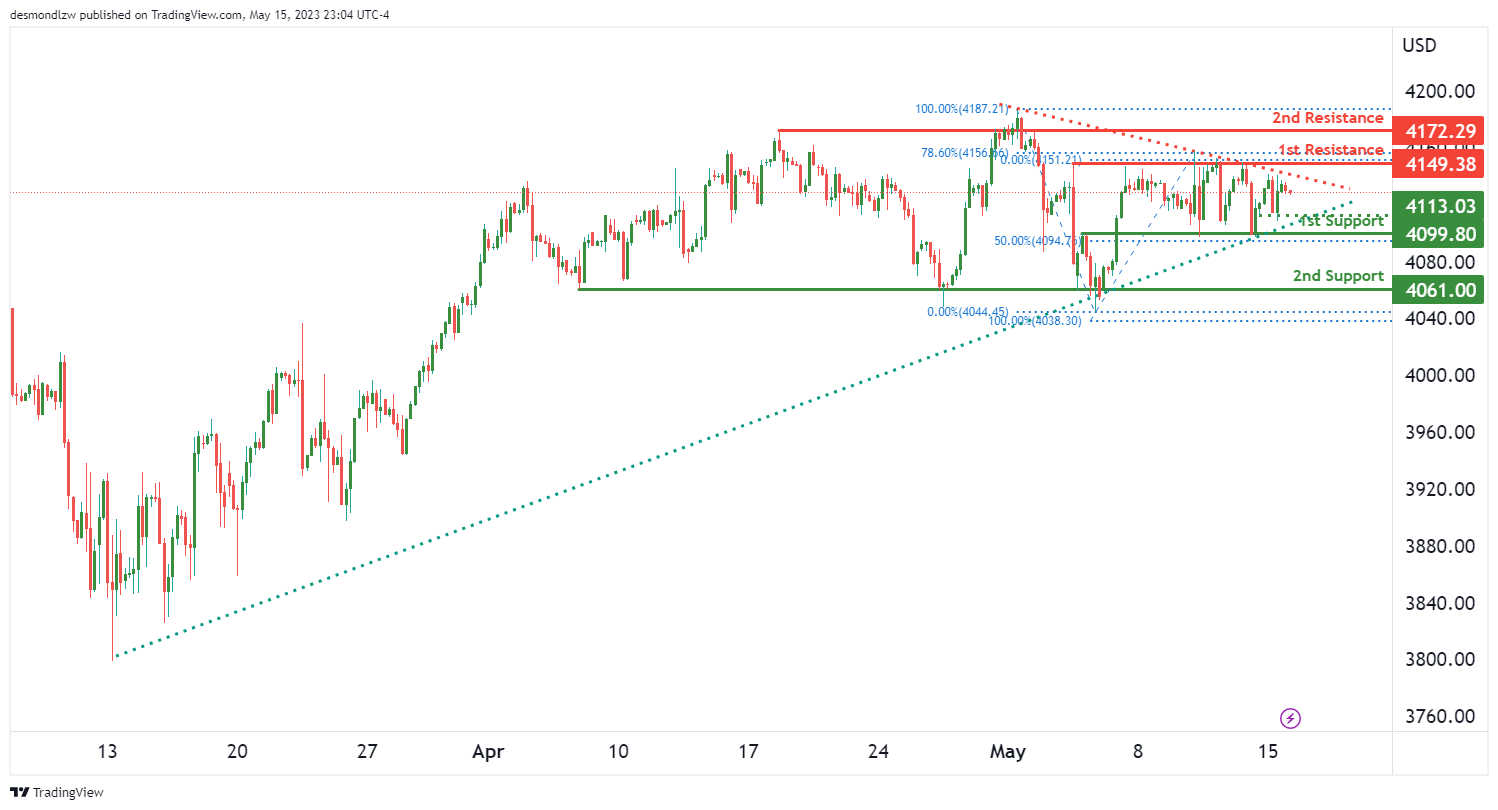
The US500 index is currently demonstrating a neutral momentum, indicating that the price might fluctuate between the first resistance and the first support levels.
The first support level is located at 4099.80, an overlap support that also corresponds with the 50% Fibonacci retracement level. This convergence of key technical indicators might strengthen this level’s potential to halt any downside movement.
If the price continues to fall, the 2nd support level to watch out for is 4061.00. This level, identified as a multi-swing low support, has acted as a floor for the price in the past, suggesting a potential area where buying interest could resurface.
On the upside, the first resistance is placed at 4149.38. This level is characterized as a multi-swing high resistance and aligns with the 78.60% Fibonacci retracement, implying it could pose a significant hurdle for bullish attempts.
Further up, the second resistance is found at 4172.29. This overlap resistance level, where the price has previously alternated between support and resistance, could further limit upside potential.
An intermediate support level is also observed at 4113.03, serving as a swing low support that could offer a temporary resting spot for the price during a potential downward move.
The presence of a symmetrical triangle chart pattern suggests a period of consolidation. This pattern typically precedes a breakout or breakdown. A break above the pattern’s upper trendline might indicate a bullish breakout, while a break below could signal a bearish breakdown.
ETH/USD:
Ethereum’s recent price action against the US Dollar (ETH/USD) indicates a bearish momentum, suggesting a potential bearish reaction off the first resistance level and a subsequent drop towards the first support.
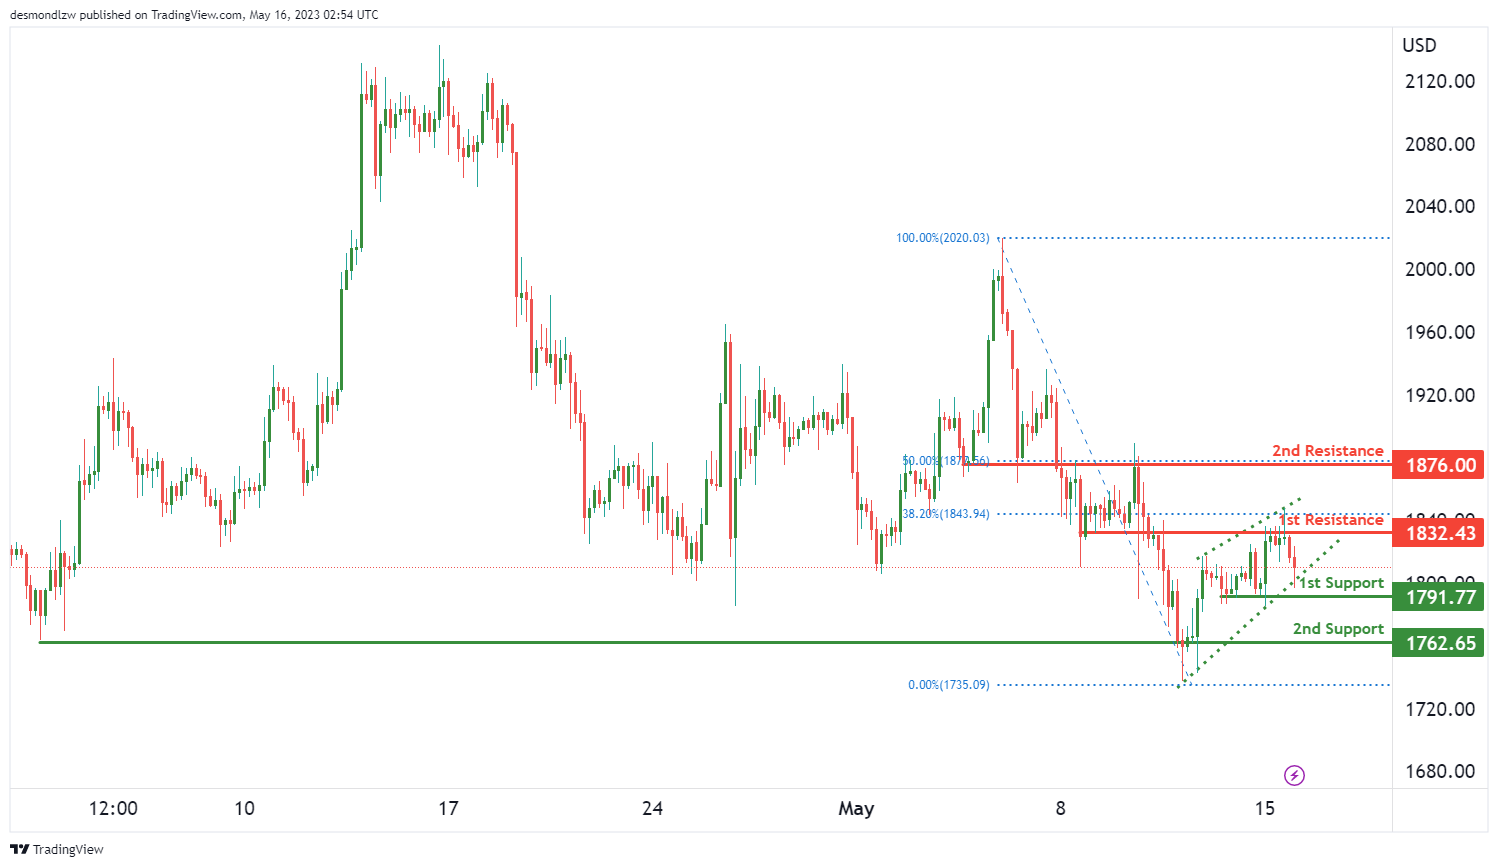
The first level of support is found at 1791.77. This multi-swing low support has been tested multiple times in the past, making it a critical level to watch. Should the price action respect this level, we could see a bounce back upwards. However, a break below this support could see the price slide further to the second support at 1762.65, another well-tested multi-swing low support level.
On the upside, the first resistance level is at 1832.43. This overlap resistance, which aligns with the 38.20% Fibonacci retracement level, could pose a significant barrier to bullish price action. Any upside movement could be capped at this point, potentially driving the price back towards support levels.
Further up, the second resistance level is at 1876.00. This is another overlap resistance and coincides with the 50% Fibonacci retracement level, suggesting a significant area of potential sell pressure.
Importantly, the chart pattern indicates a bearish rising wedge formation. This type of wedge pattern is typically bearish, signaling that the price is likely to drop and move in the downward direction soon.
WTI/USD:
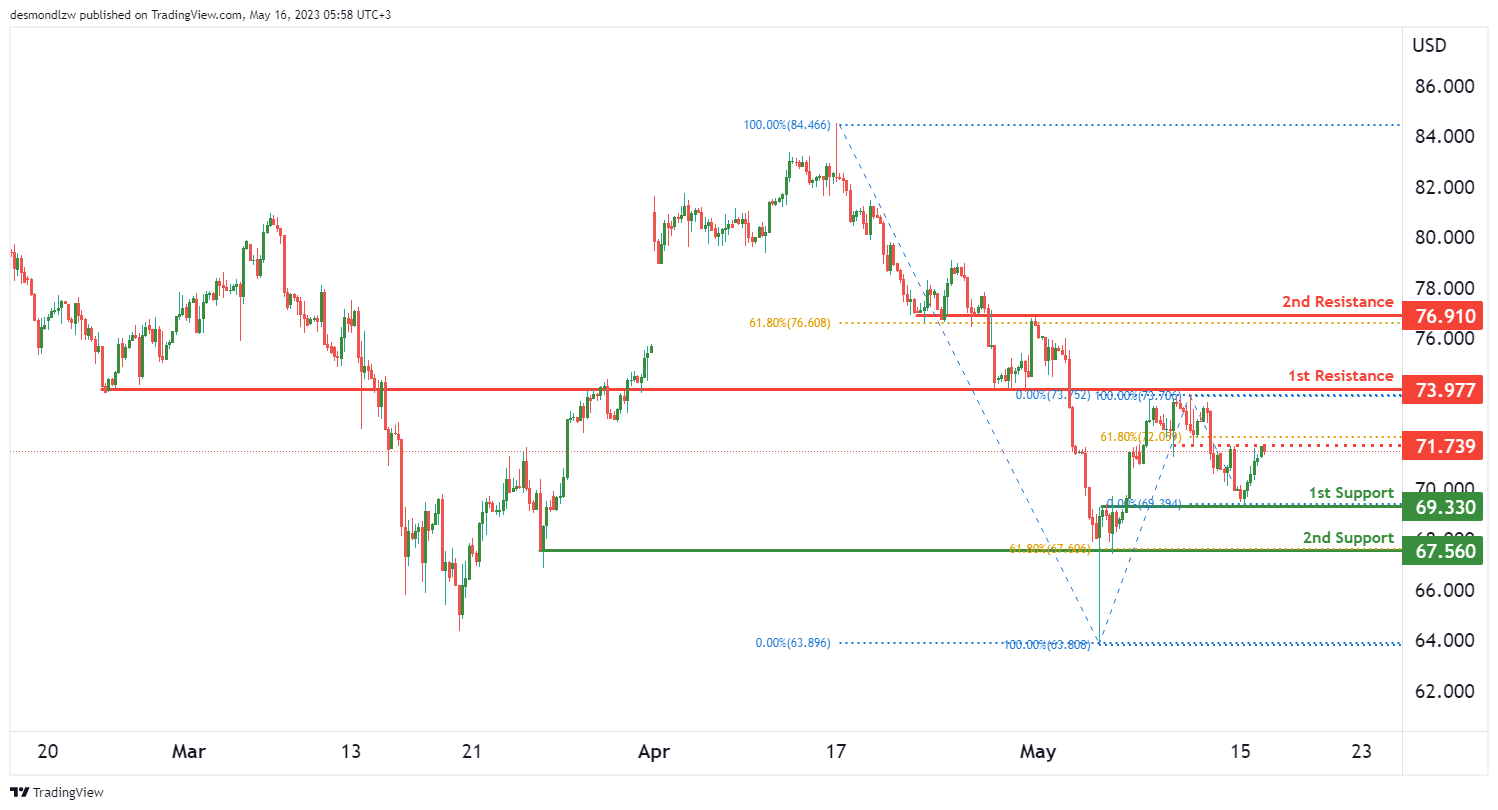
The current chart for West Texas Intermediate (WTI) Crude Oil suggests a bearish momentum, with the price potentially making a bearish continuation towards the first support level.
The first support level to watch for is at $69.33, an overlap support that has proven to be a significant level in the past. If this support holds, it could lead to a price bounce. However, if the price breaks through this level, it could fall further towards the second support at $67.56, which is a multi-swing low support level.
On the upside, the first resistance level is at $73.97. This overlap resistance coincides with the 38.20% Fibonacci retracement level, potentially posing a challenge for any bullish momentum. If the price reaches this level and fails to break through, we could see a reversal towards the support levels.
Higher still, the second resistance level is at $76.91, another overlap resistance that aligns with the 61.80% Fibonacci retracement level. This could be a significant hurdle for any bullish price movement, potentially driving the price back down.
In between these levels, there’s an intermediate resistance at $71.73, which is also an overlap resistance and matches up with the 61.80% Fibonacci retracement level. This level could act as a minor barrier to upward price action.
XAU/USD (GOLD):
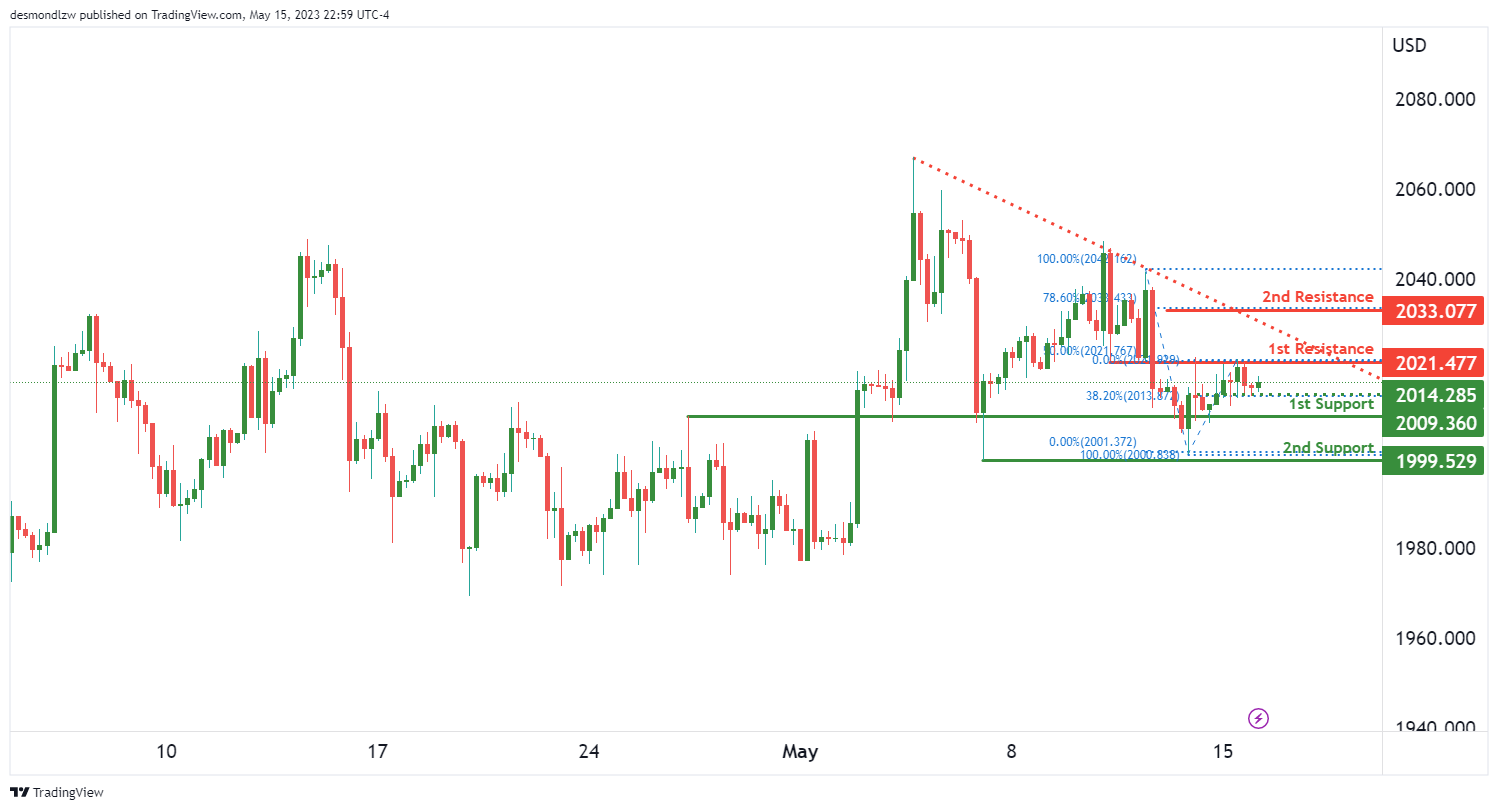
The overall momentum of the Gold (XAU/USD) chart is bearish. Factors contributing to this bearish momentum include the price being below a major descending trend line, suggesting further downward momentum is likely.
Given the current market conditions, the price could potentially continue its downward move towards the first support level.
The first support level is at $2009.36, which is an overlap support. This support level has been tested multiple times in the past, making it a significant level for traders to watch.
If the price continues to fall, the next level to watch would be the second support at $1999.52. This level has acted as a multi-swing low support and could potentially halt further downward movement.
On the upside, the first resistance is at $2021.47. This level is an overlap resistance and aligns with the 50% Fibonacci retracement level, making it a significant barrier for any bullish price movements.
The second resistance is at $2033.07, which corresponds to the 78.60% Fibonacci retracement level. This level could act as a strong barrier for price, making it difficult for bullish momentum to continue.
The intermediate support level is at $2014.28, which is an overlap support and corresponds with the 38.20% Fibonacci retracement level. This level could potentially act as a stopping point for price during a bearish retracement.
China’s industrial production, retail sales miss expectations; youth unemployment hits record high
China's industrial production growth fell short of expectations in April, with a year-on-year increase of 5.6% yoy, significantly under expectation of 10.1% growth. Despite missing the mark, the growth rate outpaced March's 3.9% yoy rise and marked the fastest expansion since September 2022.
Retail sales also grew less than expected, posting 18.4% yoy rise, which fell short of anticipated 20.1% yoy growth. The figure was largely inflated due to a low comparison base, as retail sales plummeted by -11.1% yoy in April of the previous year due to severe lockdowns. On a monthly basis, retail sales contracted by -7.8% mom from March.
Fixed asset investment growth also came in below expectations 4.7% ytd yoy growth, underperforming expectation of 5.2%.
Urban jobless rate ticked down from 5.3% to 5.2%. However, unemployment among 16-24 age group spiked to a record high of 20.4%, up from 19.6% in the previous month. This exceeded the previous record of 19.9% set in July 2022.
The National Bureau of Statistics (NBS) stated, "In general, in April, the national economy continued to recover, and positive factors accumulated and increased. But we must also see that the international environment is still complex and severe, domestic demand is still insufficient, and the endogenous driving force for economic recovery is not yet strong."