Sample Category Title
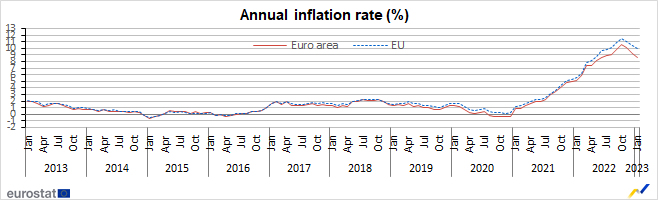
Eurozone CPI finalized at 8.6% yoy in Jan, core CPI at 5.3% yoy
Eurozone PMI was finalized at 8.6% yoy in January, down from 9.2% yoy in December. CPI core (all items ex-food, alcohol and tobacco) was finalized at 5.3% yoy, up from prior month's 5.2% yoy.
In January, the highest contribution to the annual Eurozone inflation rate came from food, alcohol & tobacco (+2.94%), followed by energy (+2.17%), services (+1.80%) and non-energy industrial goods (+1.73%).
USDCAD: The Price May Rise To 1.385
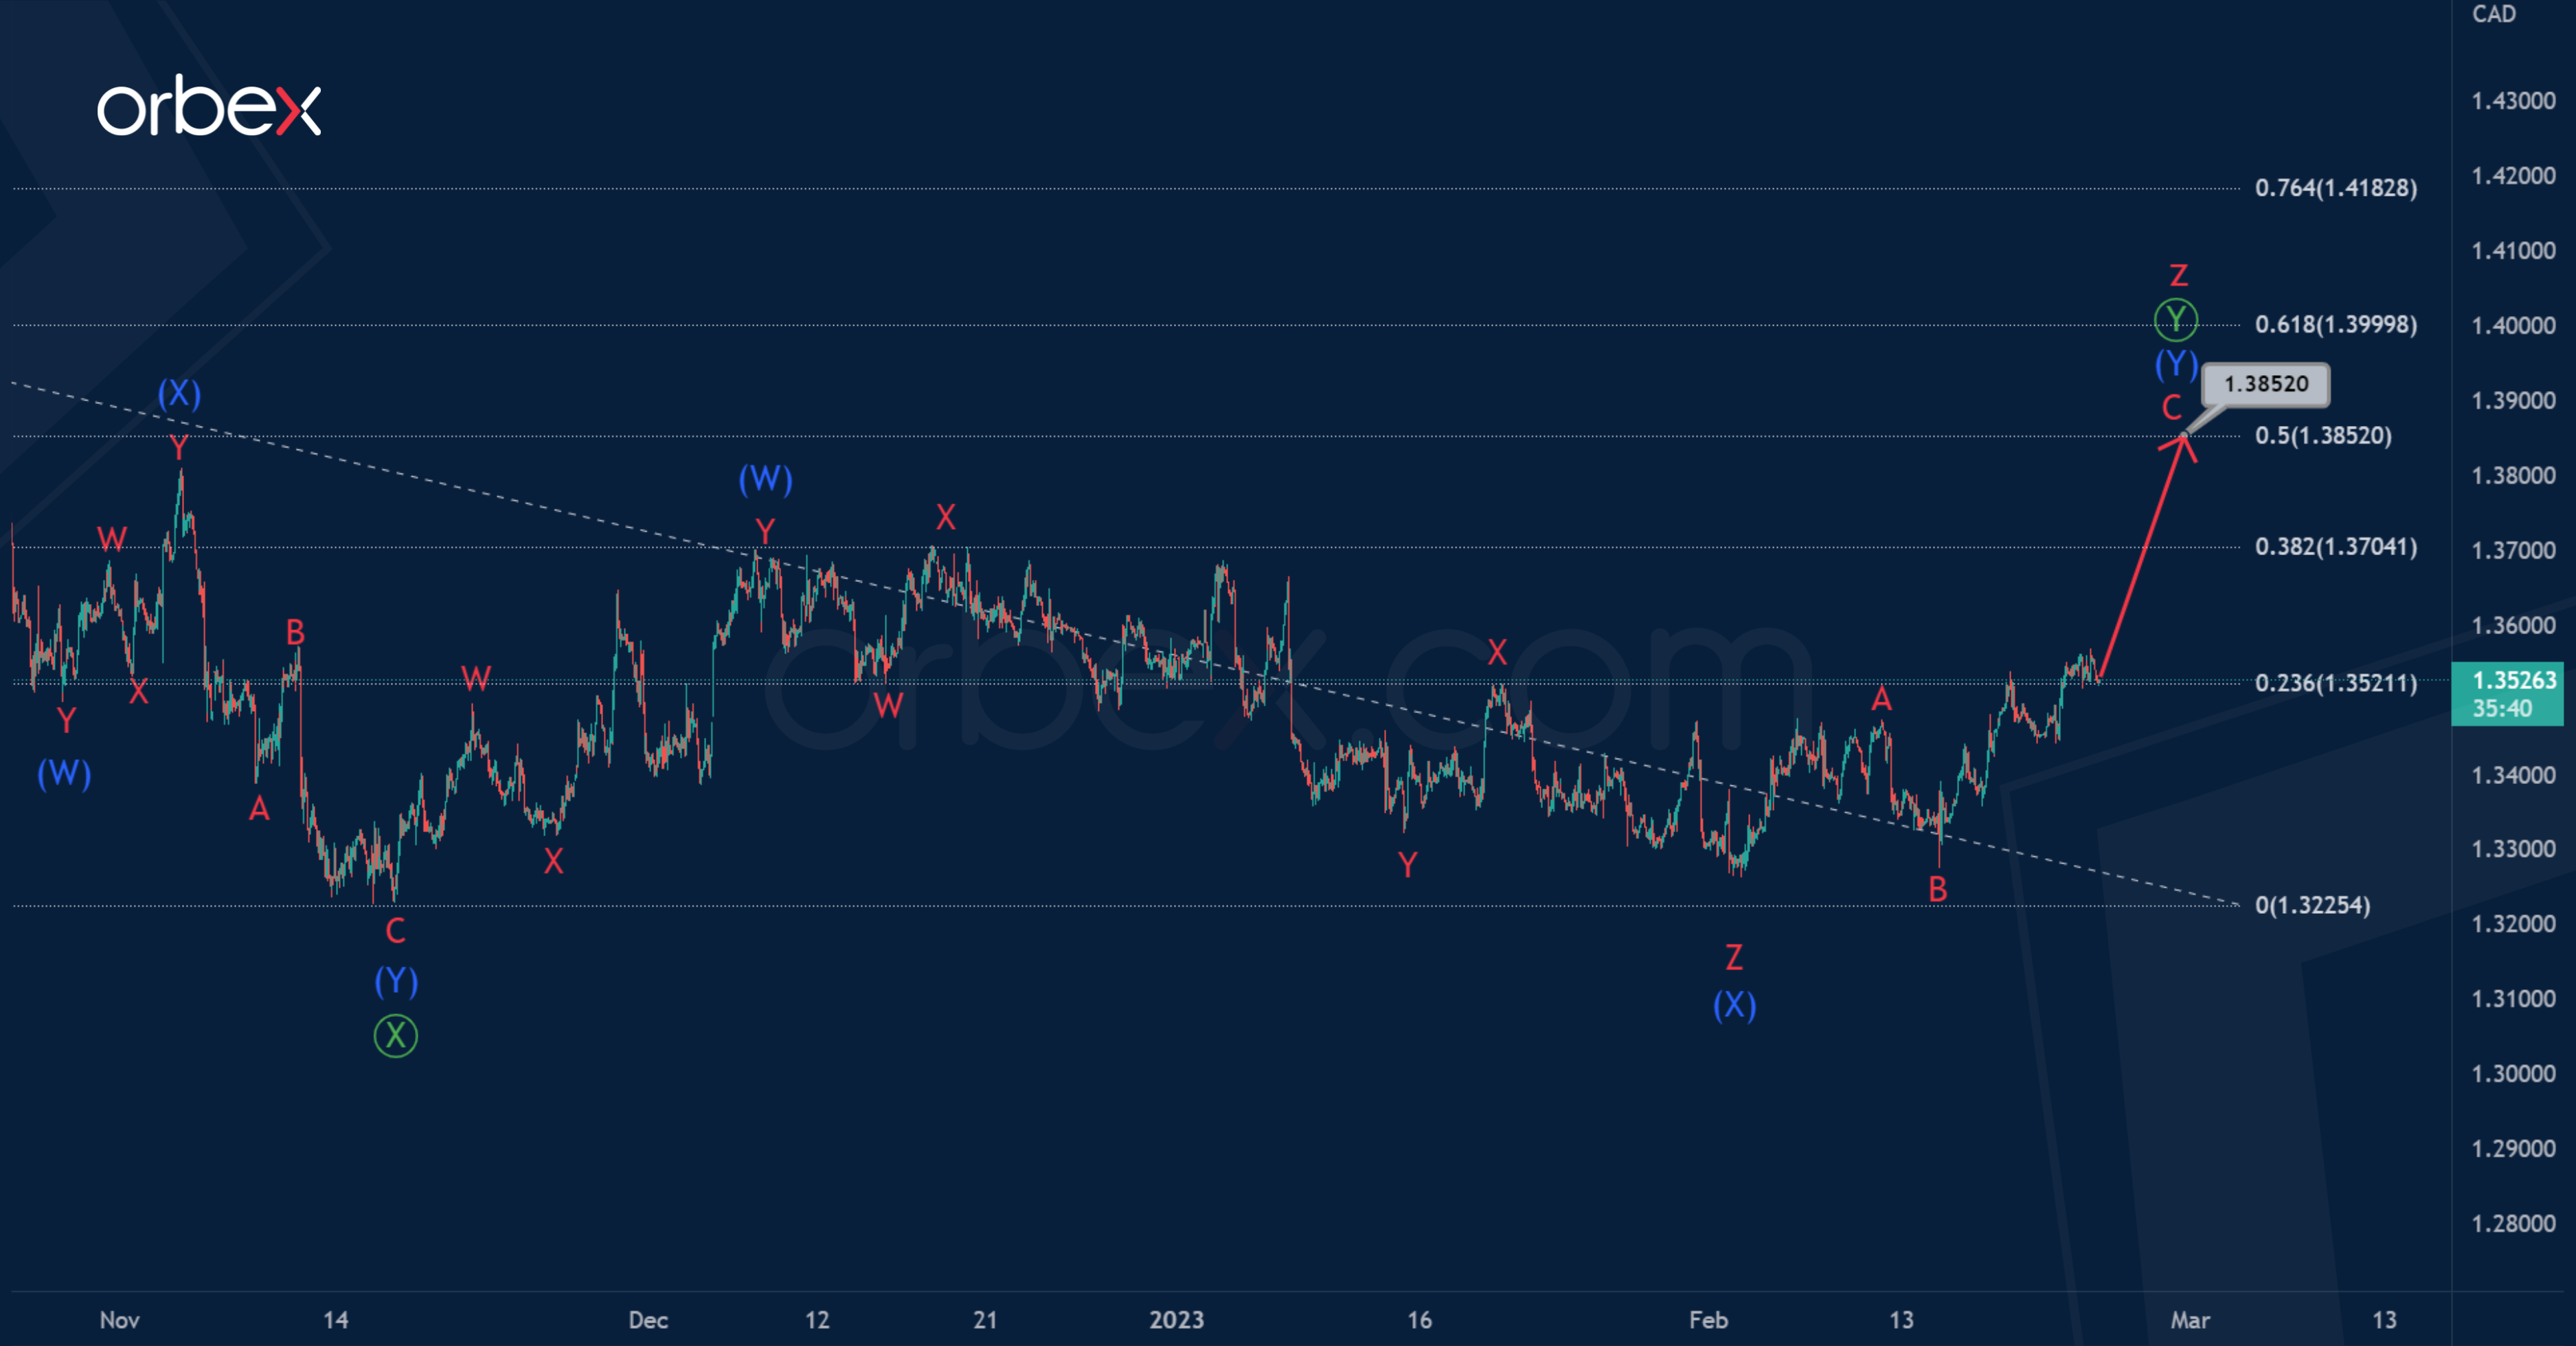
USDCAD suggests the construction of a correction pattern – a triple zigzag consisting of cycle waves w-x-y-x-z.
The cycle waves w-x-y-x are fully completed, and now the final actionary leg is being built – the sub-wave z. Apparently, the wave z takes the form of a primary double zigzag Ⓦ-Ⓧ-Ⓨ, where the sub-waves Ⓦ-Ⓧ are formed.
At the moment, the market may be in the process of building the last wave.
It can end in the form of a double zigzag (W)-(X)-(Y) near 1.385 level. At that level, it will be at 50% of zigzag wave Ⓦ.
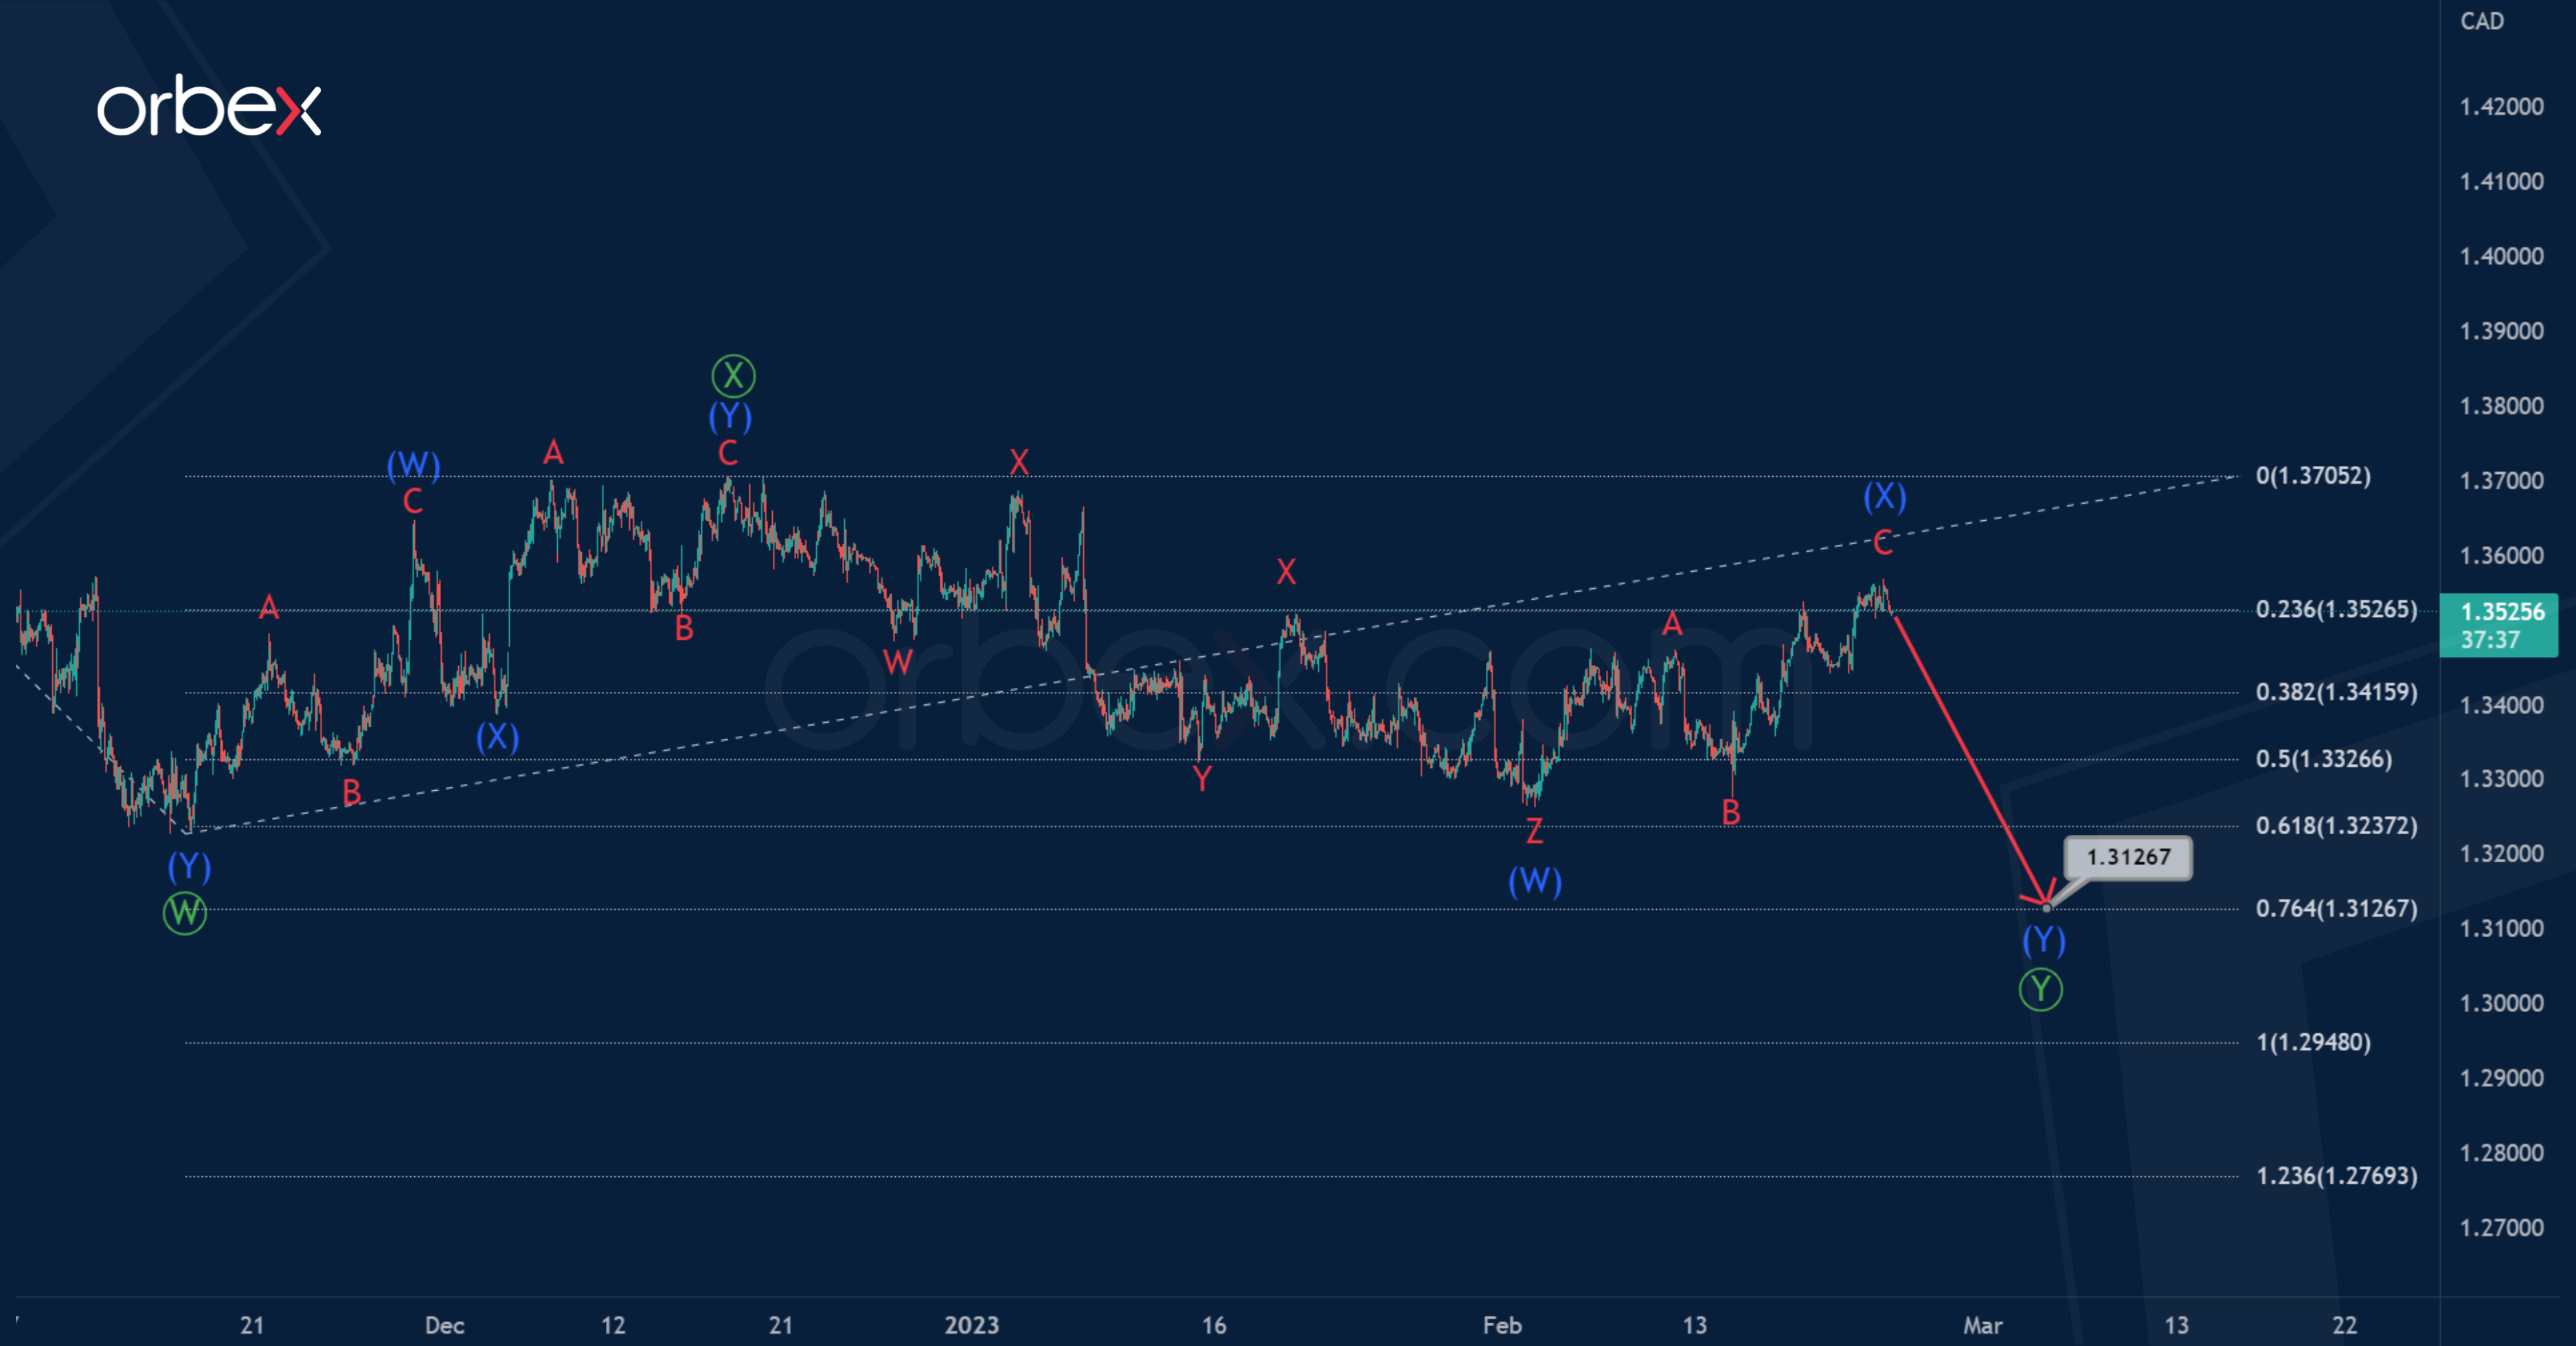
It is worth considering an alternative scenario. According to this view, the initial part of a new bearish trend can now be built.
Perhaps there is a construction of the primary double zigzag Ⓦ-Ⓧ-Ⓨ, which is the beginning in a larger correction pattern.
Perhaps the primary waves Ⓦ-Ⓧ have already been completed.
In the near future, a continuation of the bearish primary wave Ⓨ is possible. It has a double zigzag structure (W)-(X)-(Y). The end of the decline in the intermediate wave (Y) is expected near 1.312. At that level, Ⓨ will be at 76.4% of Ⓦ.
Dollar Index: Hawkish Fed Adds to Dollar’s Bullish Stance
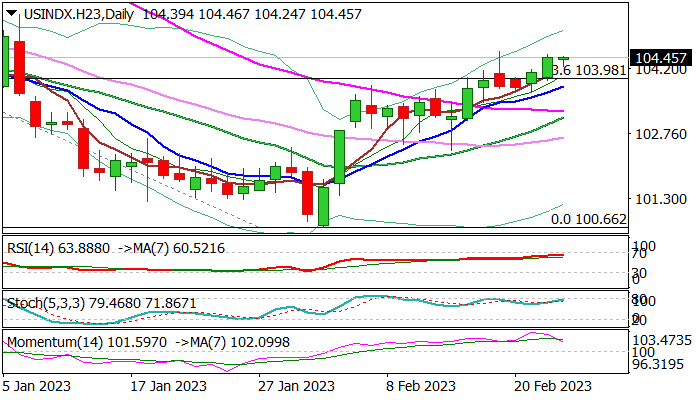
The dollar is consolidating within a tight range in early Thursday, following advance previous day and keeps overall bullish tone.
The minutes of Fed’s last policy meeting, released on Wednesday, reiterated central bank’s hawkish stance, although policymakers favored easing of the pace of interest rate hikes, they pointed to high inflation as key factor in the size and pace of further rate hikes, keeping the door open for possible acceleration in policy tightening.
The dollar index was in a steady ascend in past four weeks, inflated by hawkish signals from Fed and growing expectations that the central bank would remain in extended tightening path and, if needed, return to more aggressive mode, as series of strong rate hikes in 2022 started to show results on easing inflation, but obviously not at desired rate, keeping the levels which are unacceptably high for the central bank.
Daily studies remain bullish and underpin the action, with consolidation / shallow correction on fading bullish momentum and stochastic at the border of overbought zone, expected to offer better buying opportunities.
Dips should be ideally contained by daily Tenkan-sen (103.48) which marks initial and solid support, with potential deeper pullback expected to find ground above the base of daily Ichimoku cloud (102.86) to keep larger bulls in play.
Only sustained break of daily Kijun-sen (102.62) would sideline bulls and risk deeper drop.
Last Friday’s spike high and top of rising daily cloud (104.59) mark immediate resistance, break of which would expose strong barriers at 106.00/30 zone (Fibo 38.2% of 114.72/100.66 downtrend/weekly cloud top/200DMA).
Res: 104.59; 105.40; 106.03; 106.30.
Sup: 104.24; 103.98; 103.48; 102.86.
AUDUSD Plummets But 200-day SMA Curbs Secline
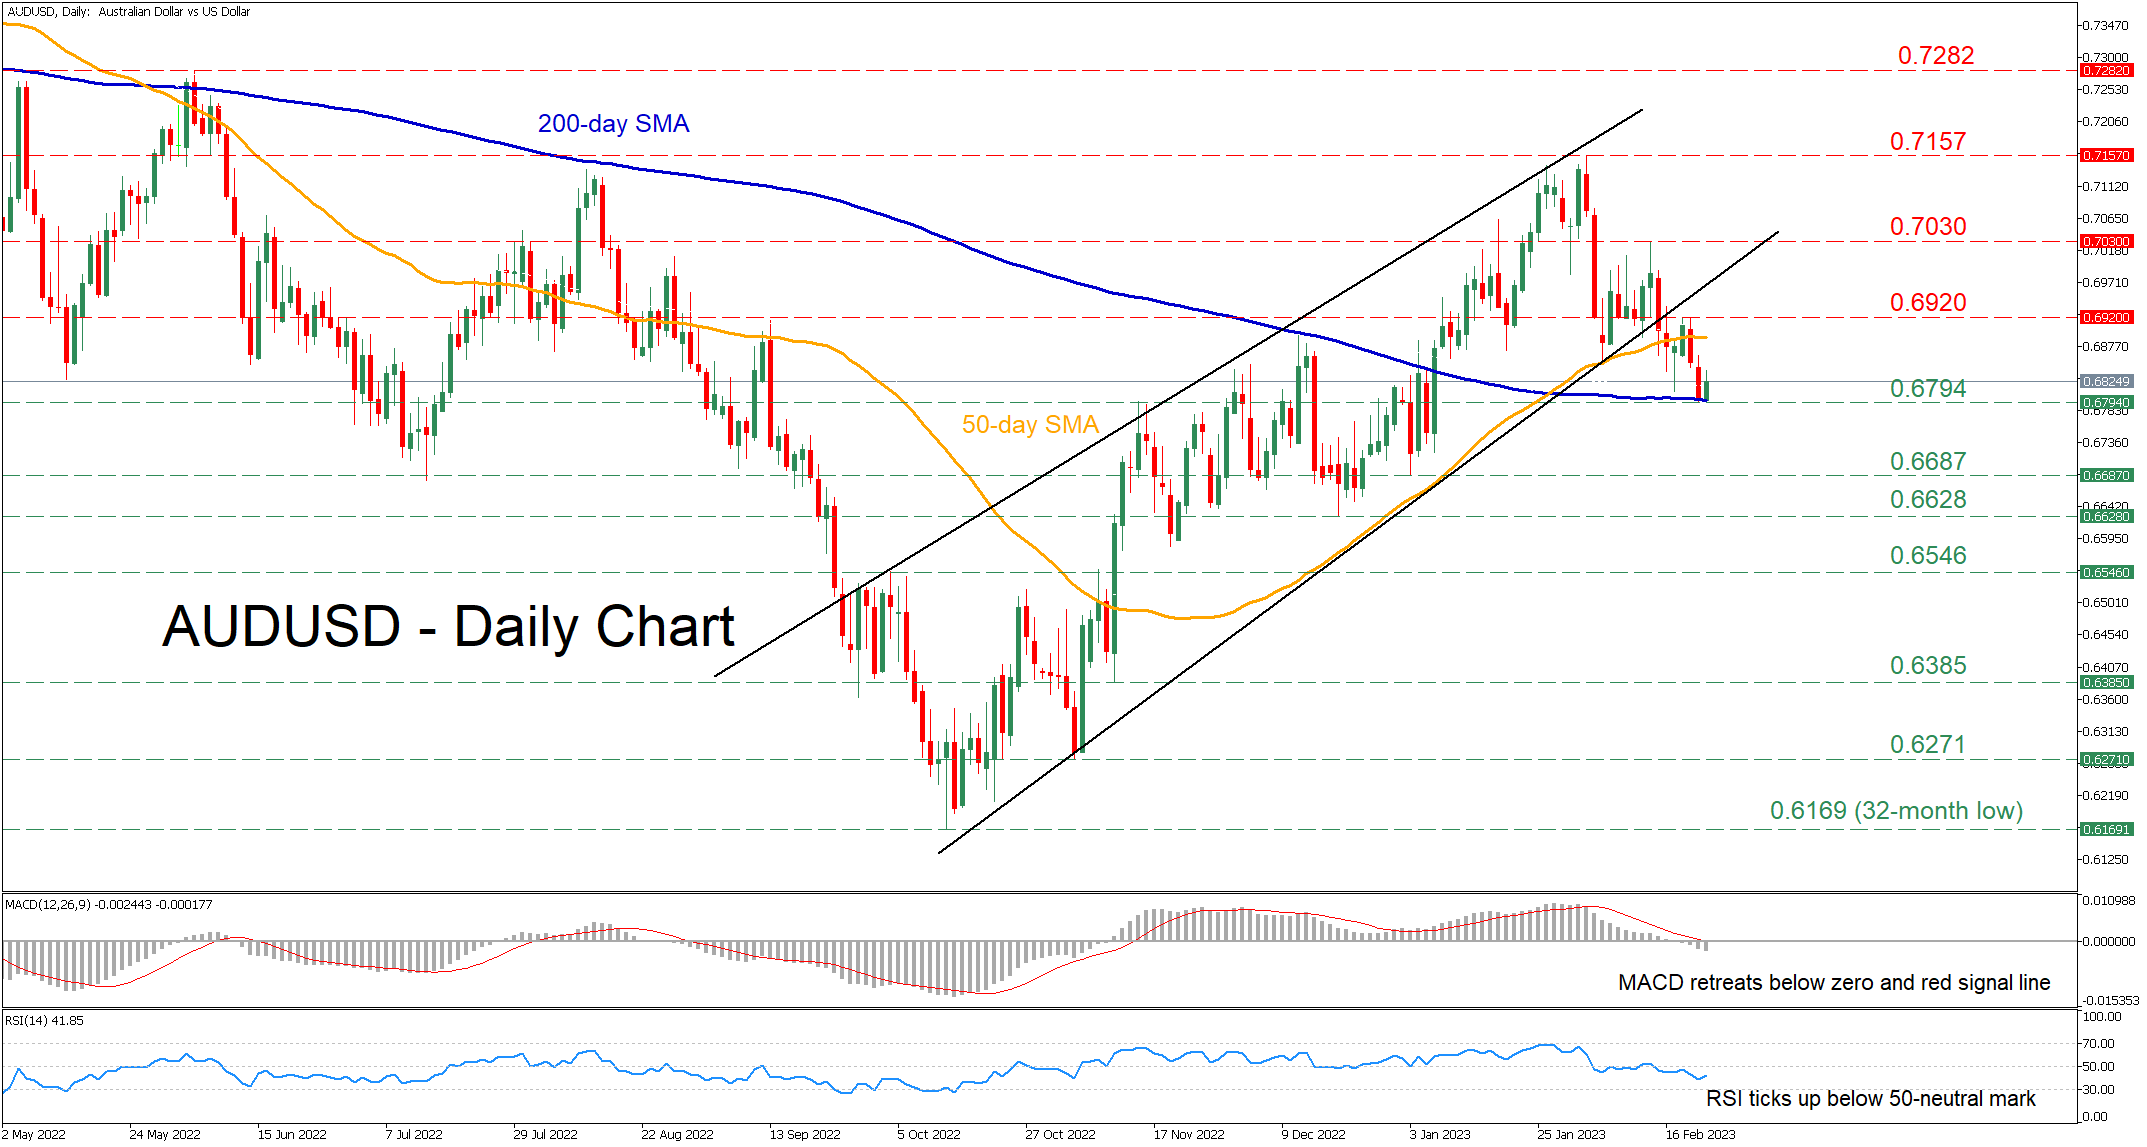
AUDUSD had been staging an impressive rebound, trading within an upward sloping channel since mid-October. Nevertheless, the pair experienced a moderate pullback in the short term, with the price escaping its pattern to the downside to find strong support at the 200-day simple moving average (SMA).
The momentum indicators currently suggest that bearish forces have gained total control. Specifically, the MACD histogram is softening below both zero and its red signal line, while the RSI is pointing upwards but remains well beneath its 50-neutral mark.
Should selling pressures intensify further, the pair could decline to retest the 200-day SMA, currently at 0.6794. Sliding beneath that zone, the bears might aim for the January low of 0.6687 before the December bottom of 0.6628 comes under examination. Even lower, further retreats could come to a halt at the 0.6546 barrier.
On the flipside, bullish actions might encounter initial resistance at the 0.6920 hurdle. Conquering this barricade, the pair could ascend towards 0.7030 or higher to challenge the recent trend rejection point of 0.7157. Should that obstacle fail, the June high of 0.7282 may appear on the radar.
Overall, AUDUSD seems to be experiencing some weakness after its medium-term bullish pattern broke to the downside. However, there is room for recovery in the case that the pair bounces off the 200-day SMA.
WTI Oil Futures at Risk of a Bearish Breakout
WTI oil futures came under renewed selling pressure on Wednesday, speeding their decline to the bottom of its range area seen around 73.35.
The region has been a significant support zone since the start of the year, making another rebound likely as the Stochastic oscillator is approaching its previous lows below its 20 oversold level. Still, the indicator has not attempted to change direction to the upside, while the falling RSI has yet to reach its 30 oversold level, although it’s close to its February low, both backing a bearish bias.
In other discouraging signs, the 20-day exponential moving average (EMA) could not cross above the 50-day EMA, playing down any hopes for a bullish trend reversal. Besides, the rectangle established at the bottom of the previous downtrend is usually considered a bearish trend continuation pattern.
Hence, the focus will remain on the 73.35 base in the coming sessions, a break of which could initially stall somewhere between the 70.00 psychological mark and the 50% Fibonacci retracement level of the 2020-2021 upleg at 68.55. Additional losses from here could take a breather within the 65.00-63.70 region, where the lower band of the bearish channel from last February is located.
Should the price drift higher, the 78.00 resistance zone, which triggered the latest decline in the market, will come again under examination. If the bulls find enough buying power to pass through that wall this time, closing above last week’s peak of 80.76 too, they may gain direct access to the important 83.00-84.20 area. The 200-day EMA, the channel’s upper band and the 38.2% Fibonacci mark are all located here. Therefore, a sustainable extension higher may prompt a more exciting rally towards the 88.60 barrier.
In brief, WTI oil futures keep facing a bearish bias, remaining exposed to a breakout below the existing rectangle.
A Pinch of Salt
Equity markets are heading for a positive start to the session, paring Wednesday's gains as investors digest the latest Fed minutes.
The usual caveat applies to the minutes, being that a lot of time has passed, and to a great extent, the contents of them are either outdated or known. Still, as we saw on Wednesday, that doesn't always matter and markets can still respond accordingly.
The starkest takeaway was arguably that some policymakers could have gotten behind another 50 basis point increase and all backed further tightening ahead. While that aligns with some commentary we've had recently, the meeting took place before the jobs and inflation reports, and the retail sales data for January, all of which were very strong.
So either policymakers came to this judgement in anticipation of those reports or they did it despite a series of softer prints that had convinced investors that the end of the tightening cycle was just around the corner.
While I do take Fed commentary with a relative pinch of salt - as I believe the plan has always been to remain hawkish and keep financial conditions tight until the last minute and then quickly pivot once success is all but assured - the latter may well indicate that at least a few hikes are planned and any hope of cuts this year are, as communicated, slim.
That could be the difference between a recession and a soft landing, although again, I take these warnings with a large pinch of salt. If January proves to be a blip in the data due in part to warmer weather - and the fact that bumps in the road back to 2% were always highly likely - we could quickly see market pricing shift once more. And we'll get another full round of data before the next meeting which will give us a much better idea of whether this is a blip or a trend.
Glacial consolidation
Oil markets are continuing to consolidate, albeit at a glacial pace, and today we're seeing prices creep higher just as they near the lows from earlier this month. While traders remain optimistic about China, they have become less so about the global economy as more and more rate hikes have been priced in.
If one of those narratives changes, or we see a significant shift in another driving force in the oil markets - Russia, OPEC+, etc - then we could see prices break out of this range. But they seem rather comfortable within them, mirroring the feeling of consuming countries and producers alike, it seems, both of which have been much less vocal on the price and imbalance in the markets.
Gold correction run its course for now?
The FOMC minutes were another setback for gold, reaffirming the hawkish messages we've heard from policymakers for weeks now. The yellow metal has once again run into some support around $1,820 though which may reaffirm its position as a temporary barrier to the downside. Of course, if the economic data between now and the next Fed meeting in a month doesn't play ball, it may not hold for much longer. But the correction does seem to have run its course for now which could lead to further profit-taking and a retracement higher.
Growing belief
Bitcoin is continuing to show remarkable resilience as it trades up 2% today and back above $24,000. Don't get me wrong, it's not alone in doing so, we're seeing similar in equity markets although to a lesser extent. There's clearly belief returning to crypto markets and some confidence that the darkest days are behind it. If the newsflow can remain onside then that could prove to be the case and a break of $24,500-$25,500 could further fuel that belief.
US Oil Grinds Lower
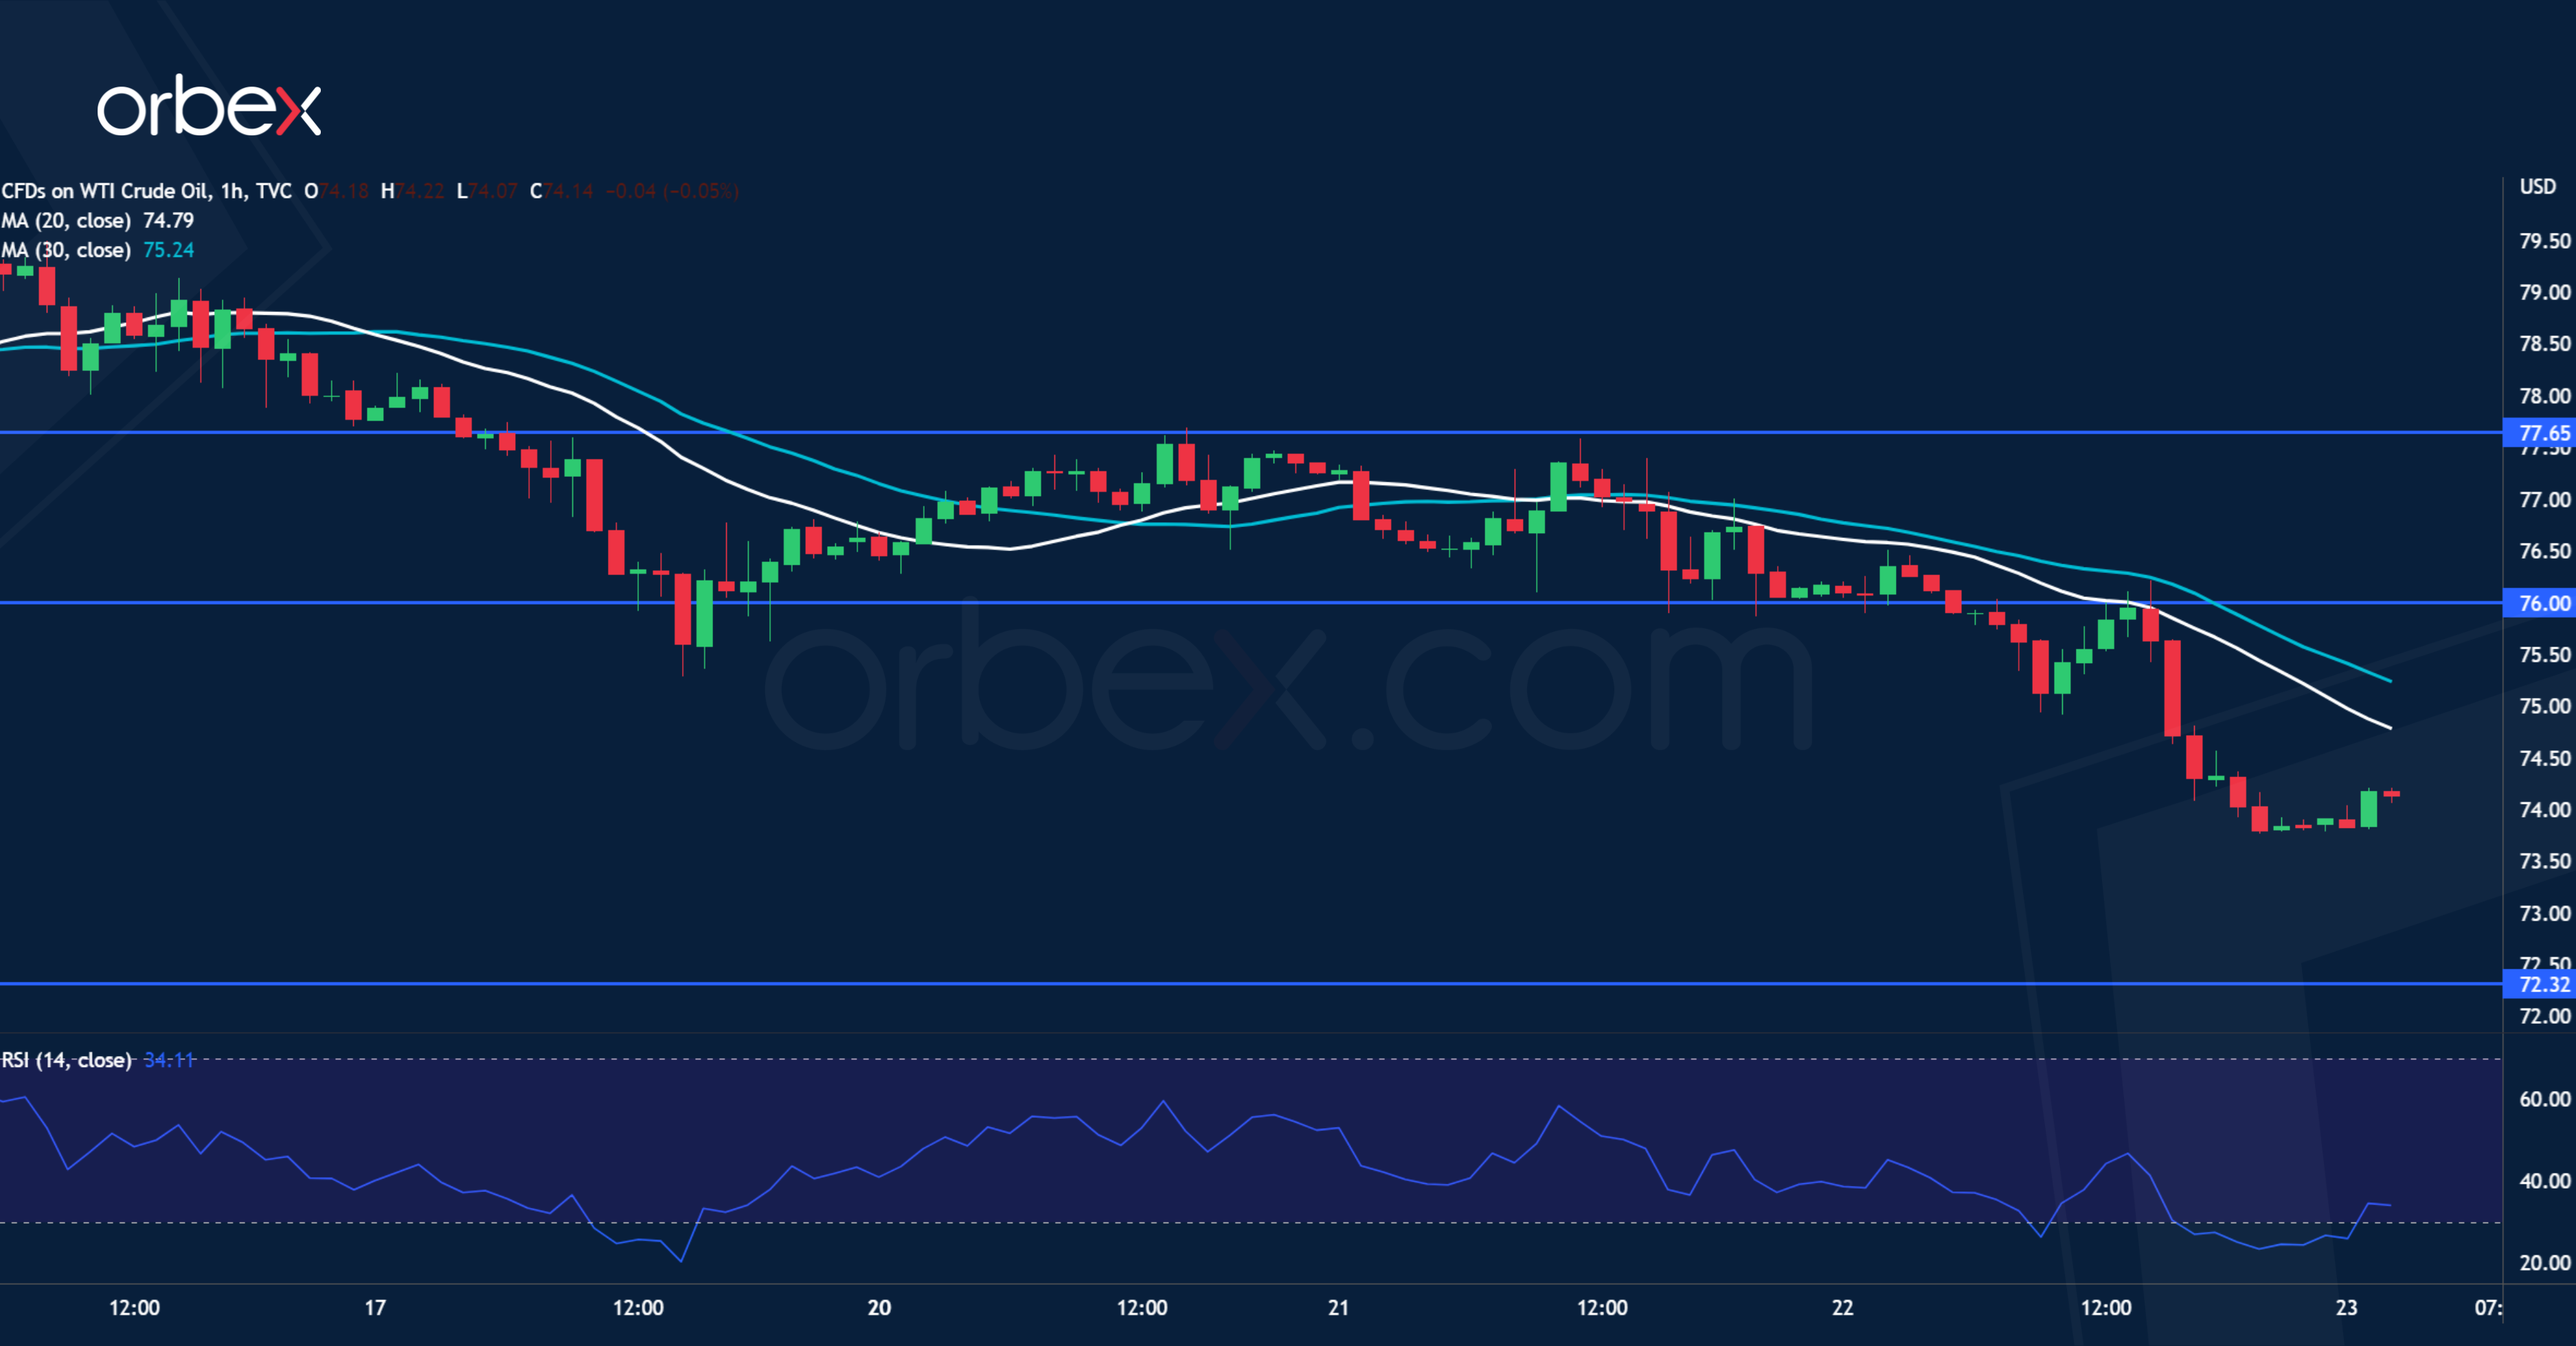
WTI crude falls as ongoing global rate increases weigh on growth and demand prospects. The latest bounce from 75.50 has failed to clear the support-turned-resistance of 77.60, and a drop below its origin means that the path of least resistance is down. 76.00 is a fresh resistance after a new round of sell-off broke through 75.00. This month’s low of 72.30 is the next level to see if any meaningful buying interest would emerge. Failing that, the commodity could be in for a bearish continuation in the medium-term.
XAU/USD Struggles for Bids
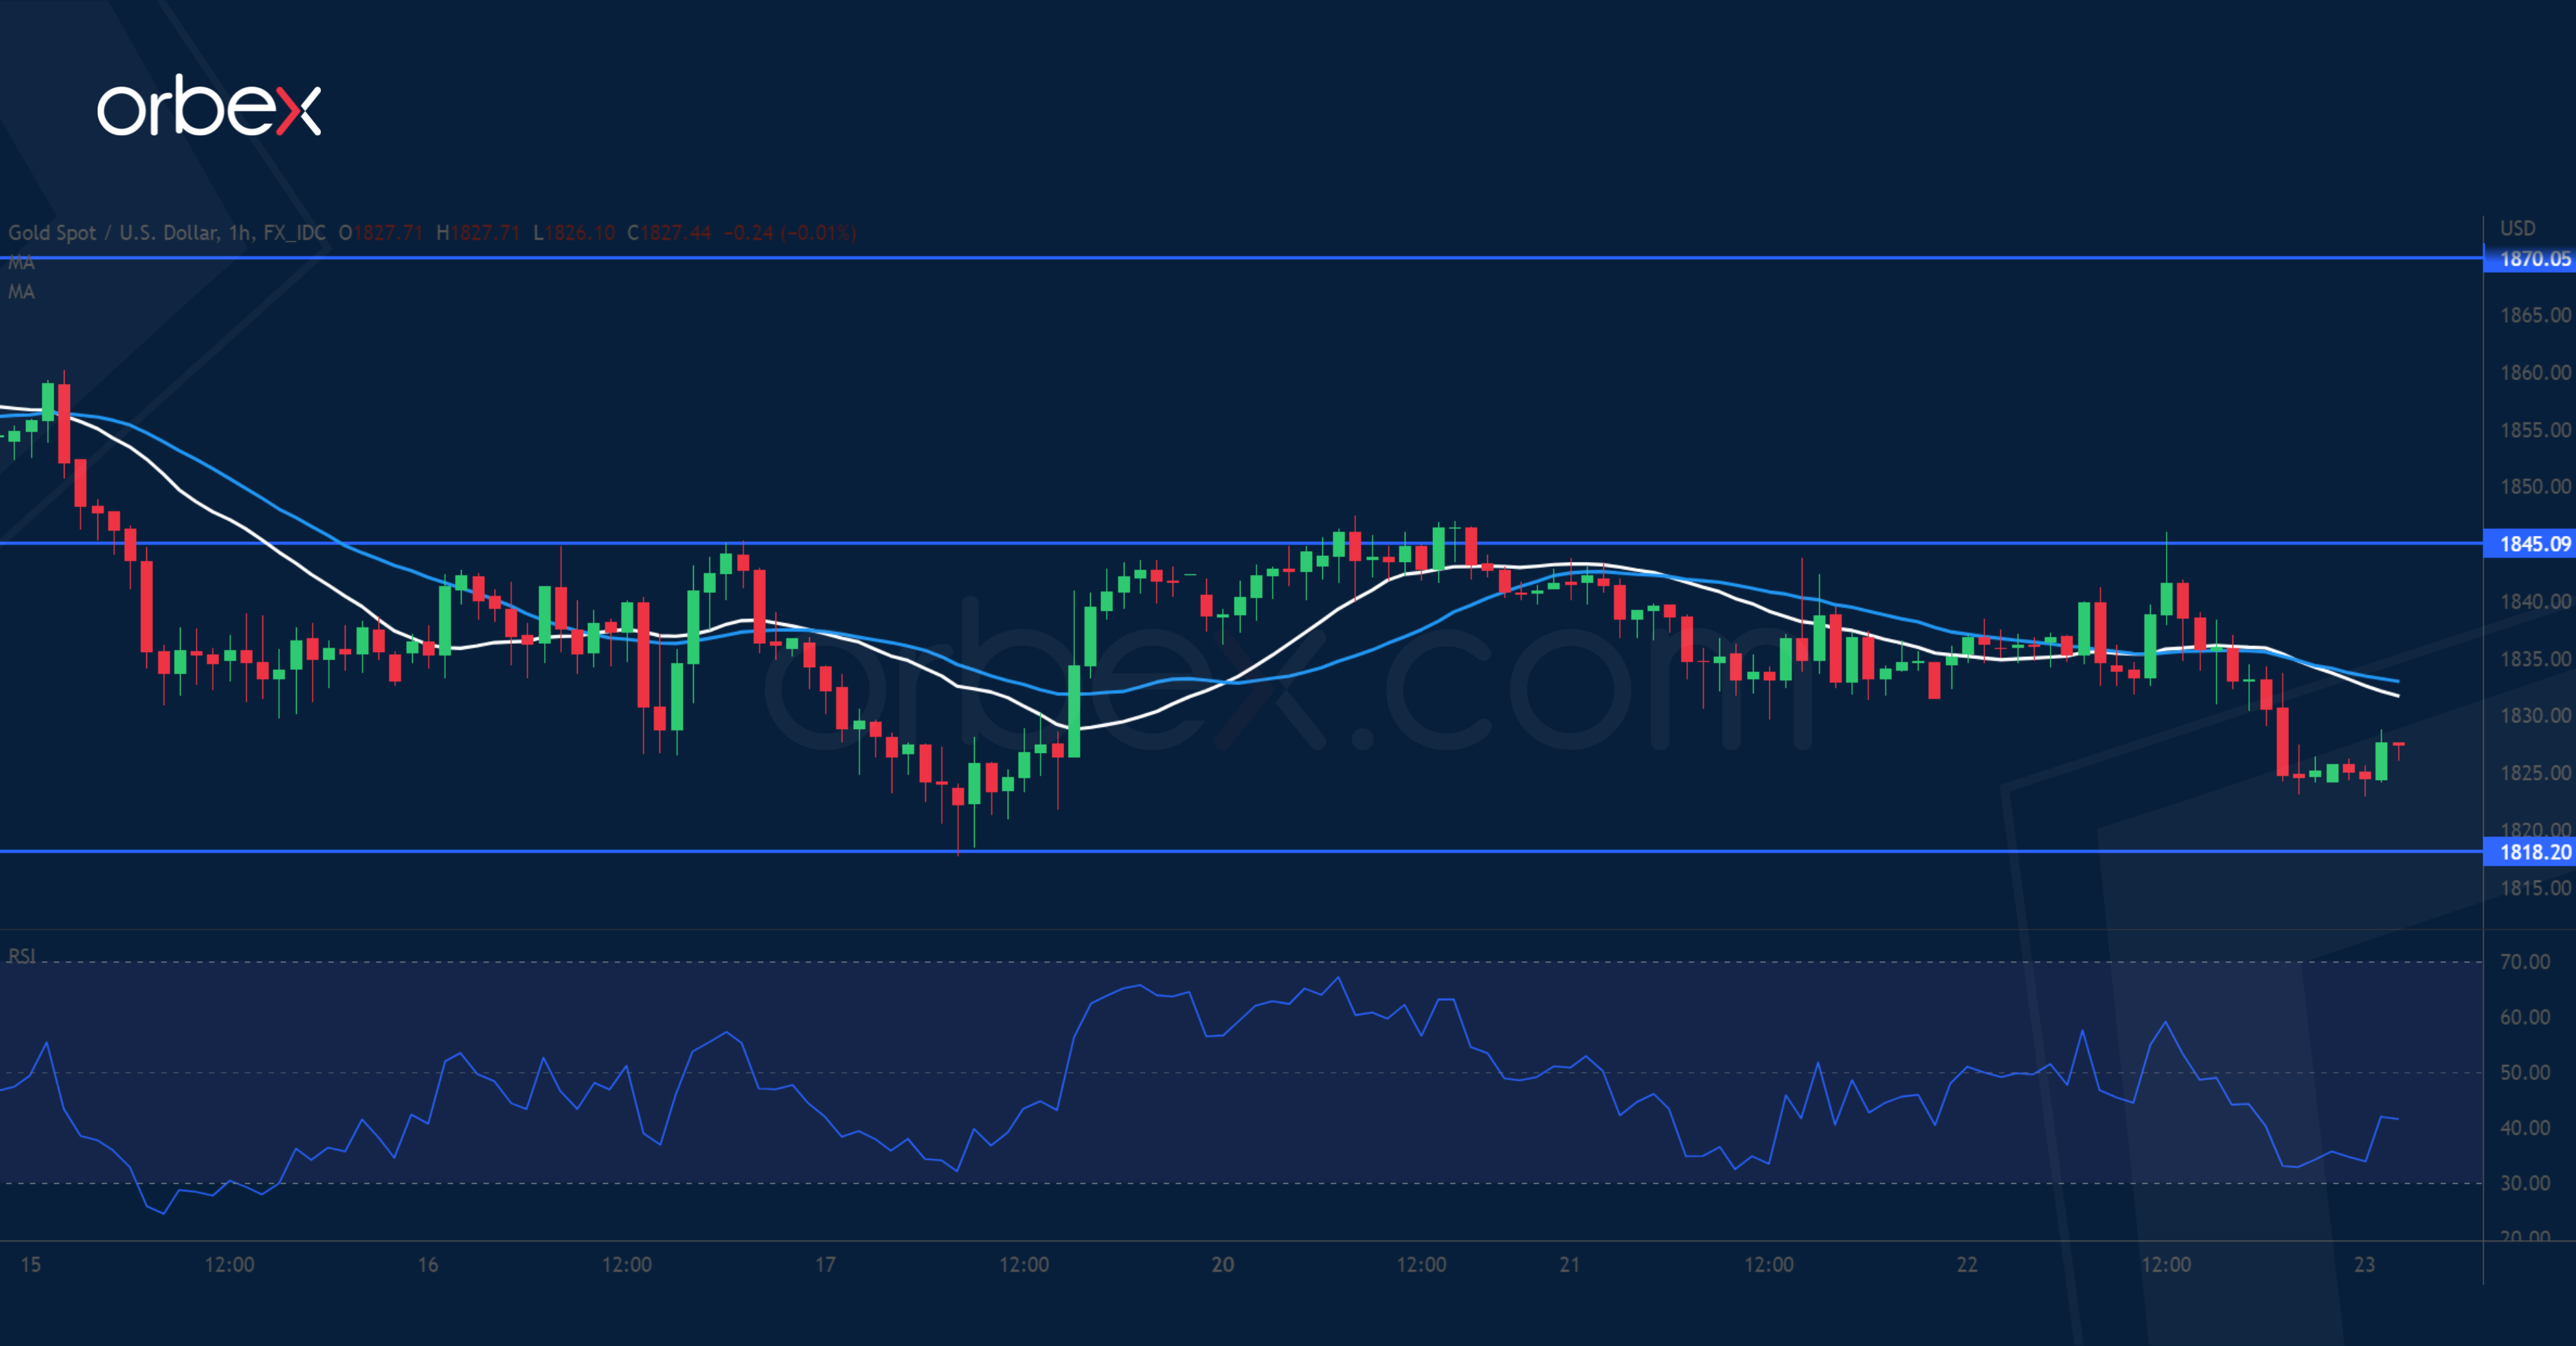
Bullion slips as the US dollar rallies after relatively hawkish FOMC minutes. The precious metal continues to grind lower due to bearish inertia in the short-term. Timid rebounds so far have met stiff selling pressure. 1845 is the immediate resistance and the bears are expected to sell into strength as sentiment remains skewed to the downside. This leaves little room for the bulls to manoeuvre. A break below 1818 would send gold to the psychological level of 1800 in the consolidation zone from last December.
NZD/USD Tests Major Floor
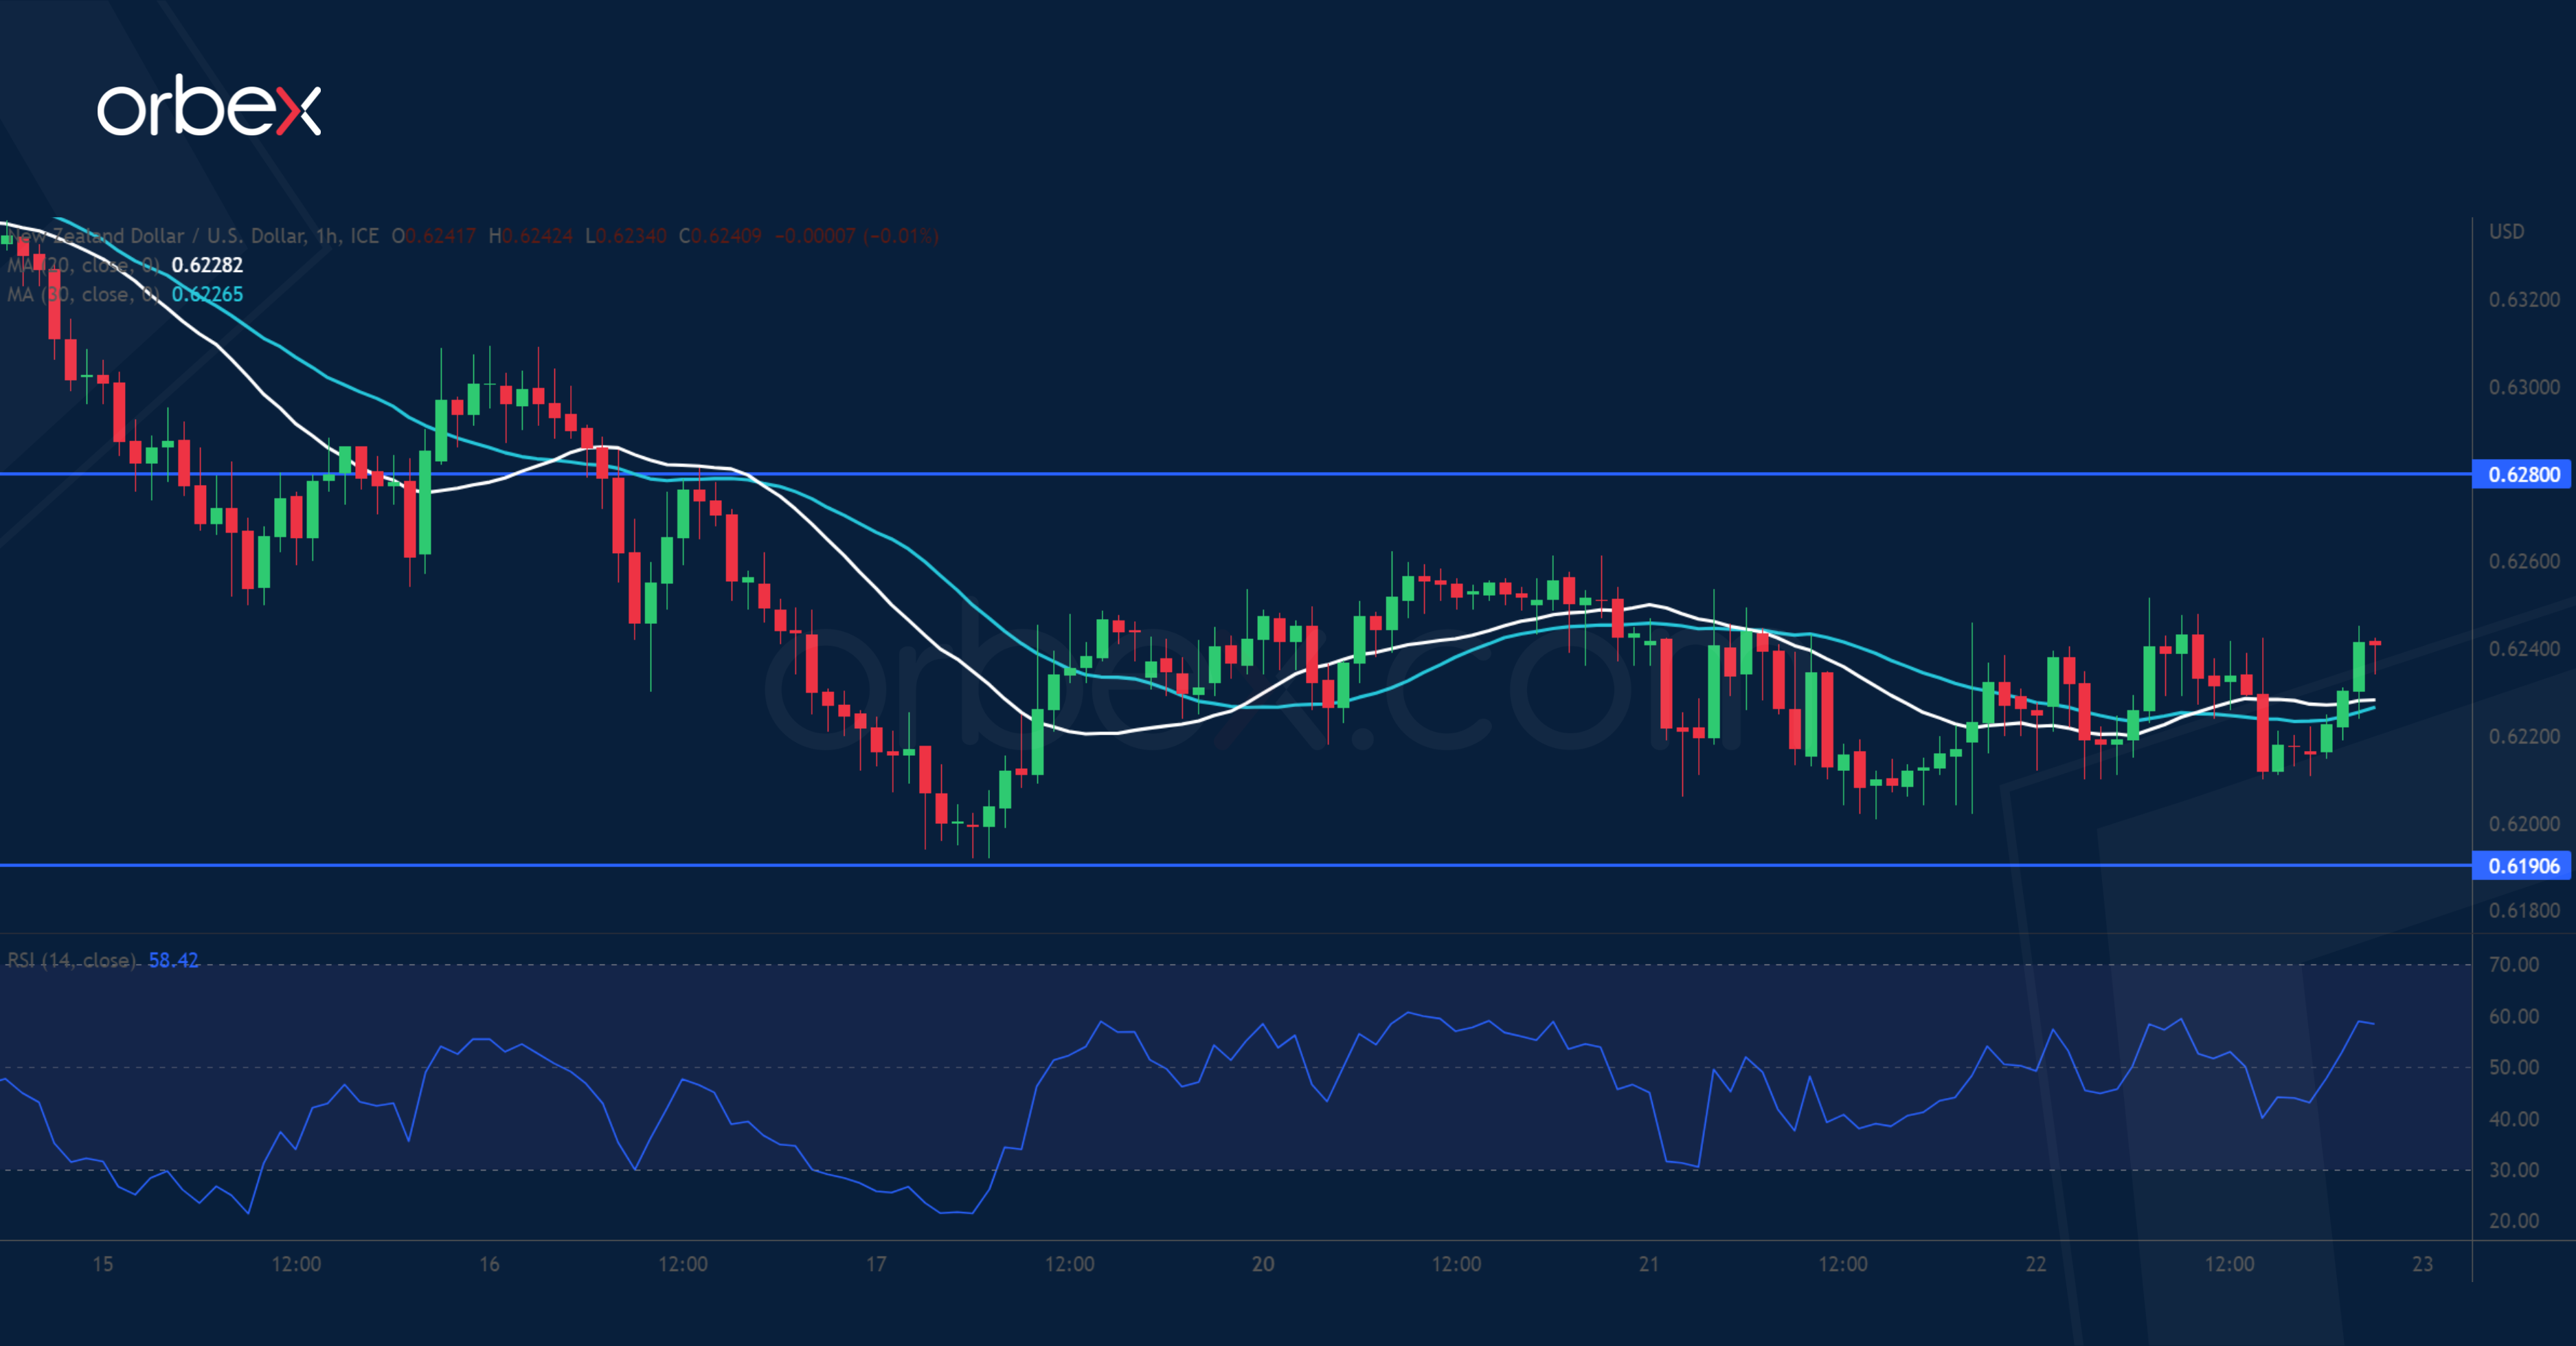
The New Zealand dollar softens as the RBNZ continues to expect the country to slip into a recession. The pair is looking to stabilise above the January swing low of 0.6190. A drop below this critical floor would open the door to a deeper correction towards 0.6000. The RSI’s oversold situation has attracted bargain hunters in the demand zone while sellers took some chips off the table. 0.6280 is the first hurdle to go before a rebound could kick off. Then 0.6390 is a key resistance to clear to trigger a broader recovery.
Elliott Wave Suggests Gold (XAUUSD) Still Has Scope to Extend Lower
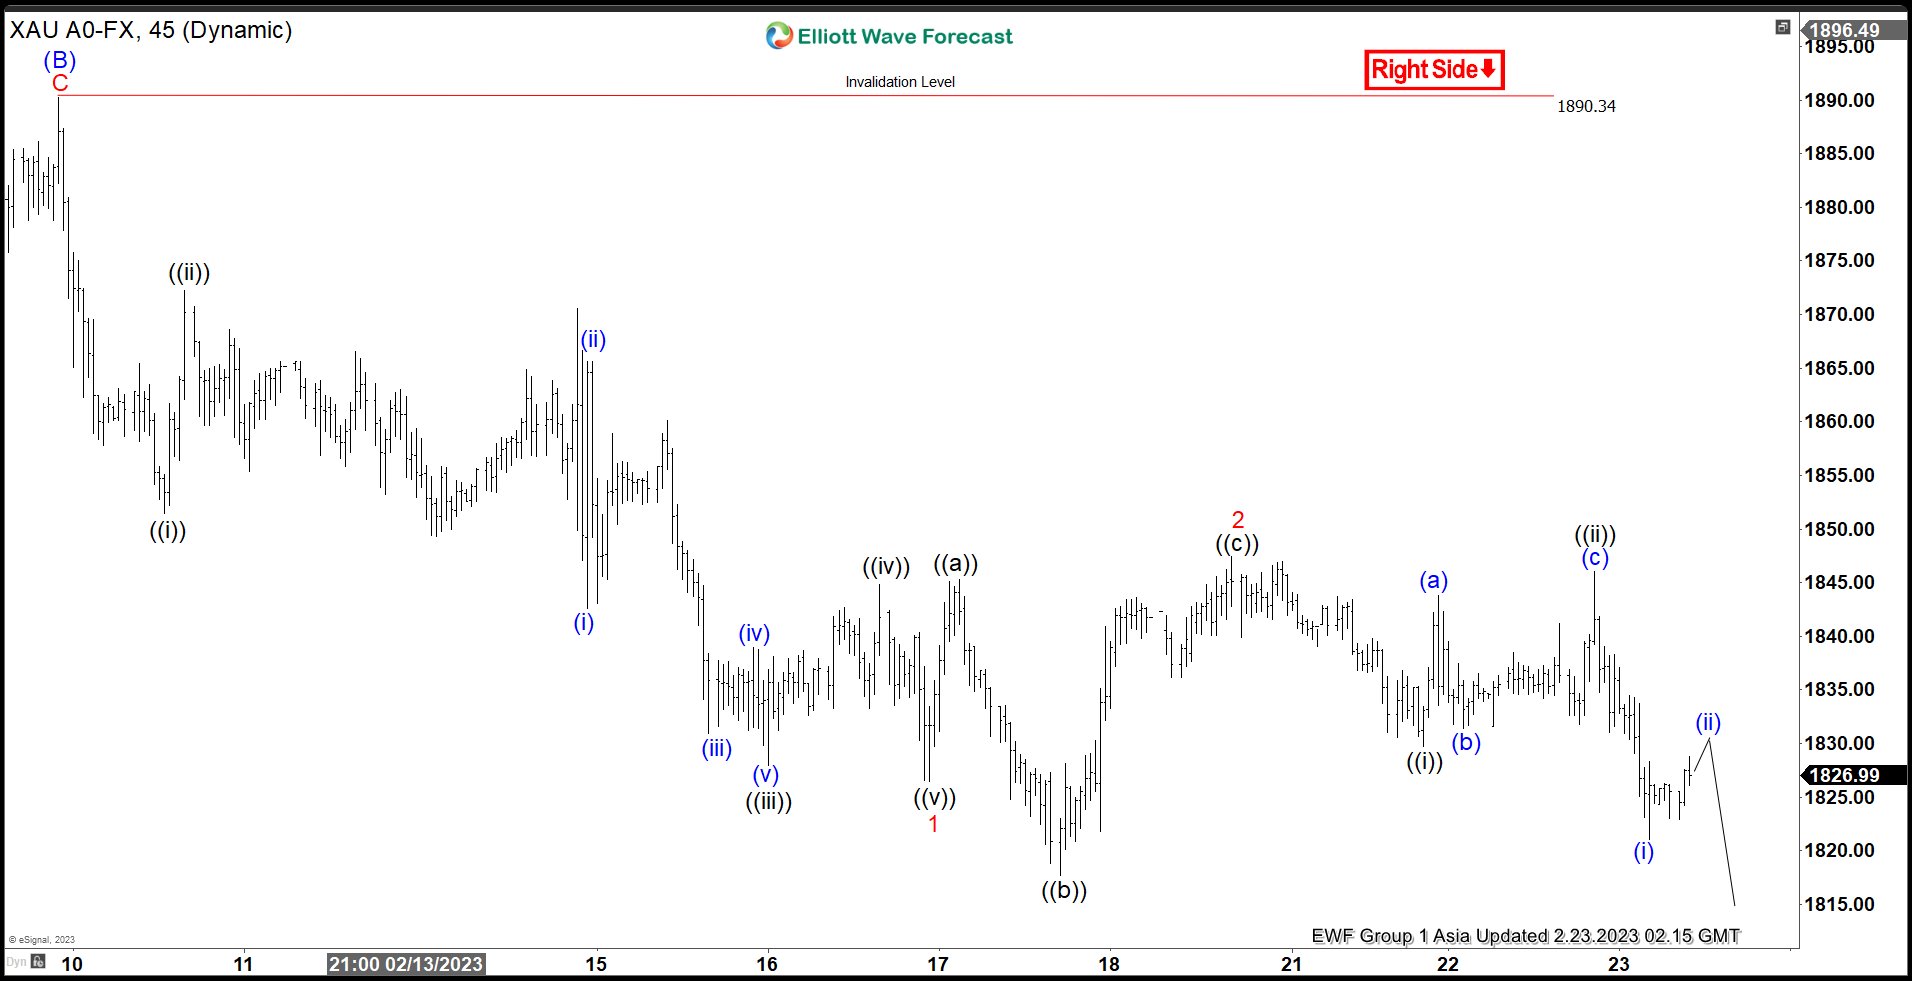
Since forming the low on September 28, 2022, Gold has rallied and the structure of the rally from 2022 low looks impulsive. It ended the rally on 2.2.2023 high at 1959.74. Since then, Gold has corrected lower. The correction takes the form of a zigzag Elliott Wave structure. Down from 2.2.2023 high, wave (A) ended at 1860.44. The 45 minutes chart below shows wave (B) rally which ended at 1890.34. The metal has resumed lower in wave (C) with subdivision as a 5 waves impulse.
Down from wave (B), wave ((i)) ended at 1851.5 and rally in wave ((ii)) ended at 1872.22. Wave ((iii)) ended at 1830.10, wave ((iv)) ended at 1844.84, and final leg wave ((v)) ended at 1826.50 which completed wave 1. Wave 2 rally took the form of an expanded Flat. Up from wave 1, wave ((a)) ended at 1845.29 and wave ((b)) ended at 1817.70. Wave ((c)) ended at 1847.45 which completed wave 2. The metal is currently in wave 3 of (C) lower. Down from wave 2, wave ((i)) ended at 1829.70 and wave ((ii)) ended at 1846.09. Near term, while rally fails below wave 2 at 1847.45 and more importantly below wave (B) at 1890.34, it still has scope to extend lower within wave (C).
XAUUSD 45 Minutes Hour Elliott Wave Chart