

Sample Category Title
USD/JPY Daily Outlook
Daily Pivots: (S1) 134.50; (P) 134.78; (R1) 135.19; More...
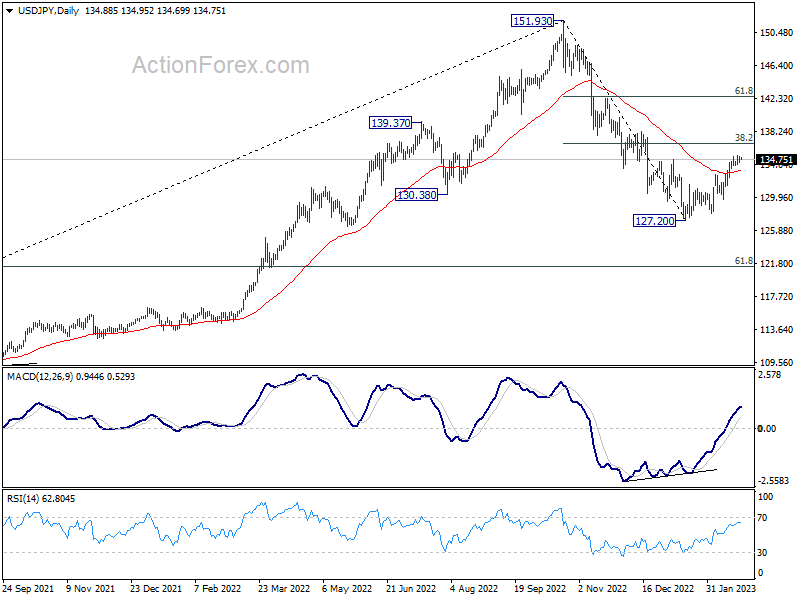
Further rise is still in favor in USD/JPY with 133.91 minor support intact. But strong resistance could be seen from 38.2% retracement of 151.93 to 127.20 at 136.64 to complete the corrective rebound from 127.20. On the downside, break of 133.91 minor support will turn bias back to the downside for 129.79/132,89 support zone.
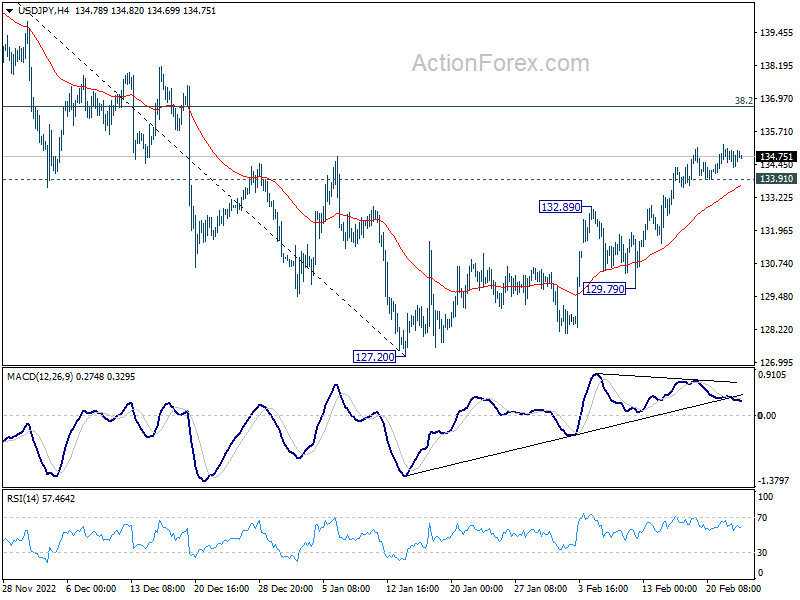
In the bigger picture, prior break of 55 week EMA (now at 131.54) raises the chance of medium term bearish reversal, but that's not confirmed yet. Strong rebound from current level, followed by sustained break of 38.2% retracement of 151.93 to 127.20 at 136.64 will argue that price actions from 151.93 is merely a corrective pattern. However, rejection by 136.64 will solidify medium term bearishness for 61.8% retracement of 102.58 to 151.93 at 121.43 and 38.2% retracement of 75.56 to 151.93 at 122.75.
USD/CHF Daily Outlook
Daily Pivots: (S1) 0.9271; (P) 0.9295; (R1) 0.9337; More...
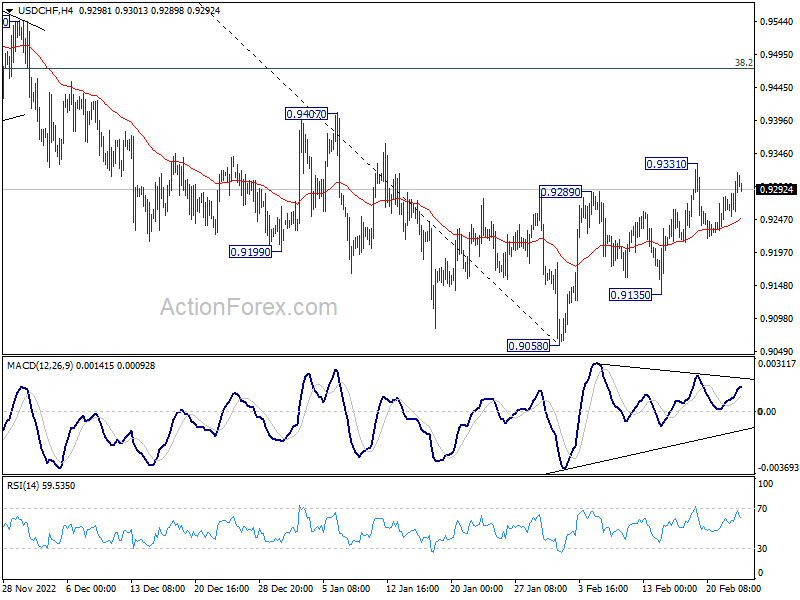
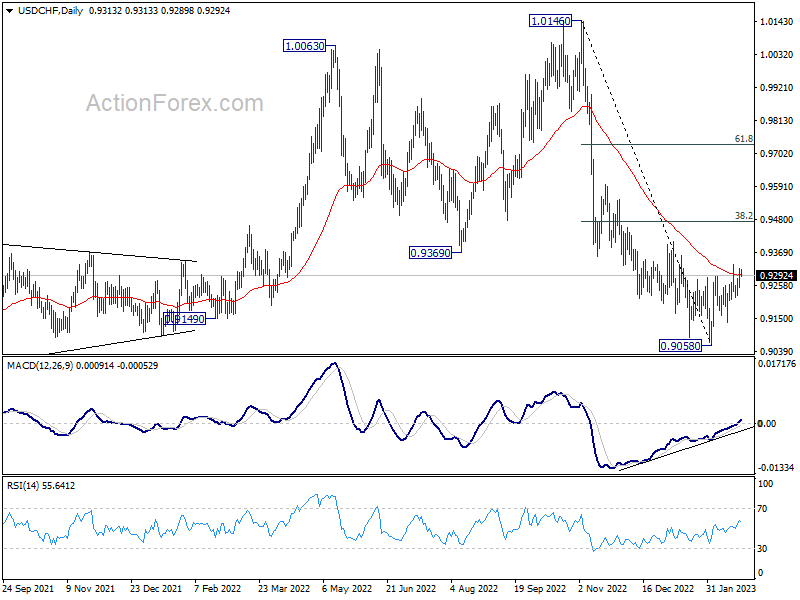
Outlook in USD/CHF remains unchanged and intraday bias stays neutral first. On the upside, break of 0.9331 will resume the rebound from 0.9058 to 38.2% retracement of 1.0146 to 0.9058 at 0.9474. However, break of 0.9135 will indicate that the rebound has completed and bring retest of 0.9058 low.
In the bigger picture, decline from 1.0146 is seen as part of a long term sideway pattern. As long as 38.2% retracement of 1.0146 to 0.9058 at 0.9474 holds, another fall is in favor through 0.9058. However, sustained trading above 0.9474 will indicate that the medium term trend has reversed, and open up further rally to 1.0146 again.
GBP/USD Daily Outlook
Daily Pivots: (S1) 1.2009; (P) 1.2072; (R1) 1.2110; More...
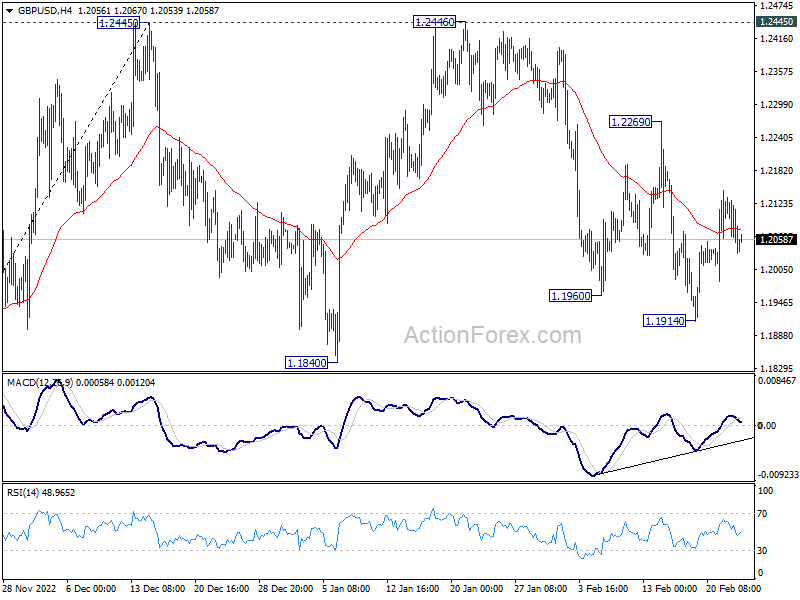
Intraday bias in GBP/USD remains neutral and another decline is in favor with 1.2269 resistance intact. On the downside, break of 1.1914 will resume the fall from 1.2446, as the third leg of the corrective pattern from 1.2445, to 1.1840 support and possibly below. Nevertheless, firm break of 1.2269 will bring retest of 1.2445/6 resistance.
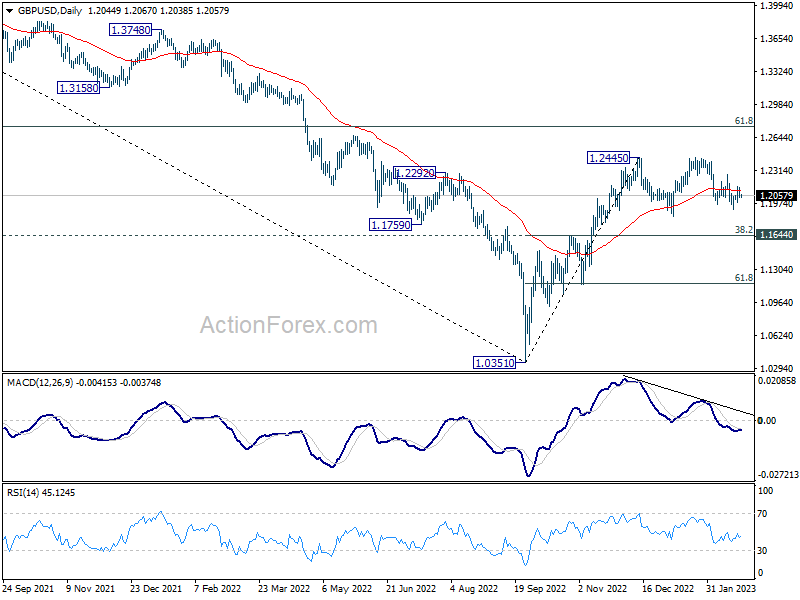
In the bigger picture, rise from 1.0351 medium term bottom is at least correcting whole down trend from 1.4248 (2021 high). Further rise is expected as long as 1.1644 resistance turned support holds. Next target is 61.8% retracement of 1.4248 to 1.0351 at 1.2759. Sustained break there will pave the way back to 1.4248.
Technical Outlook and Review
USD/JPY:
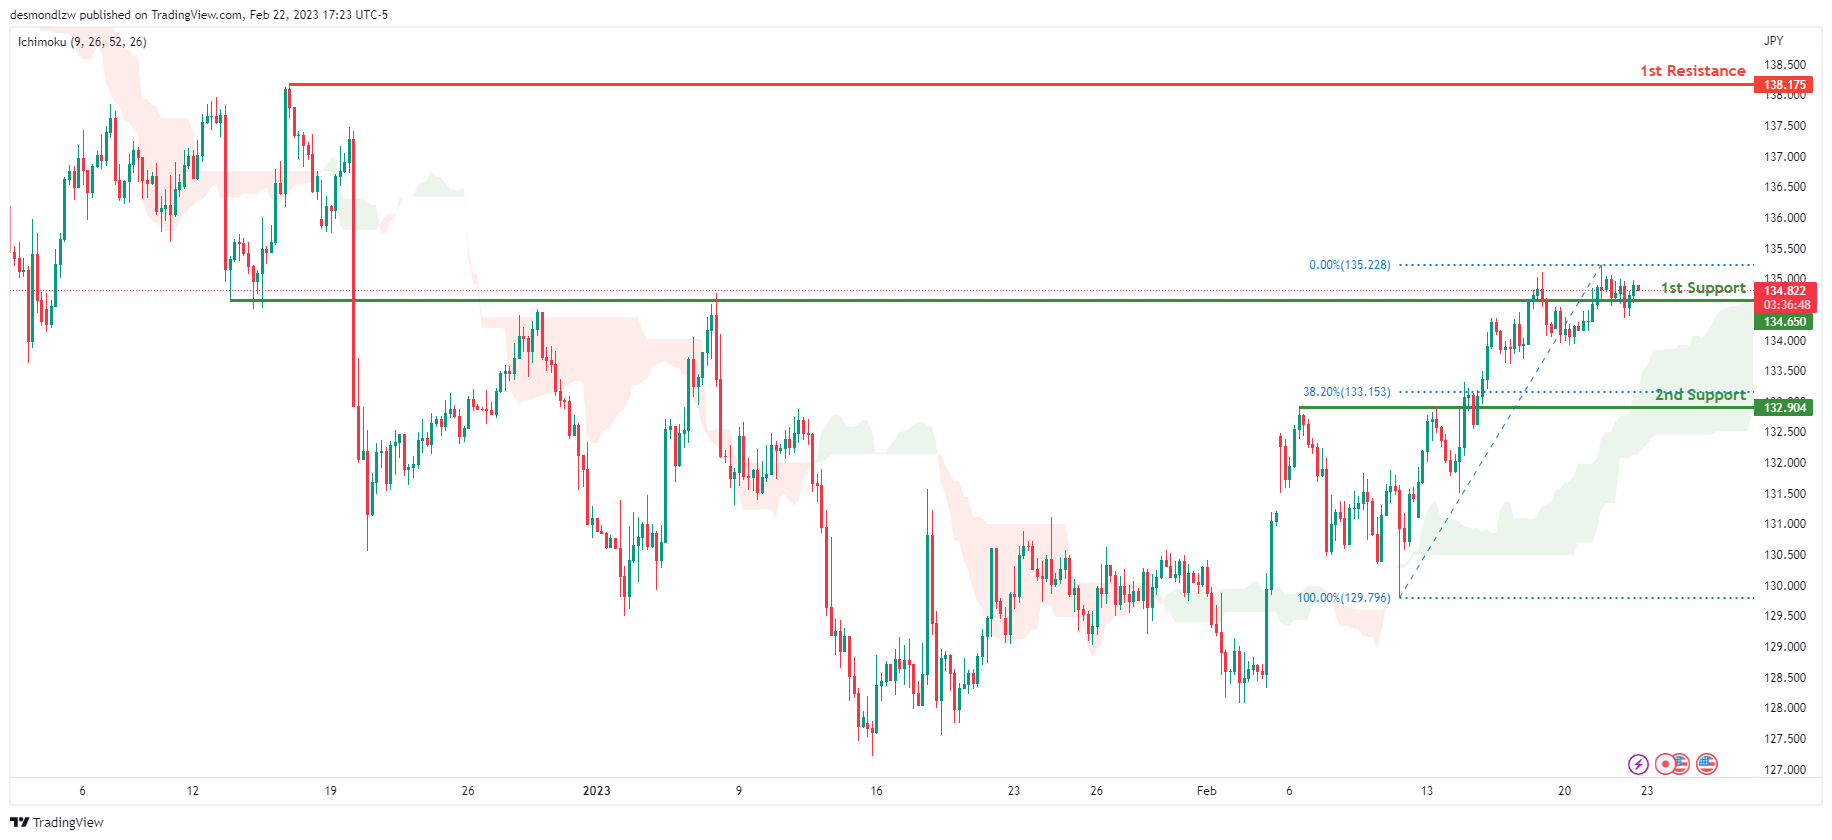
Looking at the H4 chart, my overall bias for USDJPY is bullish due to the current price being above the Ichimoku cloud, indicating a bullish market. If this bullish momentum continues, expect the price to continue heading towards the 1st resistance at 138.175, where the previous swing high is.
In an alternate scenario, price could possibly head back down to break the 1st support at 134.650, where the overlap support is before heading towards the 2nd support at 132.904, where the overlap support and 38.2% Fibonacci line is.
Areas of consideration:
- H4 time frame, 1st resistance at 138.175
- H4 time frame, 1st support at 134.650
- H4 time frame, 2nd support at 132.904
DXY:
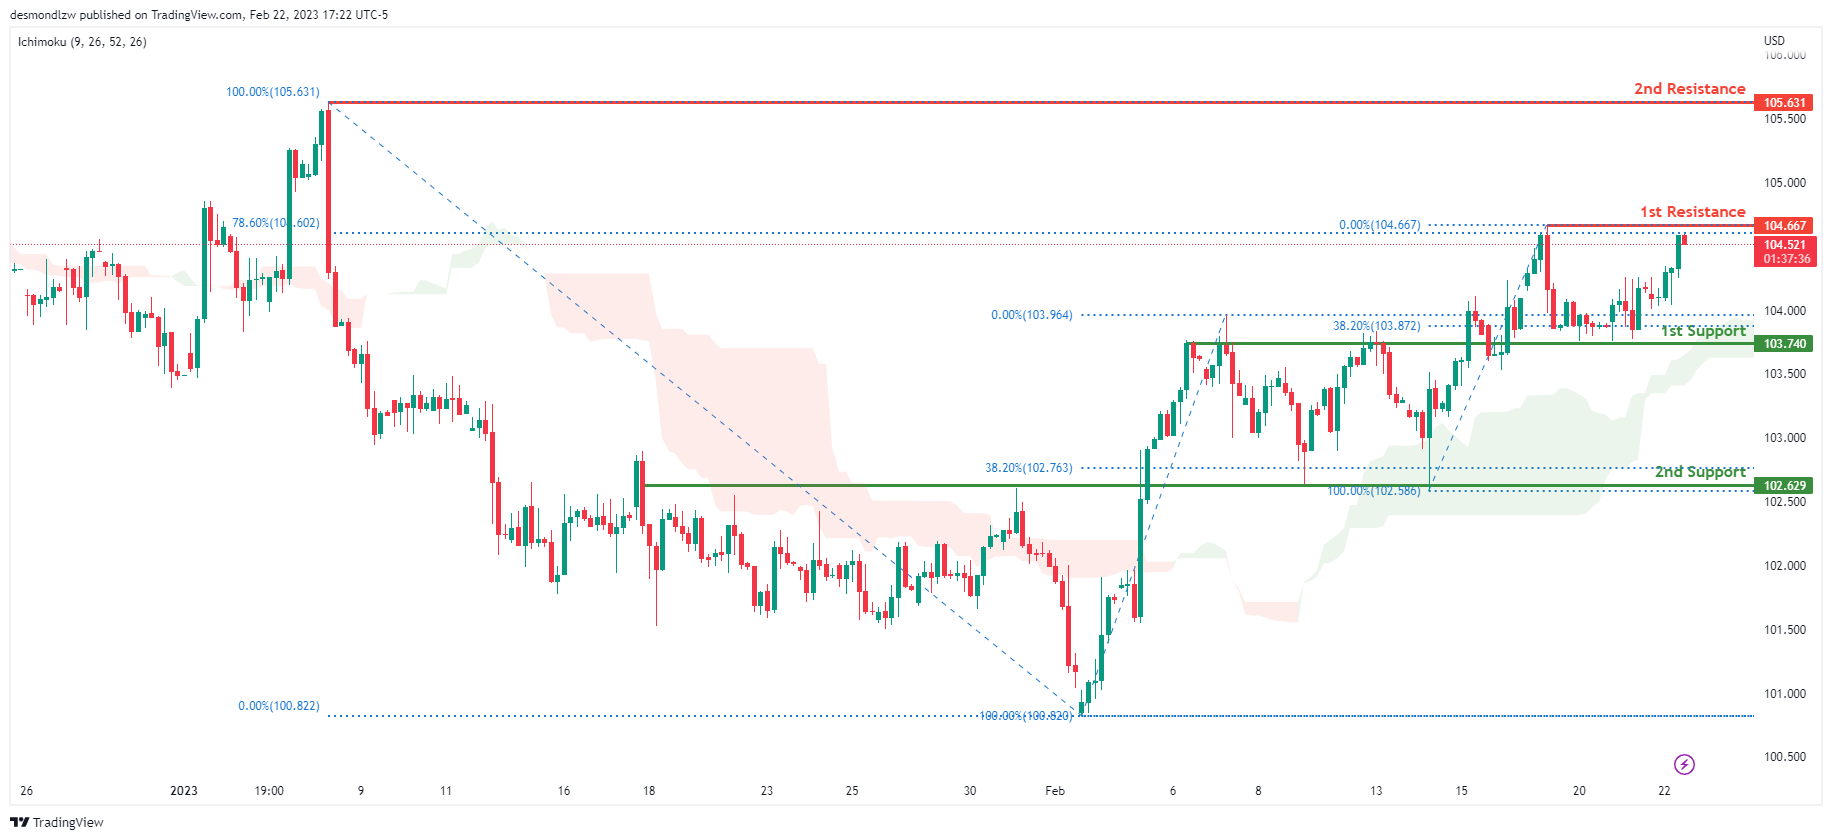
Looking at the H4 chart, my overall bias for DXY is bullish due to the current price crossing above the Ichimoku cloud, indicating a bullish market. If this bullish momentum continues, expect the price to possibly continue heading towards the 1st resistance at 104.667, where the recent high and 78.6% Fibonacci line is.
In an alternative scenario, price could head back down to retest the 1st support at 103.740, where the overlap support and 38.2% Fibonacci line is.
Areas of consideration:
- H4 time frame, 1st resistance at 104.667
- H4 time frame, 1st support at 103.740
EUR/USD:
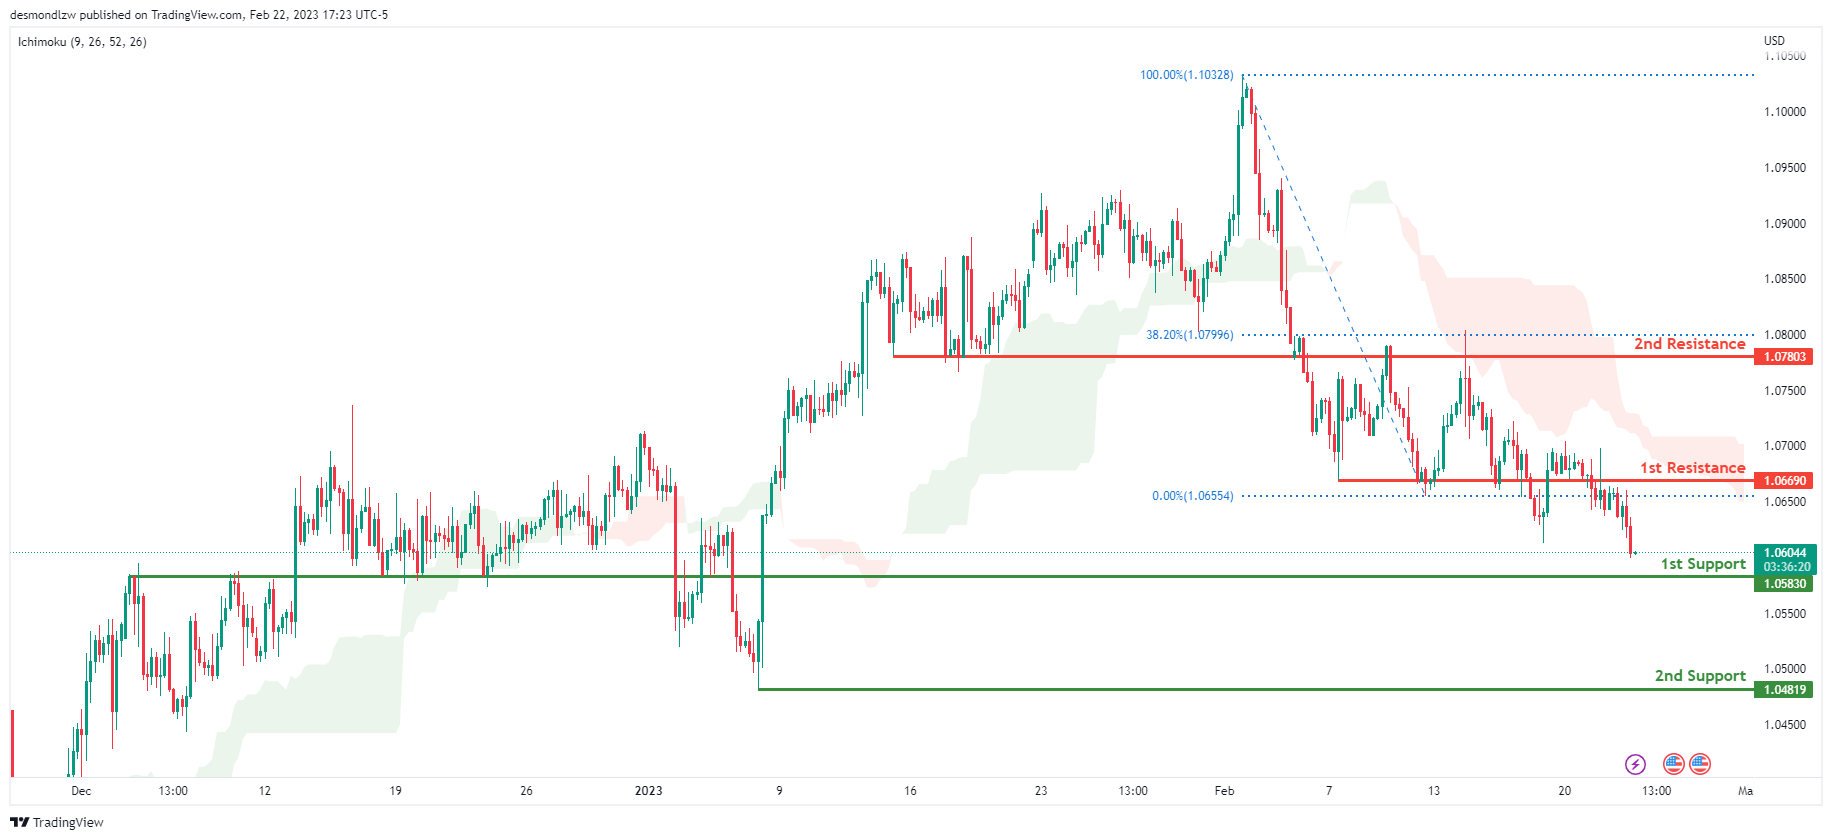
Looking at the H4 chart, my overall bias for EURUSD is bearish due to the current price crossing below the Ichimoku cloud, indicating a bearish market structure. If this bearish momentum continues, expect the price to head towards the 1st support at 1.05830 which is the overlap support.
In an alternate scenario, price could possibly head back up to retest the 1st resistance at 1.06690, where the overlap support is.
Areas of consideration :
- H4 1st resistance at 1.06690
- H4 1st support at 1.05830
GBP/USD:
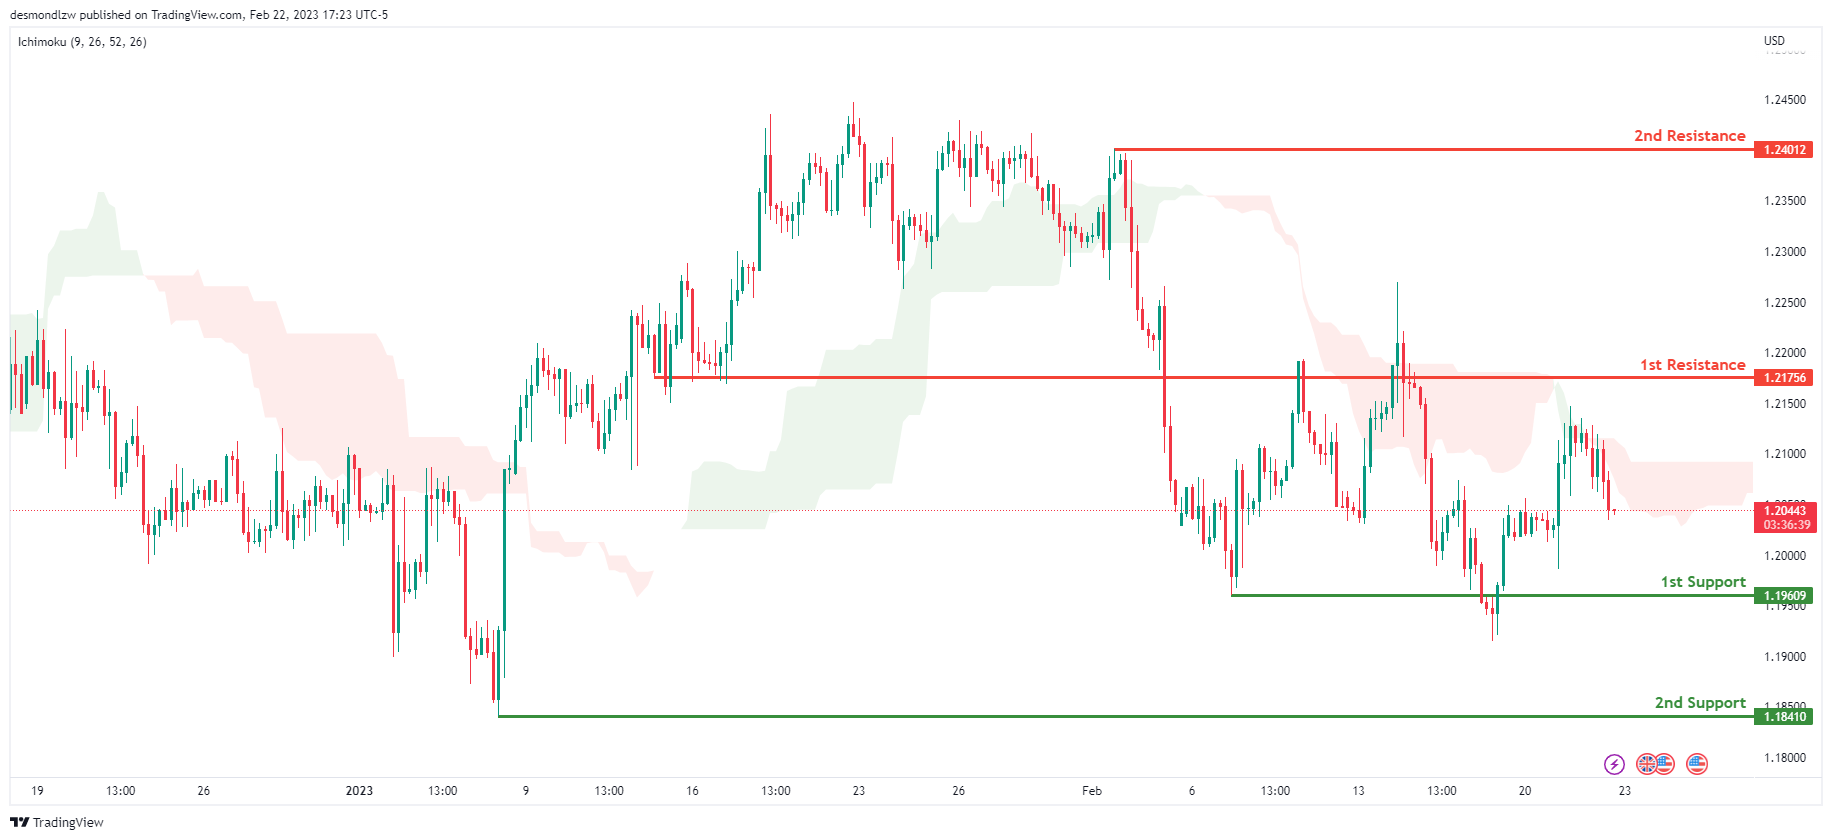
Looking at the H4 chart, my overall bias for GBPUSD is bearish due to the current price crossing below the Ichimoku cloud, indicating a bearish market. If this bearish momentum continues, expect the price to possibly break the 1st support at 1.19609, where the recent swing low is, before heading towards the 2nd support at 1.18410, where the previous swing low is.
In an alternate scenario, price could head back up to retest the 1st resistance line at 1.21756 where the overlap resistance is.
Areas of consideration:
- H4 1st resistance at 1.21756
- H4 1st support at 1.19609
- H4 2nd support at 1.18410
USD/CHF:
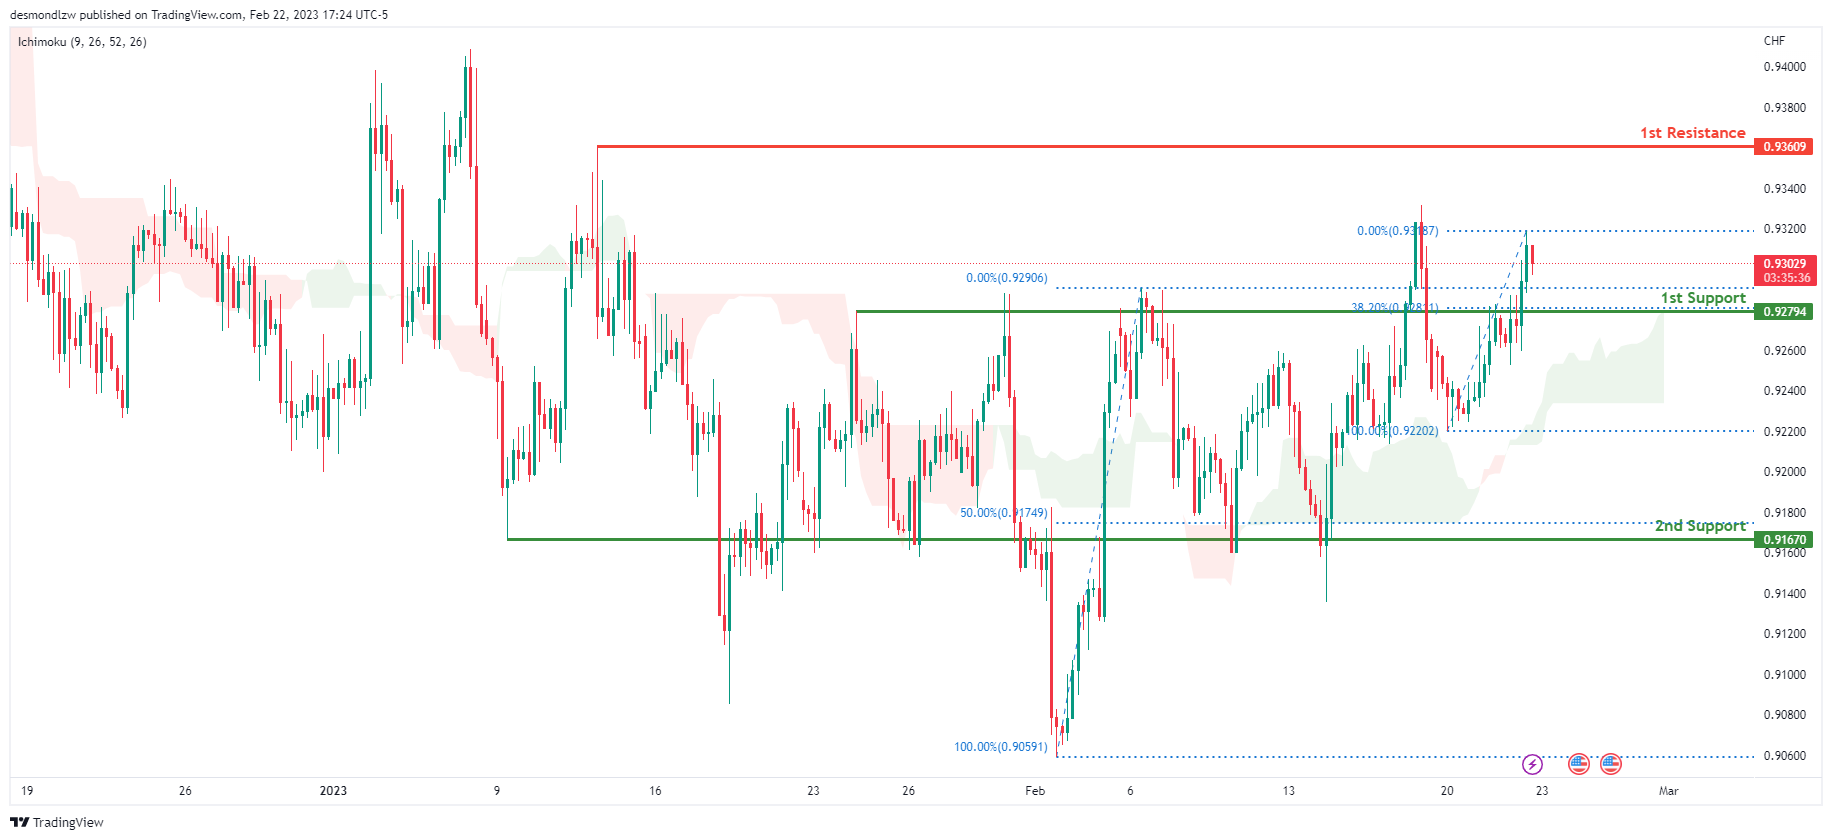
Looking at the H4 chart, my overall bias for USDCHF is bullish due to the current price being above the Ichimoku cloud, indicating a bullish market. If the current bullish trend continues, expect the price to possibly continue heading towards the 1st resistance at 0.93609 where the intermediate high is.
In an alternative scenario, price could possibly head back down to retest the 1st support at 0.92794, where the previous swing high is
Areas of consideration
- H4 1st support at 0.92794
- H4 1st resistance at 0.93609
XAU/USD (GOLD):
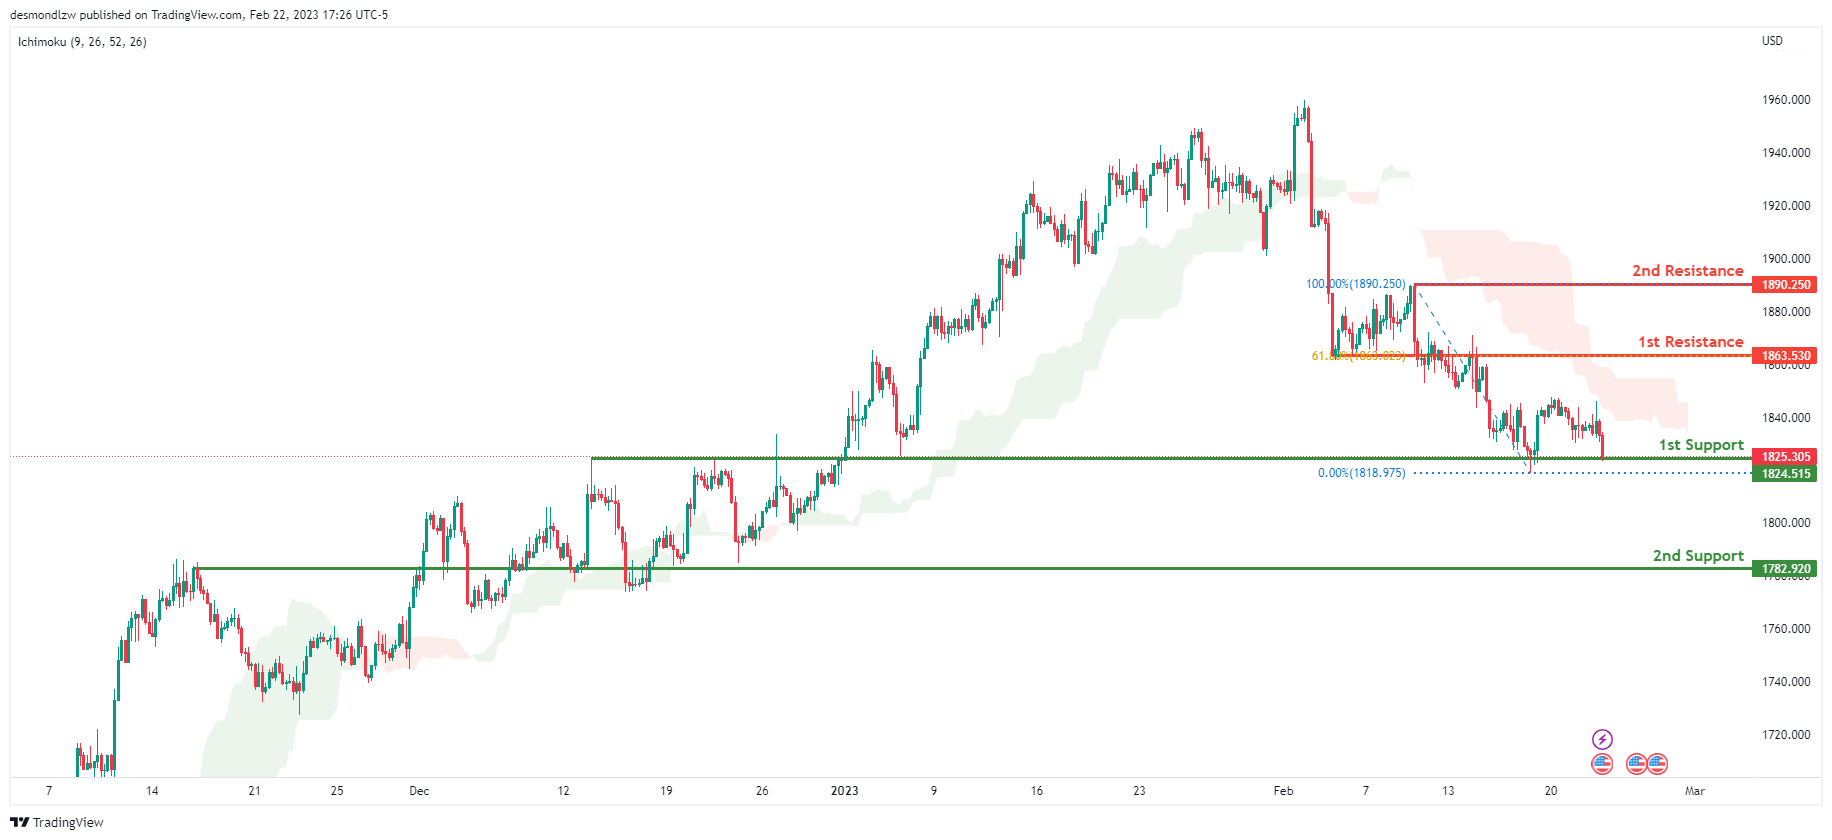
Looking at the H4 chart, my overall bias for XAUUSD is bearish due to the current price being below the Ichimoku cloud, indicating a bearish market. If this bearish momentum continues, expect the price to possibly break the 1st support at 1824.515 where the overlap support is, before heading towards the 2nd support at 1782.920 where the overlap support is.
In an alternative scenario, price could possibly head back up to retest the 1st resistance at 1863.530, where the overlap resistance and 61.8% Fibonacci line is.
Areas of consideration:
- H4 time frame, 1st resistance at 1863.530
- H4 time frame, 1st support at 1824.515
- H4 time frame, 2nd support at 1782.920
AUD/USD:
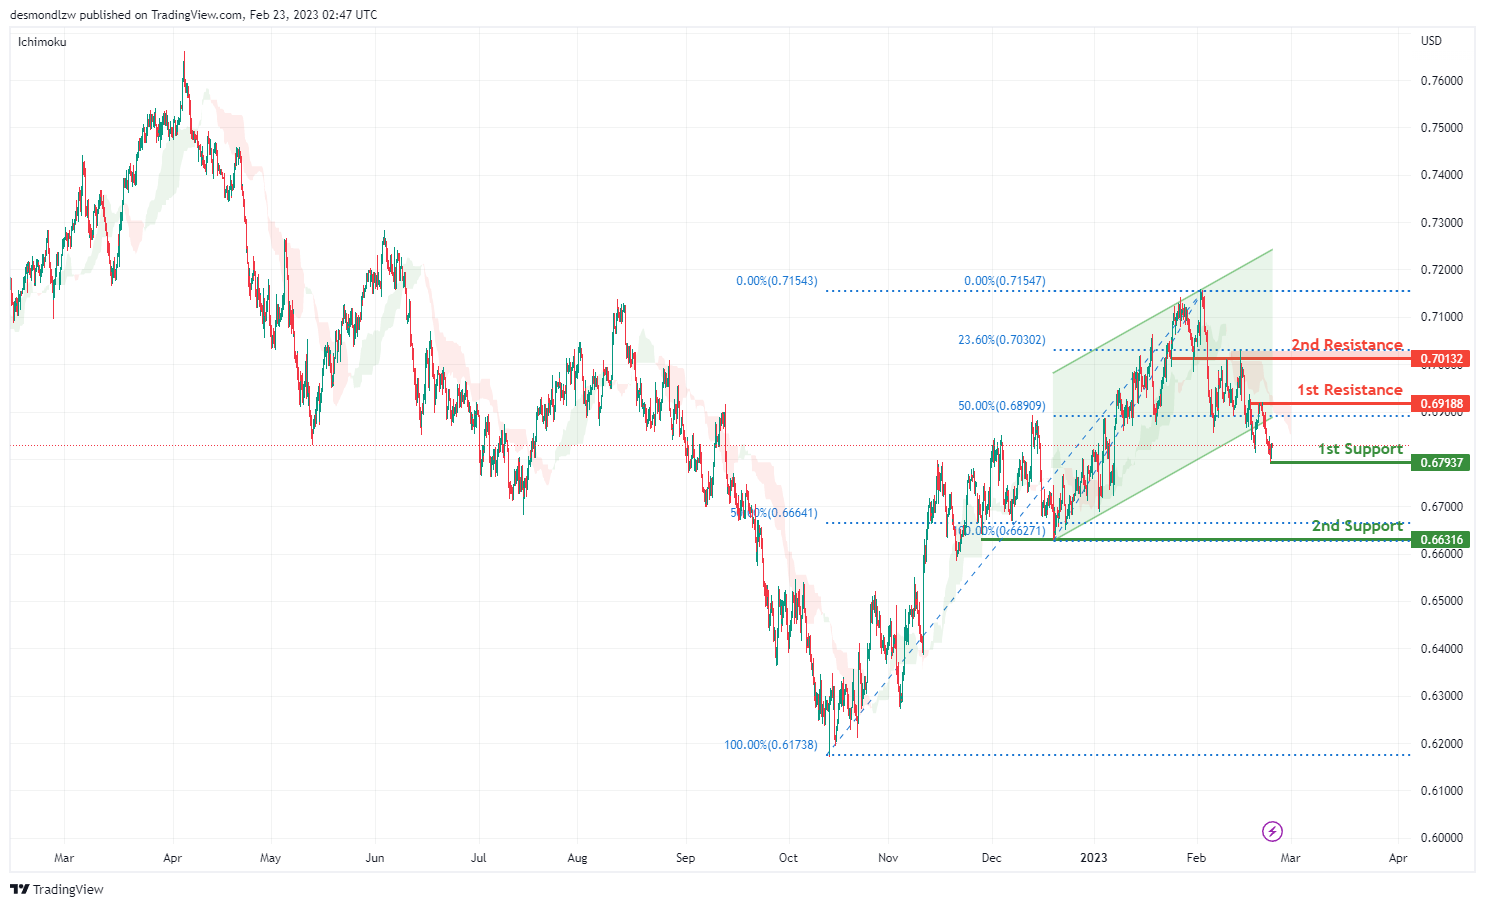
Looking at the H4 chart, my overall bias for AUDUSD is slightly bearish due to the current price being below the Ichimoku cloud, and the price has broken the ascending channel, indicating a bearish market.
The price could possibly godown towards the 1st support level at 0.67937 which is the recent swing low and in line with the 50% Fibonacci retracement. There is 2nd support at 0.66316 where the previous overlap support and 50% Fibonacci line are.
In an alternate scenario, The price could possibly go up towards the 1st resistance level at 0.69188 which is the recent overlap swing high, There is 2nd resistance at 0.70132 which is in line with the 23.6% Fibonacci retracement.
Areas of consideration
- H4. 2nd resistance at 0.70132
- H4. 1st resistance at 0.69188
- H4, 1st support at 0.67937
- H4, 2nd support at 0.66316
NZD/USD:
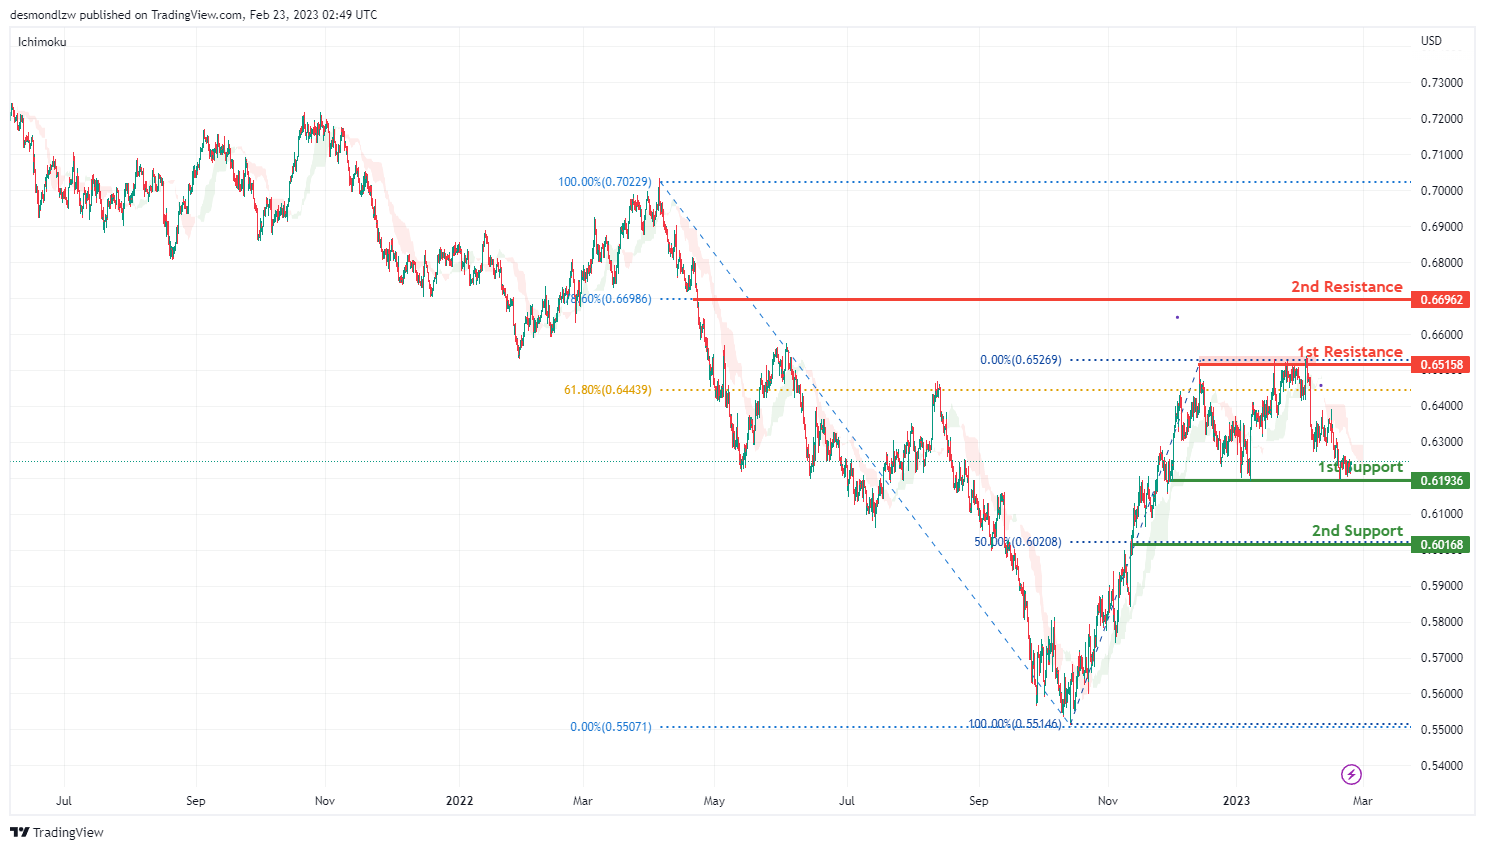
Looking at the H4 chart, my overall bias for NZDUSD is bearish, as the current price is below the Ichimoku Cloud. Expecting the price go down towards the 1st support at 0.61936 which is the overlap swing low. The 2nd support is at 0.60168 where the 50% Fibonacci line is.
In an alternate scenario, price could possibly go up towards the 1st resistance level at 0.65158 which is the recent overlap swing high. There is a 2nd resistance at 0.66962 where the 78.6% Fibonacci line is.
Areas of consideration:
- H4 time frame, 2nd resistance at 0.66962
- H4 time frame, 1st resistance at 0.65158
- H4 time frame, 1st support at 0.61936
- H4 time frame, 2nd support at 0.60168
USD/CAD:
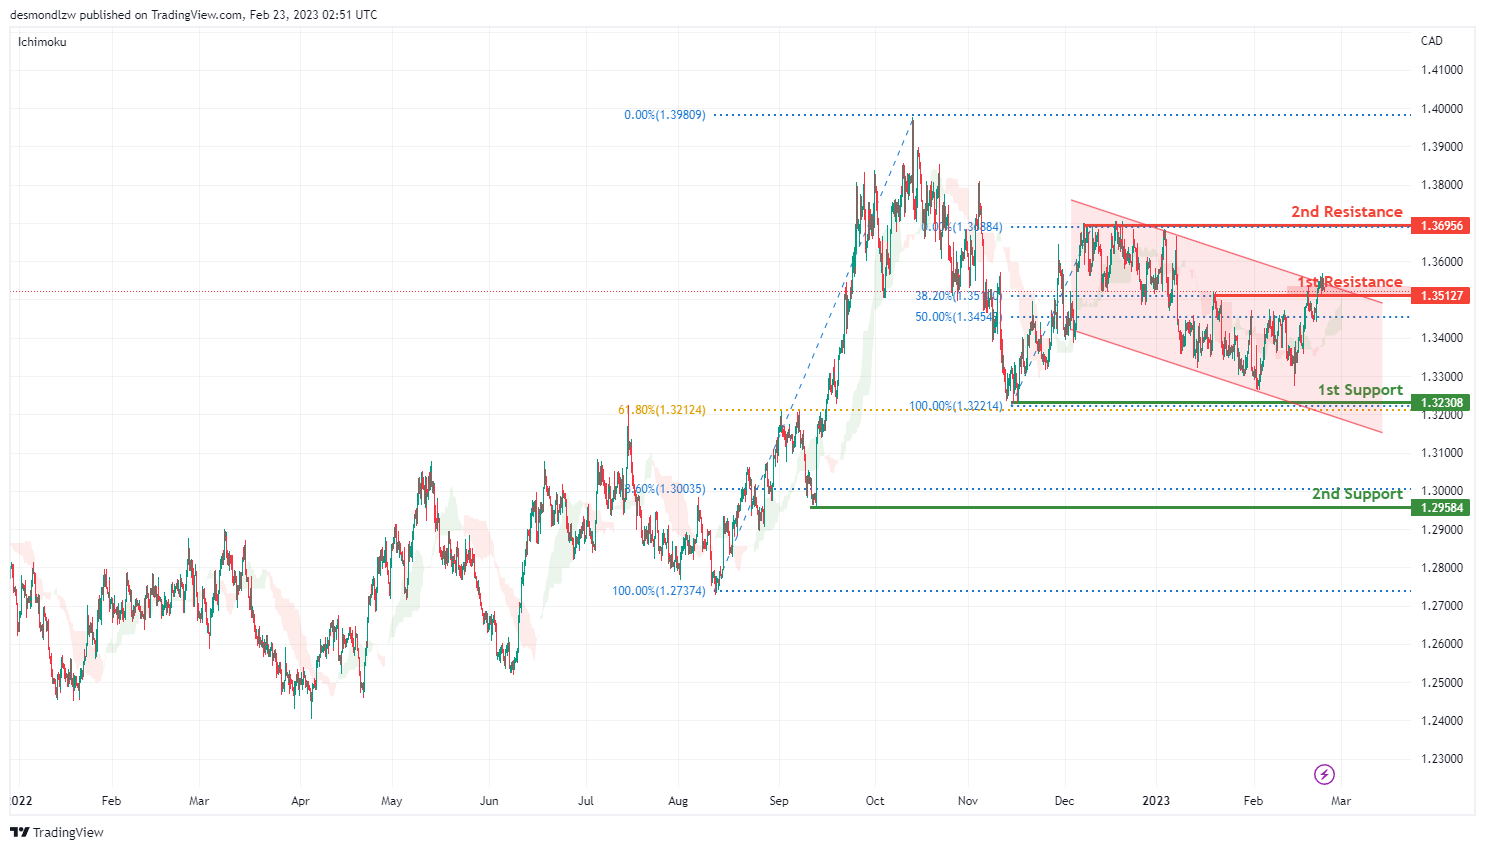
Looking at the H4 chart, my overall bias for USDCAD is bullish , as the current price is above the Ichimoku cloud and try to break the upper level of the descending channel. Expecting the current price to possibly break the 1st resistance at 1.35127 which is the recent swing high and in line with 38.2% Fibonacci retracement, before it heading to the 2nd resistance at 1.36956 which is the overlap of previous swing high.
In an alternative scenario, the price could possibly drop to the 1st support at 1.32308 which is the previous swing low and also in line with the 61.8% Fibonacci retracement. The 2nd support is at 1.29584 where the 78.6% Fibonacci line is .
Areas of consideration:
- H4 time frame, 2nd resistance at 1.36956
- H4 time frame, 1st resistance at 1.35127
- H4 time frame, 1st support at 1.32308
- H4 time frame, 2nd support at 1.29584
OIL:
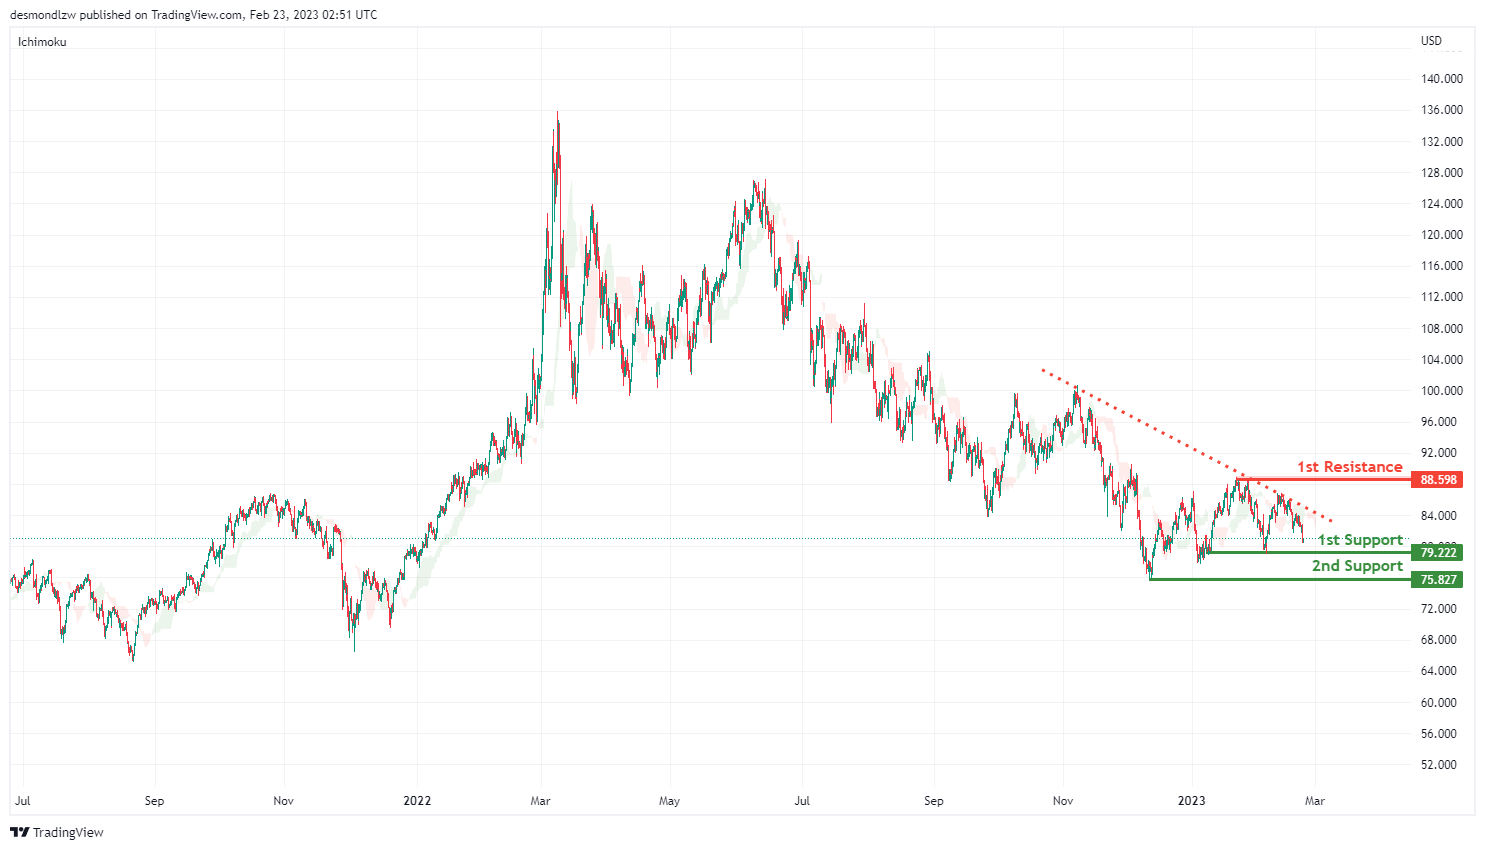
Looking at the H4 chart, my overall bias for BOC is bearish as the current price acrossing the Ichimoku cloud, and there is an descending trend line. Expecting the price to head down towards the 1st support level at 79.222 which is the recent overlap swing low, before the price drops to the 2nd support at 75.827.
In an alternate scenario, the price could possibly head up towards the 1st resistance level at 88.598 which is the recent swing high.
Areas of consideration:
- H4 time frame, 1st resistance at 88.598
- H4 time frame,1st support at 79.587
- H4 time frame, 2nd support at 75.827
Dow Jones Industrial Average:
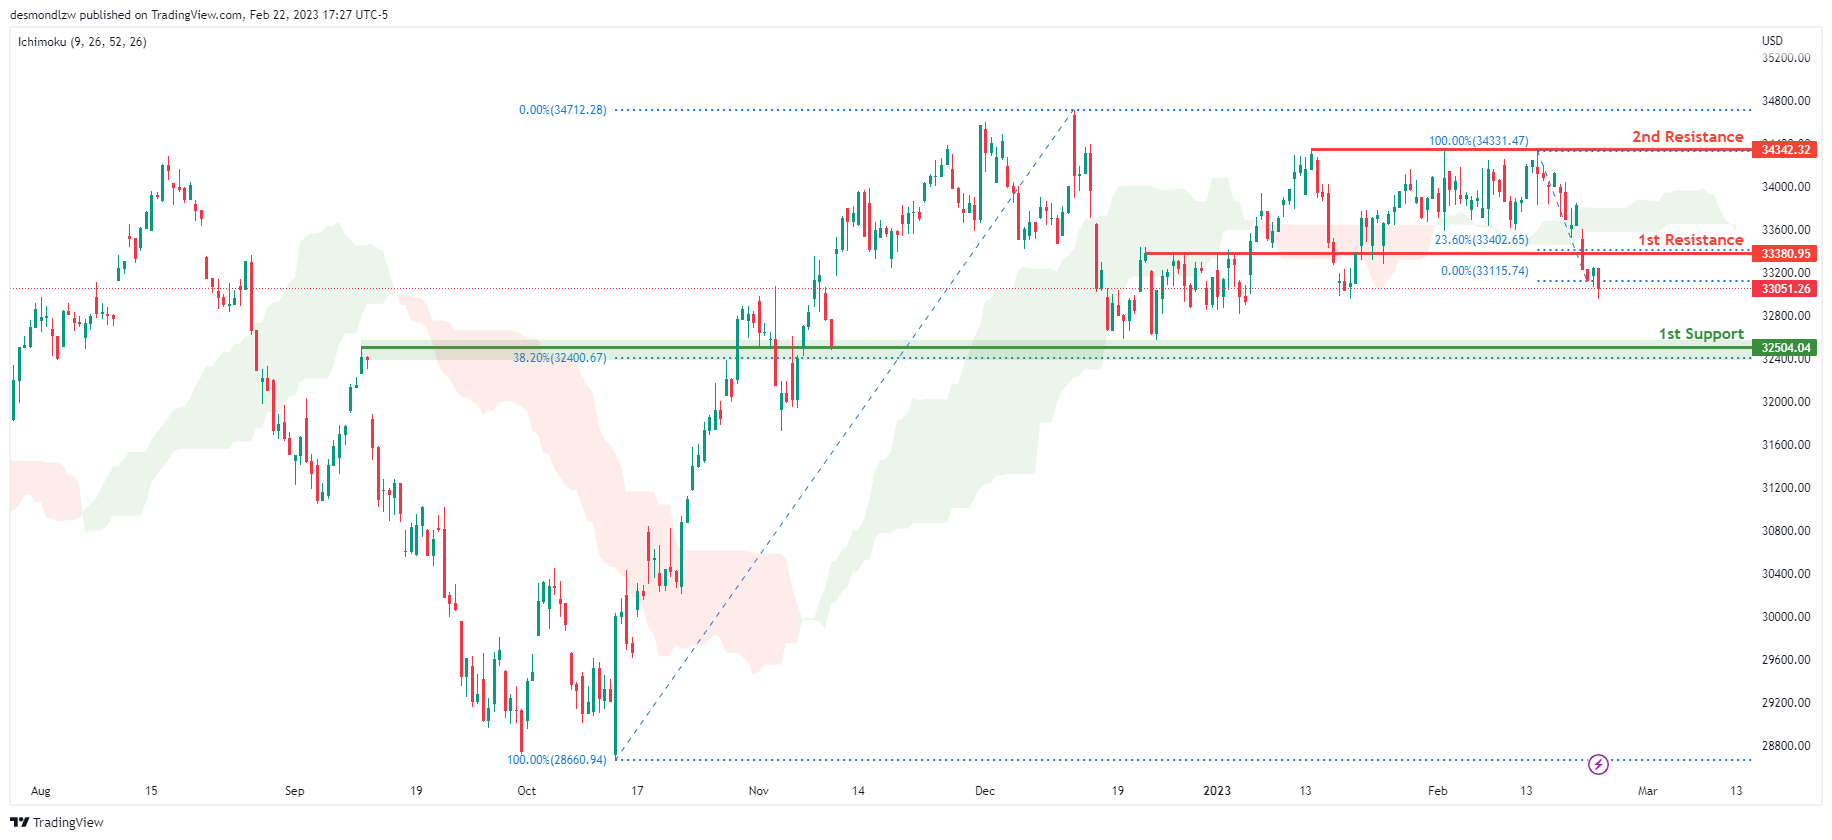
On the H4 chart, the overall bias for DJI is bearish. To add confluence to this, the price is crossing below the Ichimoku cloud which indicates a bearish market. If this bearish momentum continues, expect the price to possibly continue heading towards the 1st support at 32504.04, where the 38.2% Fibonacci line and overlap support is.
In an alternative scenario, price could possibly head back up towards the 1st resistance at 33380.95, where the 23.6% Fibonacci line is.
Areas of consideration:
- H4 time frame, 1st support at 32504.04
- H4 time frame, 1st Resistance at 33380.95
DAX:
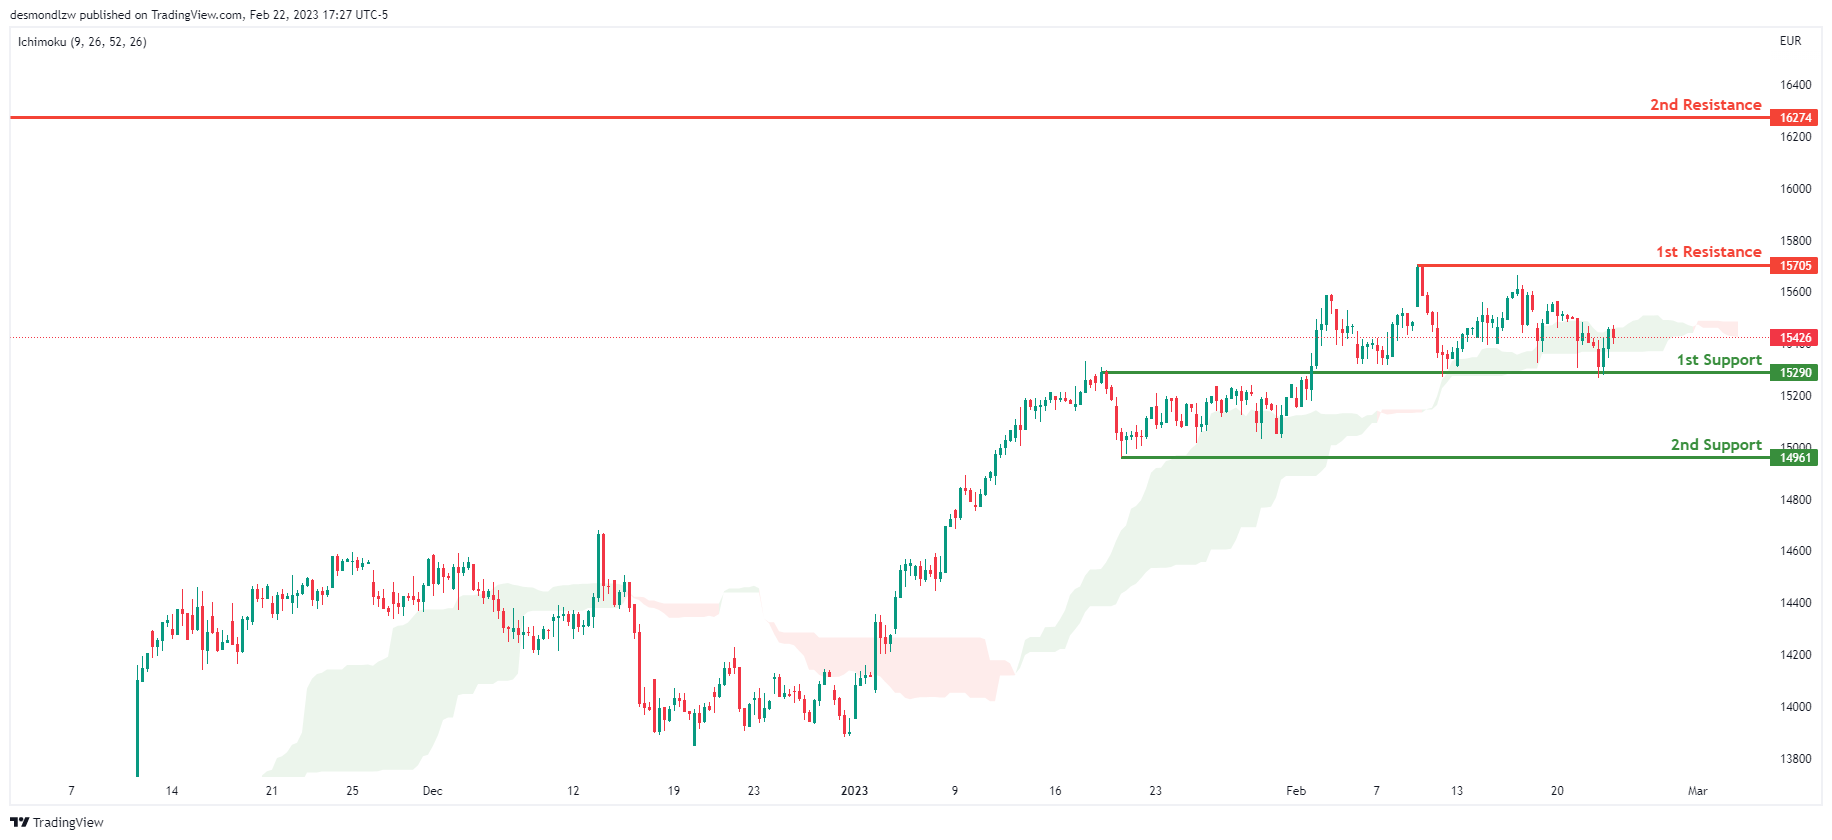
Looking at the H4 chart, my overall bias for DAX is bullish due to the current price crossing above the Ichimoku cloud, indicating a bullish market. If this bullish momentum continues, expect the price to possibly head towards the 1st resistance line at 15705, where the recent high is.
In an alternative scenario, price could possibly head down to retest the 1st support at 15290, where the overlap support is.
Areas of consideration:
- H4 time frame, 1st resistance is at 15705
- H4 time frame, 1st support is at 15290
ETHUSD:
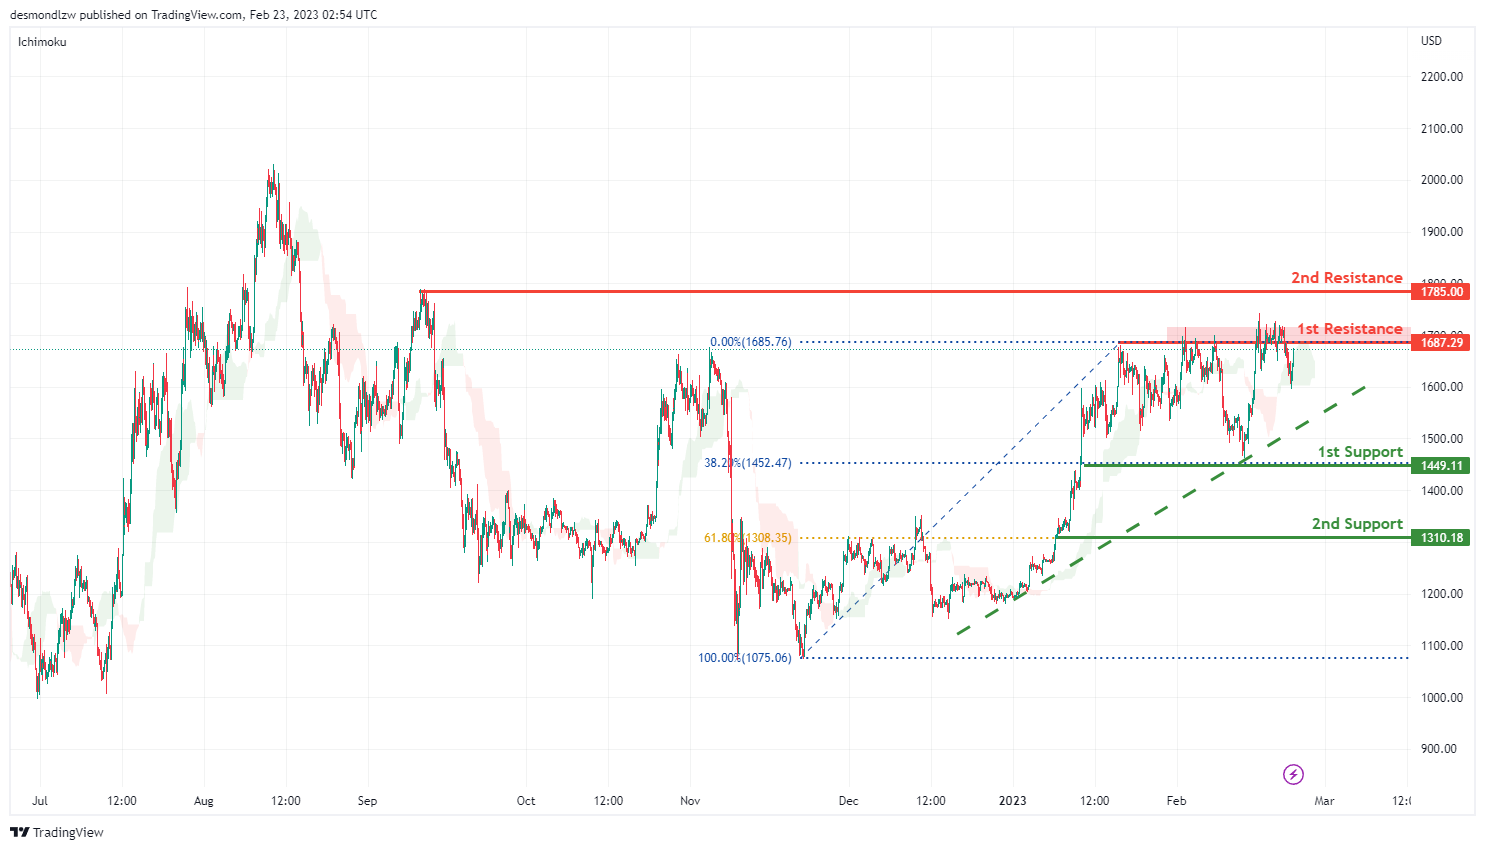
Looking at the H4 chart, my overall bias for ETHUSD is bullish, as there is a strong ascending trend line. The price may go up and break the 1st resistance line at 1685.76 before breaking the 2nd resistance line at 1785.00 which is the previous swing high.
In an alternate scenario, the price may retrace back to the 1st support line at 1449.11 which is in line with 38.2% Fibonacci retracement, before it heads towards the 2nd support at 1310.18 which is in line with 61.8% Fibonacci retracement.
Areas of consideration:
- H4 time frame, 2nd resistance of 1785.00
- H4 time frame, 1st resistance of 1685.76
- H4 time frame, 1st support at 1449.11
- H4 time frame, 2nd support at 1310.18
BTCUSD:
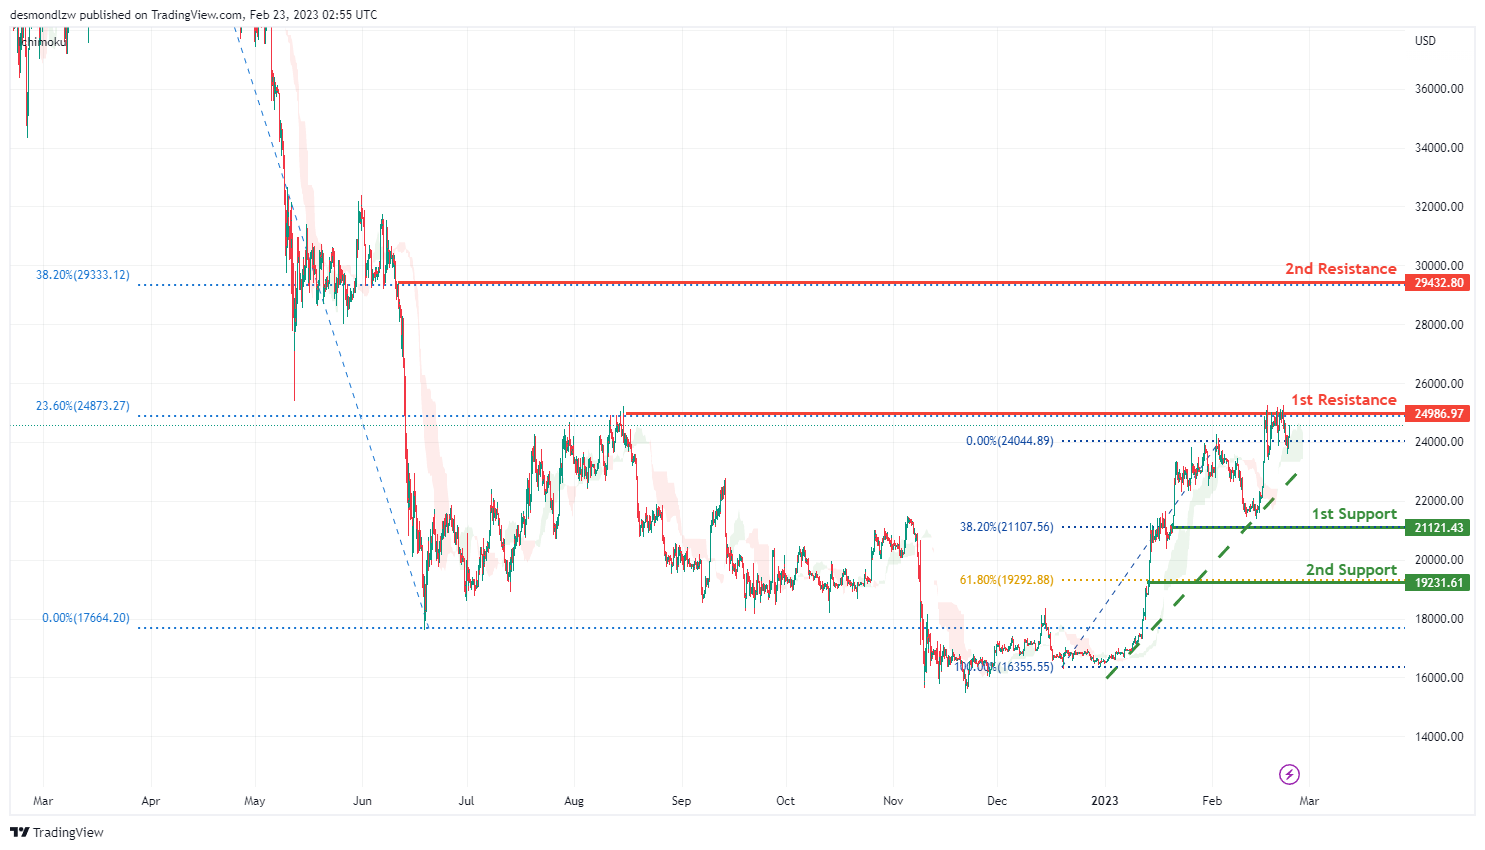
Looking at the H4 chart, my overall bias for BTCUSD is bullish. As there is an ascending trend line, expect the price could possibly head up to the 1st resistance at 24986.97 which is the overlap recent swing high, before it head up to the 2nd resistance 29432.80 where the 38.2% Fibonacci retracement is.
In an alternate scenario, The price may go down towards the 1st support line at 21121.43 which is in line with 38.2% Fibonacci retracement, before heading down towards the 2nd support at 19231.61 which is in line with 61.8% Fibonacci retracement.
Areas of consideration:
- H4 time frame, 2nd resistance 29432.80
- H4 time frame, 1st resistance 24986.97
- H4 time frame, 1st support at 21121.43
- H4 time frame, 2nd support at 19231.61
S&P 500:
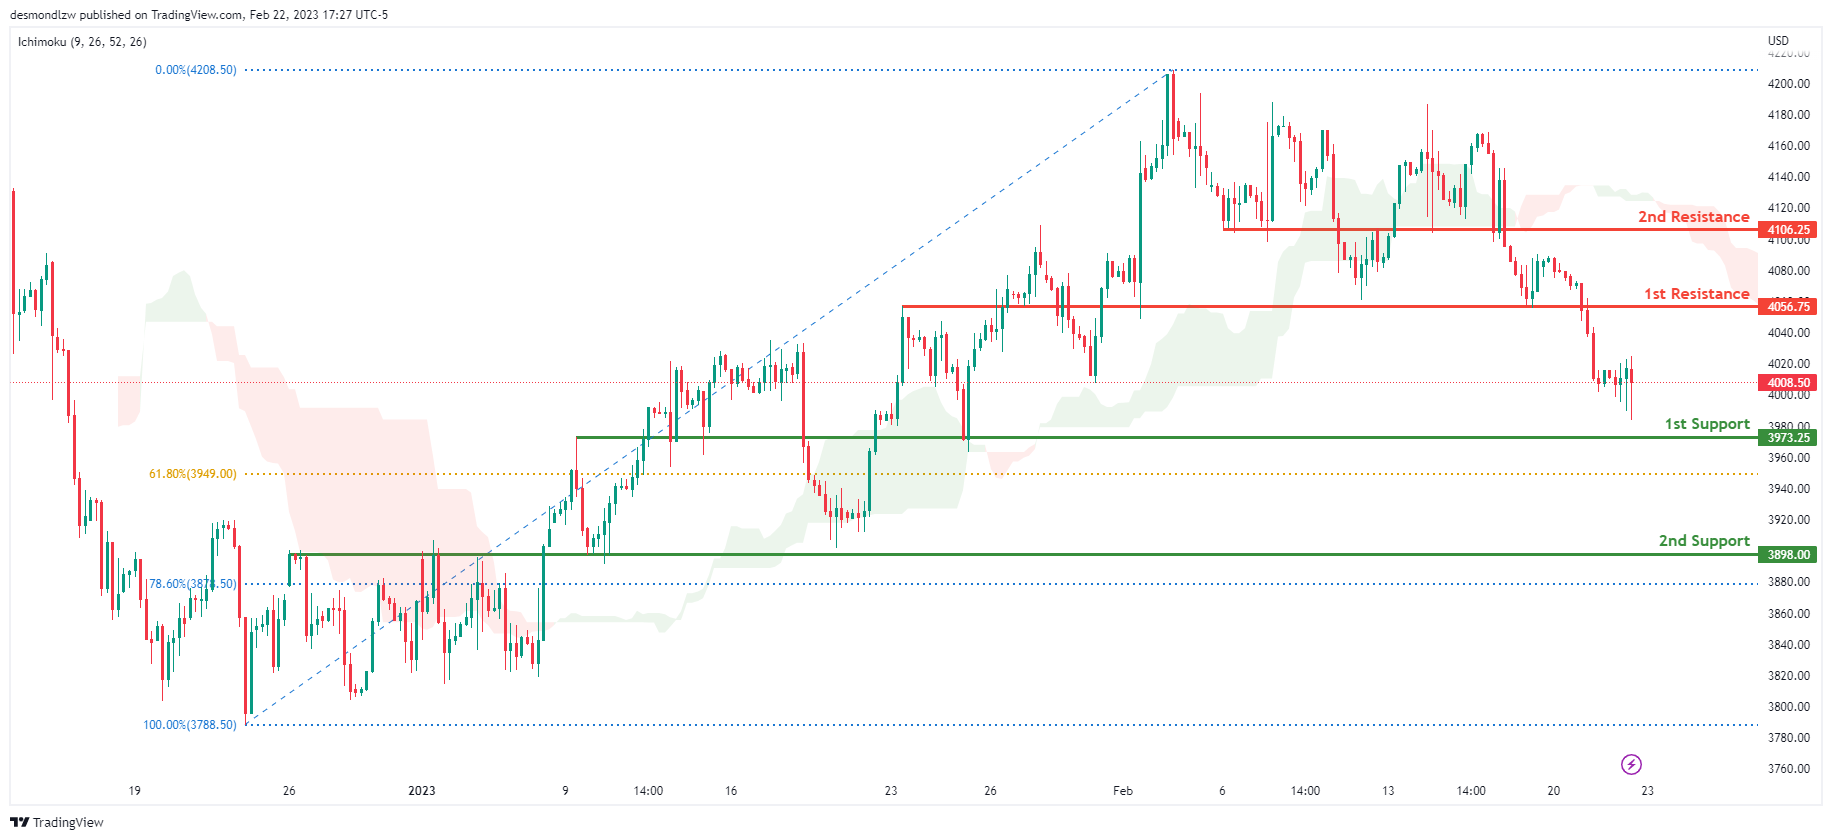
Looking at the H4 chart, my overall bias for S&P500 is bearish due to the current price being below the Ichimoku cloud, indicating a bearish market. If this bearish momentum continues, expect the price to continue heading towards the 1st support at 3973.25 which is the overlap support and slightly above where the 61.8% Fibonacci line is.
In an alternative scenario, price could possibly head back up to retest the 1st resistance at 4056.75, where the overlap resistance is.
Areas of consideration:
- H4 time frame, 1st support at 3973.25
- H4 time frame, 1st resistance at 4056.75
EUR/USD Daily Outlook
Daily Pivots: (S1) 1.0581; (P) 1.0623; (R1) 1.0646; More...
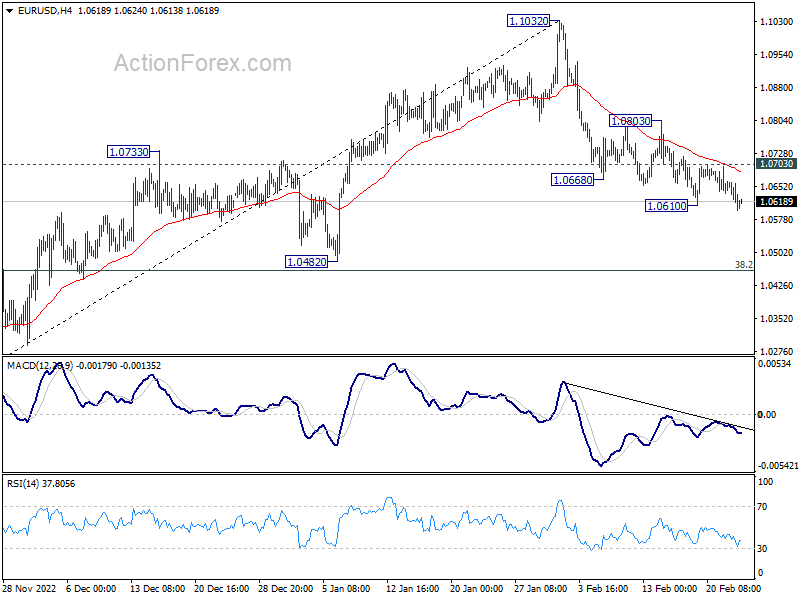
EUR/USD's corrective fall from 1.1032 resumed by breaking 1.0610 temporary low. Intraday bias is back on the downside. Further decline should be seen to 38.2% retracement of 0.9534 to 1.1032 at 1.0463. Strong support should be seen around there to bring rebound, at least on first attempt. On the upside, above 1.0703 minor resistance will turn intraday bias neutral first. But risk will continue to stay on the downside as long as 1.0803 resistance holds.
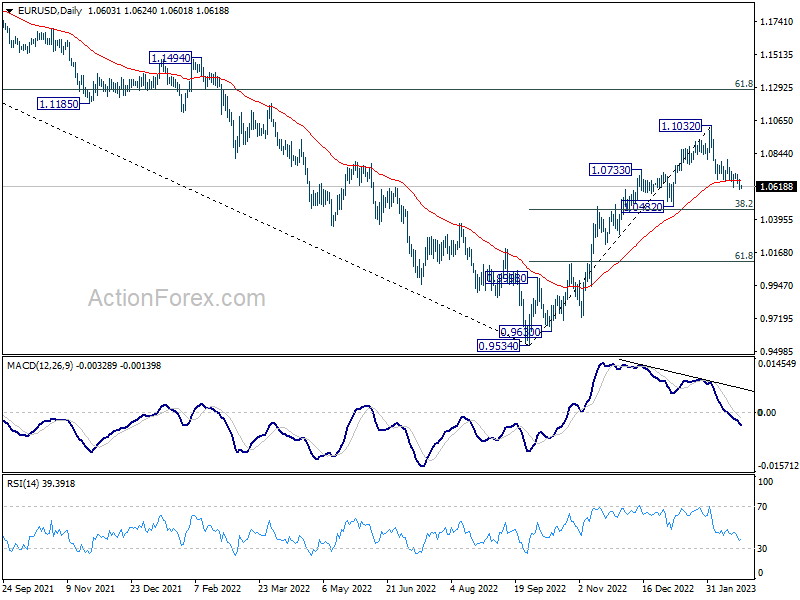
In the bigger picture, the rally from 0.9534 low (2022 low) is a medium term up trend rather than a correction. Further rise is in favor to 61.8% retracement of 1.2348 (2021 high) to 0.9534 at 1.1273 next. This will remain the favored case as long as 1.0482 support holds.
Dollar Breaking Out after Fed Minutes, Yen Recovering
Reaction to FOMC minutes overnight was relatively muted with major US indexes closing mixed, while 10-year yield dipped slightly. Dollar, however, is making some progress by breaking to the upside against Euro. But momentum of the greenback is so far rather weak. At the same time, Yen is trying to recover against Europeans and commodity currencies, in a limited way.
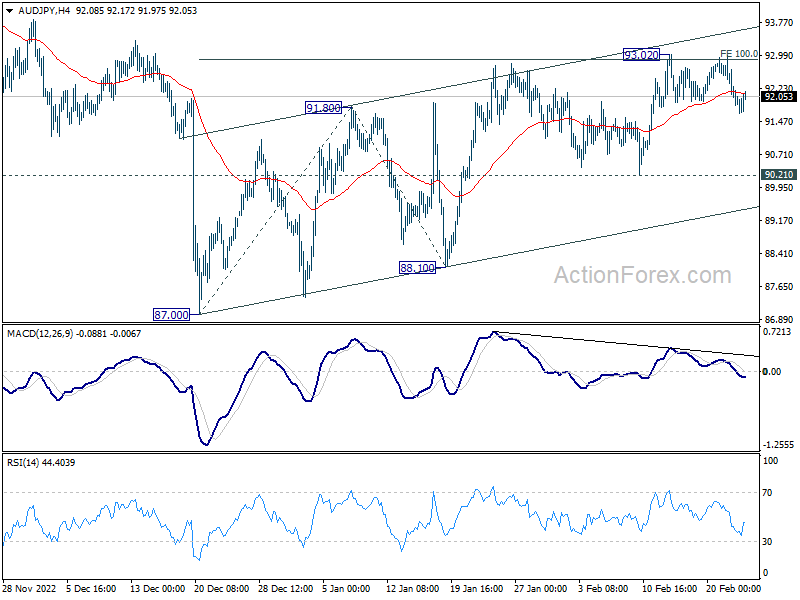
Technically, one focus for the rest of the month would be whether Yen's rebound could gain more momentum. AUD/JPY's recovery from December low at 87.00 is so far rather corrective looking. Downside momentum has been diminishing since late January, as seen in 4 hour MACD. While another rise cannot be ruled out, upside will likely be limited. On the other hand, break of 90.21 support will suggest that the recovery has completed and bring retest of 87.00 low.
In Asia, at the time of writing, Hong Kong HSI is up 0.54%. China Shanghai SSE is up 0.07%. Singapore Strait Times is down -0.83%. Japan is on holiday. Overnight, DOW dropped -0.26%. S&P 500 dropped -0.16%. NASDAQ rose 0.13%. 10-year yield dropped -0.032 to 3.923.
FOMC minutes: A few participants favored 50bps hike
Minutes of January 31–February 1 FOMC meeting reveal that "almost all participants agreed that it was appropriate to raise the target range for the federal funds rate 25 basis points at this meeting."
"Many of these participants observed that a further slowing in the pace of rate increases would better allow them to assess the economy's progress... as they determine the extent of future policy tightening that will be required."
Yet, "A few participants stated that they favored raising the target range for the federal funds rate 50 basis points at this meeting or that they could have supported raising the target by that amount."
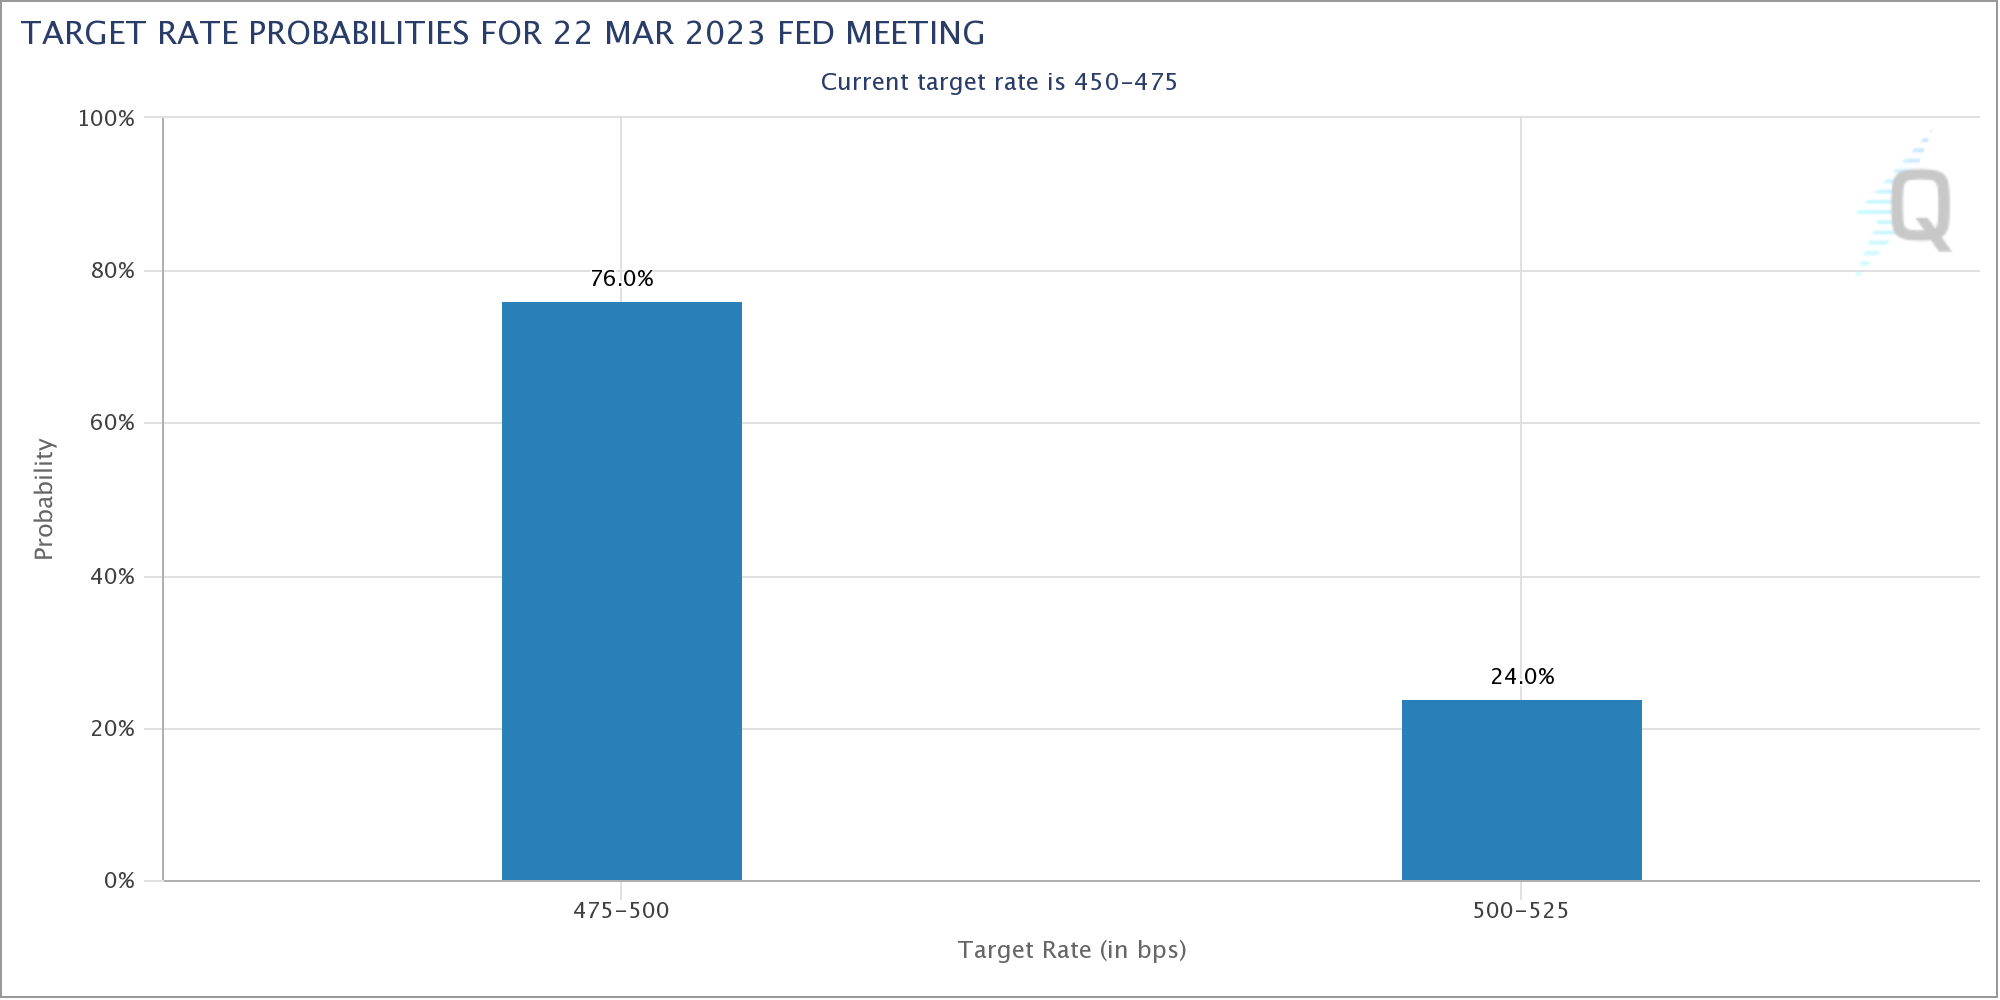
While there are more speculations regarding a revert to 50bps at March meeting, 25bps is still the majority of bets. For now, fed fund futures are pricing in 76% chance of another 25bps hike in March, and just 24% for 50bps.
Fed Williams: Our job is clear to restore price stability
New York Fed President John Williams said yesterday at a conference,"Our job is clear: our job is to make sure we restore price stability, which is truly the foundation of a strong economy."
Williams noted that the global supply chains are still disrupted, thus, "although goods prices have come down in last several months, there are signs this may not go as quickly as hoped."
At the same time, inflation in core services, excluding food, energy and shelter, remains far too high, as driven by excessive demand relative to supply.
RBNZ Orr: Cyclone rebuilding could add 1% to GDP over coming years
RBNZ Governor Adrian Orr told Bloomberg TV that rebuilding after the damage by cyclone Gabrielle is expected to boost activity and raise price pressure. There is a risk that OCR might be required to stay higher for longer as a result.
"We're looking at about a 1% addition to GDP over coming years," Orr said. "That is well manageable within the current monetary settings. But if inflation expectations continue, if core inflation is more persistent, then tighter for longer is certainly an outcome."
On the other hand, some of the global downside risks are "actually assisting on the inflation battle," Orr noted. "Economies are evolving broadly as anticipated, excluding these ongoing shocks. So I'm very confident that low and stable inflation will return."
Looking ahead
Eurozone CPI final is the only feature in European session. US will release jobless claims and GDP revision later in the day.
EUR/USD Daily Outlook
Daily Pivots: (S1) 1.0581; (P) 1.0623; (R1) 1.0646; More...
EUR/USD's corrective fall from 1.1032 resumed by breaking 1.0610 temporary low. Intraday bias is back on the downside. Further decline should be seen to 38.2% retracement of 0.9534 to 1.1032 at 1.0463. Strong support should be seen around there to bring rebound, at least on first attempt. On the upside, above 1.0703 minor resistance will turn intraday bias neutral first. But risk will continue to stay on the downside as long as 1.0803 resistance holds.
In the bigger picture, the rally from 0.9534 low (2022 low) is a medium term up trend rather than a correction. Further rise is in favor to 61.8% retracement of 1.2348 (2021 high) to 0.9534 at 1.1273 next. This will remain the favored case as long as 1.0482 support holds.
Economic Indicators Update
| GMT | Ccy | Events | Actual | Forecast | Previous | Revised |
|---|---|---|---|---|---|---|
| 00:30 | AUD | Private Capital Expenditure Q4 | 2.20% | 1.40% | -0.60% | |
| 10:00 | EUR | Eurozone CPI Y/Y Jan F | 8.50% | 8.50% | ||
| 10:00 | EUR | Eurozone CPI Core Y/Y Jan F | 5.20% | 5.20% | ||
| 13:30 | USD | Initial Jobless Claims (Feb 17) | 194K | |||
| 13:30 | USD | GDP Annualized Q4 P | 2.90% | 2.90% | ||
| 13:30 | USD | GDP Price Index Q4 P | 3.50% | 3.50% | ||
| 15:30 | USD | Natural Gas Storage | -60B | -100B | ||
| 16:00 | USD | Crude Oil Inventories | 2.9M | 16.3M |
RBNZ Orr: Cyclone rebuilding could add 1% to GDP over coming years
RBNZ Governor Adrian Orr told Bloomberg TV that rebuilding after the damage by cyclone Gabrielle is expected to boost activity and raise price pressure. There is a risk that OCR might be required to stay higher for longer as a result.
"We're looking at about a 1% addition to GDP over coming years," Orr said. "That is well manageable within the current monetary settings. But if inflation expectations continue, if core inflation is more persistent, then tighter for longer is certainly an outcome."
On the other hand, some of the global downside risks are "actually assisting on the inflation battle," Orr noted. "Economies are evolving broadly as anticipated, excluding these ongoing shocks. So I'm very confident that low and stable inflation will return."
Fed Williams: Our job is clear to restore price stability
New York Fed President John Williams said yesterday at a conference,"Our job is clear: our job is to make sure we restore price stability, which is truly the foundation of a strong economy."
Williams noted that the global supply chains are still disrupted, thus, "although goods prices have come down in last several months, there are signs this may not go as quickly as hoped."
At the same time, inflation in core services, excluding food, energy and shelter, remains far too high, as driven by excessive demand relative to supply.
FOMC minutes: A few participants favored 50bps hike
Minutes of January 31–February 1 FOMC meeting reveal that "almost all participants agreed that it was appropriate to raise the target range for the federal funds rate 25 basis points at this meeting."
"Many of these participants observed that a further slowing in the pace of rate increases would better allow them to assess the economy's progress... as they determine the extent of future policy tightening that will be required."
Yet, "a few participants stated that they favored raising the target range for the federal funds rate 50 basis points at this meeting or that they could have supported raising the target by that amount."
While there are more speculations regarding a revert to 50bps at March meeting, 25bps is still the majority of bets. For now, fed fund futures are pricing in 76% chance of another 25bps hike in March, and just 24% for 50bps.
AUD/USD Remains Vulnerable, US GDP Report Next
Key Highlights
- AUD/USD moved into a bearish zone below the 0.7000 support.
- It is facing resistance near 0.6880 and a bearish trend line on the 4-hours chart.
- Crude oil price is showing bearish signs below the $78 pivot level.
- The US Gross Domestic Product could grow 2.9% in Q4 2022 (Preliminary).
AUD/USD Technical Analysis
The Aussie Dollar started a major decline from well above 0.7120 against the US Dollar. AUD/USD declined below the 0.7000 support zone to enter a bearish zone.
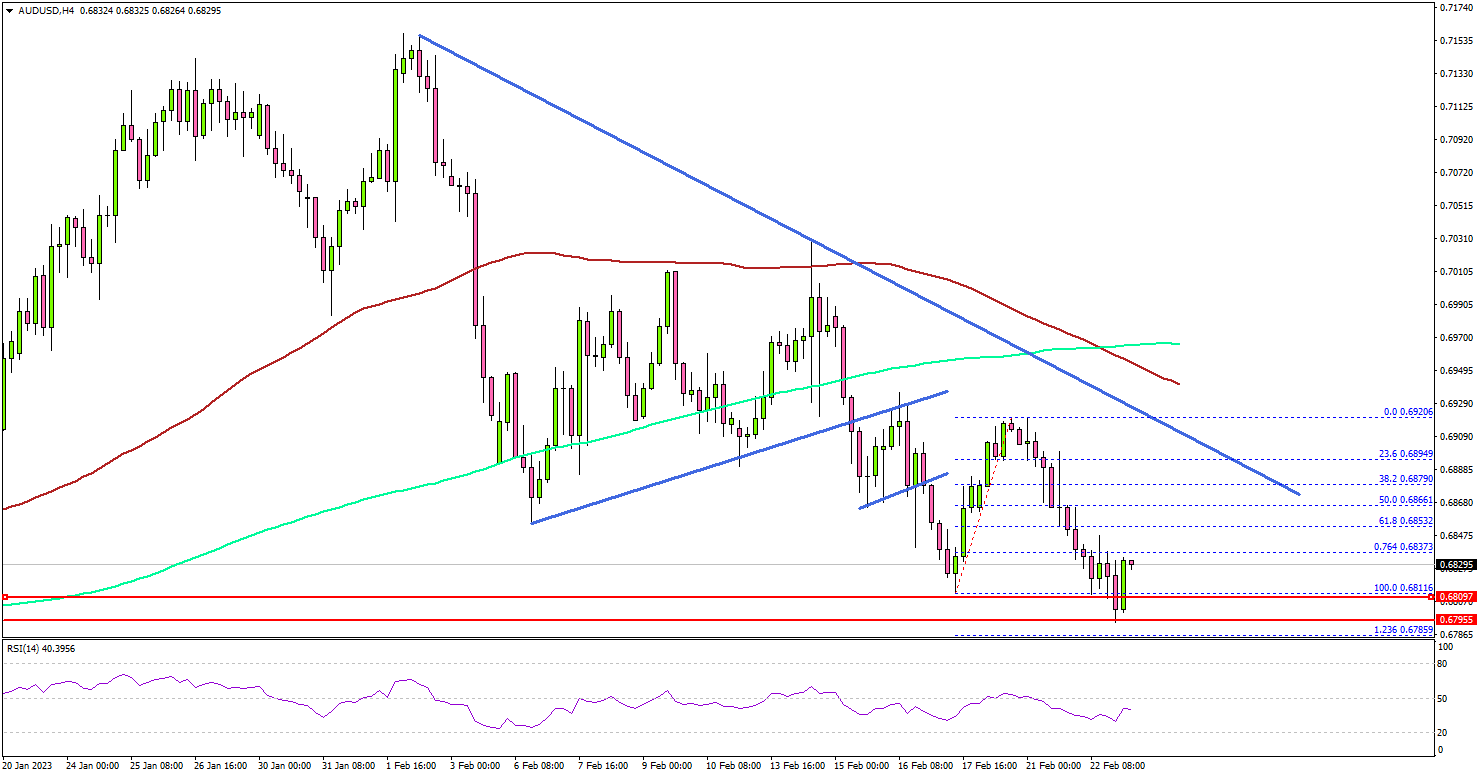
Looking at the 4-hours chart, the pair settled below the 0.6950 level, the 100 simple moving average (red, 4-hours), and the 200 simple moving average (green, 4-hours).
There was a clear move below the 0.6880 support zone. The pair even spiked below the 0.6820 level and remains at a risk of more losses. On the downside, an immediate support is near the 0.6800 level.
The next major support is near the 0.6750 level, below which there is a risk of a move towards the 0.6720. Any more losses could open the doors for a drop towards 0.6650.
On the upside, an immediate resistance is near the 0.6860 level. The next major resistance is near the 0.6880 level and a connecting bearish trend line on the same chart. The main resistance is now forming near 0.7000 and the 100 simple moving average (red, 4-hours).
A clear move above the 0.7000 resistance might start a steady increase towards the 0.7080 resistance zone. Any more gains could open the doors for a move towards the 0.7150 level.
Looking at EUR/USD, the pair is still in a negative zone below the 1.0700 level and recoveries might face hurdles.
Economic Releases
- US Initial Jobless Claims - Forecast 200K, versus 194K previous.
- US Gross Domestic Product Q4 2022 (Preliminary) – Forecast 2.9% versus previous 2.9%.