

Sample Category Title
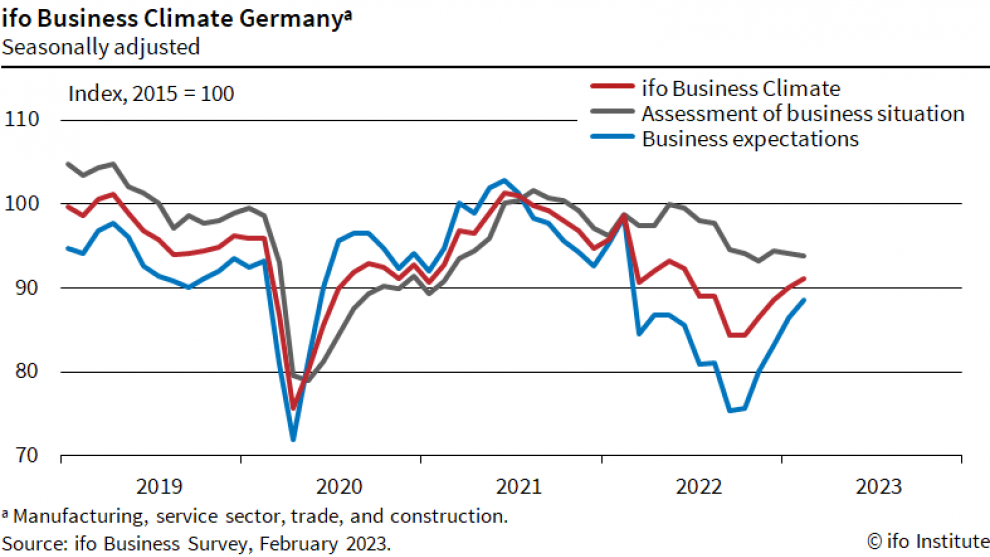
Germany Ifo rose to 91.1, gradually working out of weakness
Germany Ifo Business Climate rose from 90.2 to 91.1 in February, matched expectations. Current Assessment Index dropped from 94.1 to 93.0, below expectation of 94.3. Expectations Index rose from 86.4 to 88.5, above expectation of 94.7.
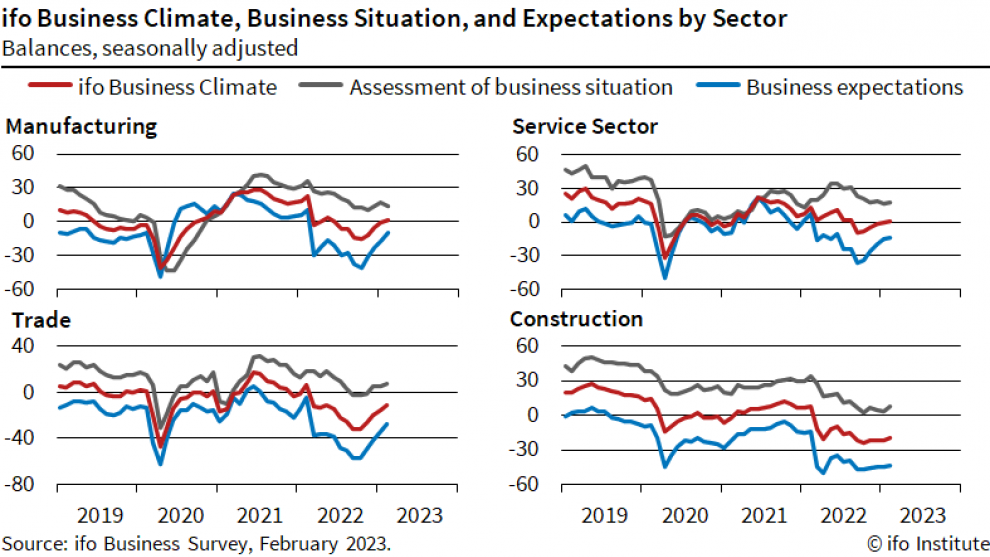
By sector, manufacturing rose form -0.7 to 1.5. Services rose from 0.2 to 1.3. Trade rose from -15.4 to -10.6. Construction rose from -21.7 to -19.6.
Ifo said: "The German economy is gradually working its way out of a period of weakness."
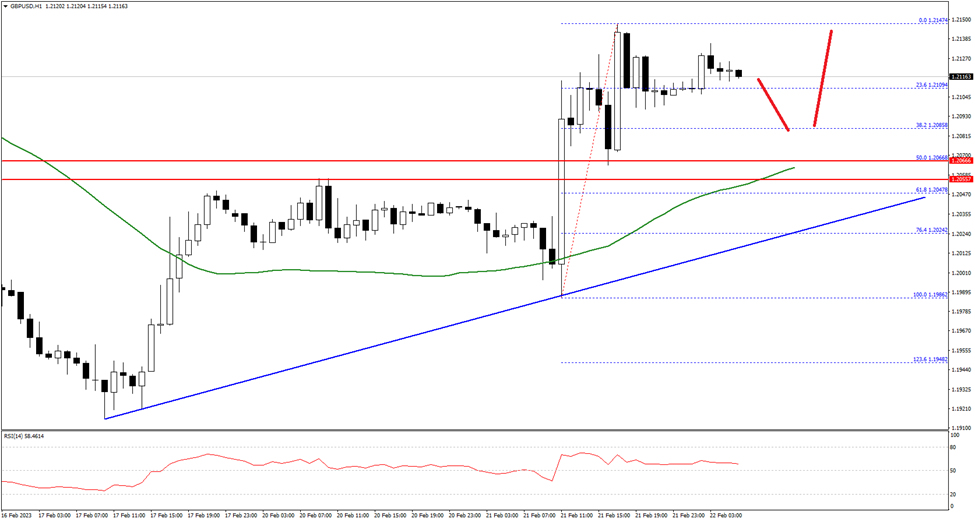
GBP/USD Pair Started a Recovery Wave Above 1.2050
The British Pound started a decent increase above the 1.2000 resistance zone against the US Dollar. The GBP/USD pair climbed above the 1.2050 level to start a recovery wave.
There was a close above the 1.2080 level and the 50 hourly simple moving average. It is now consolidating gains and trading near the 1.2110 zone. An immediate resistance is near the 1.2135 level.
The first major resistance is near the 1.2150 level. If there is a clear upside break above the 1.2150 resistance, the pair could rise steadily towards the 1.2200 level in the near term. The next major resistance sits near 1.2220 on FXOpen.
On the downside, the first major support is near the 1.2080 level. The main support is forming near the 1.2040 level and a connecting bullish trend line on the hourly chart. A break below the 1.2040 support could push the pair towards the 1.2000 support.
NZDUSD Flatlines But Sellers Still Active
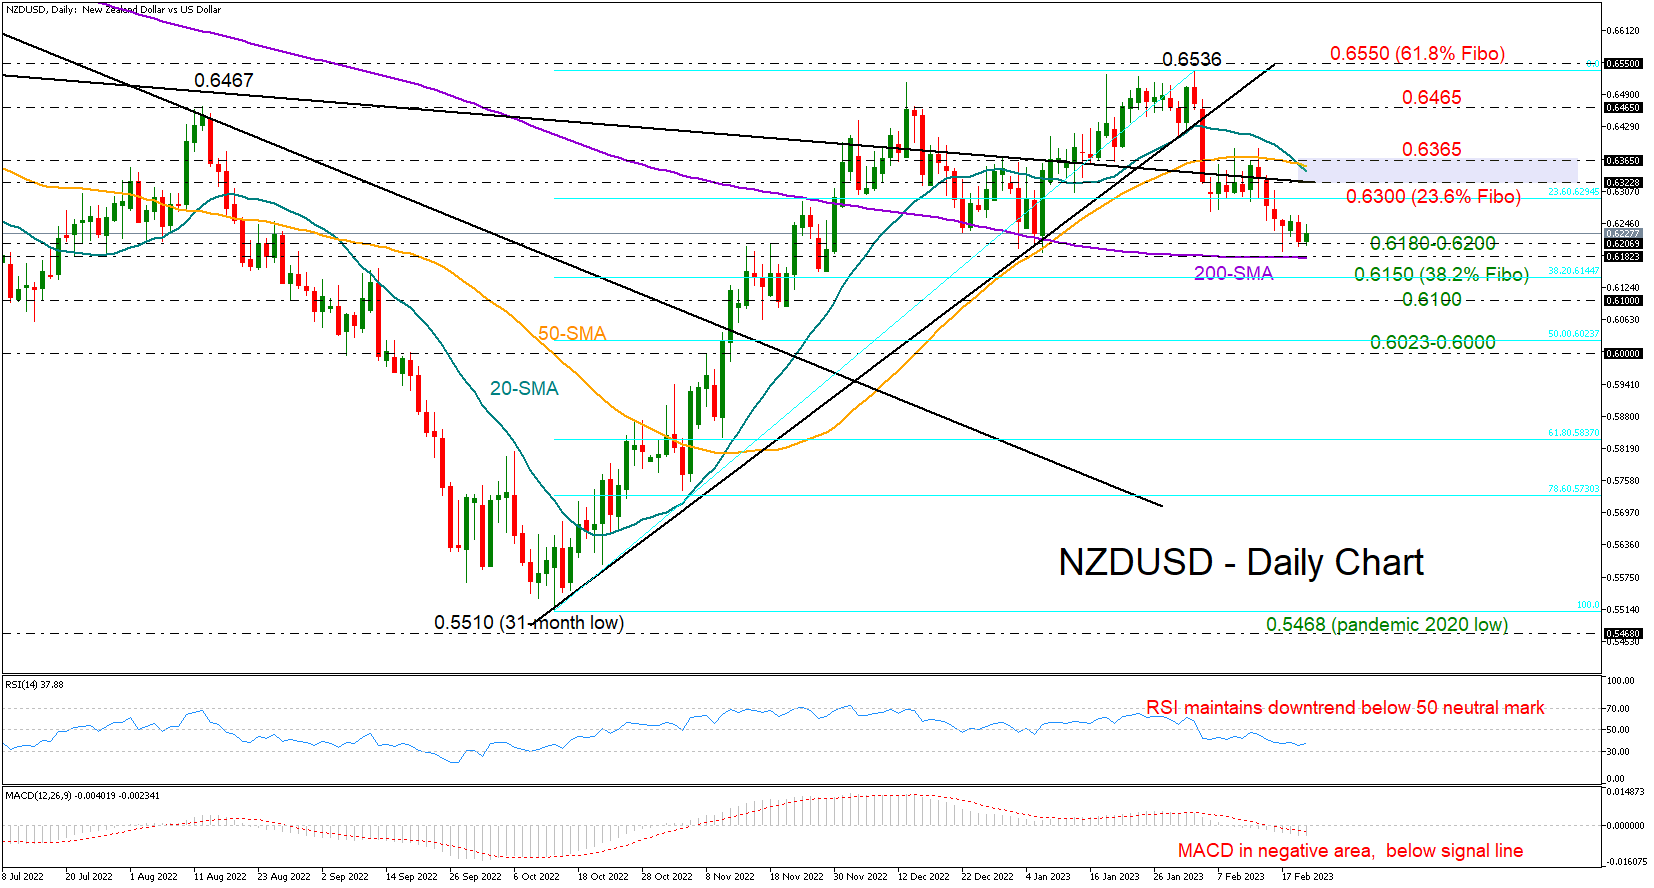
NZDUSD faced little volatility during the Asian trading session after a more-or-less expected 50bps rate hike by the Reserve Bank of New Zealand.
The pair keeps building floor around the 0.6200 level and marginally above the 200-day simple moving average (SMA), raising hopes for an upside correction, though with the RSI maintaining a downtrend comfortably below its 50 neutral mark and the MACD remaining negatively charged below its red signal line, the luck seems to be on the bears’ side. It’s also worthy to note that the 20-day SMA has slipped below the 50-day SMA, flagging a deterioration in the short-term trend.
Sellers could gain the upper hand if the pair resumes its negative trajectory below the 200-day SMA at 0.6180. Consequently, the price could slide towards the 38.2% Fibonacci retracement of the previous upleg at 0.6145, while a steeper decline may reach the 0.6100 region, which provided a footing back in November. Falling lower, the bears will next head for the 50% Fibonacci of 0.6025 and the 0.6000 psychological mark.
On the upside, there is a challenging border within the 0.6300-0.6365 region, where the key constraining line from December 2020, the 23.5% Fibonacci mark and the shorter-term SMAs are positioned. If the bulls manage to breach that wall, the recovery could pick up steam towards the 0.6465 resistance zone. Even higher, all eyes will turn to the 0.6550 bar, which has been a caution area since May 2022.
In brief, NZDUSD sellers could remain active in the coming sessions, waiting for a decisive close below the 200-day SMA to press the market lower.
Will USD Set a New High in 2023?
The US dollar index has lost around 12% since October 2022 till its local low at the end of January 2023. One of the major reasons for the devaluation was the oil prices decline. Combined with the 4.50% Fed rate hike since the beginning of 2022 and the launch of QT, this led to a 2.7% inflation drop, pressuring the greenback.
However, in February, the US dollar index gained over 3%, and there are some significant reasons for that move.
This article will discuss the drivers for the US dollar's further increase and look at the most popular trading instruments from the technical analysis side.
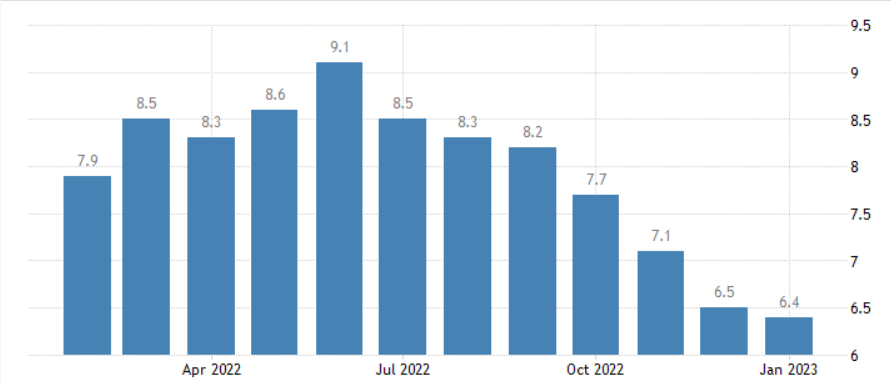
US Inflation m/m
Why the US Dollar Reversed?
On February 15, the Bureau of Labor Statistics published the CPI numbers for January 2023. The actual results overperformed expectations, with inflation rising 6.4% y/y versus the 6.2% y/y estimated.
The change in inflation has a time lag to the rate hike by the Fed, which slowed its pace in November and December, raising rates by 0.50% and 0.25%, respectively, after three consecutive 0.75% hikes.
Why is it so important? As soon as the Fed became less aggressive, inflation gave the first hints of an uptrend continuation, which sounds dangerous for the Fed and the US economy. The strong labor market added fuel to the fire. In January nonfarm sector added 517K jobs vs. 193K expected, and wedges gained 0.3% m/m. Moreover, Retail Sales increased by 3.0% in January vs. -1.1% in December, while the producer price index rose by 0.7% in January vs. -0.2 in December. All these factors prove that the US economy remains overheated, and prices might keep growing.
As a result, it looks like the Fed is failing in battle against inflation. That’s why most of the FOMC voting members in 2023 are hawks, who try to cool down the stock market and the US economy, which continues to grow.
If February’s report, expected in March, confirms that the prices continue to grow and the Fed has failed with its monetary policy, the markets might panic, and the US dollar will be the major beneficiary.
Another fact to pay attention to is an inversion of the US Treasuries yield curve.
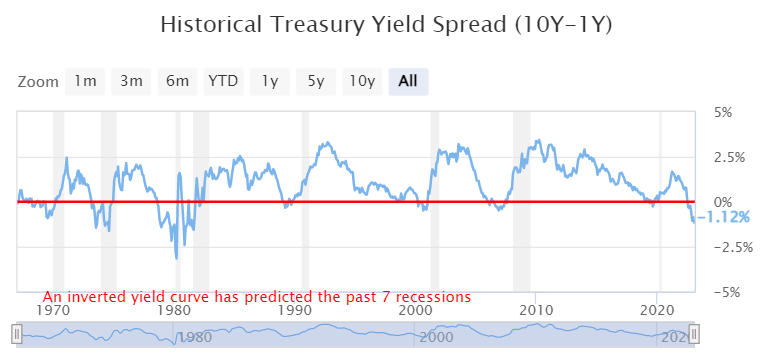
US Treasury Yield Spread (10Y – 1Y)
An inverted yield curve occurs when yields on short-term bonds rise above the results on longer-term bonds of the same credit quality, which has proven to be a relatively reliable indicator of an economic recession.
As you can see in the picture above, the gray bars throughout the charts indicate the past US recessions since 1967. A quick look at the “Historical Treasury Yield Spread (10Y-1Y)” graph suggests that, historically, an economic recession generally follows once the yield spread drops below 0% (the red Y-axis). This is especially true for recessions during the late 1900s. The yield spread reached an all-time low of -3.16% around April 1980, during the economic recession of the early 1980s.
As soon as the recession finally happens, the US dollar will gain heavily against other currencies as the major safe-haven asset.
Technical analysis
DXY, Weekly timeframe
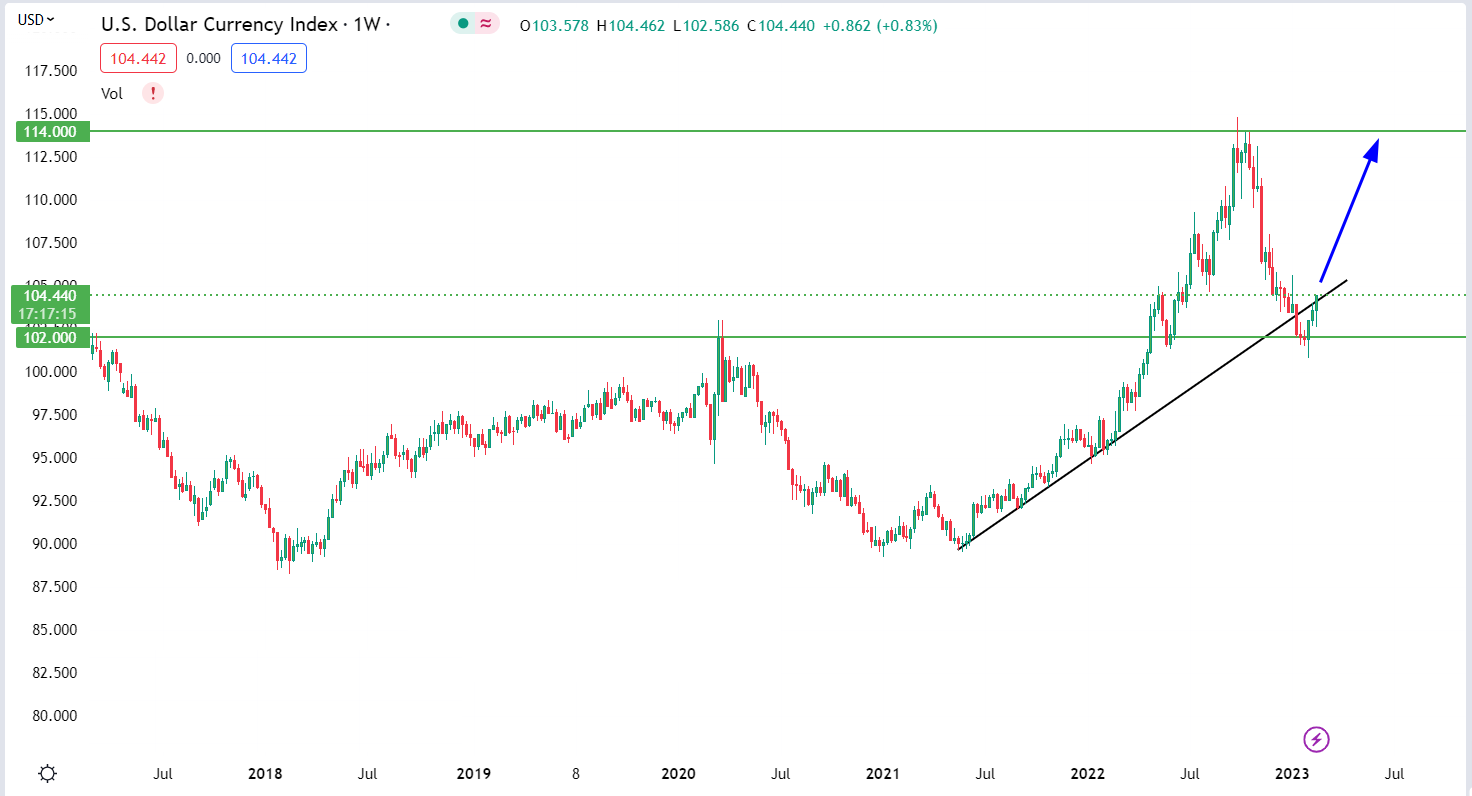
On the weekly timeframe, the US dollar index (DXY) broke above the ascending resistance trendline. Moreover, the price significantly reversed from the support level of 102.00, the 2008- and 2020-year highs. Thus, a combination of these factors confirms that the US dollar is still in a strong uptrend and that the recent decline is just a correction ahead of a massive rally.
The closest target for the US dollar is 114.00, a 9.5% gain. If the index breaks above this resistance, it will move to 120.00, gaining another 5%.
EURUSD, monthly timeframe
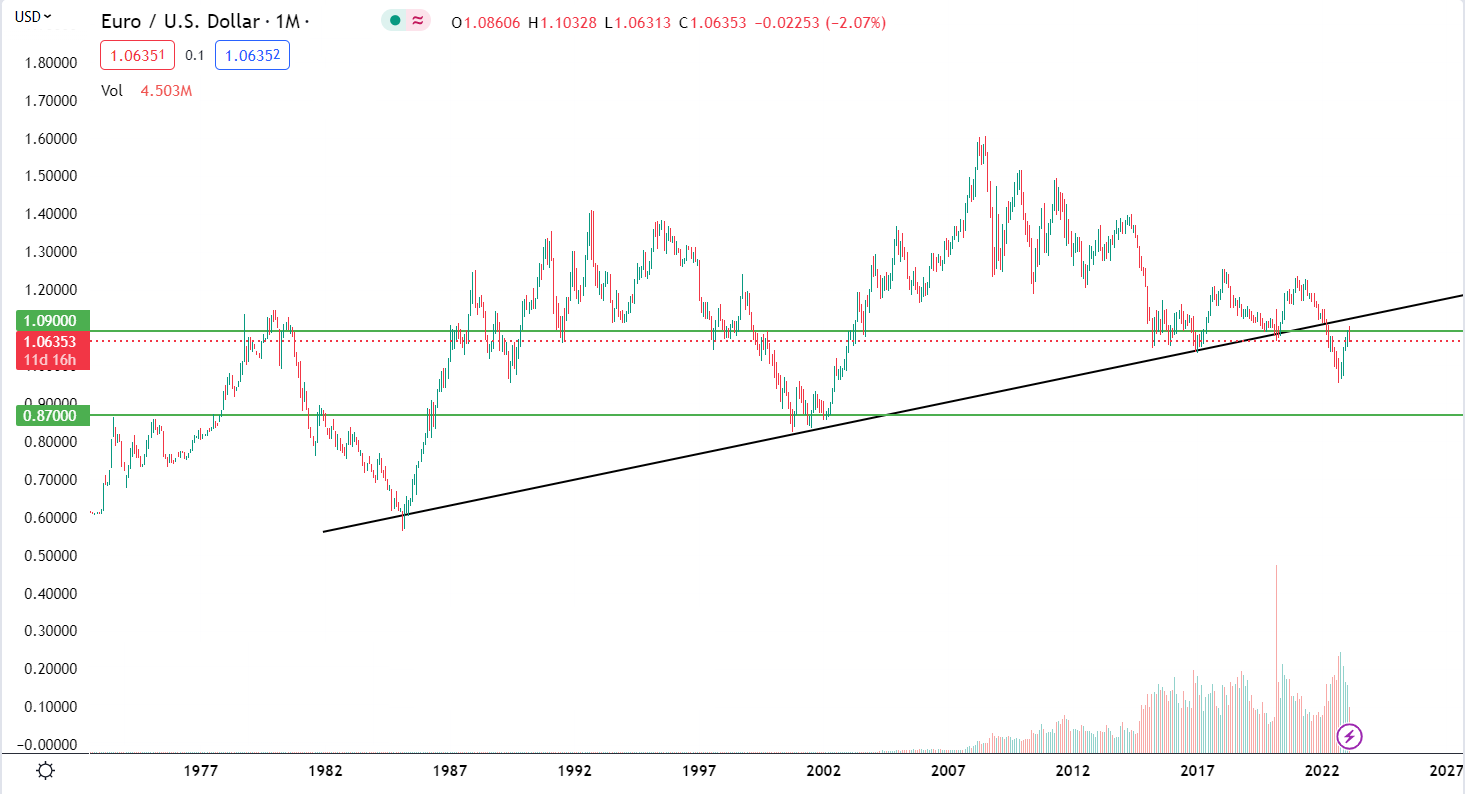
In 2022 the EURUSD broke through a global support trend line stated in March 1985. Recently, the price tested the breakout from below 1.1000 and bounced back. Also, it is noticeable that the pair has been moving in a strong downtrend since 2008. We expect this trend to continue with EURUSD heading toward the 2000s low at 0.8500.
XAUUSD, Weekly timeframe
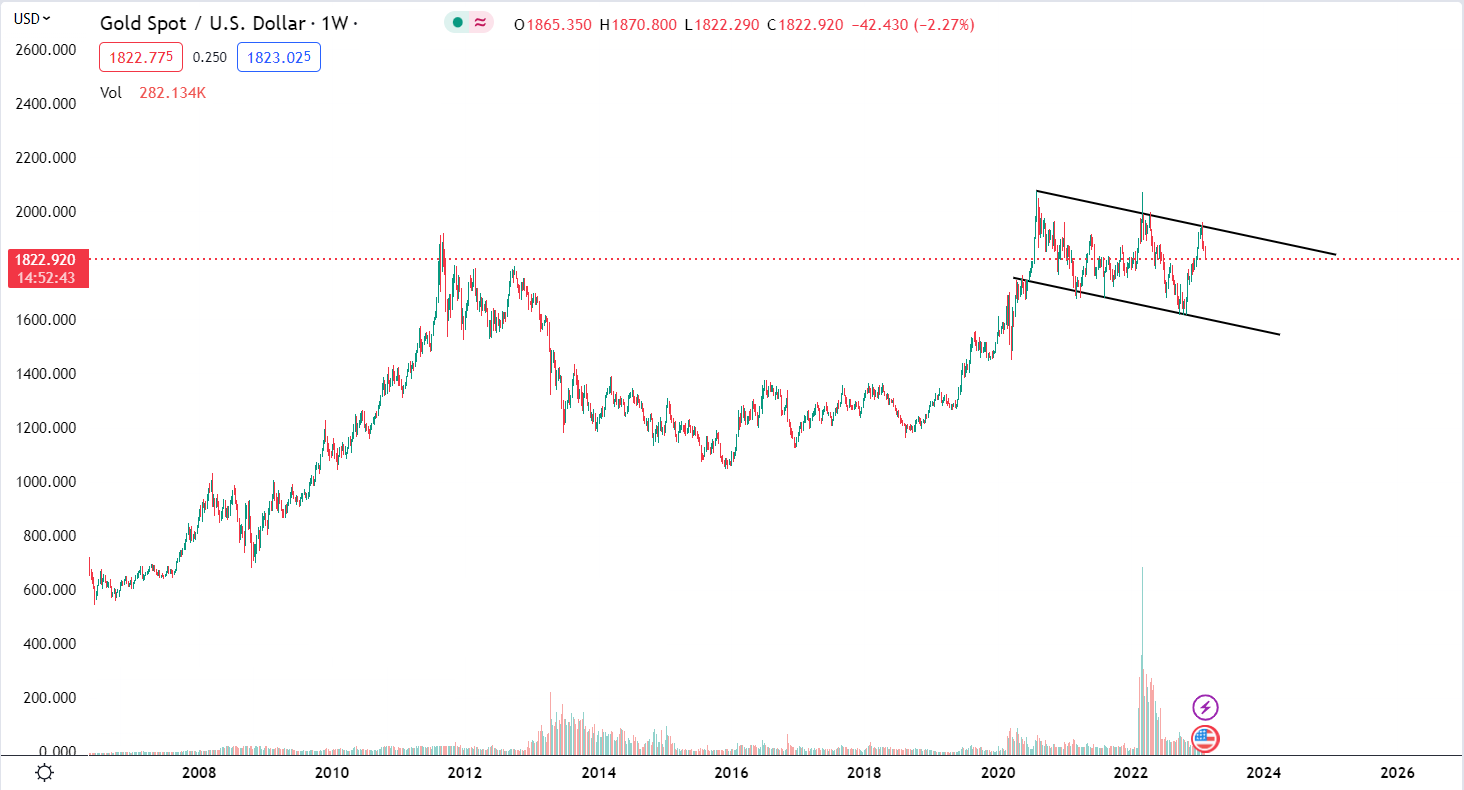
XAUUSD is forming a global “cup and handle” pattern. A breakout of the upper border of the handle will open the way to 2800.00 for the yellow metal. Fundamentally, it might be caused by a global financial crisis or geopolitical conflict.
However, in the short term, the price may decline to the lower border of the handle, which is around 1600.00.
Conclusion
Learning global trends is an essential thing for every trader. After observing macroeconomic numbers and technical analysis of high timeframes, we can conclude that the world is facing a recession. And the only question remains: When will it begin? Usually, the financial crisis begins when the US treasures yield curve returns above 0. Thus, feel free to use this indicator to predict global trends in the future.
Gold Remains Under Pressure; Maintains Short-term Bearish Bias
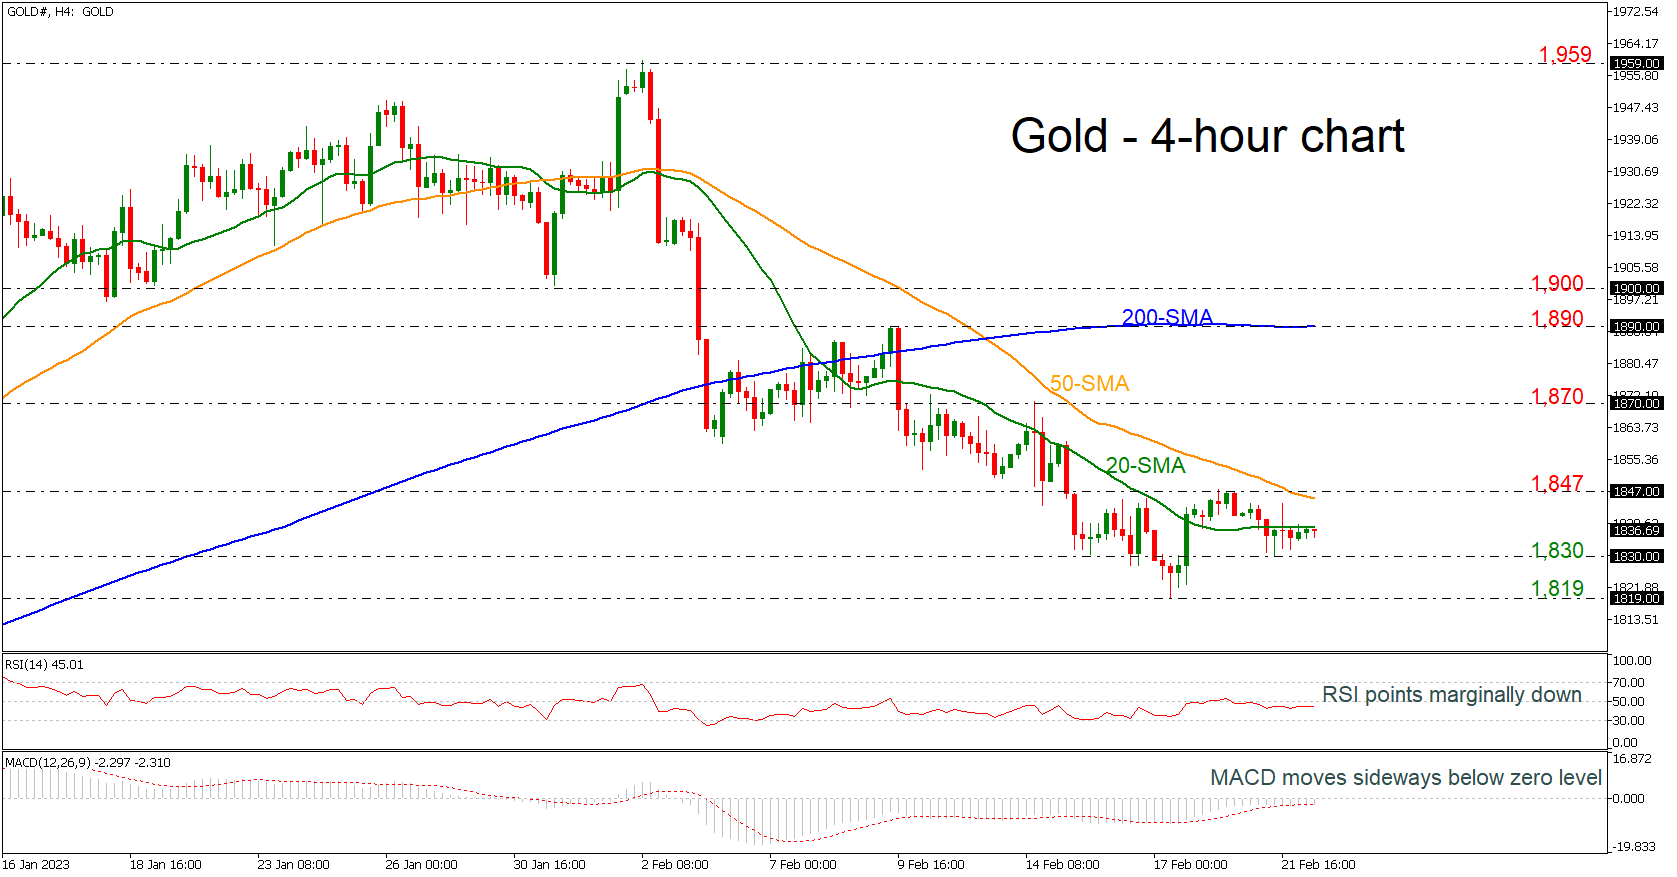
Gold remains under pressure and risk is still to the downside as prices continue to drift lower from the 1,847 key level and the short-term simple moving averages (SMAs). The technical oscillators are looking neutral and point to more weakness in the market. Looking at the 4-hour chart, the RSI is pointing marginally down below the 50 level, while the MACD is moving sideways near the zero level.
The next target to the downside is the 1,830 support level. At this stage, the market would likely see a resumption of the downtrend from the 1,959 peak and overrun the 1,819 mark ahead of the 1,800 low, registered in December 2022.
Upside moves are likely to find resistance at the 50-period SMA near 1,847 before hitting the 1,870 barrier. There is an important resistance zone between 1,890 and 1,900, which encapsulates the 200-period SMA.
In the short term, the bearish phase remains in play especially if gold prices continue to trade below the SMAs and only a jump above the 200-period SMA may change the outlook to positive.
FTSE 100 Consolidates
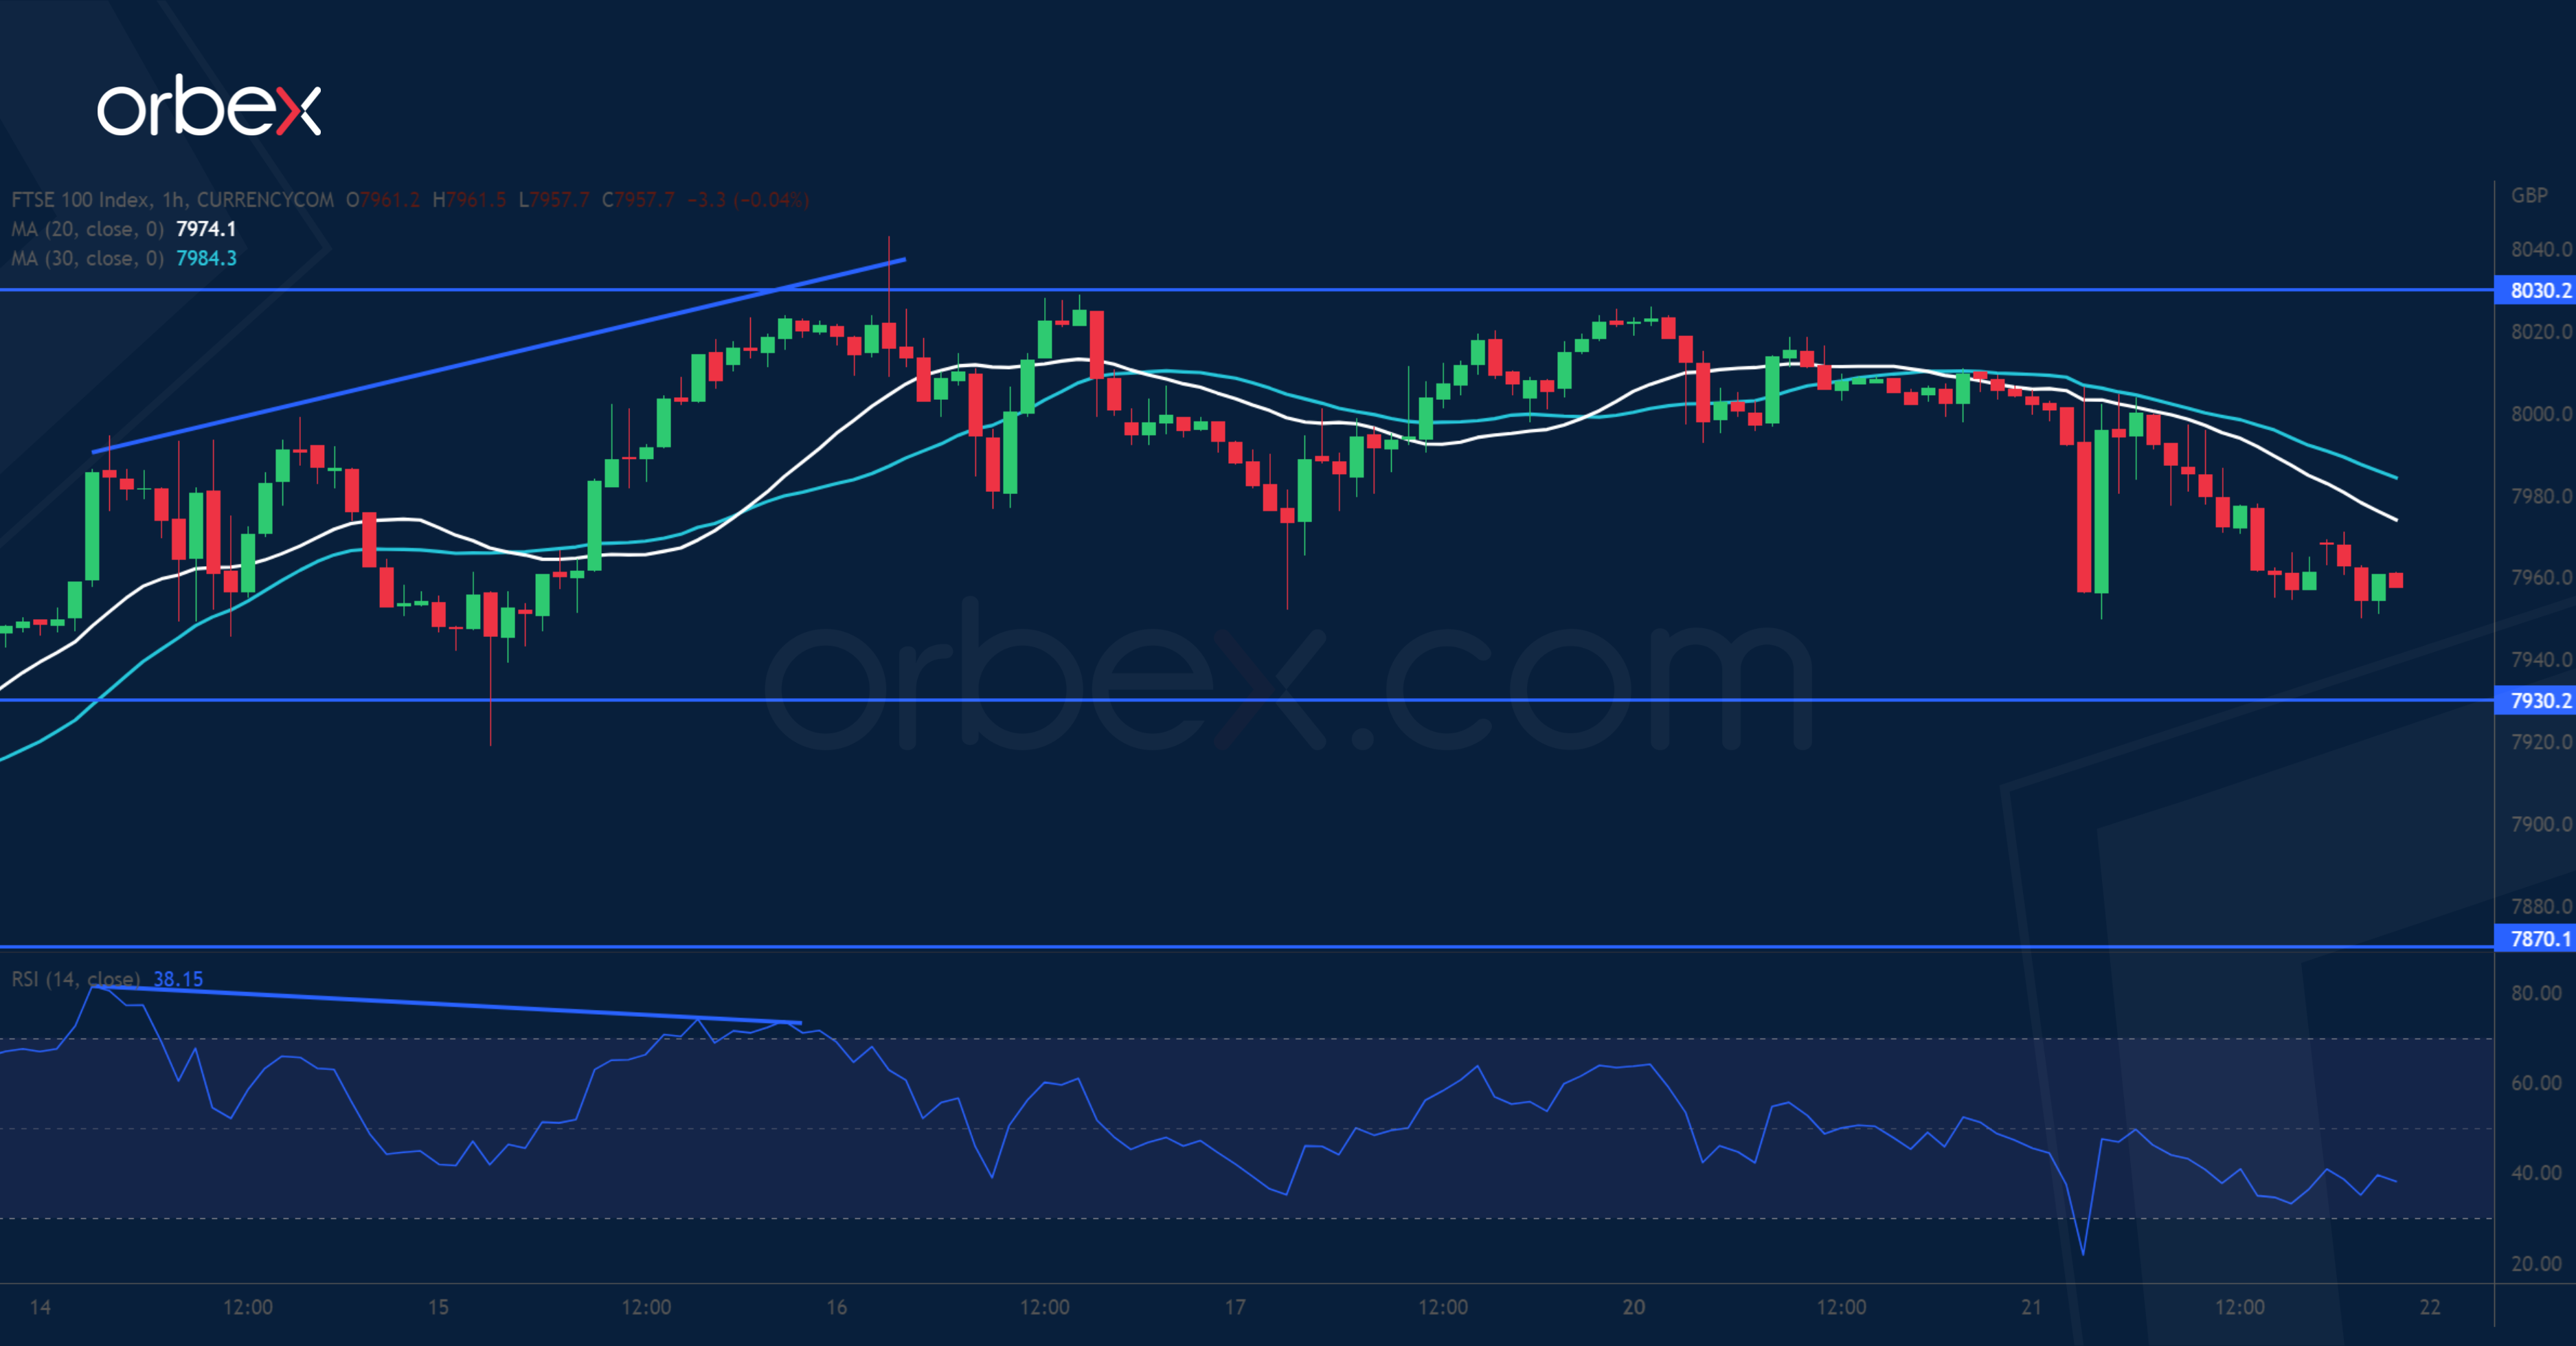
The FTSE 100 turns lower on fears of more rate hikes by the BoE. On the daily chart, the RSI’s overbought condition indicates overextension though there is no confirmation of a fallback yet. A bearish RSI divergence on the hourly chart shows a deceleration. 7930 is the immediate support and its beach may corroborate the observation in these time frames. Then 7870 on the 30-day SMA would be a key level to gauge the strength of follow-up interests. On the upside, a close back above 8030 would resume the uptrend.
USD/CAD Bounces Higher
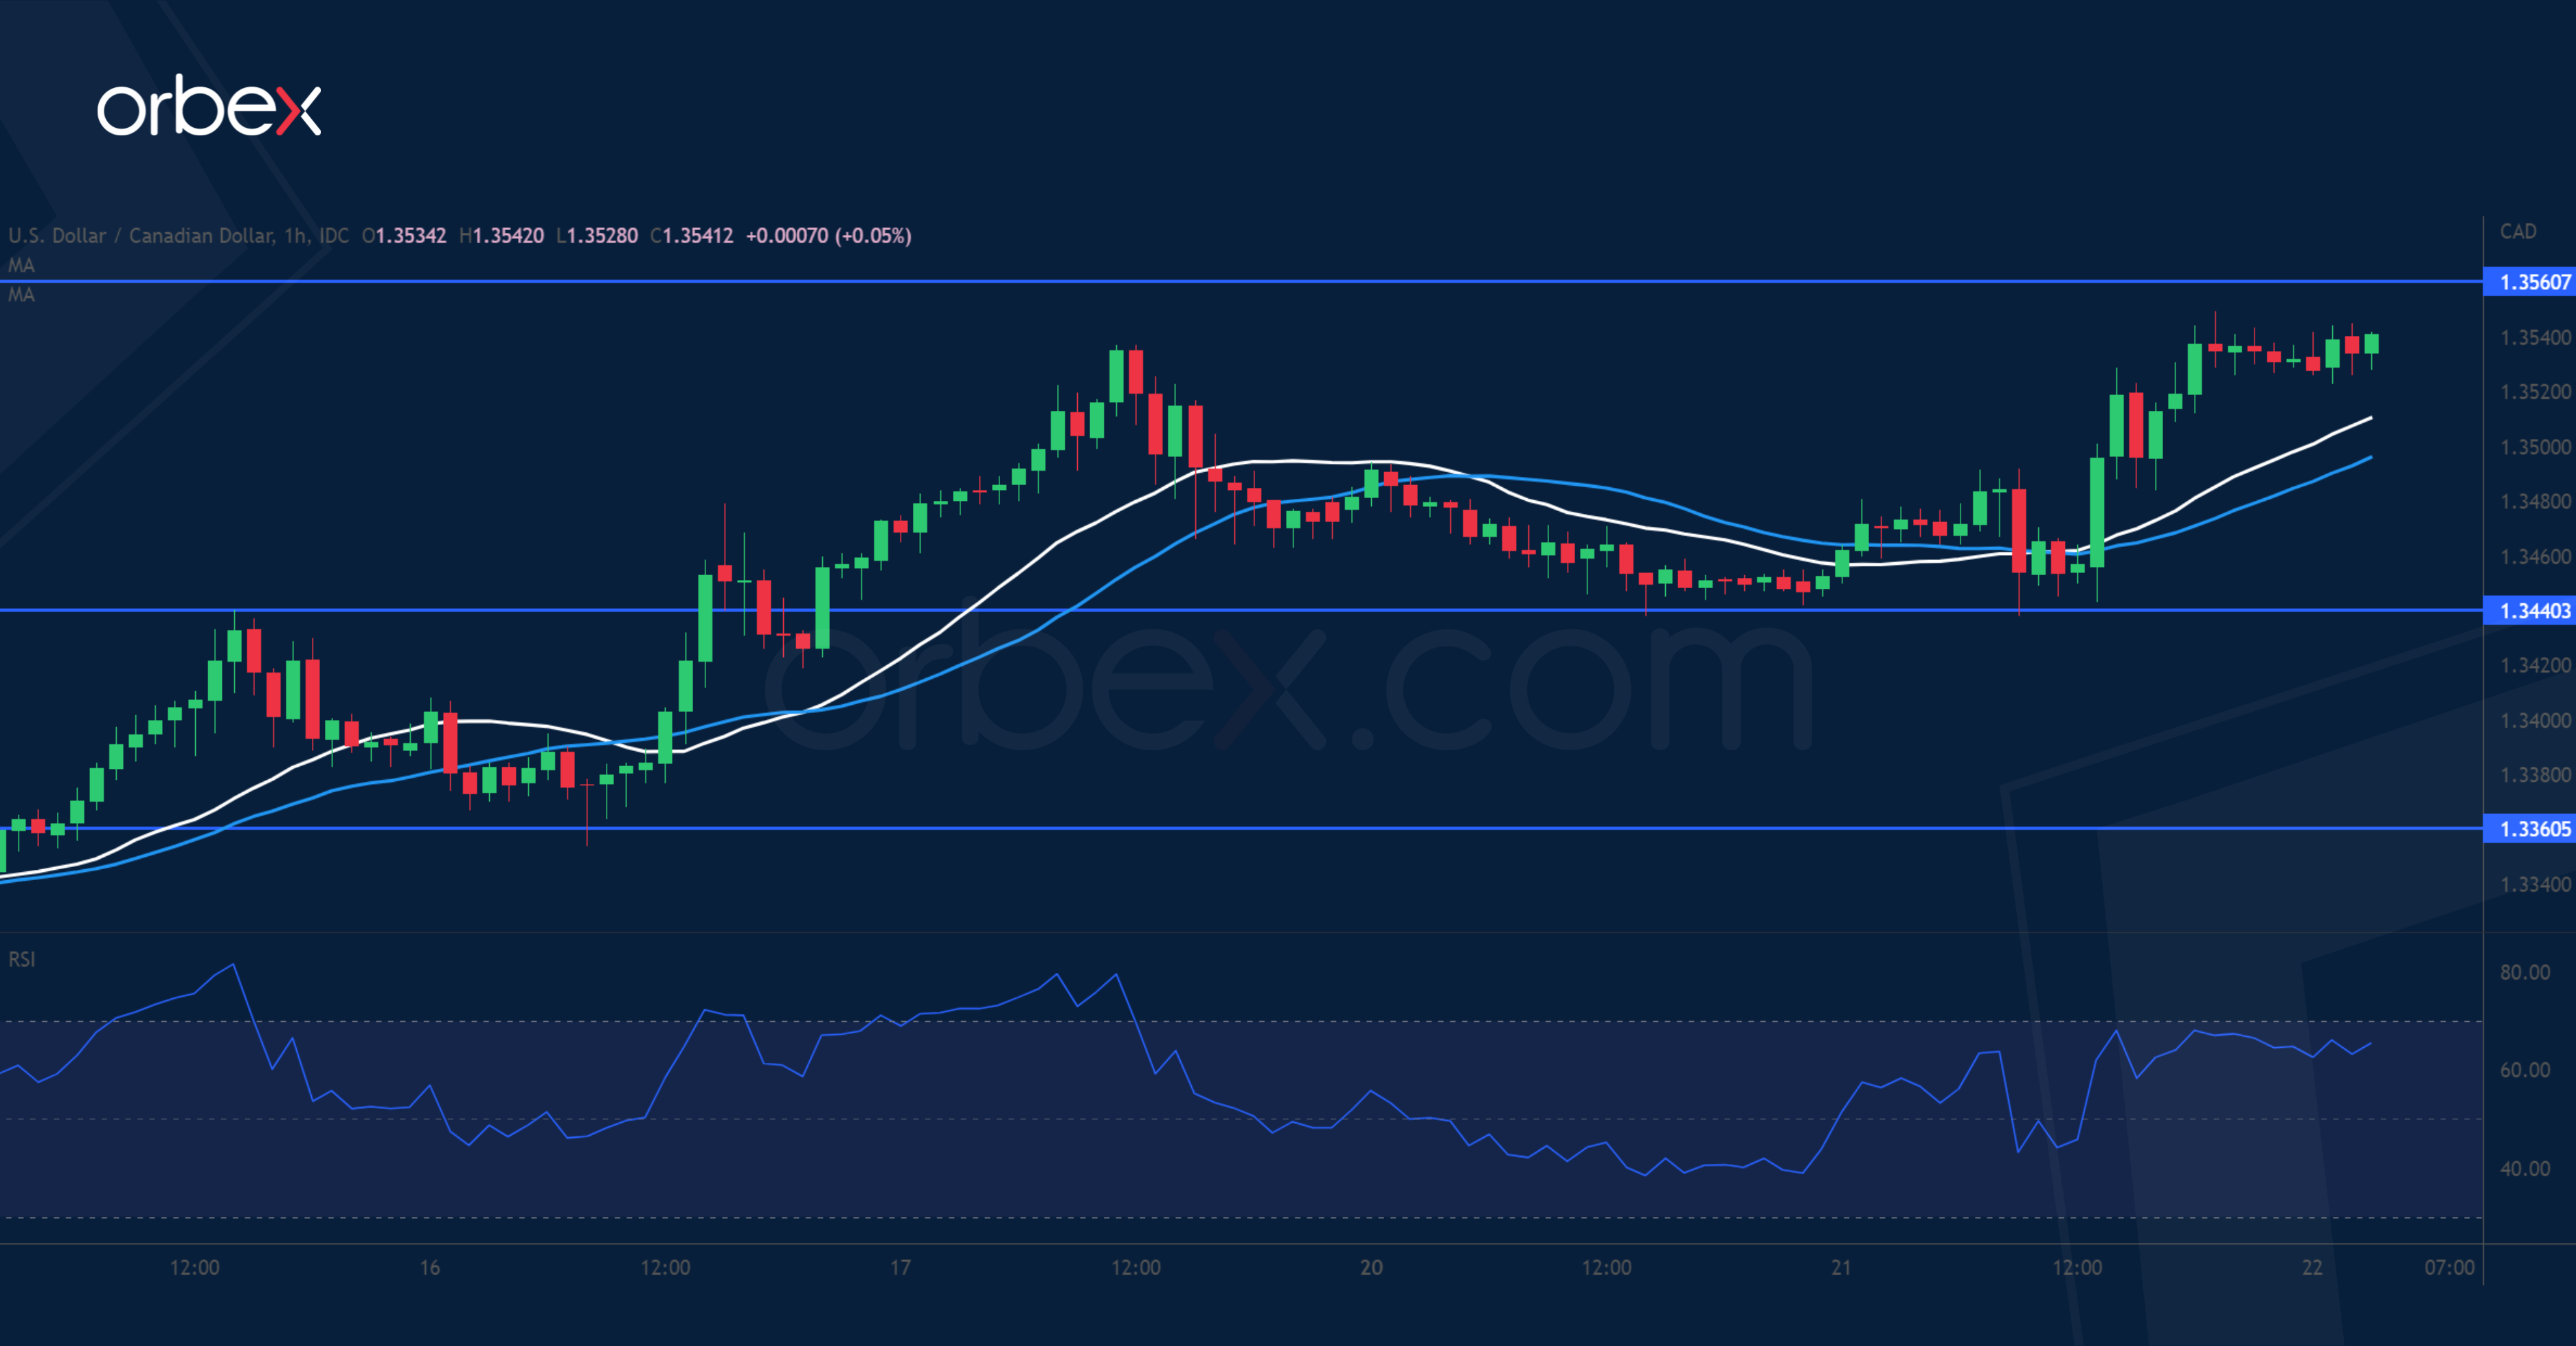
The Canadian dollar tanked as easing inflation may keep the BoC at bay. A break above the supply zone 1.3470-1.3510 has helped the bulls regain control of the direction. A series of higher highs is a sign of mounting buying pressure and so far buyers have seen pullbacks as opportunities to stake in. 1.3440 is a fresh support and 1.3360 is an important level to keep the upward bias intact. Some resistance could be felt near the previously failed support at 1.3560 before the rally could extend to the daily resistance of 1.3660.
EUR/USD Drifts Lower
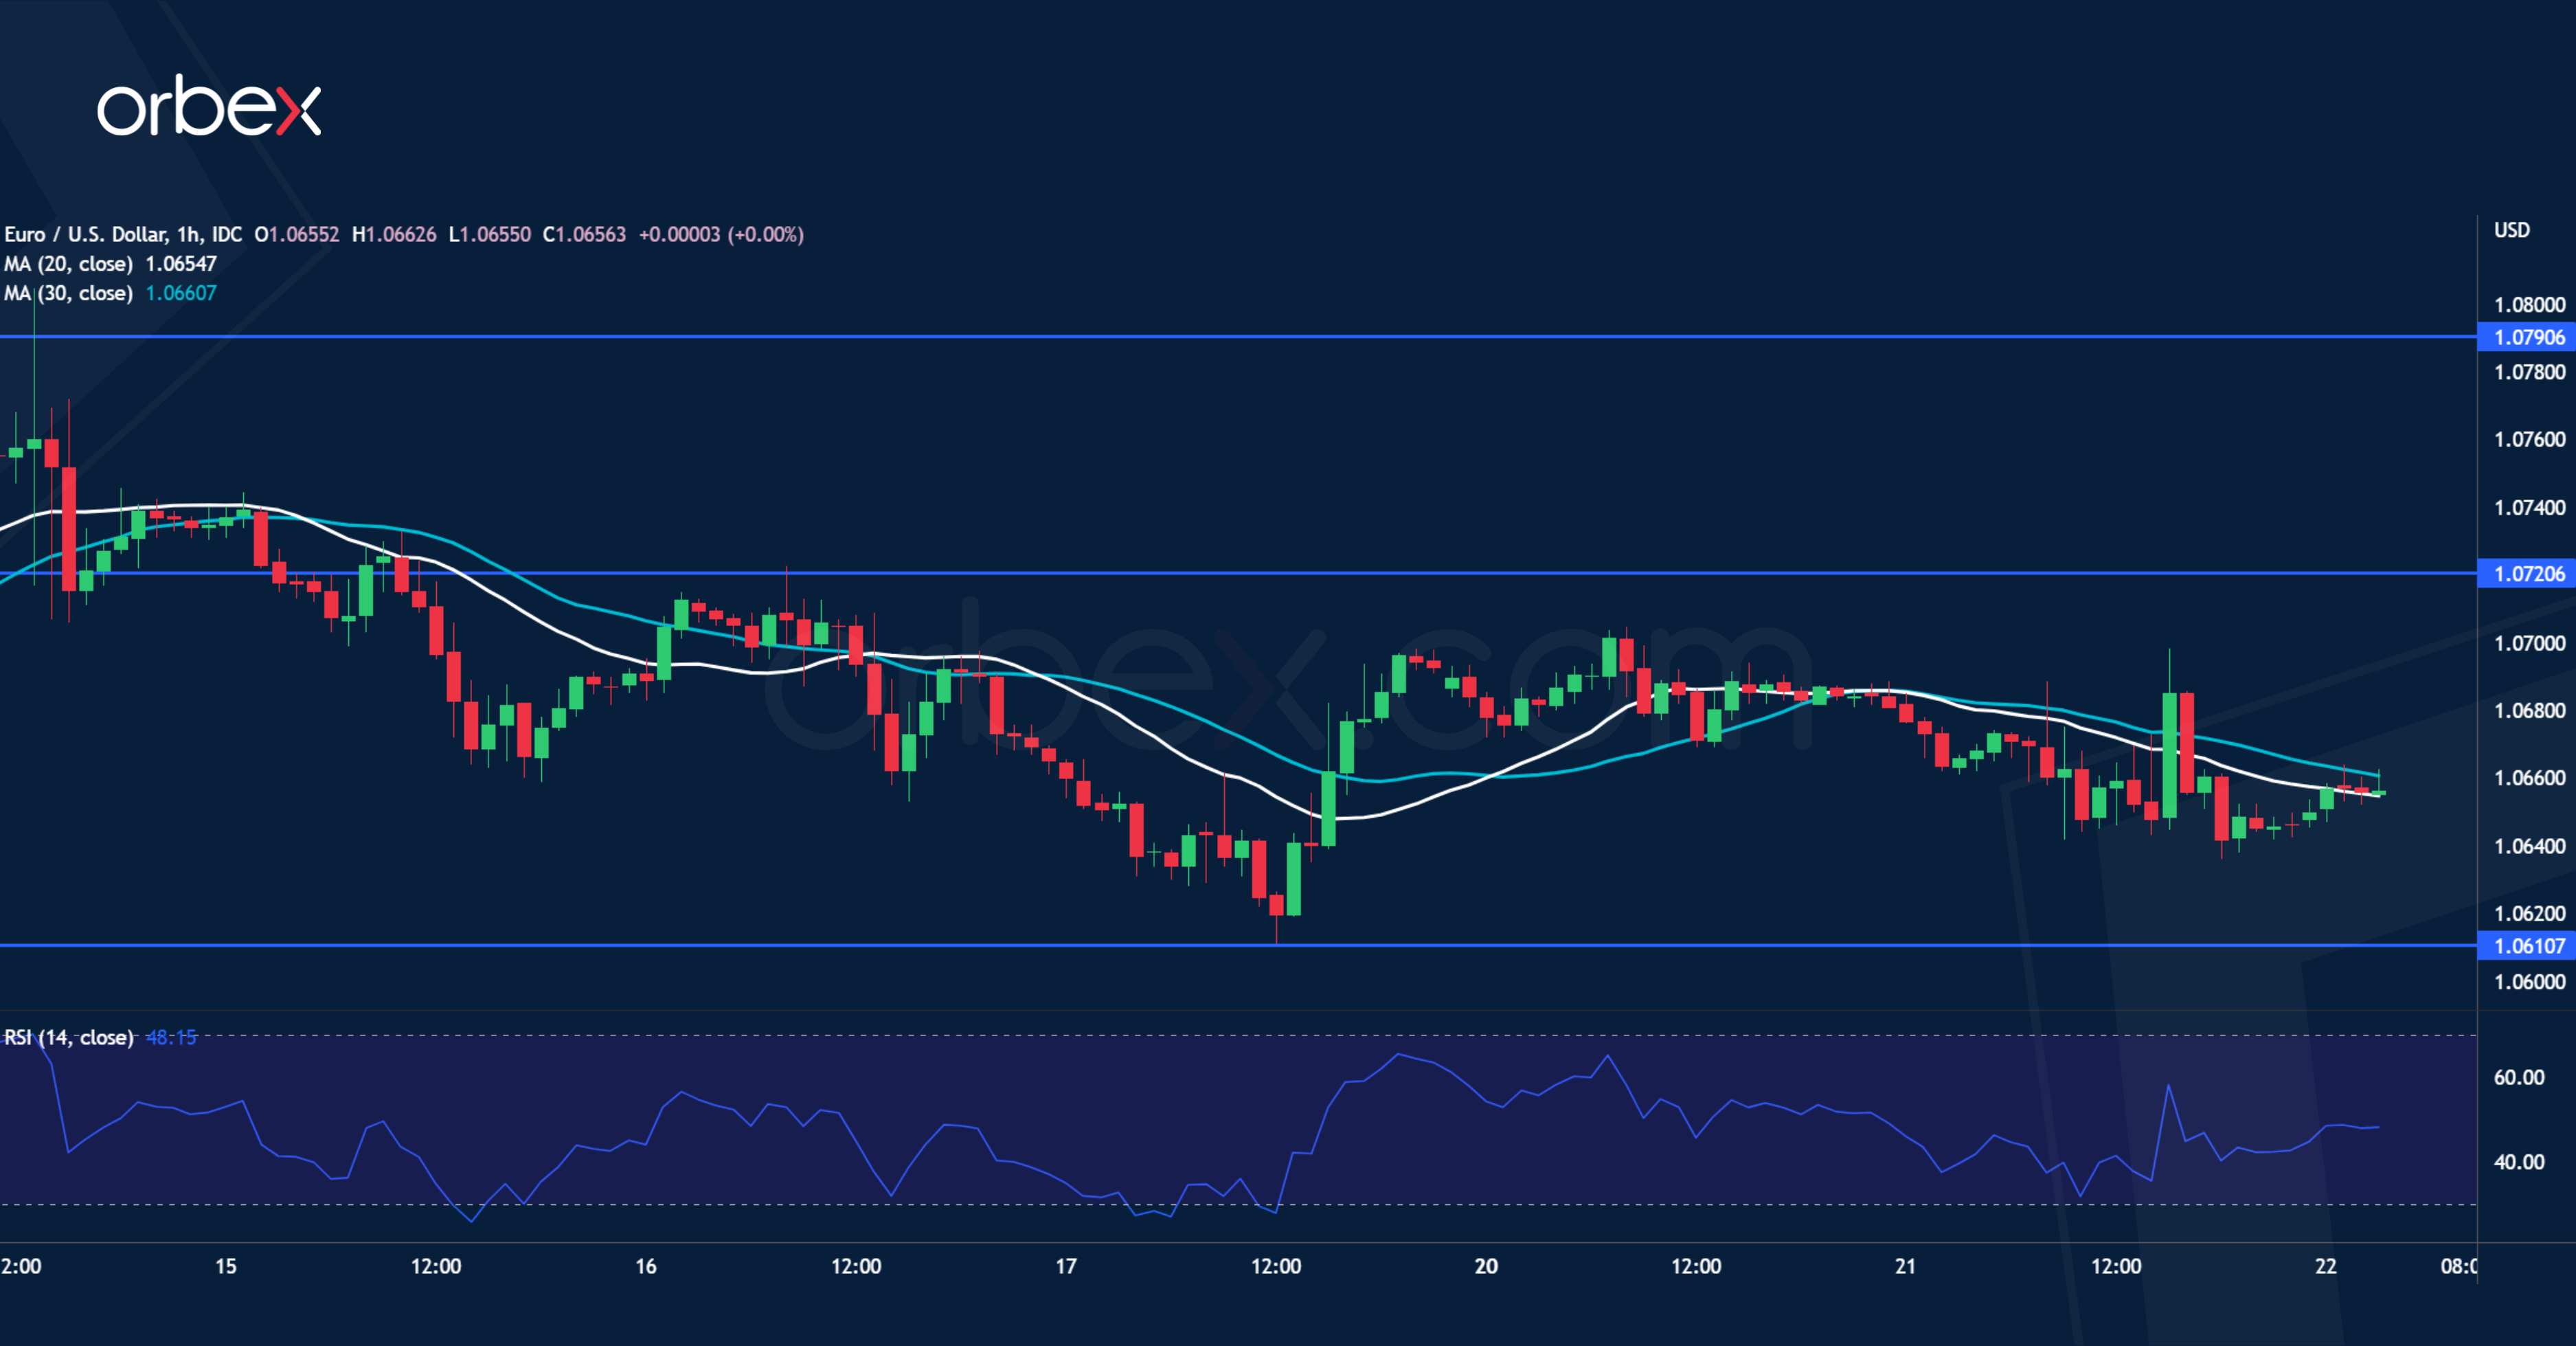
The US dollar extended gains helped by upbeat PMIs in February. On the daily chart, a bearish MA cross after the price pierced the moving averages suggests that a correction is due after a three-month long rally. The pair is grinding the demand zone around 1.0610 from last January’s bullish breakout. 1.0720 is the closest hurdle and only a clean break above 1.0790, a twice-tested resistance, would turn short-term sentiment around. Failing that, the single currency could sink towards the critical floor at 1.0500.
Outcome of Fed March Meeting Becoming Fat-Tailed Towards a Possible 50 bps Rate Hike
Markets
US Treasuries went into full sell-off mode again yesterday following February US PMI’s. The composite PMI returned above the 50 boom/bust mark again for the first time since June 2022, surging from 46.8 to 50.2 (vs 47.5 consensus). The spike came on account of a similar move in the services gauge while the manufacturing PMI’s improvement was way more modest (47.8 from 46.9). Despite headwinds from higher interest rates and the cost of living squeeze, the business mood has brightened amid signs that headline inflation has peaked and recession risks have faded. At the same time, supply constraints have alleviated to the extent that delivery times for inputs into factories are improving at a rate not seen since 2009. However, the survey data underscore how the upward driving force on inflation has now shifted to wages amid the tight labor market. A potential wage-price spiral could accelerate service sector price growth, one of the specific items the Fed is following closely. PMI’s can be added to this month’s list of stellar payrolls, stubborn CPI, strong retail sales and hawkish Fed comments. All of which triggered a fierce, and ongoing, repositioning in US money markets. The outcome of the March meeting is becoming fat-tailed towards a possible 50 bps rate hike. Tonight’s FOMC Minutes will give an indication on how big last week’s dissent in favour of such move already in February was. Fed Bullard and Mester already revealed being part of this (outdated?) minority view. After US close, heavyweight NY Fed governor Williams (more moderate profile within FOMC) discusses the inflation outlook. Indications that inflation won’t come down as easily as hoped, won’t go unnoticed. US yields ended yesterday’s session 10 to 15 bps higher with the belly of the curve underperforming the wings. The US 2-yr yield came an inch away of setting a new cycle top (4.73% intraday high). The US 5-yr yield (4.15%) builds on last week’s break above 4.04% resistance which paves the way to the 2022 top around 4.5%. The US 10-yr yield is currently breaking above similar resistance (3.9%) which - if confirmed - opens the path to 4.33%. Yesterday’s bond sell-off spilled to stock markets in an echo to market correlation in the first 9 months of last year. US stock markets lost 2% to 2.5%. The dollar’s performance could have been better in this context (yield advantage & risk-off). EUR/USD closed only marginally weaker at 1.0648. Just as for the stock market, we think it is only a matter of time before the pair cracks as US money markets gradually embrace the 50 bps hike scenario in March. Support kicks in at 1.0484/66 (2023 low/38% retracement on September/February comeback). Sterling profited from rising UK yields (2-y +17 bps) after strong PMI’s suggested that also the Bank of England has more ground to cover in its normalisation cycle. EUR/GBP is testing first support around 0.88. EUR/GBP 0.8722 will be a tough nut to crack.
News and views
The Reserve Bank of New Zealand today raised its policy rate (OCR) by 50 bps to 4.75%. The Committee agreed that the OCR still needs to increase, as indicated in the November Statement, to ensure inflation returns to within its target range over the medium term. (Core) consumer price inflation remains too high, employment is still beyond its maximum sustainable level and near-term inflation expectations remain elevated. There are early signs that demand is easing but it continues to outpace supply as reflected in strong domestic inflation (7.2% headline). The RBNZ expects that inflation will stay high in the near term and is likely only to begin decline significantly from the second half of 2023. The central bank indicated that it is too early to accurately assess the monetary policy implications of recent disrupting weather events. In its monetary policy statement the RBNZ still sees the peak in the OCR at 5.5% toward the end of this year. The hawkish tone from the RBNZ communication caused the 2-y government bond yield to rise 10 bps. The kiwi dollar jumped from NZD/USD 0.621 to 0.06245, but gains eased on broader USD strength.
The Australian Bureau of Statistics released data showing wages in the country rising by 0.8% Q/Q to be up 3.3.% Y/Y. (from 1.1% and 3.2% in Q3). While the 3.3% yearly pay growth was the highest since Q4 2021, markets still expected a bigger increase to about 3.5%. The Q4 pay growth was also slightly lower than the expectations of the Reserve bank of Australia. After taking a softer stance end last year, the RBA recently indicated that it will have to raise rates further to bring inflation back to target. However, softer-than-expected wages this morning triggered a correction on the recent rise in yields. After touching a new cycle top at 3.69%, the 2-y government bond yield dropped back to 3.57%. The Aussie dollar also loses further ground trading at around AUD/USD 0.6835.
Poor Appetite ahead of FOMC Minutes
US stocks now join the treasury selloff, and the US dollar pushes higher on the back of the increasingly hawkish Federal Reserve (Fed) bets.
The US 2-year yield was again above the 3.70% mark, whereas the 10-year yield flirted with the 4% for the first time since last November.
The preliminary services PMI in the US came in better than expected for February, and the services PMI ticked above the 50 mark, into the contraction zone, for the first time since last July.
The strong economic data further fueled the Fed hawks. But this time, the stocks sold off as well, despite the strong economic data. The weak outlook from Walmart and Home Depot left the no-landing bets under the dark shadow of higher US yields.
The S&P500 dived 2% on Tuesday, below the minor 23.6% Fibonacci retracement on the latest October to February rally, and below the 4000 psychological mark.
Nasdaq 100 slipped 2.41% and closed the day a few points above the major 38.2% retracement. Falling below this level will send the index into the bearish consolidation zone.
Today, the FOMC minutes will be closely watched. We know that the Fed officials will sound concerned with the strong jobs market and will point at the resilience of the economy to continue hiking the rates.
So, the chances are that the minutes will be hawkish, and could further weigh on sentiment. But there is always a chance that the market sees the glass half full than half empty.
But the negative correlation between stocks and bonds, after stocks rallied and bonds fell – the exact opposite of what we have predicted at the start of the year – may be coming to an end, as in the absence of recession talk, the Fed expectations will continue driving markets, and the increasingly hawkish Fed expectations are bad for both stock and bond valuations.
Fed hawks are supportive of the US dollar, however. The dollar index is now testing two important technical resistances to the upside: the minor 23.6% retracement on the end of September to the beginning of February retreat – which gave that much-needed space to breath to other currencies, and the 2021-2022 bullish trend.
It’s still early to talk about a medium term bearish reversal.
The EURUSD, for example, has been under pressure since the beginning of February, but the major 38.2% Fibonacci retracement, which would call the end of the positive trend is still a way to go. It stands a touch below the 1.05 mark. But of course, we know that the Fed can go much further than expectations. Speaking of rate hikes, the Reserve Bank of New Zealand (RBNZ) hiked its interest rates by 50bp today, after a three-month break. The bank warned that Cyclone Gabrielle could lead to higher inflation and output disruptions in the near term and that rebuilding work will boost activity in coming years, which is also bad for inflation.
The RBNZ decision gave a boost to the kiwi today. Whether the pair could hold ground above the 200-DMA, and above the major 38.2% retracement on the latest rally will depend on the… US dollar appetite, of course.