Sample Category Title
EUR/AUD Daily Outlook
Daily Pivots: (S1) 1.5503; (P) 1.5556; (R1) 1.5601; More...
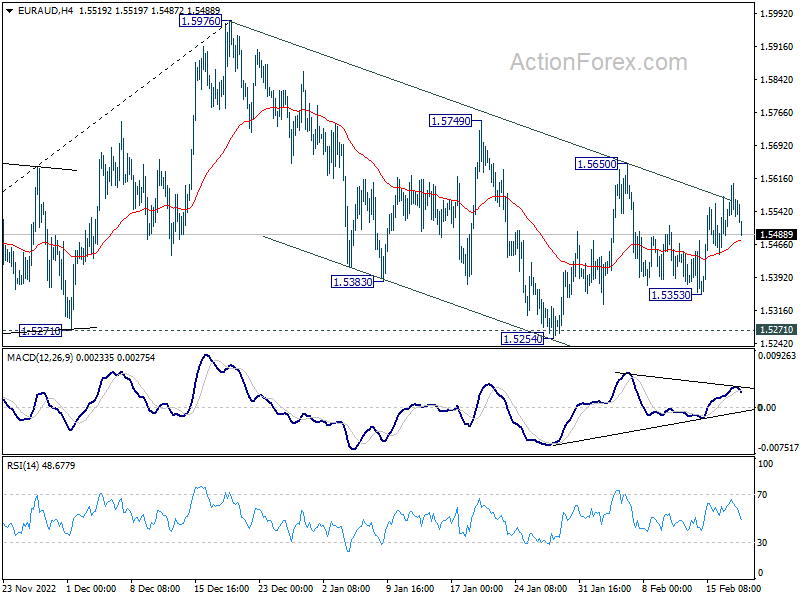
Intraday bias in EUR/AUD stays neutral at this point. On the upside, break of 1.5650 will revive that case that correction from 1.5976 has completed at 1.5254. Intraday bias will be back on the upside for 1.5749 resistance first. On the downside, firm break of 1.5254/71 will carry larger bearish implication and resume the fall from 1.5976.
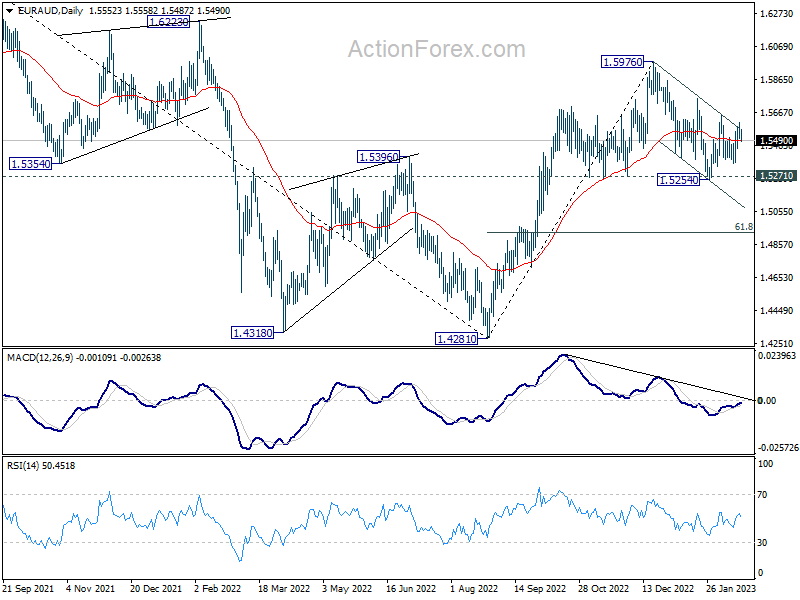
In the bigger picture, it's still early to confirm if rise from 1.4281 represents bullish trend reversal. But as long as 1.5271 support holds, such rally is in favor to continue. Break of 1.5976 will target 1.6434 key resistance next. On the other hand, firm break of 1.5271 will retain medium term bearishness instead.
EUR/CHF Daily Outlook
Daily Pivots: (S1) 0.9866; (P) 0.9895; (R1) 0.9914; More....
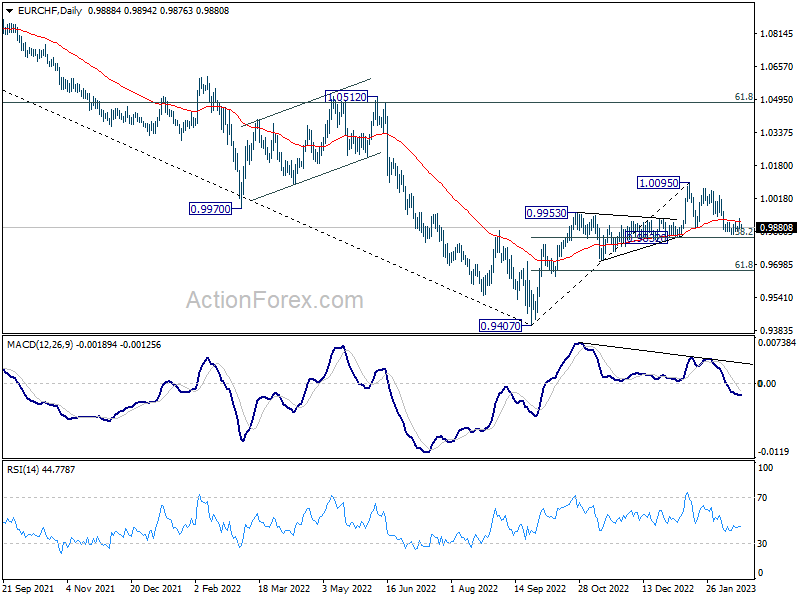
Intraday bias in EUR/CHF remains neutral for the moment. In cas of another fall, downside should be contained by 38.2% retracement of 0.9407 to 1.0095 at 0.9832, to complete the corrective pattern from 1.0095. Break of 0.9923 will turn bias back to the upside for stronger rebound towards 1.0067/0095 resistance zone.
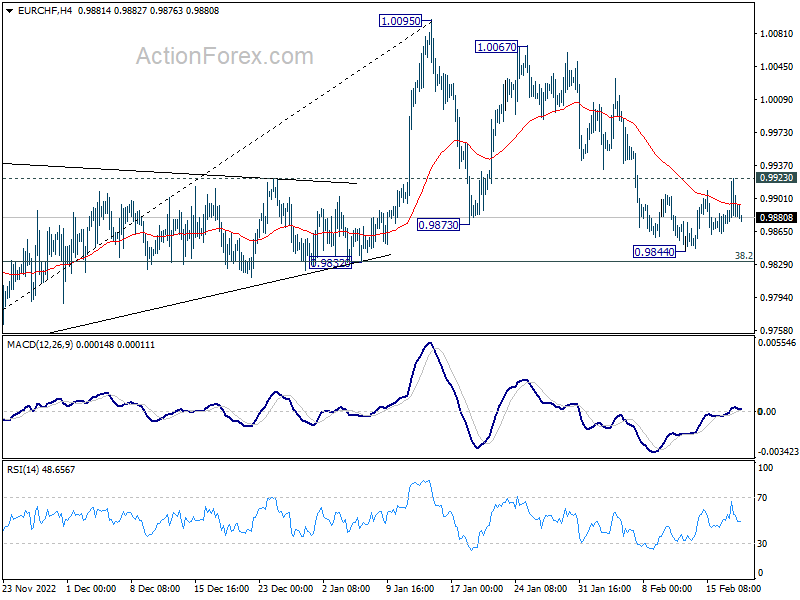
In the bigger picture, the rejection by 55 week EMA (now at 1.0025) mixed up the outlook. On the upside, sustained trading above 55 week EMA will raise the chance of bullish trend reversal. Rise from 0.9407 should then target 1.0505 cluster resistance (2020 low at 1.0505, 61.8% retracement of 1.1149 to 0.9407 at 1.1484). However, firm break of 0.9832 support will revive medium term bearishness and bring retest of 0.9407 low instead.
Technical Outlook and Review
USD/JPY:
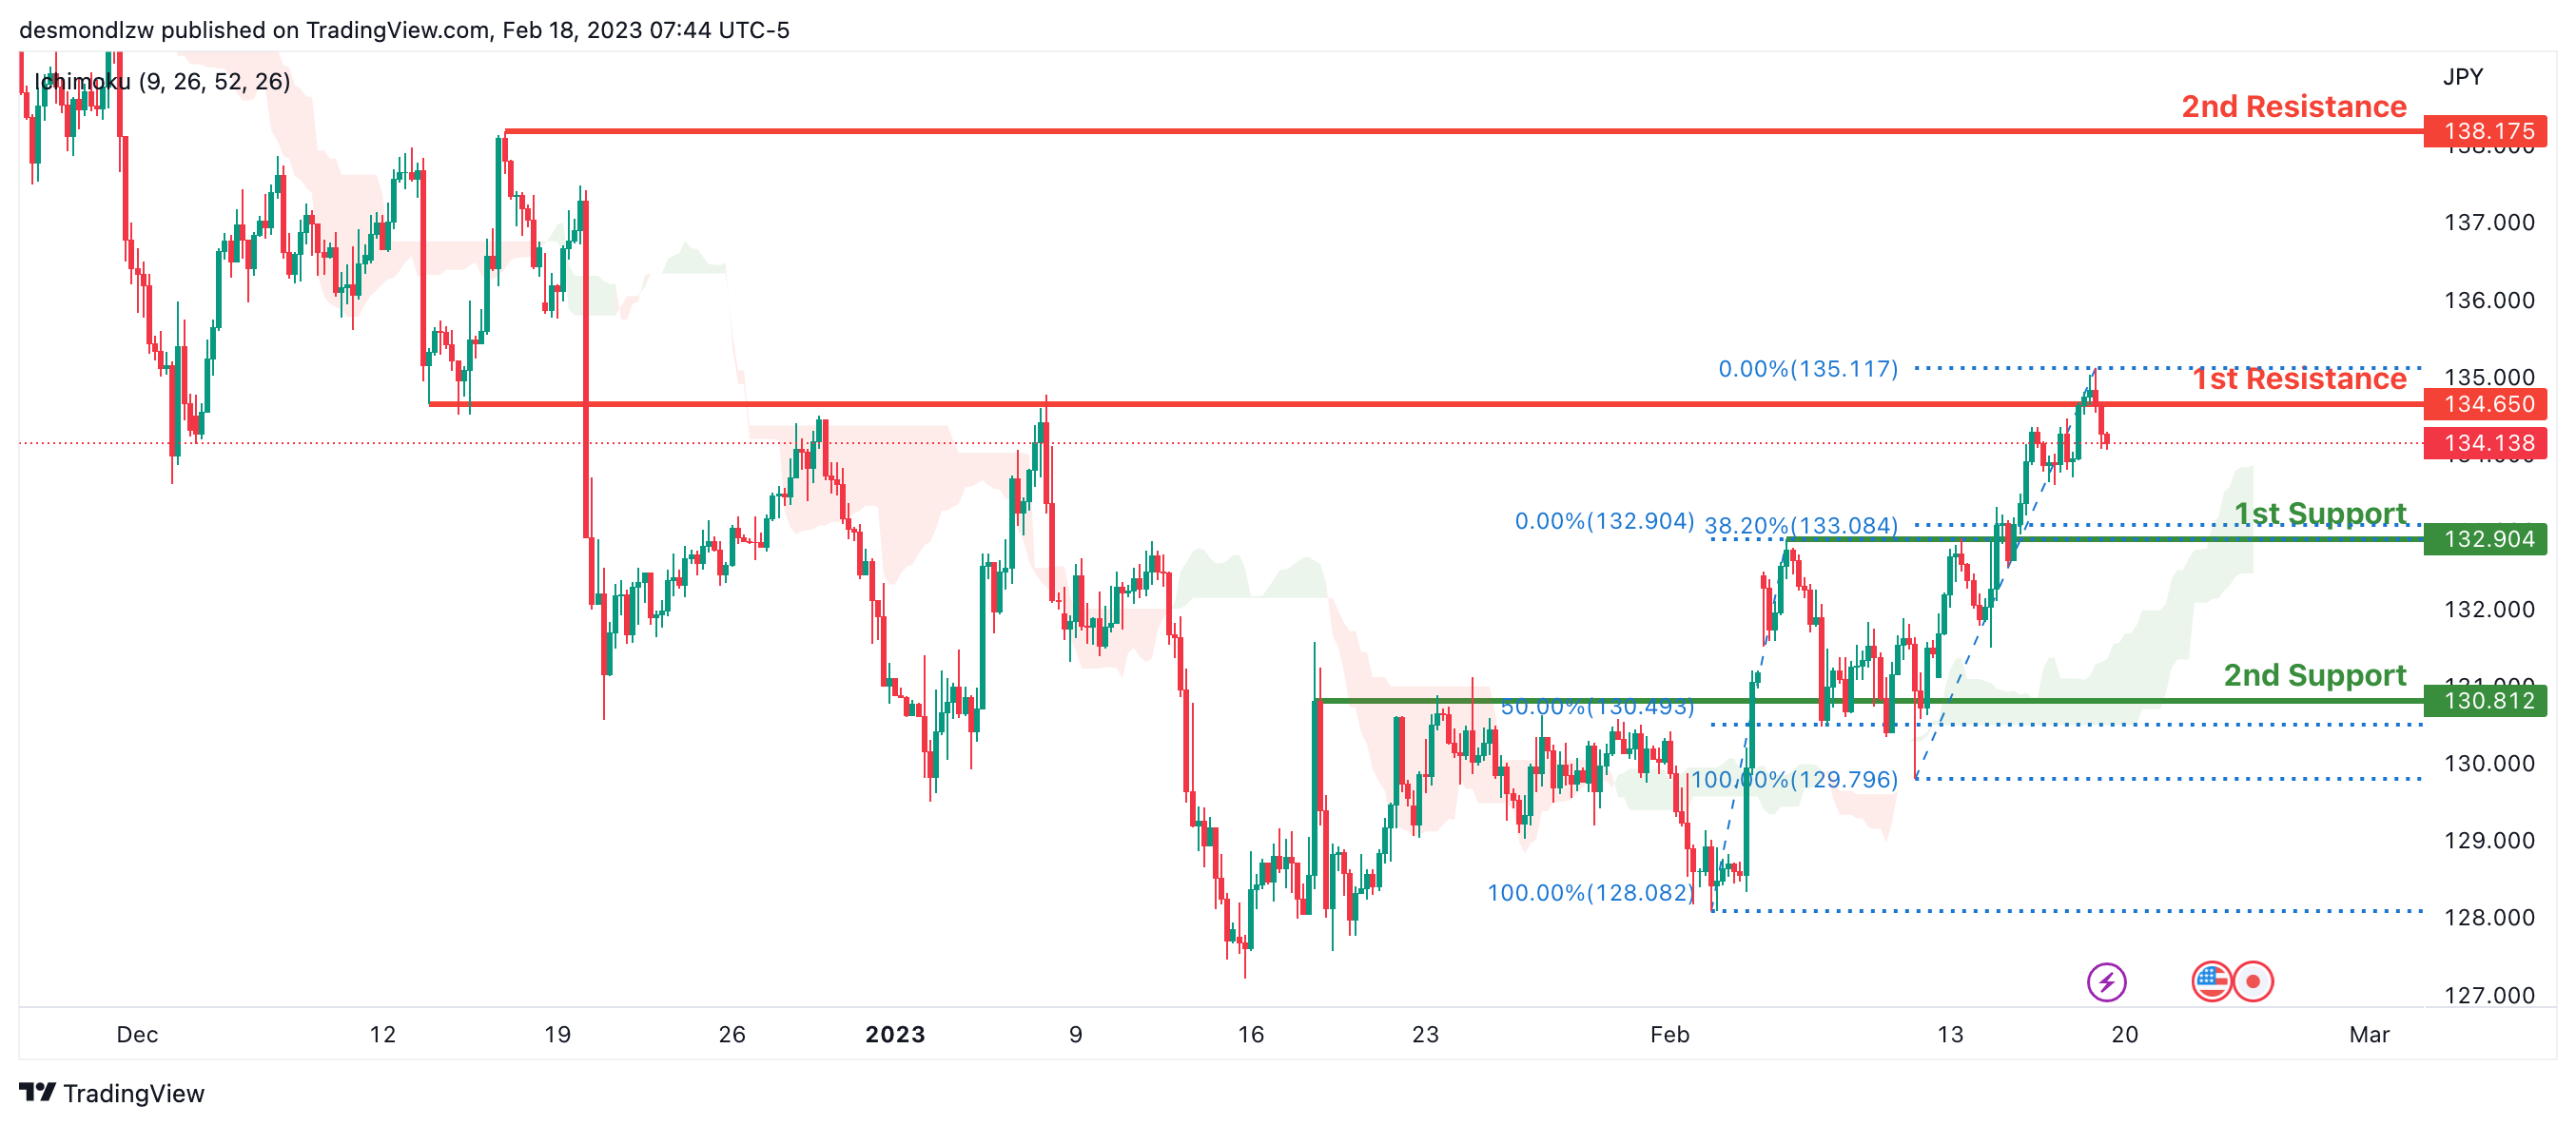
Looking at the H4 chart, my overall bias for USDJPY is bullish due to the current price being above the Ichimoku cloud, indicating a bullish market. If this bullish momentum continues, expect the price to possibly break the 1st resistance at 134.650, where the overlap resistance is before heading towards the 2nd resistance at 138.175, where the previous swing high is.
In an alternate scenario, price could possibly head back down to retest the 1st support at 132.904, where the overlap support and 38.2% Fibonacci line is.
Areas of consideration:
- H4 time frame, 1st resistance at 134.650
- H4 time frame, 2nd resistance at 138.175
- H4 time frame, 1st support at 132.904
DXY:
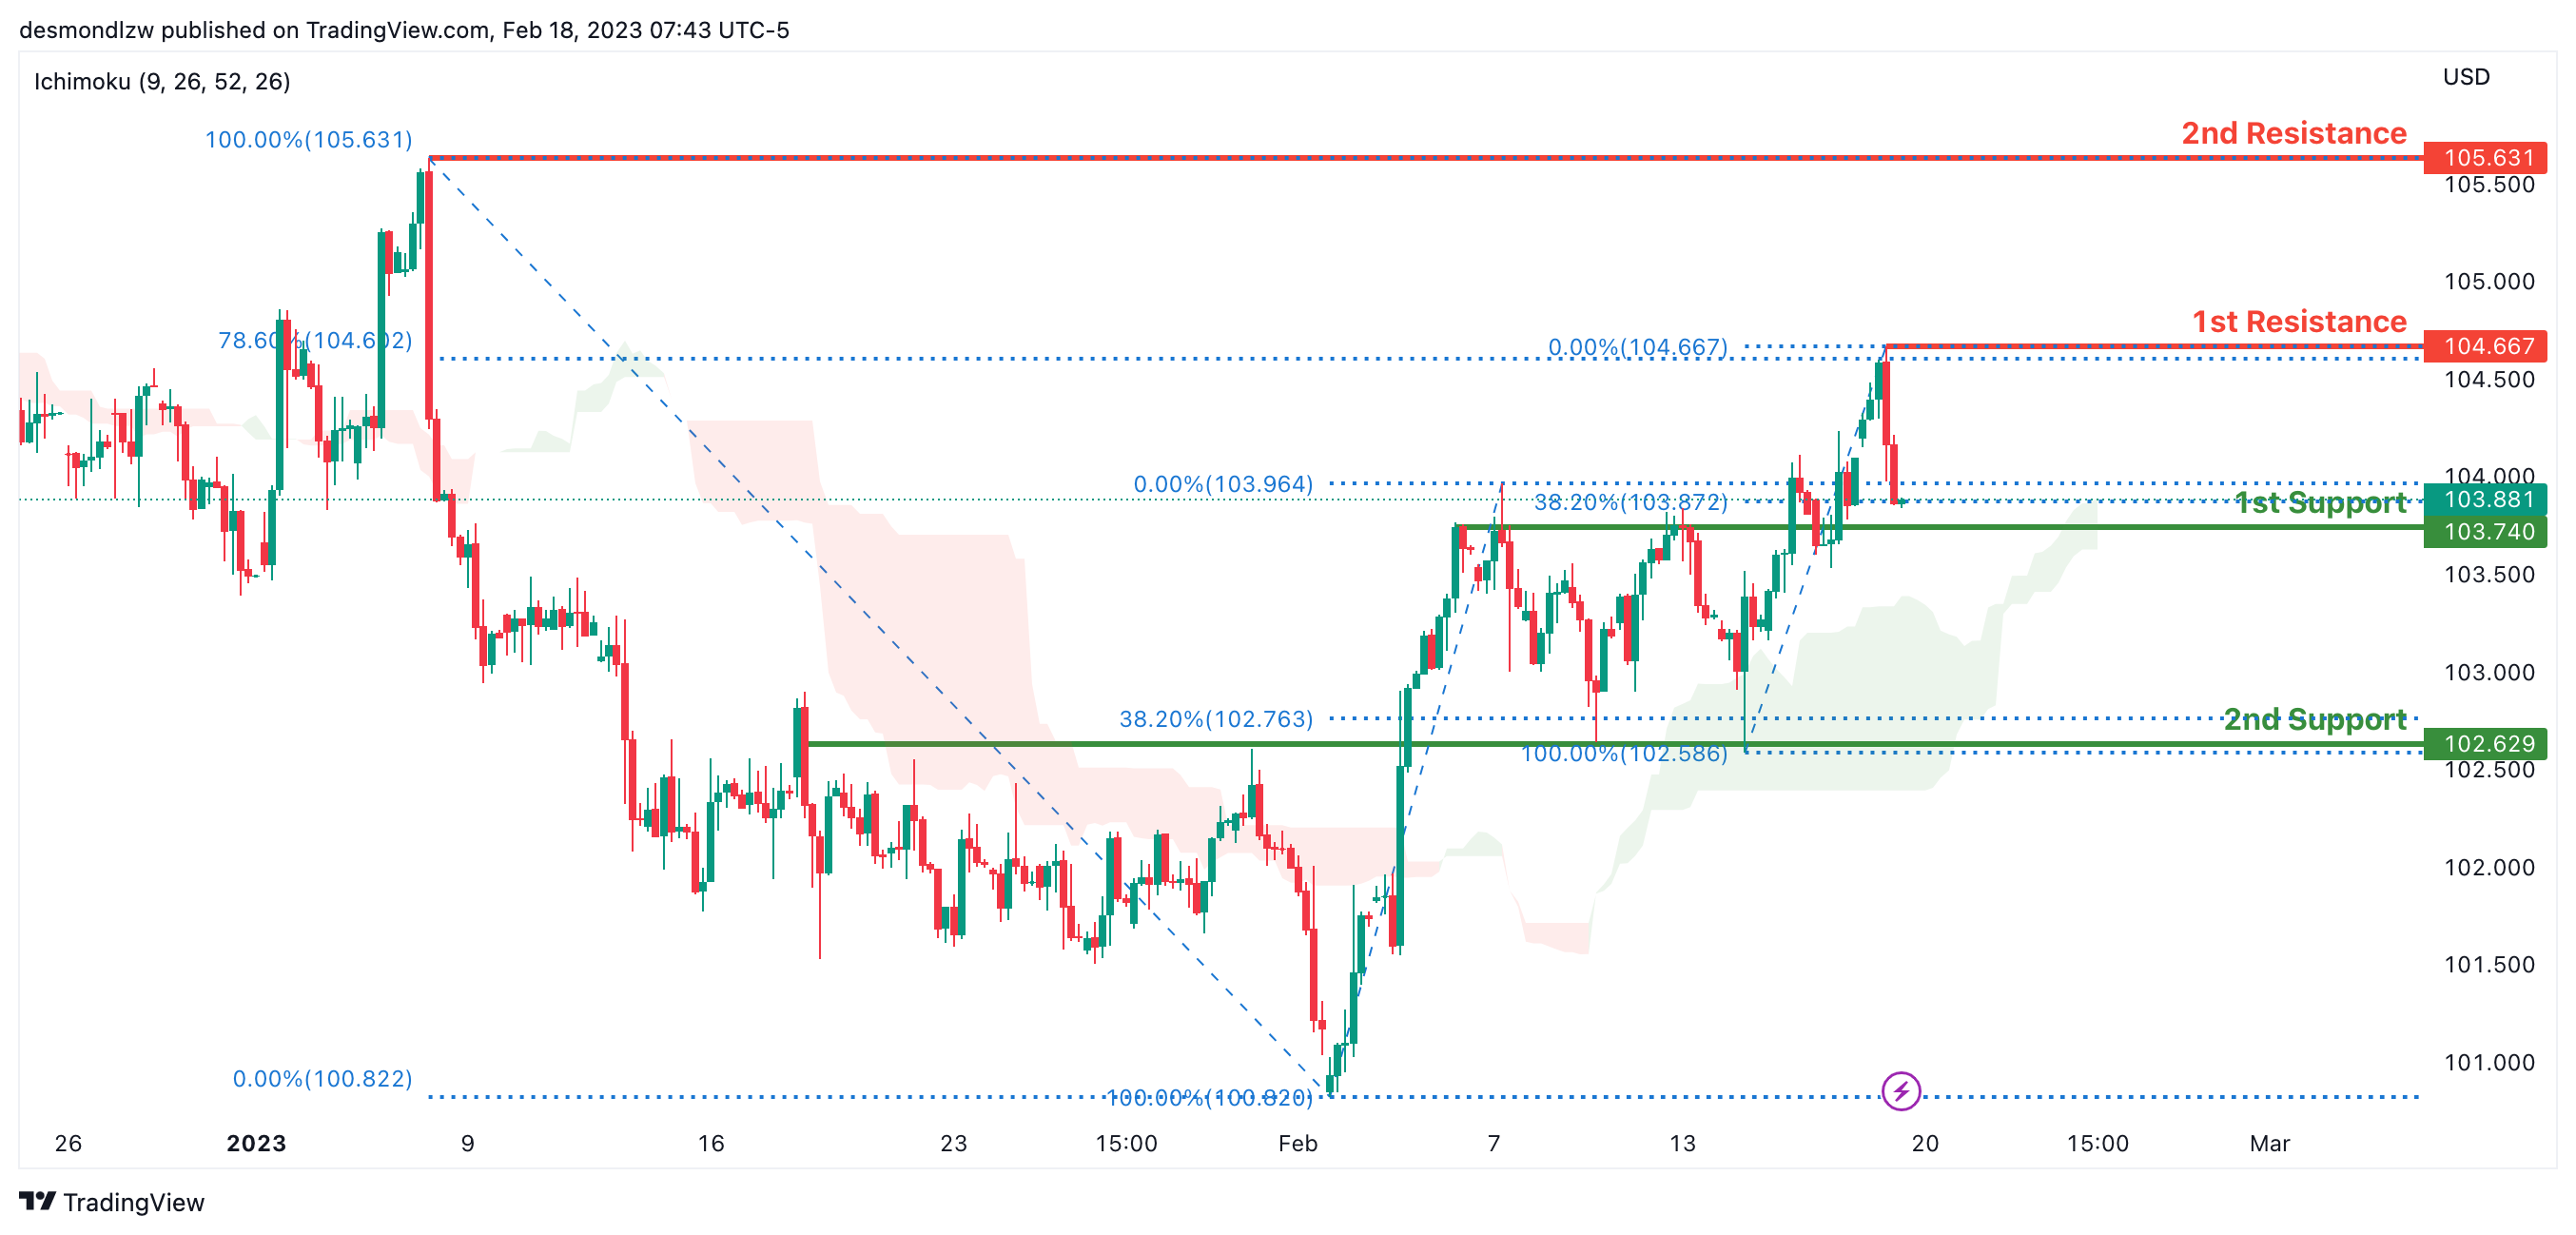
Looking at the H4 chart, my overall bias for DXY is bullish due to the current price crossing above the Ichimoku cloud, indicating a bullish market. If this bullish momentum continues, expect the price to possibly continue heading towards the 1st resistance at 104.667, where the recent high and 78.6% Fibonacci line is.
In an alternative scenario, price could head back down to retest the 1st support at 103.740, where the overlap support and 38.2% Fibonacci line is.
Areas of consideration:
- H4 time frame, 1st resistance at 104.667
- H4 time frame, 1st support at 103.740
EUR/USD:
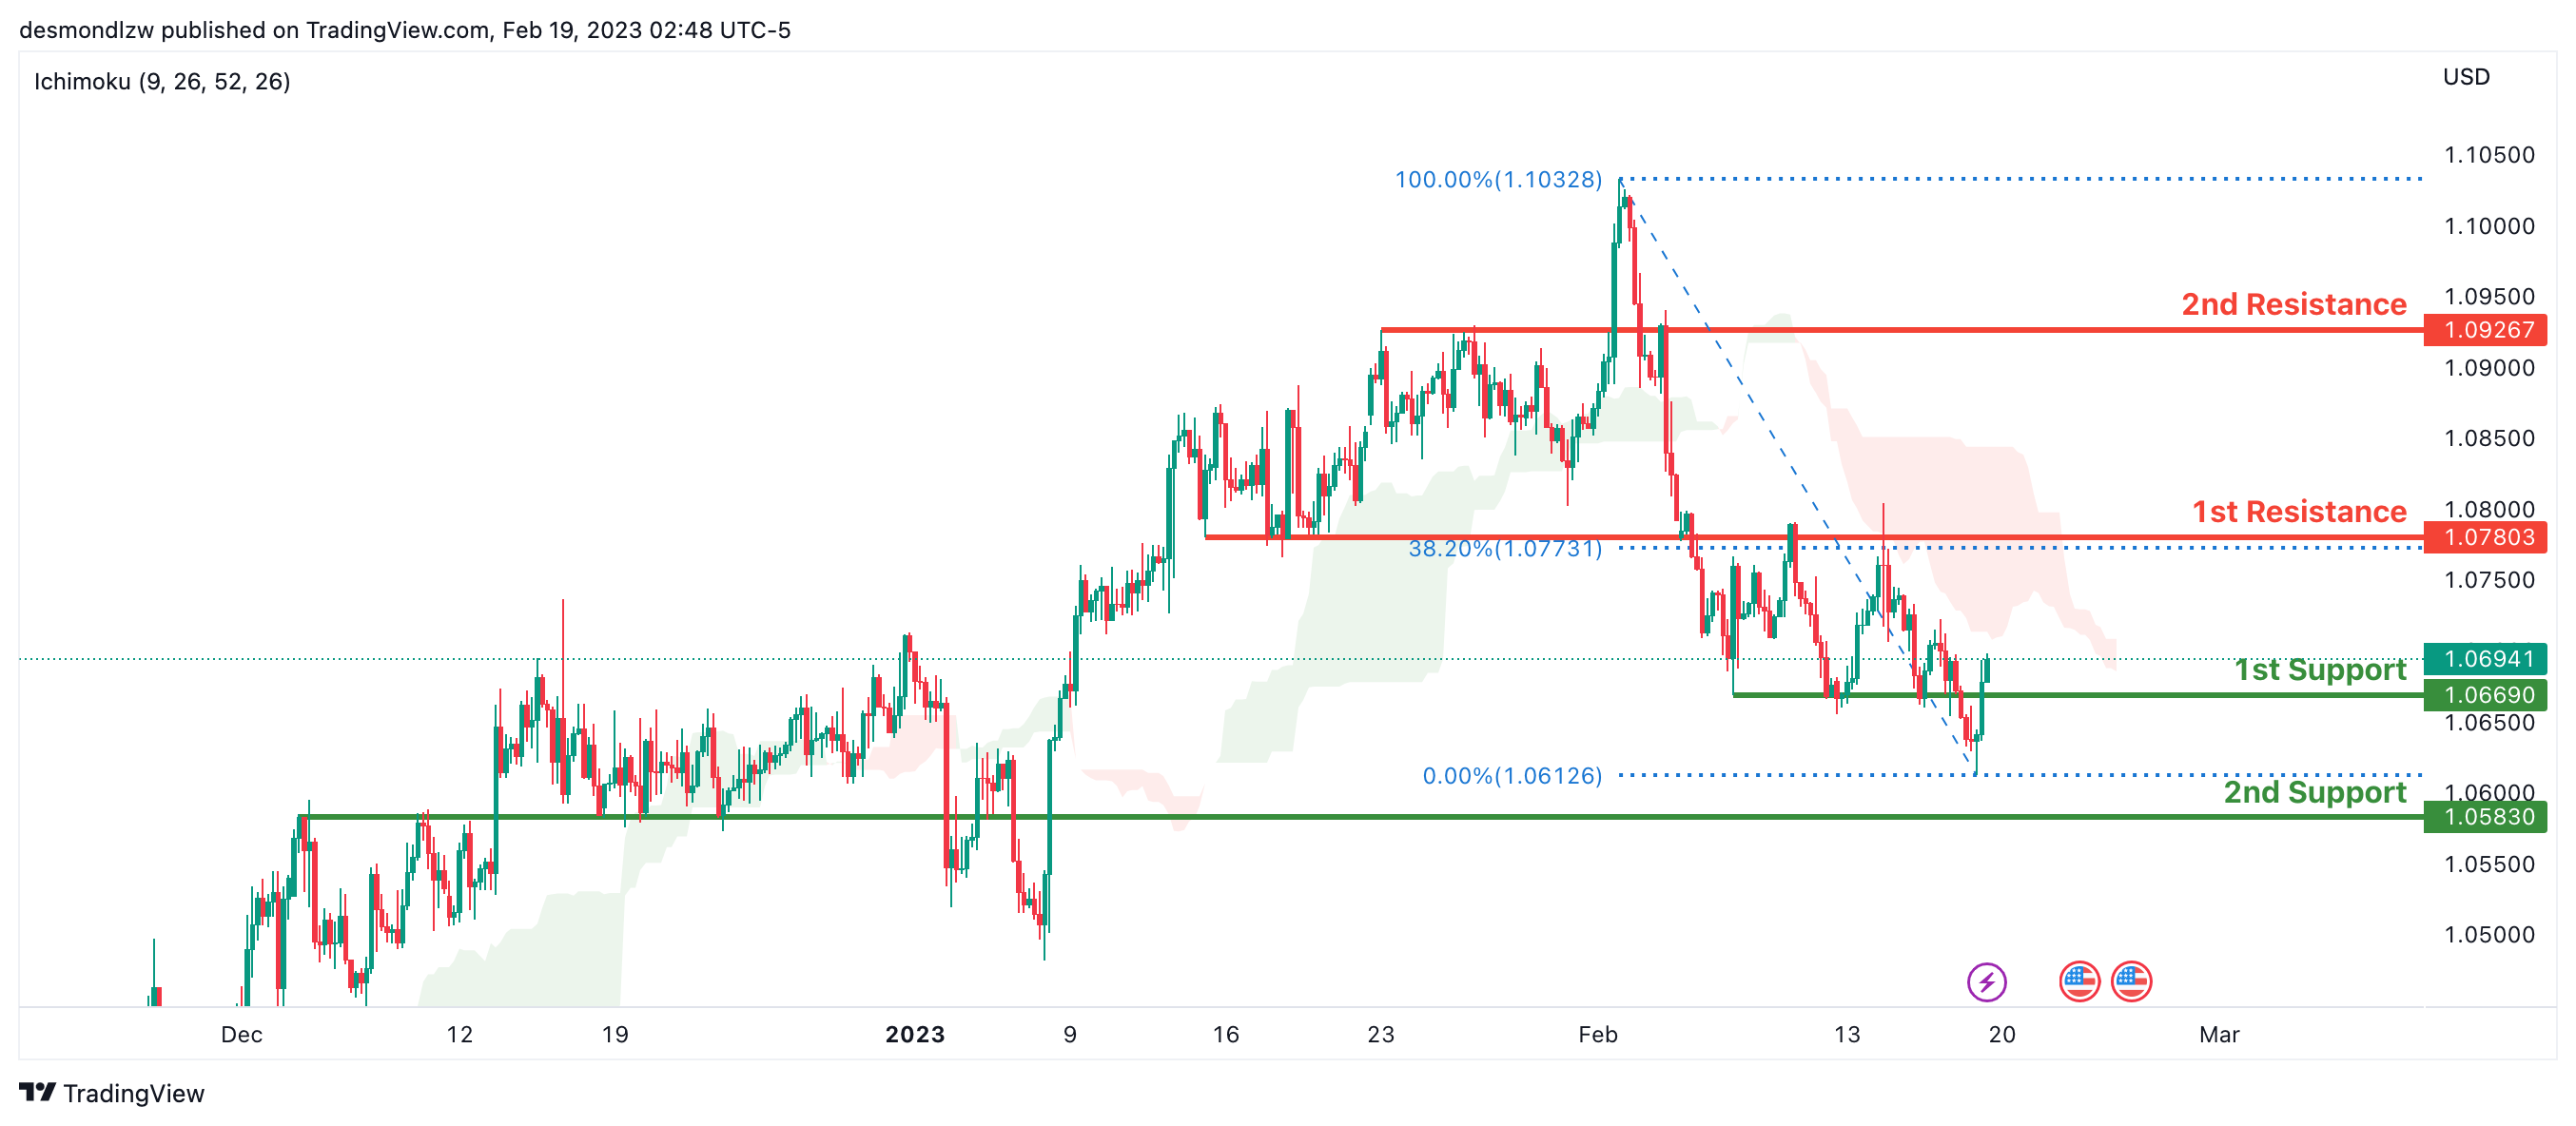
Looking at the H4 chart, my overall bias for EURUSD is bearish due to the current price crossing below the Ichimoku cloud, indicating a bearish market structure. If this bearish momentum continues, expect the price to possibly break the 1st support at 1.06690, where the overlap support is, before heading towards the 2nd support at 1.05830 which is the overlap support.
In an alternate scenario, price could possibly head back up to retest the 1st resistance at 1.07803, where the overlap resistance and 38.2% Fibonacci line is.
Areas of consideration :
- H4 1st resistance at 1.07803
- H4 1st support at 1.06690
- H4 2nd support at 1.05830
GBP/USD:
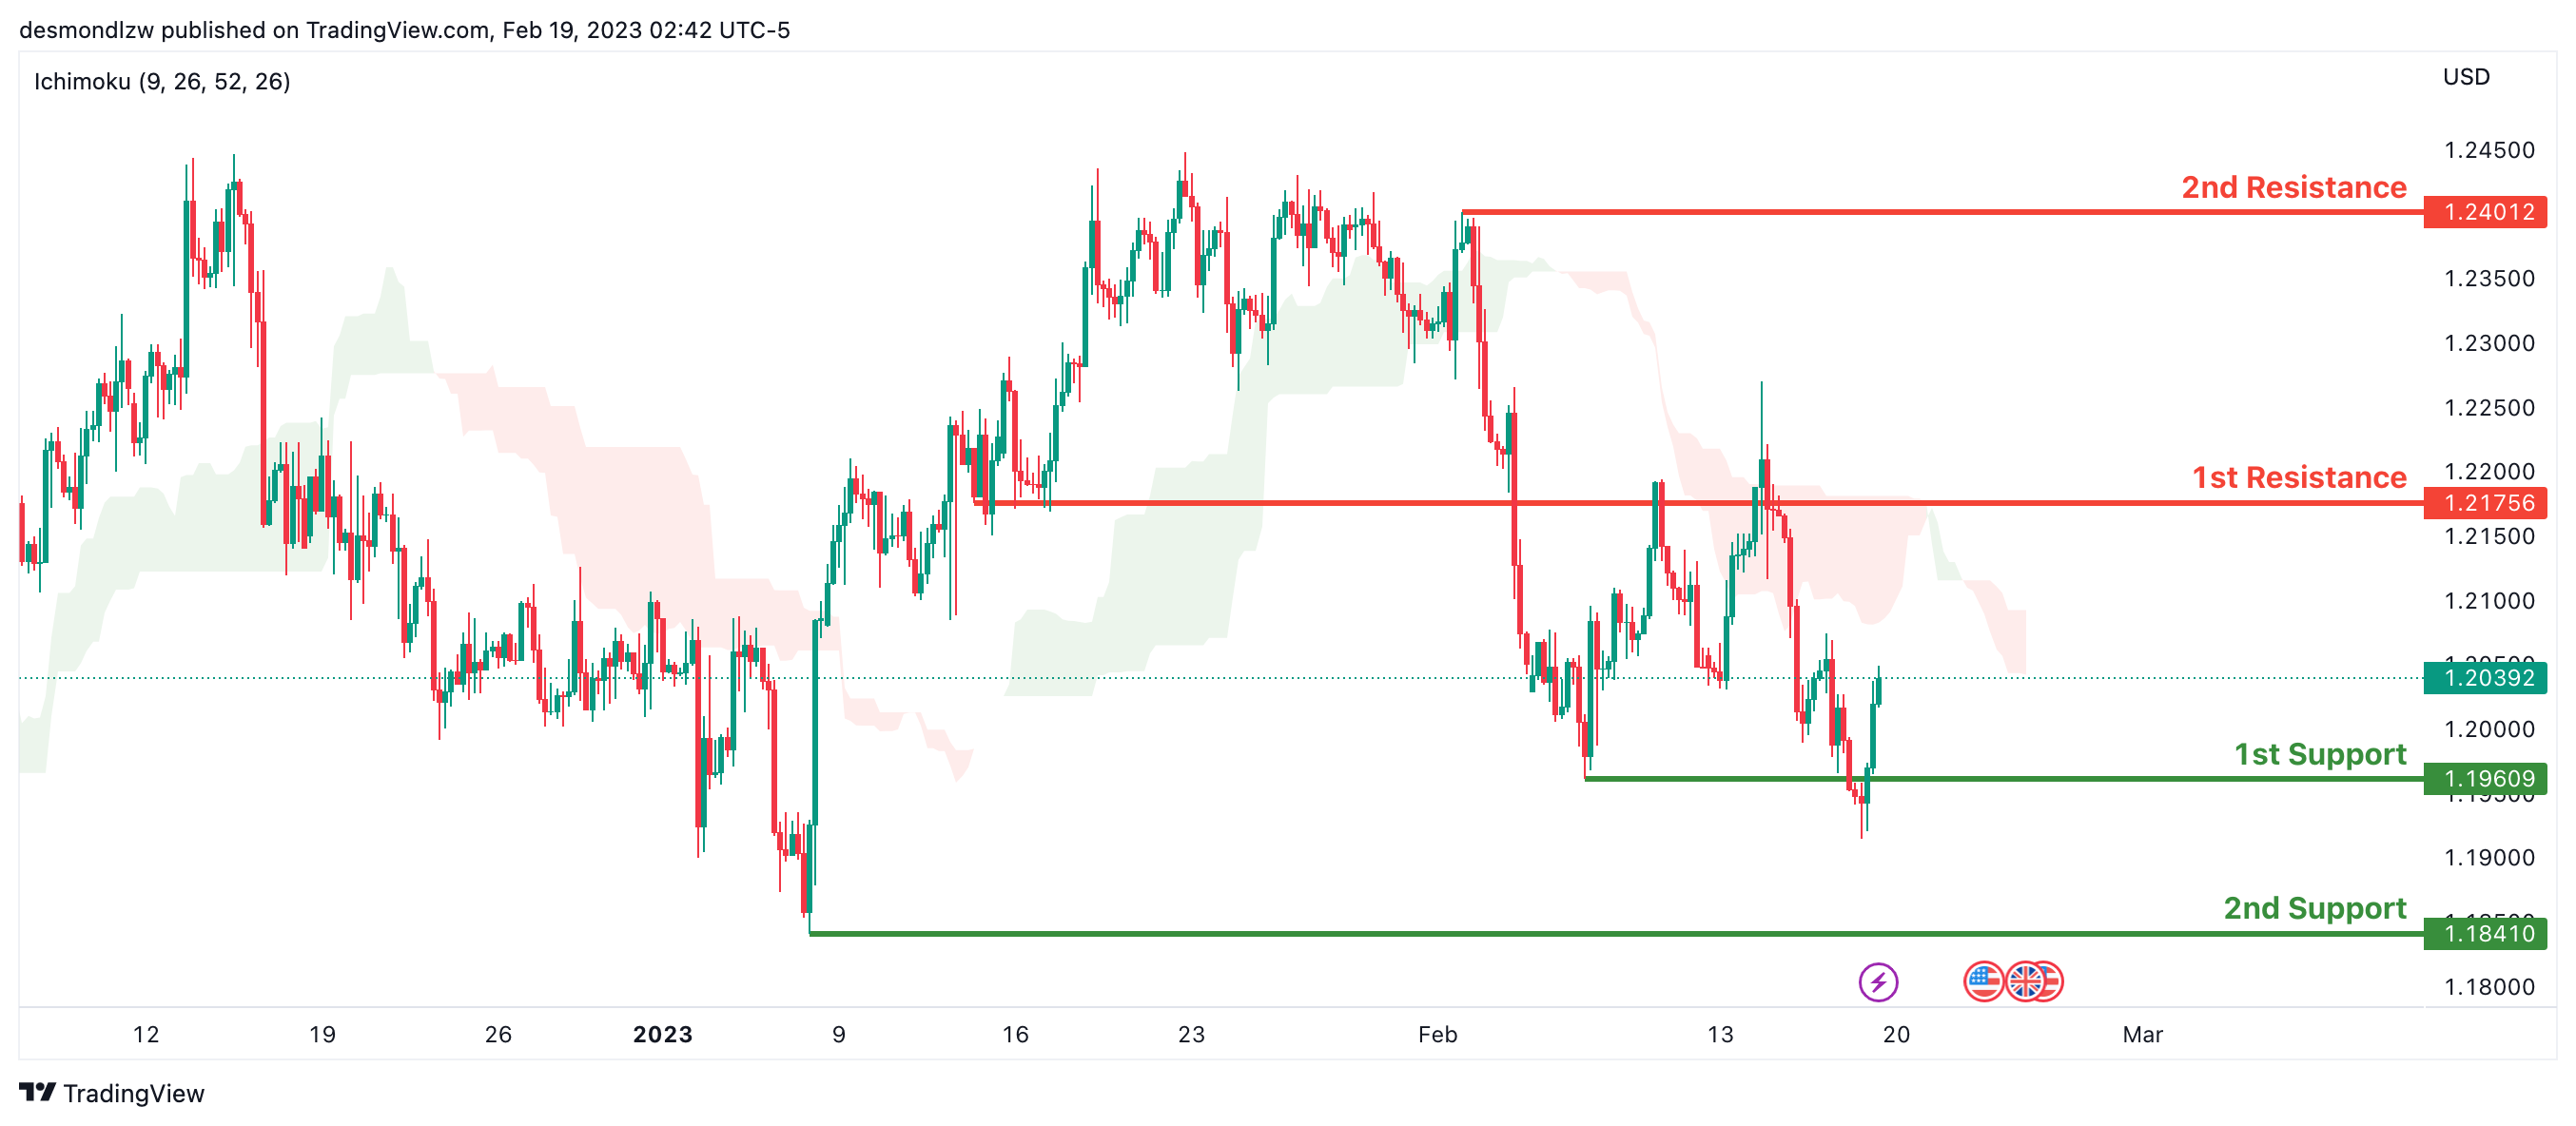
Looking at the H4 chart, my overall bias for GBPUSD is bearish due to the current price crossing below the Ichimoku cloud, indicating a bearish market. If this bearish momentum continues, expect the price to possibly break the 1st support at 1.19609, where the recent swing low is, before heading towards the 2nd support at 1.18410, where the previous swing low is.
In an alternate scenario, price could head back up to retest the 1st resistance line at 1.21756 where the overlap resistance is.
Areas of consideration:
- H4 1st resistance at 1.21756
- H4 1st support at 1.19609
- H4 2nd support at 1.18410
USD/CHF:
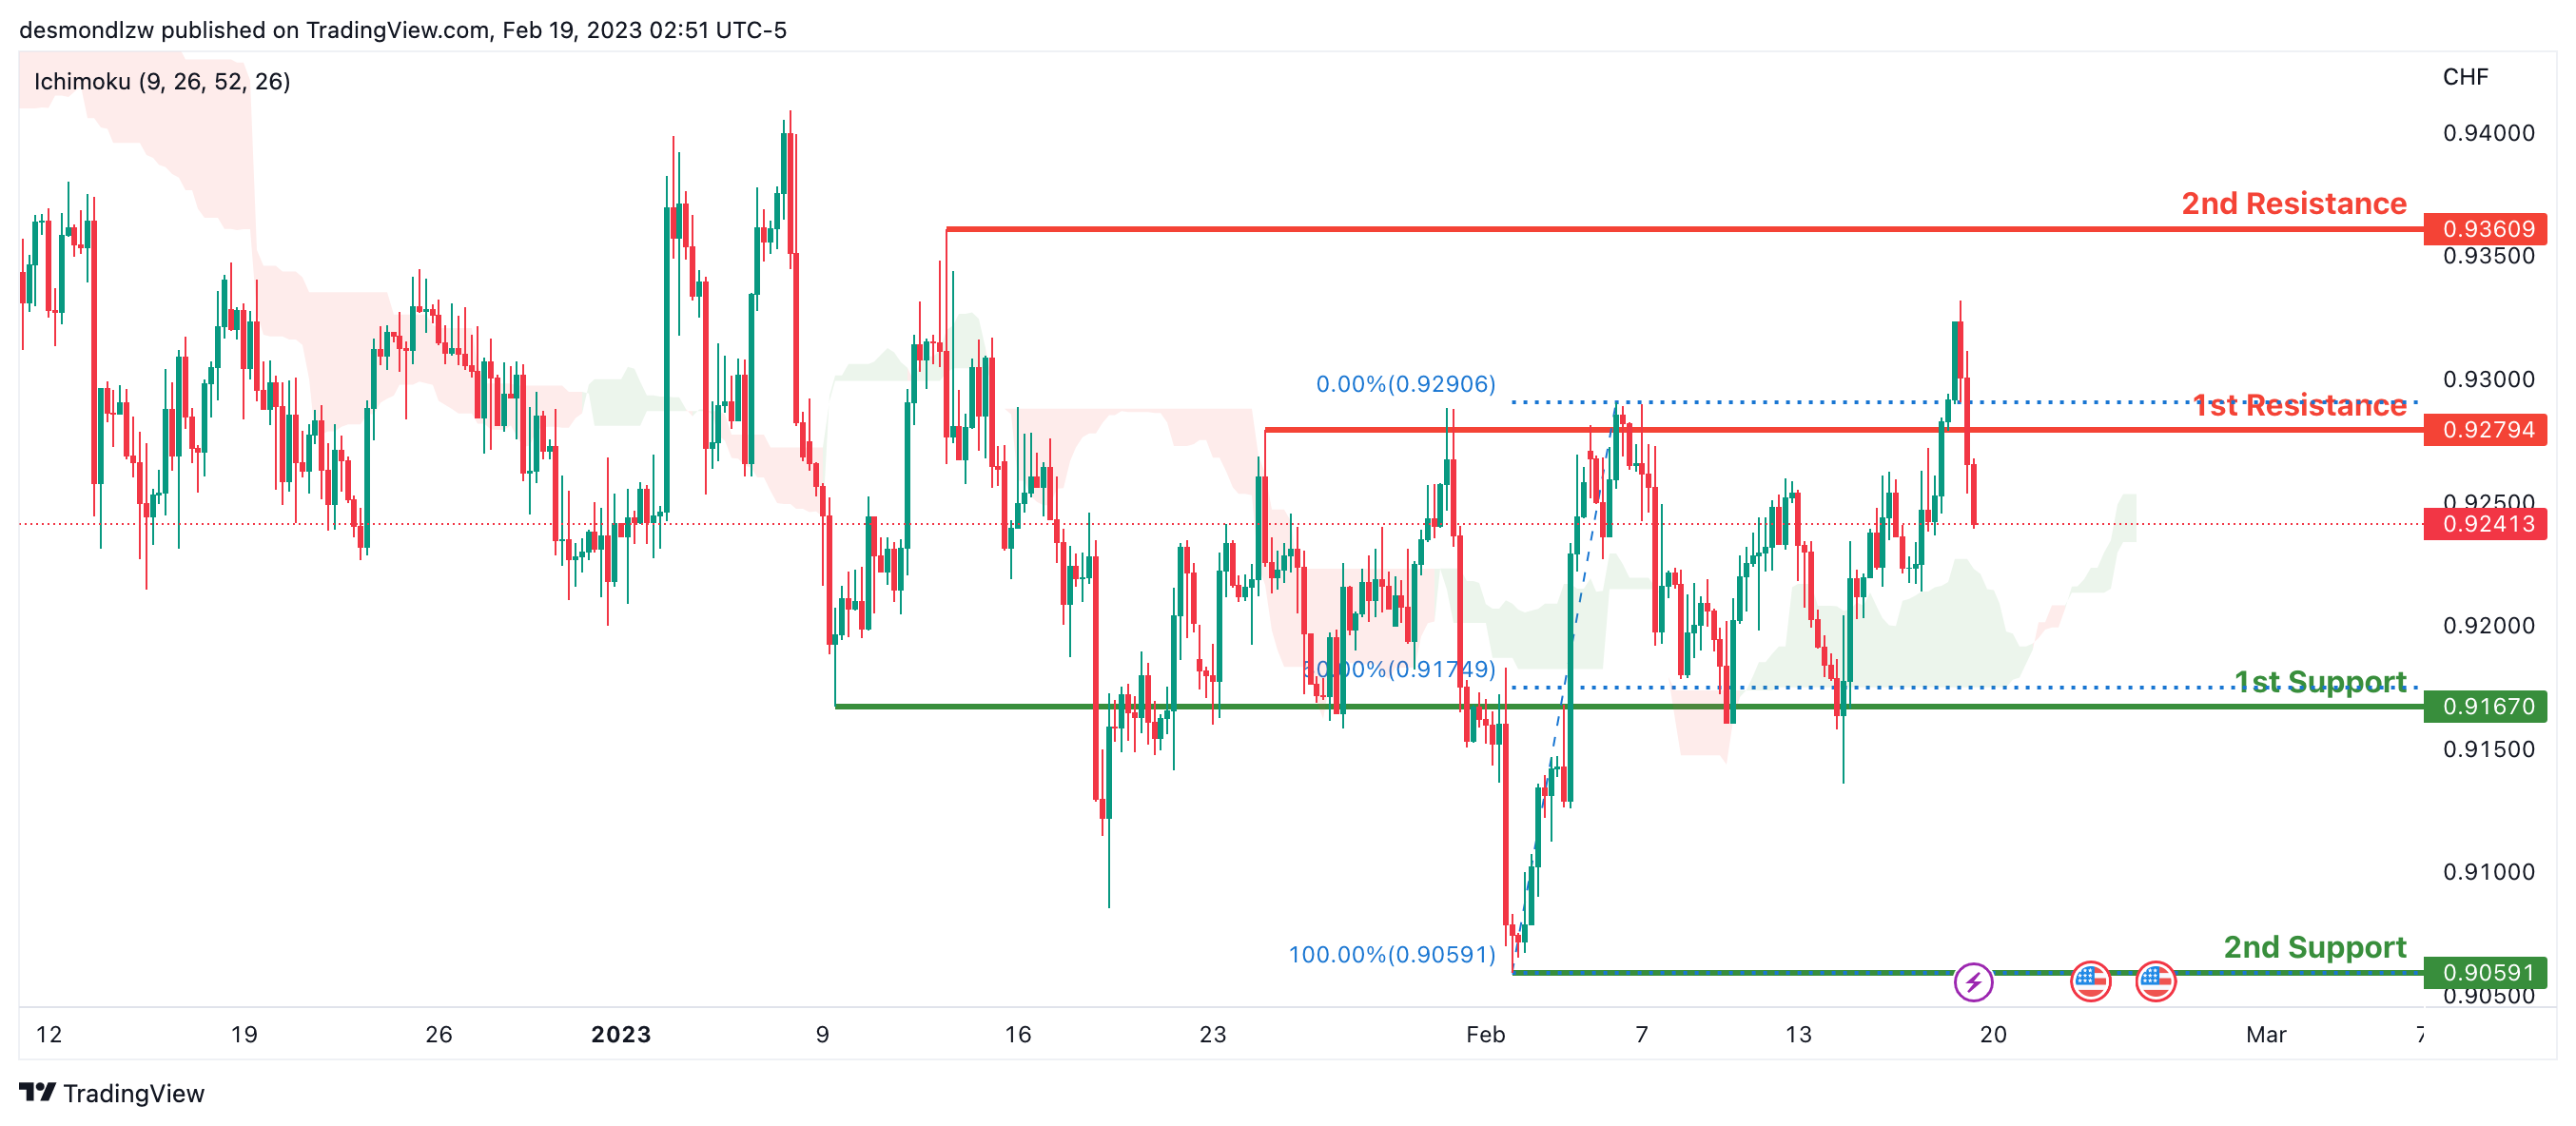
Looking at the H4 chart, my overall bias for USDCHF is bullish due to the current price being above the Ichimoku cloud, indicating a bullish market. If the current bullish trend continues, expect the price to possibly break the 1st resistance at 0.92794, where the previous swing high is, before heading towards the 2nd resistance at 0.93609 where the intermediate high is.
In an alternative scenario, price could possibly head back down to retest the 1st support at 0.91670, where the recent swing low and 50% Fibonacci line is.
Areas of consideration
- H4 1st support at 0.91670
- H4 1st resistance at 0.92794
- H4 2nd resistance at 0.93609
XAU/USD (GOLD):
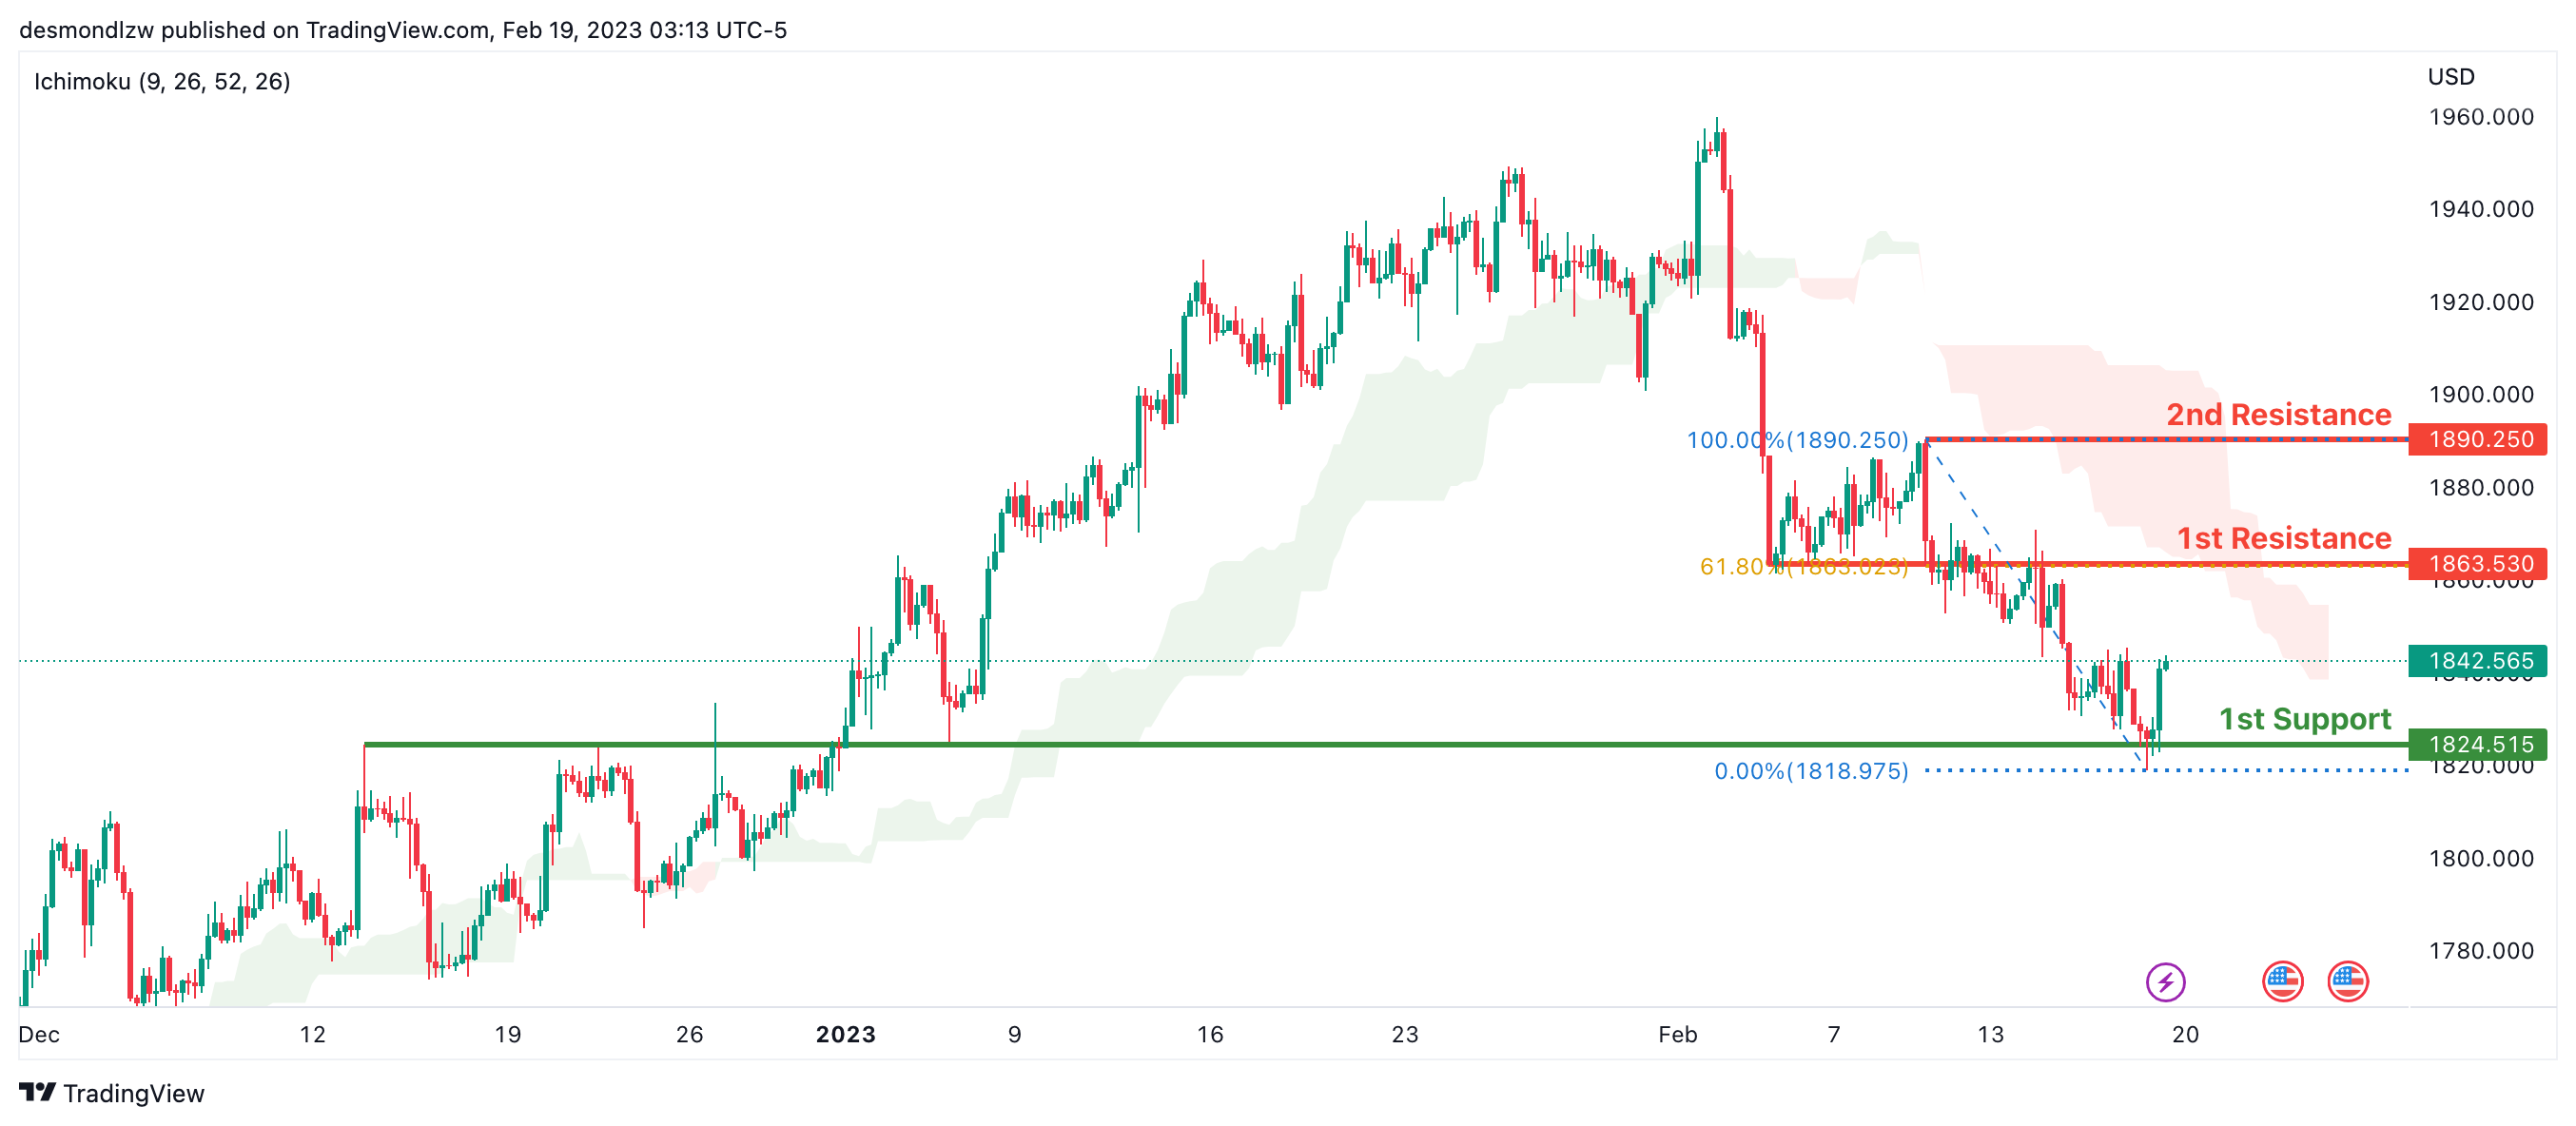
Looking at the H4 chart, my overall bias for XAUUSD is bearish due to the current price being below the Ichimoku cloud, indicating a bearish market. If this bearish momentum continues, expect the price to possibly continue heading towards the 1st support at 1824.515 where the overlap support is.
In an alternative scenario, price could possibly head back up to retest the 1st resistance at 1863.530, where the overlap resistance and 61.8% Fibonacci line is.
Areas of consideration:
- H4 time frame, 1st resistance at 1863.530
- H4 time frame, 1st support at 1824.515
AUD/USD:
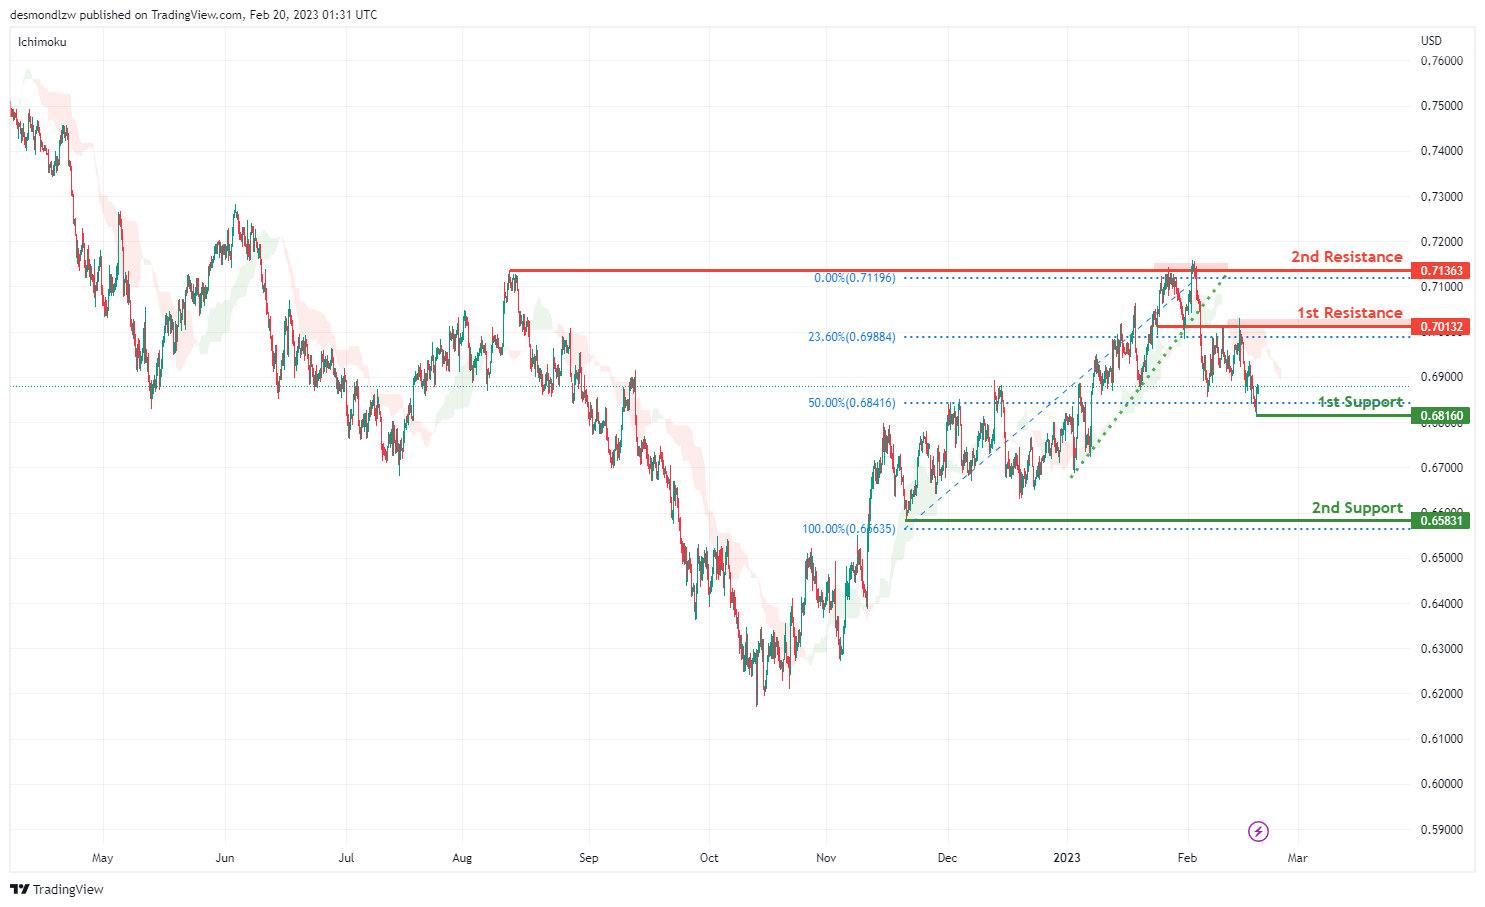
Looking at the H4 chart, my overall bias for AUDUSD is bearish due to the current price being below the Ichimoku cloud, and the ascending trend line has been broken, indicating a change in market structure.
The 1st support is at 0.68160 which is the recent swing high and in line with the 50% Fibonacci retracement. The 2nd support is at 0.65831 which is the recent swing low.
In an alternate scenario, the price could possibly go back up towards the 1st resistance level at 0.70132 which is the recent swing high and in line with the 23.6% Fibonacci retracement. There is 2nd resistance at 0.71363 which is the previous swing high.
Areas of consideration
- H4. 2nd resistance at 0.71363
- H4. 1st resistance at 0.70132
- H4, 1st support at 0.68160
- H4, 2nd support at 0.65831
NZD/USD:
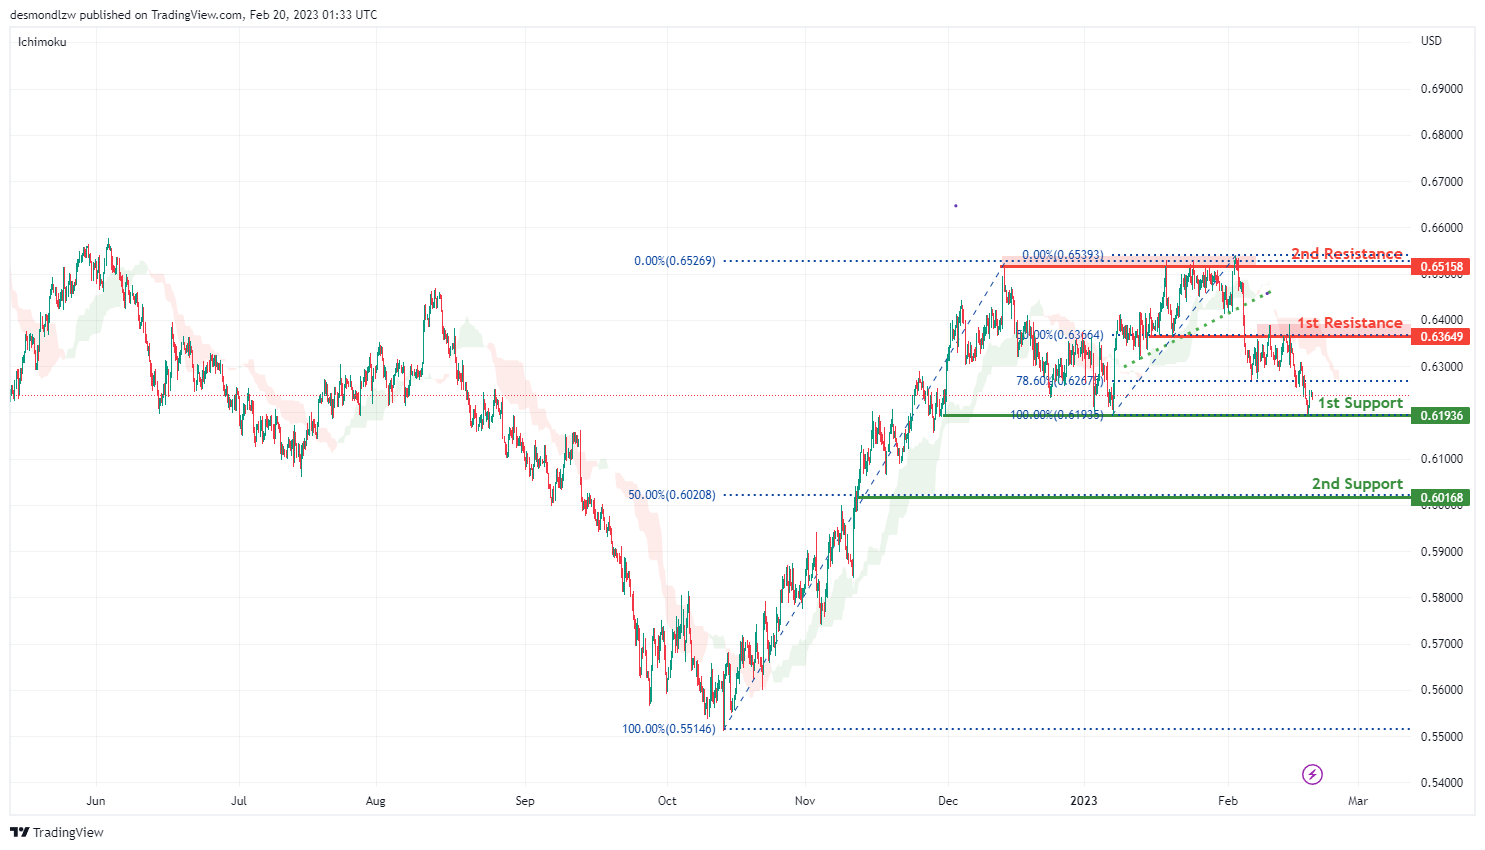
Looking at the H4 chart, my overall bias for NZDUSD is bearish, as the current price is below the Ichimoku Cloud.
Expecting the price to go down towards the 1st support at 0.61936 which is the overlap swing low. The 2nd support is at 0.60168 where the 50% Fibonacci line is.
In an alternate scenario, price could possibly go up towards the 1st resistance level at 0.63649 which is the recent overlap swing high and in line with 50% Fibonacci retracement. There is a 2nd resistance at 0.65158.
Areas of consideration:
- H4 time frame, 2nd resistance at 0.65158
- H4 time frame, 1st resistance at 0.63649
- H4 time frame, 1st support at 0.61936
- H4 time frame, 2nd support at 0.60168
USD/CAD:
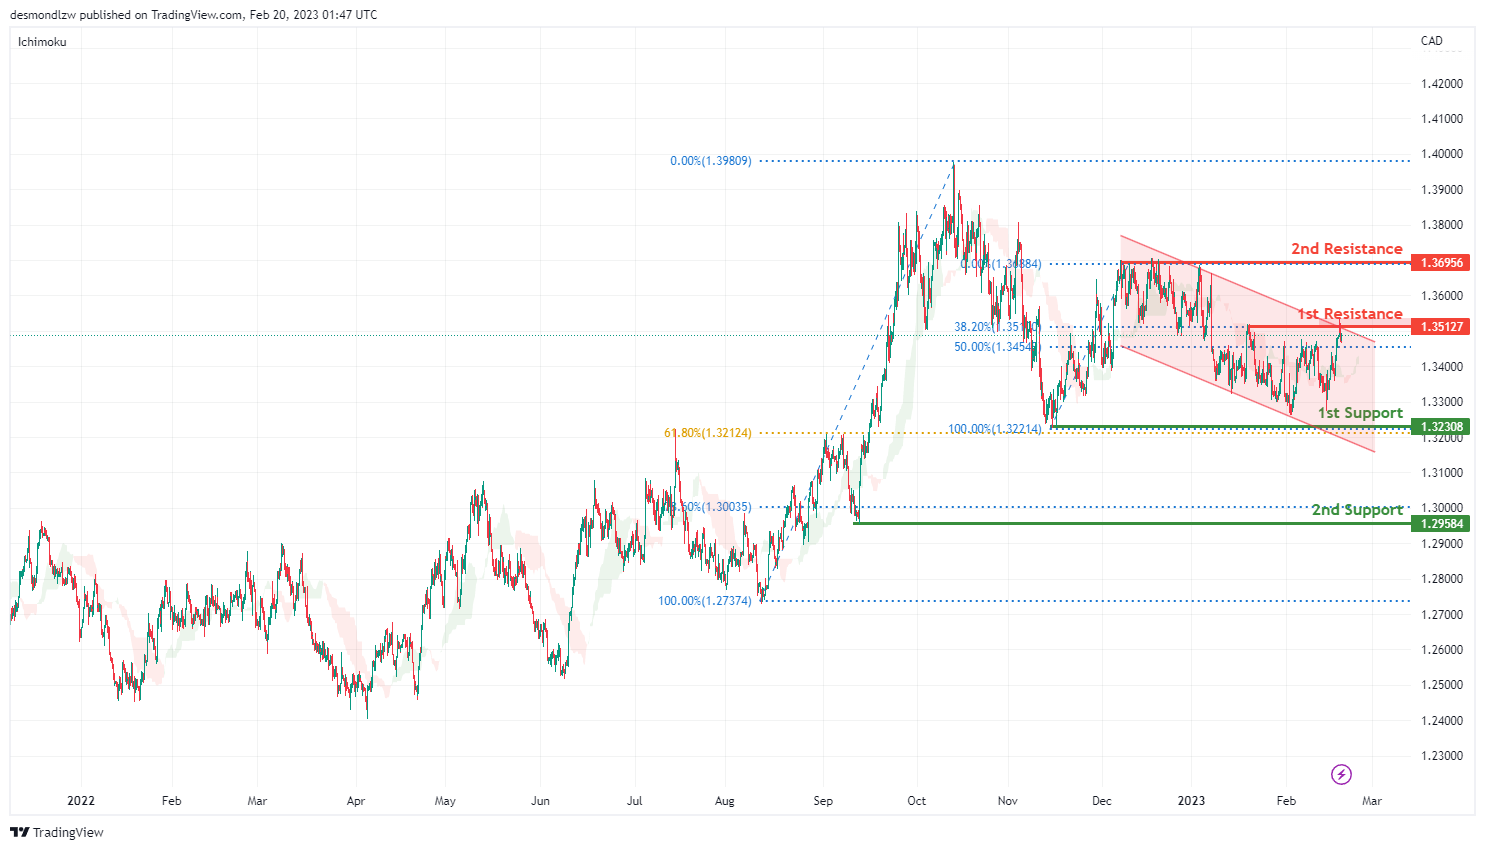
Looking at the H4 chart, my overall bias for USDCAD is bearish , as there is descending chanel. Expecting the current price possibly down to the 1st support at 1.32308 which is the previous swing low and also in line with the 61.8% Fibonacci retracement. The 2nd support is at 1.29584 where the 78.6% Fibonacci line is .
In an alternative scenario, the price could possibly break the 1st resistance at 1.35127 which is the recent swing high and in line with 38.2% Fibonacci retracement, before heading to the 2nd resistance at 1.36956 which is the overlap previous swing high.
Areas of consideration:
- H4 time frame, 2nd resistance at 1.36956
- H4 time frame, 1st resistance at 1.35127
- H4 time frame, 1st support at 1.32308
- H4 time frame, 2nd support at 1.29584
OIL:
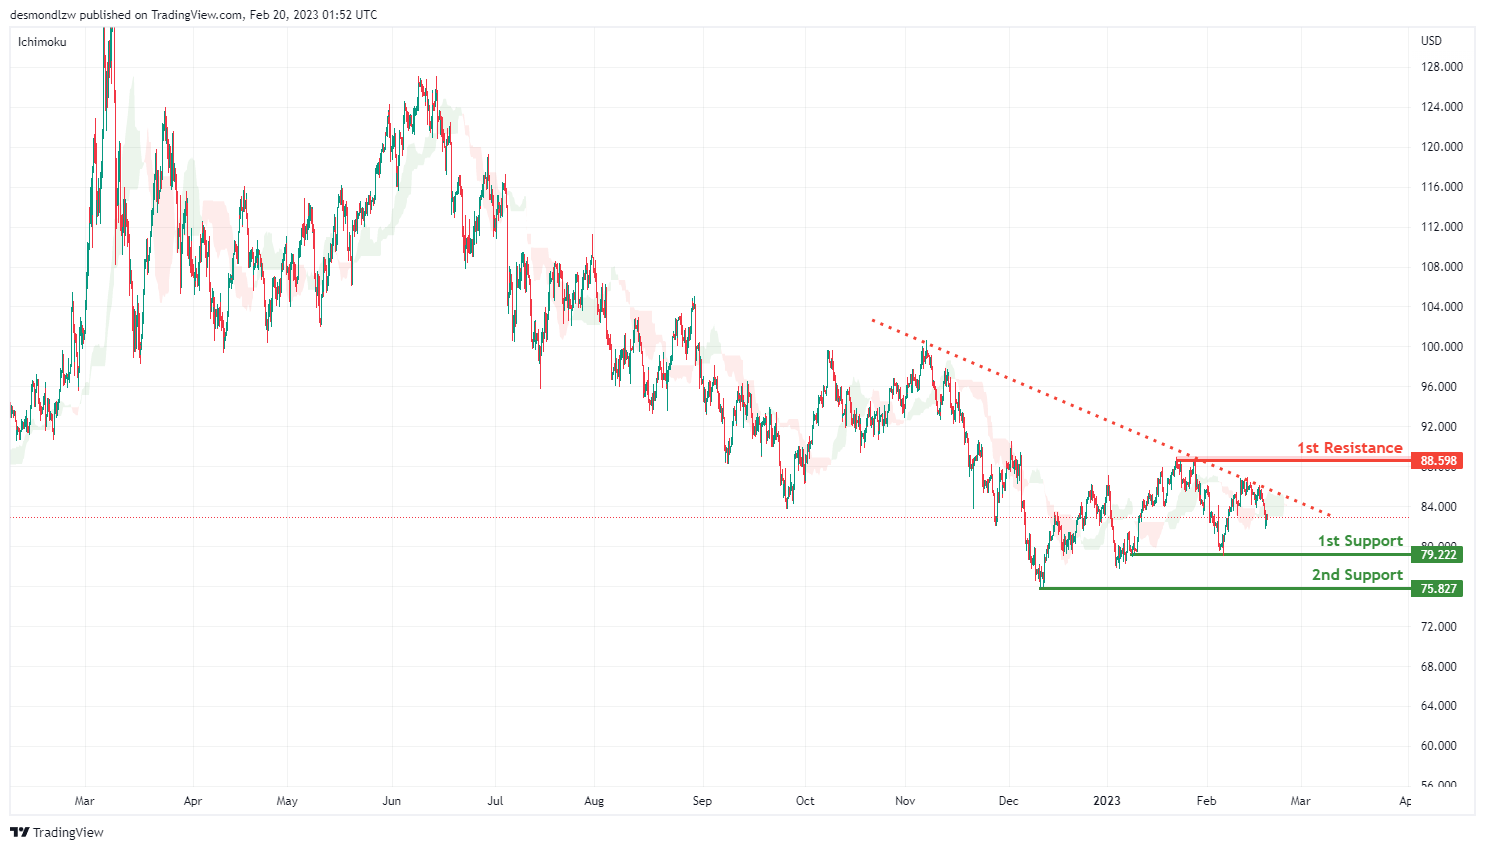
Looking at the H4 chart, my overall bias for BOC is bearish as the current price acrossing the Ichimoku cloud, and there is an descending trend line. Expecting the price to head down towards the 1st support level at 79.222 which is the recent overlap swing low, before the price drops to the 2nd support at 75.827.
In an alternate scenario, the price could possibly head up towards the 1st resistance level at 88.598 which is the recent swing high.
Areas of consideration:
- H4 time frame, 1st resistance at 88.598
- H4 time frame,1st support at 79.587
- H4 time frame, 2nd support at 75.827
Dow Jones Industrial Average:
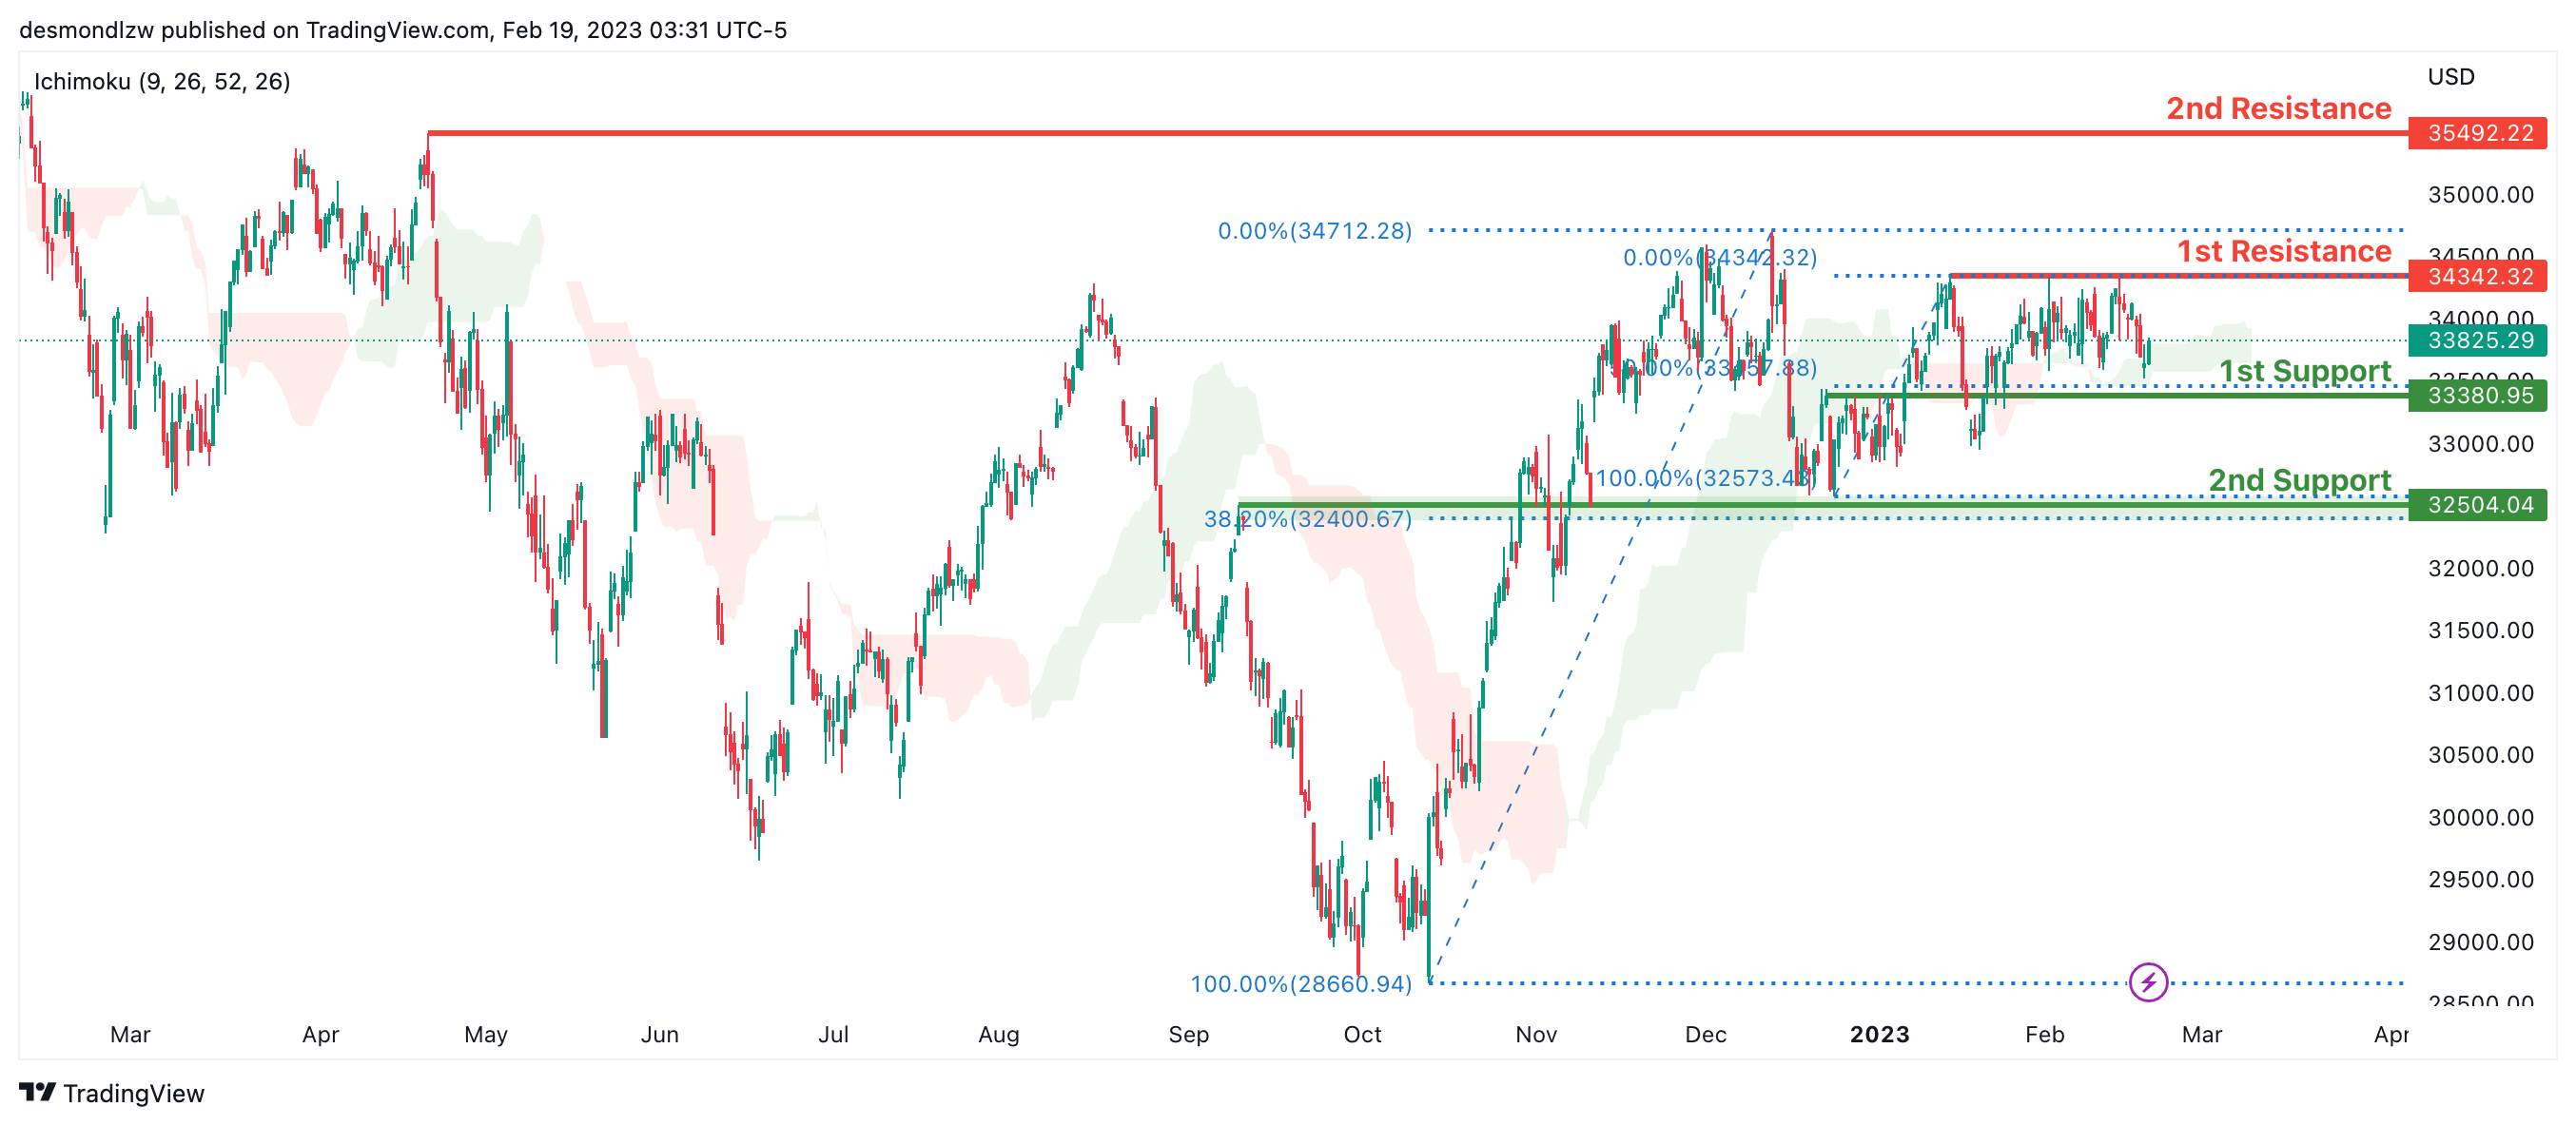
On the H4 chart, the overall bias for DJI is bullish. To add confluence to this, the price is crossing above the Ichimoku cloud which indicates a bullish market. If this bullish momentum continues, expect the price to possibly continue heading towards the 1st resistance line at 34342.32, where the recent swing high is.
In an alternative scenario, price could possibly head back down towards the 1st support at 33380.95, where the 50% Fibonacci line is.
Areas of consideration:
- H4 time frame, 1st support at 33380.95
- H4 time frame, 1st Resistance at 34342.32
DAX:
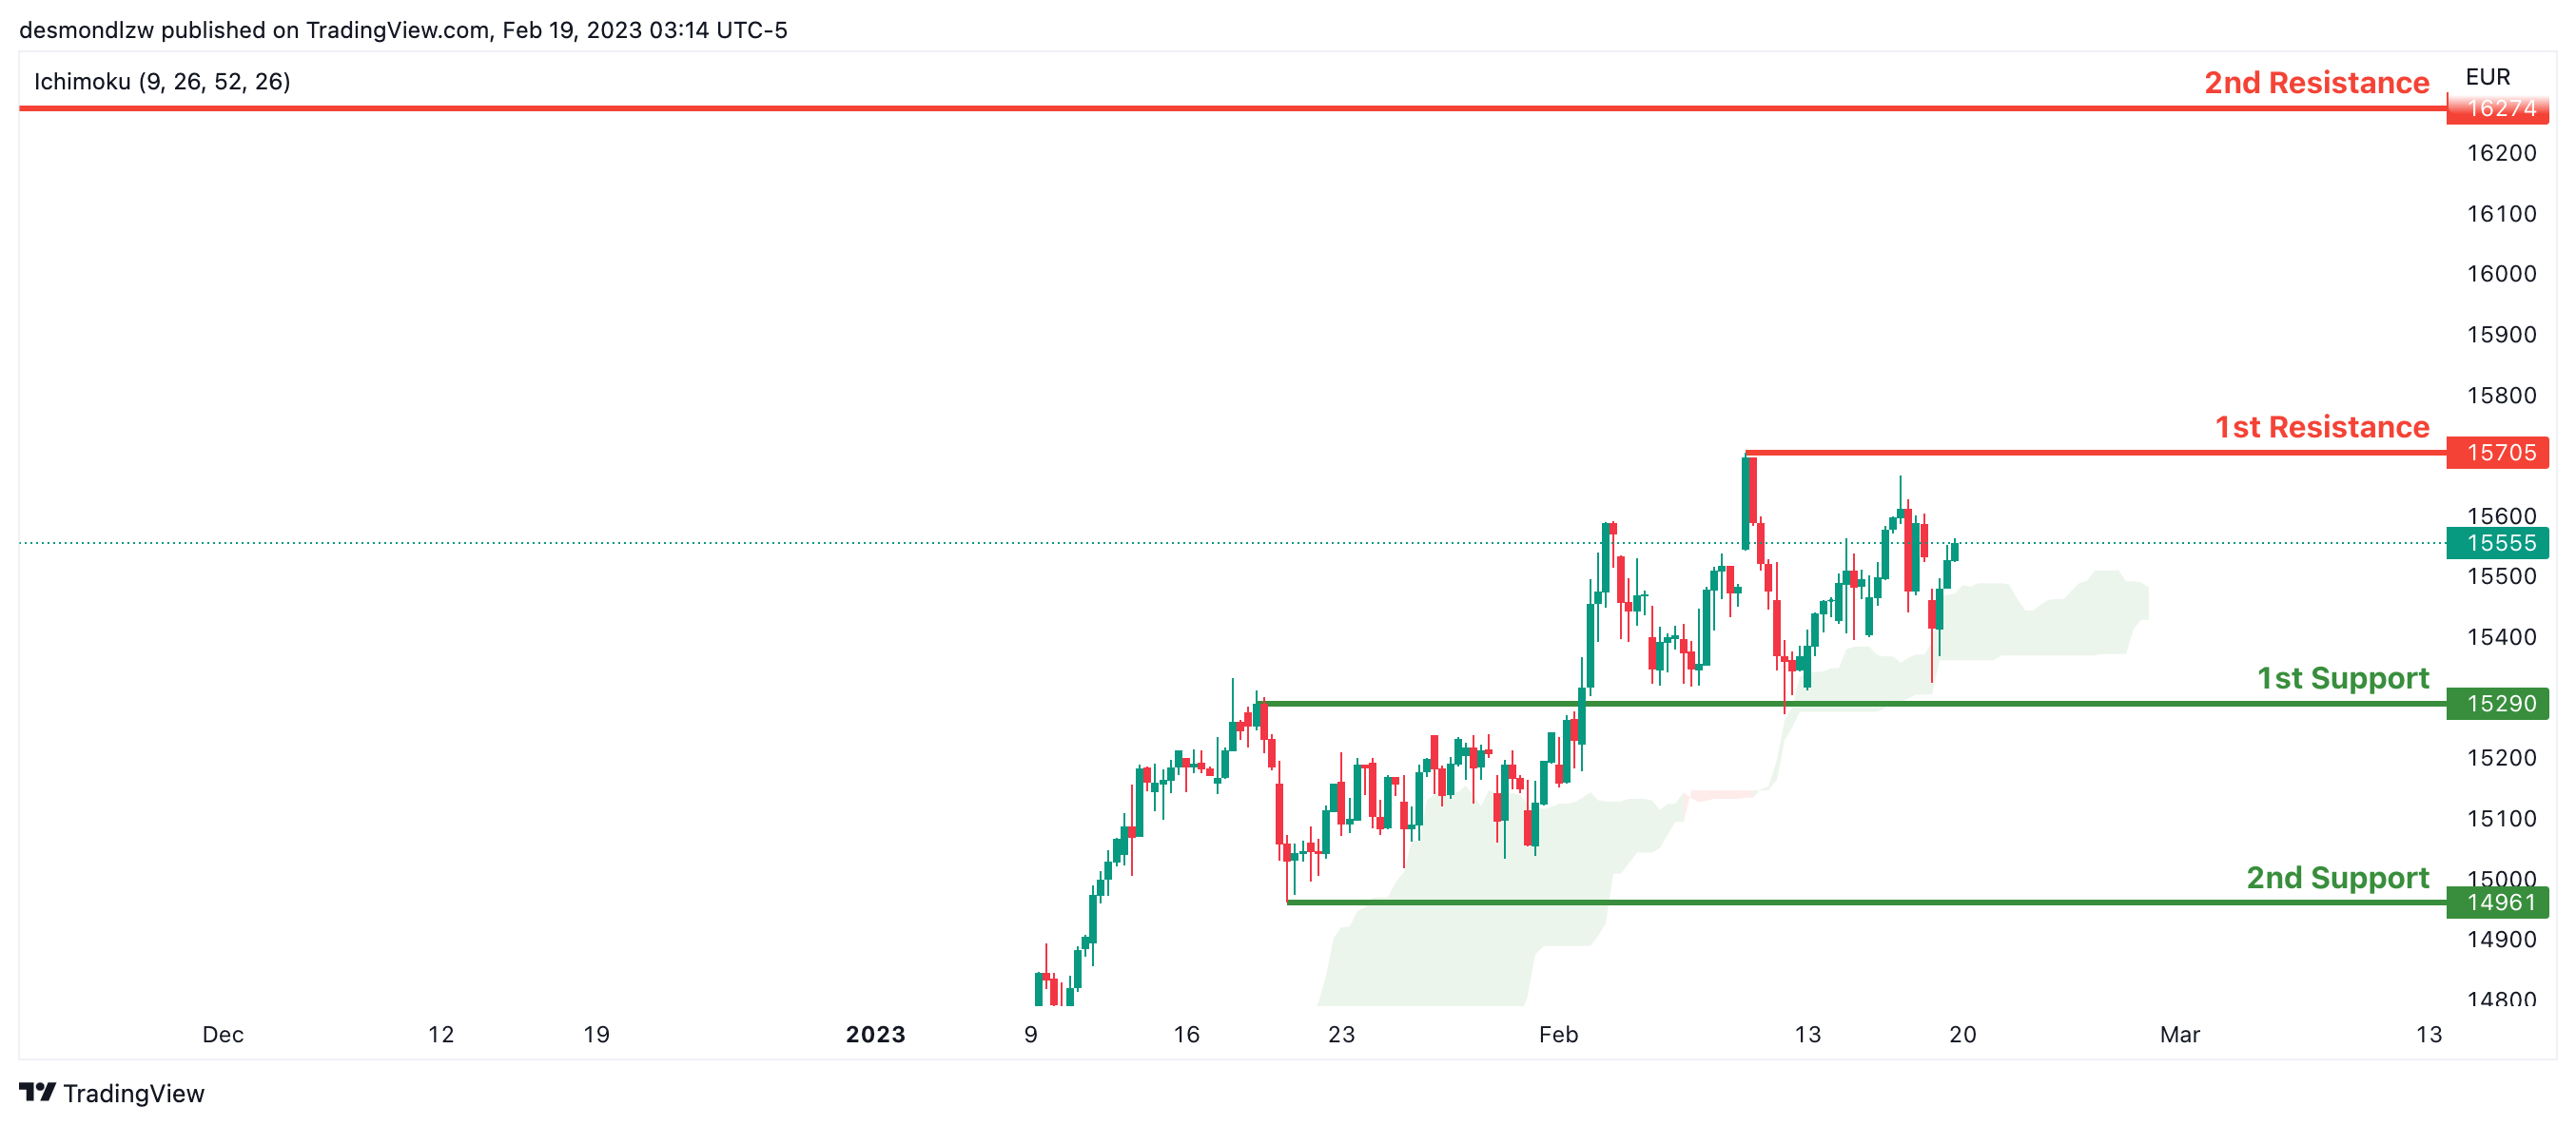
Looking at the H4 chart, my overall bias for DAX is bullish due to the current price crossing above the Ichimoku cloud, indicating a bullish market. If this bullish momentum continues, expect the price to possibly head towards the 1st resistance line at 15705, where the recent high is.
In an alternative scenario, price could possibly head down to retest the 1st support at 15290, where the overlap support is.
Areas of consideration:
- H4 time frame, 1st resistance is at 15705
- H4 time frame, 1st support is at 15290
ETHUSD:
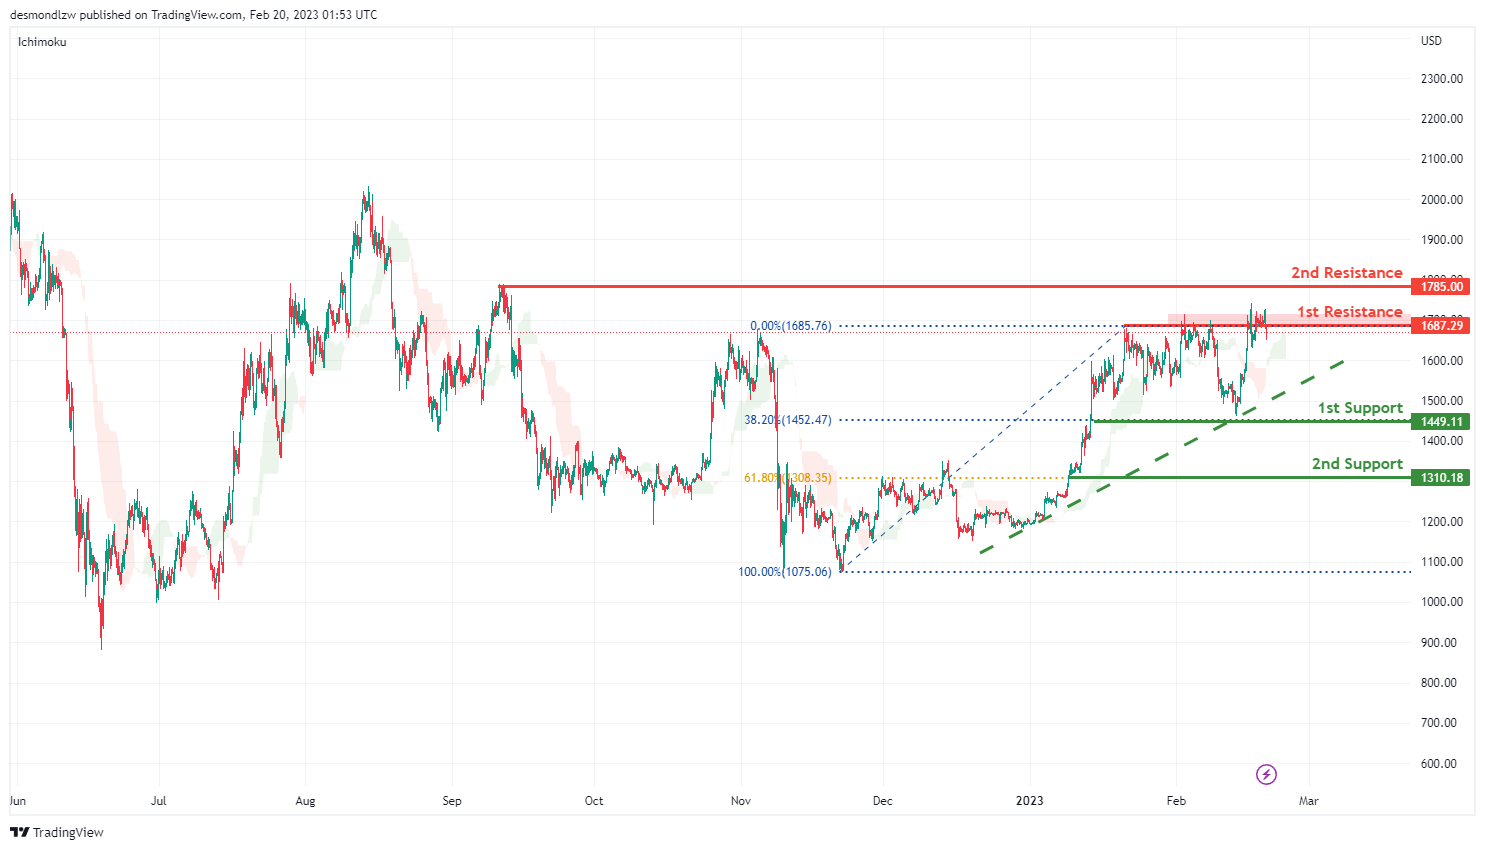
Looking at the H4 chart, my overall bias for ETHUSD is bullish, as there is a strong ascending trend line. The price may go up and break the 1st resistance line at 1685.76 before breaking the 2nd resistance line at 1785.00 which is the previous swing high.
In an alternate scenario, the price may retrace back to the 1st support line at 1449.11 which is in line with 38.2% Fibonacci retracement, before it heads towards the 2nd support at 1310.18 which is in line with 61.8% Fibonacci retracement.
Areas of consideration:
- H4 time frame, 2nd resistance of 1785.00
- H4 time frame, 1st resistance of 1685.76
- H4 time frame, 1st support at 1449.11
- H4 time frame, 2nd support at 1310.18
BTCUSD:
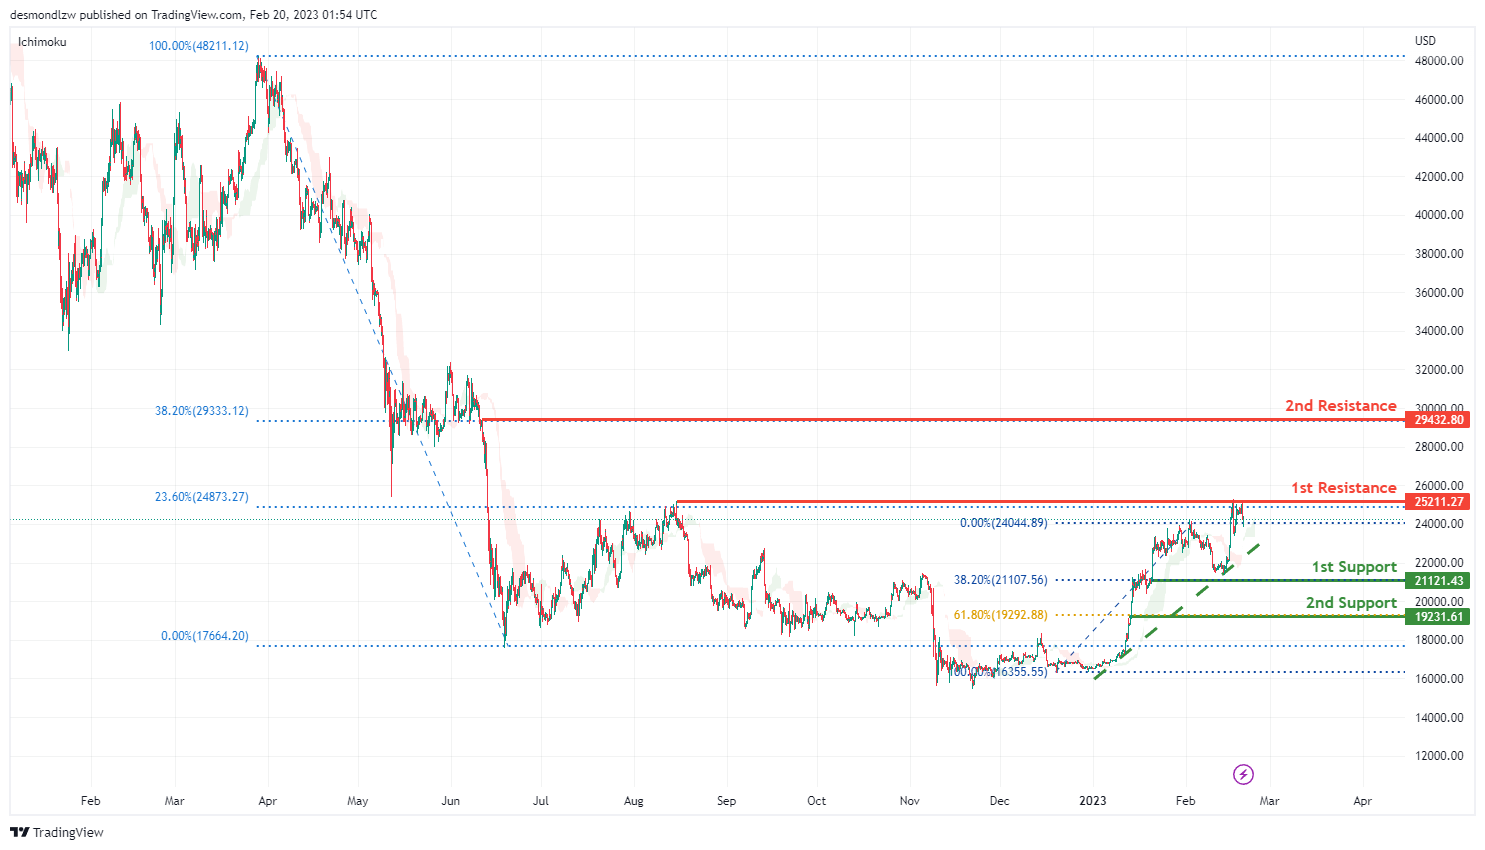
Looking at the H4 chart, my overall bias for BTCUSD is bearish. As there is an ascending trend line, expect the price could possibly head up to the 1st resistance at 25211.27 which is the overlap recent swing high, before it head up to the 2nd resistance 29432.80 where the 38.2% Fibonacci retracemnt is.
The 1st support line at 21121.43 which is in line with 38.2% Fibonacci retracement, before heading down towards the 2nd support at 19231.61 which is in line with 61.8% Fibonacci retracement.
Areas of consideration:
- H4 time frame, 2nd resistance 29432.80
- H4 time frame, 1st resistance 25211.27
- H4 time frame, 1st support at 21121.43
- H4 time frame, 2nd support at 19231.61
S&P 500:
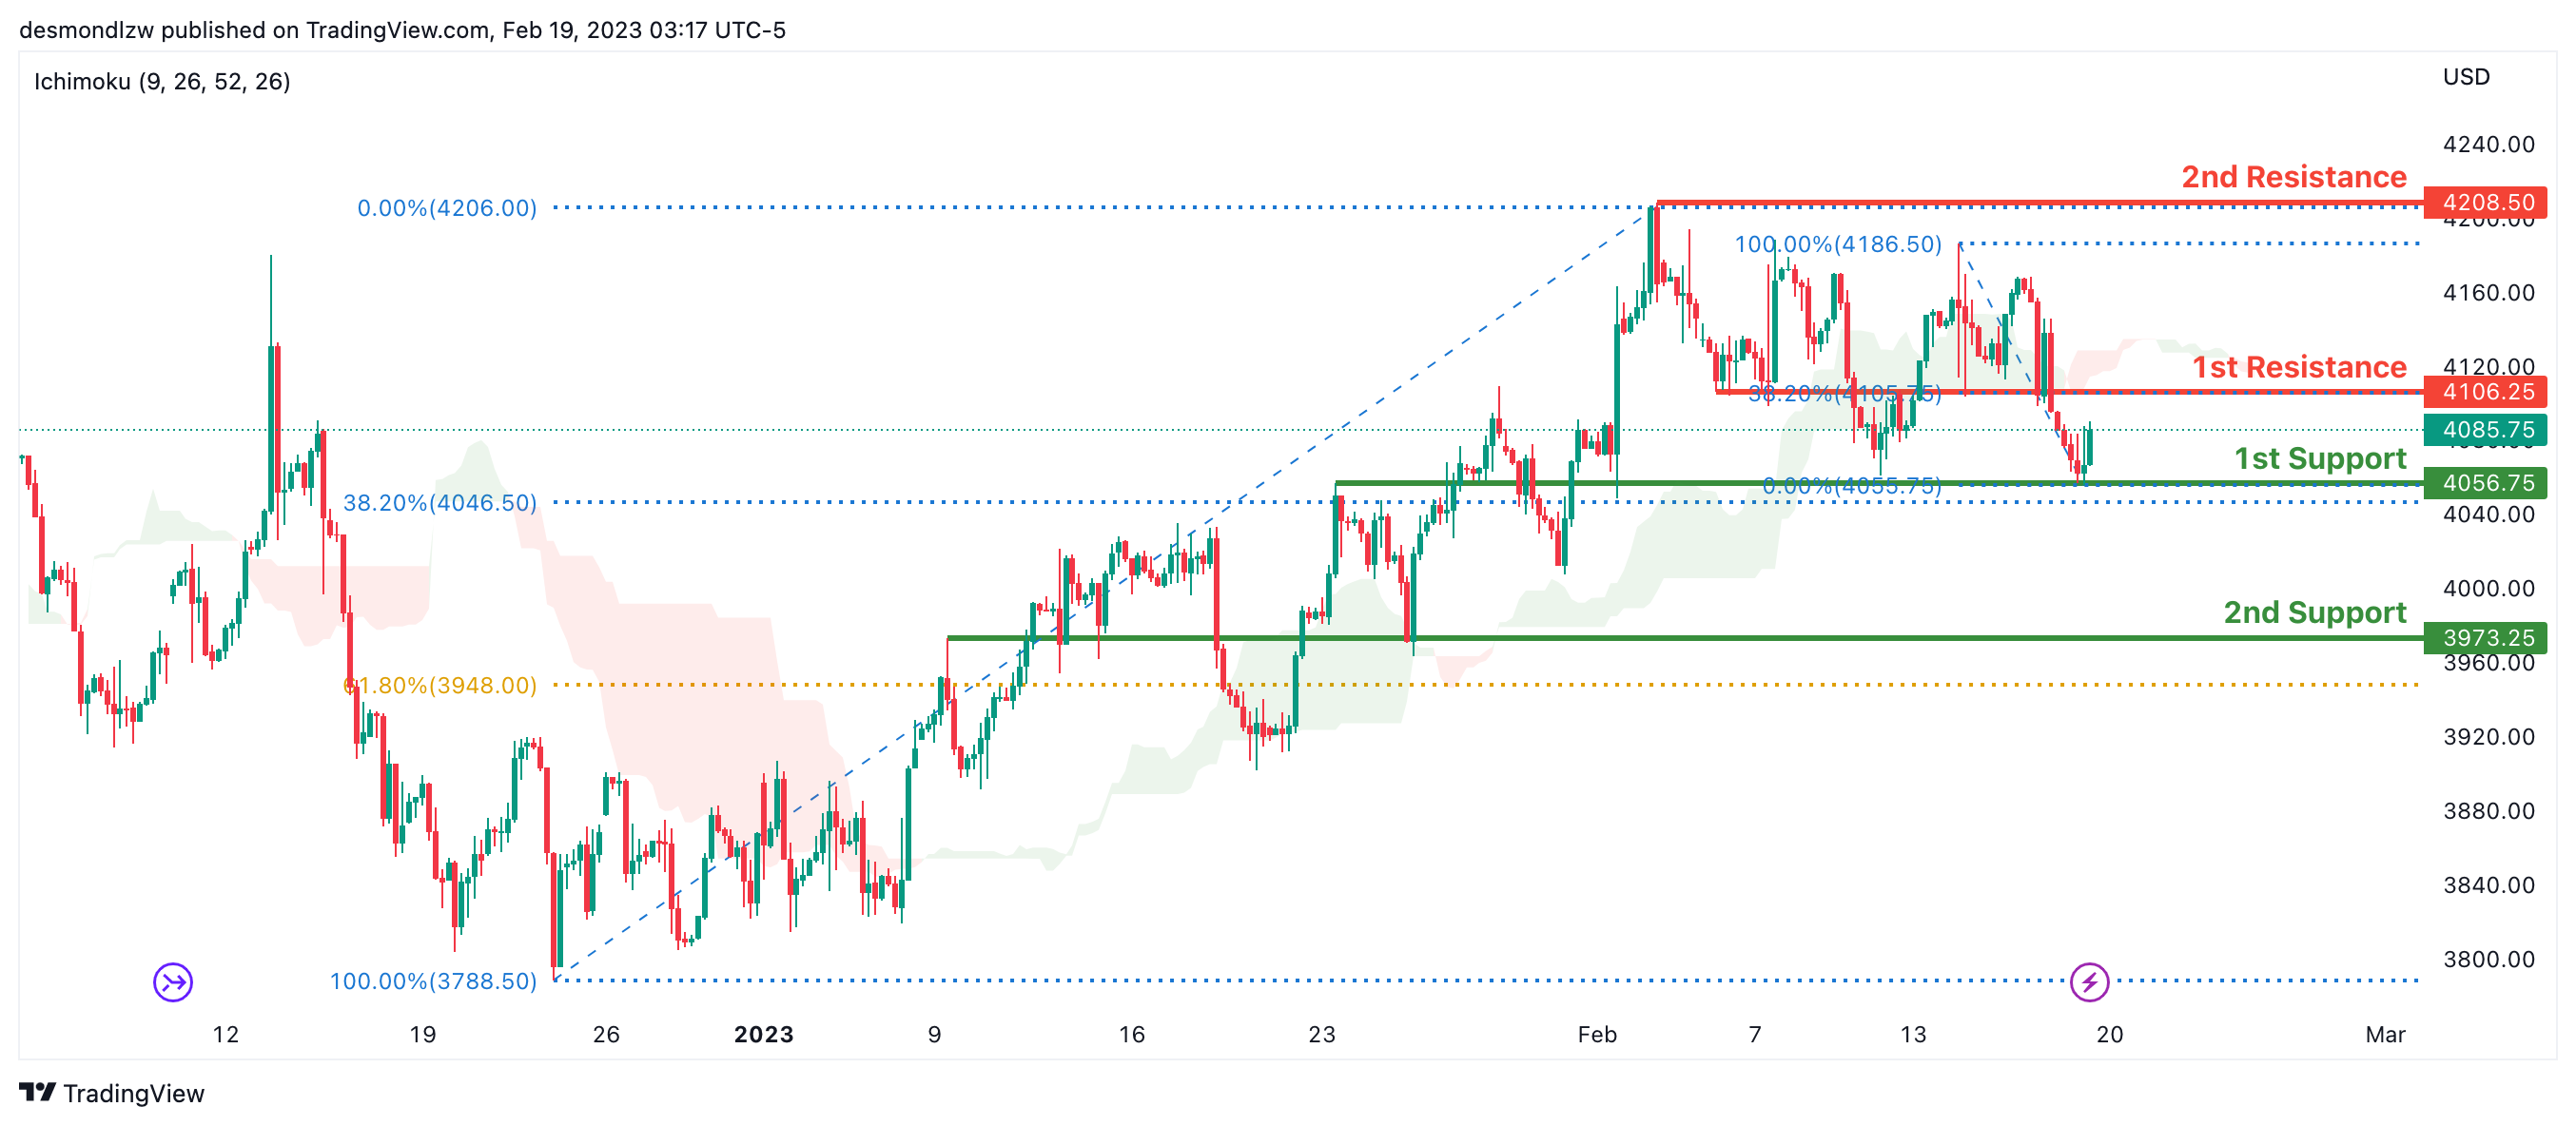
Looking at the H4 chart, my overall bias for S&P500 is bearish due to the current price being below the Ichimoku cloud, indicating a bearish market. If this bearish momentum continues, expect the price to possibly break the 1st support at 4056.75, where the overlap support and 38.2% Fibonacci line is, before heading towards the 2nd support at 3973.25 which is the overlap support and slightly above where the 61.8% Fibonacci line is.
In an alternative scenario, price could possibly head back up to retest the 1st resistance at 4106.25, where the overlap resistance and 38.2% Fibonacci line is.
Areas of consideration:
- H4 time frame, 1st support at 4056.75
- H4 time frame, 2nd support at 3973.25
- H4 time frame, 1st resistance at 4106.25
EUR/USD Recovery Attempt Could Face Hurdles
Key Highlights
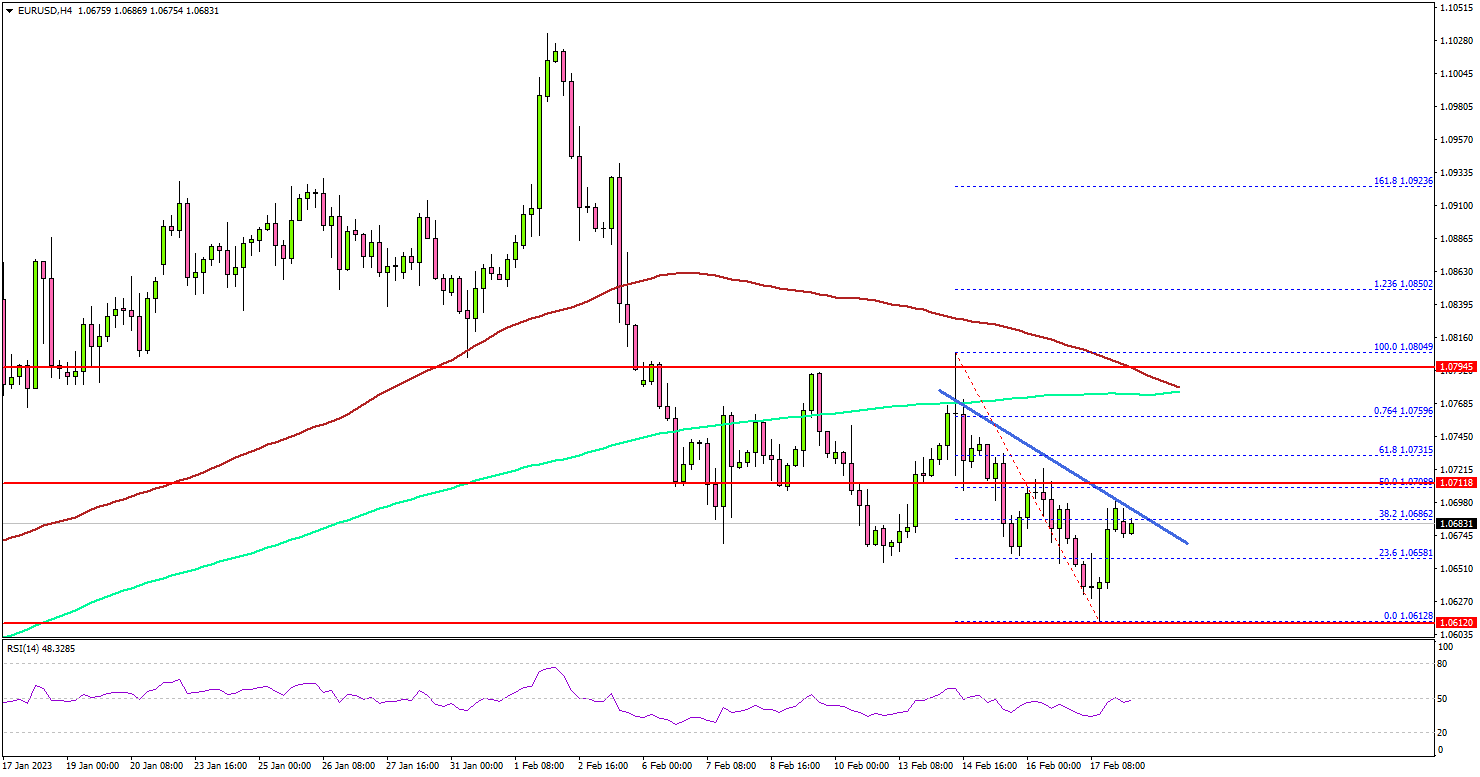
- EUR/USD traded as low as 1.0612 and is currently correcting losses.
- A key bearish trend line is forming with resistance near 1.0685 on the 4-hours chart.
- GBP/USD is struggling below the 1.2120 resistance zone.
- Gold price is attempting an upside break above the $1,840 resistance.
EUR/USD Technical Analysis
The Euro remained in a bearish zone below 1.0800 against the US Dollar. EUR/USD extended its decline below the 1.0700 level to move further into a bearish zone.
Looking at the 4-hours chart, the pair settled below the 1.0700 level, the 100 simple moving average (red, 4-hours), and the 200 simple moving average (green, 4-hours).
There was a clear move below the 1.0650 support zone. The pair traded as low as 1.0612 and is currently correcting losses. There was a minor increase above the 1.0640 and 1.0650 resistance levels.
However, the pair is now facing resistance near the 1.0685 level. There is also a key bearish trend line forming with resistance near 1.0685 on the same chart. The next major resistance is near the 1.0720 level.
A clear move above the 1.0720 resistance might start a steady increase towards the 1.0780 resistance zone. Any more gains could open the doors for a move towards the 1.0800 level, above which the bulls may perhaps aim a move towards the 1.0880 resistance.
On the downside, an immediate support is near the 1.0620 level. The next major support is near the 1.0600 level, below which there is a risk of a move towards the 1.0550.
Looking at GBP/USD, the pair is also trading in a similar fashion and might face a strong resistance near the 1.2120 and 1.2150 levels.
Economic Releases
Euro Zone Consumer Confidence for Feb 2023 (Preliminary) – Forecast -18.3, versus -20.9 previous.
USD/CNH extending rebound towards 6.9559 fibonacci level
Chinese Yuan weakened notably last week as the dispute with US over "spy balloons" continued. The meeting between US Secretary of State Antony Blinken and China's top diplomat Wang Yi in Munich yielded no results.
In a separate statement, China warned "If the U.S. insists on taking advantage of the (spy balloon) issue, escalating the hype, and expanding the situation, China will follow through to the end, and the U.S. will bear all the consequences."
In an interview with NBC, Blinken said "there was no apology" from China. "I told him quite simply that that was unacceptable and can never happen again," he said.
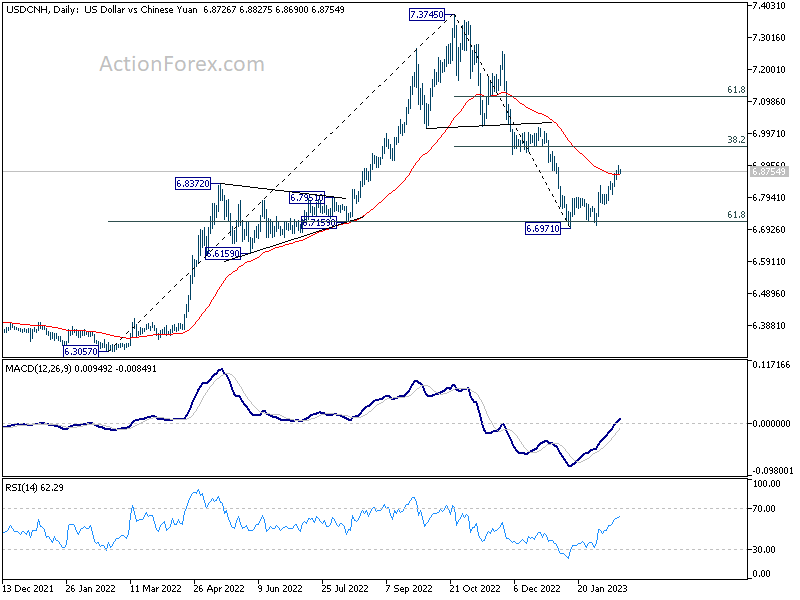
USD/CNH's down leg from 7.3745 should have completed at 6.6971. Further rebound should be seen to 38.2% retracement of 7.3745 to 6.6971 at 6.9559. Reaction from there would reveal whether USD/CNH is heading for another down leg through 6.6971, or stronger rise to 61.8% retracement at 7.1157.
A look at AUD/NZD, NZD/USD ahead of this week’s RBNZ
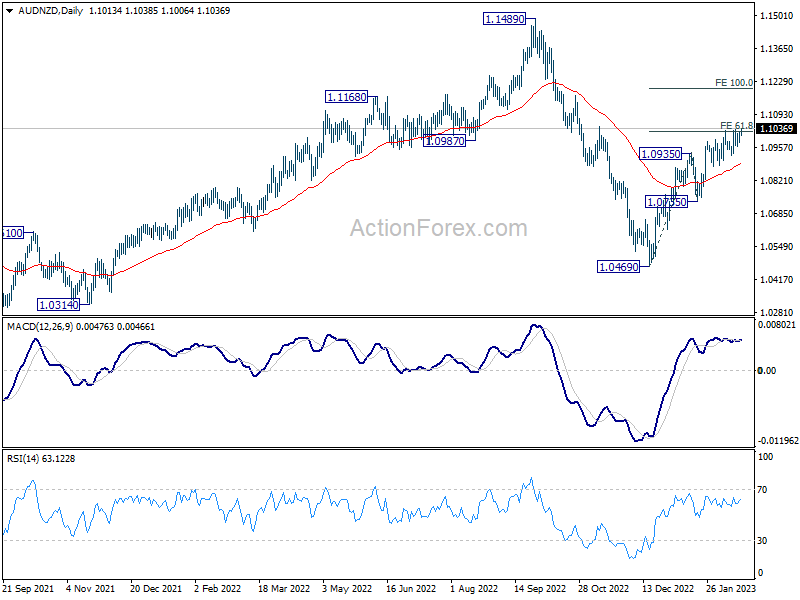
New Zealand Dollar is trading with a soft tone in Asian session today. While a rate hike is expected from RBNZ this week, there are chatters of the possibility of smaller hike, or even a pause, in response to the damage done by cyclone Gabrielle. There are also some speculations of a slight dovish twist which might signal a lower terminal rate. But traders will still need to wait for RBNZ Governor Adrian Orr's statement before making adjustment on their bets.
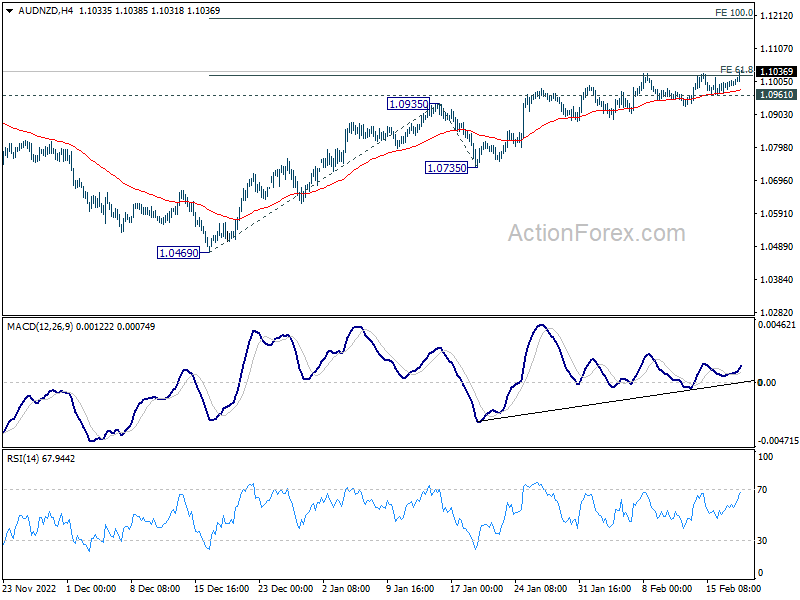
For now, AUD/NZD is extending the rally from 1.0469 despite loss of upside momentum. Further rise is expected as long as 1.0961 support holds. Sustained trading above 61.8% projection of 1.0469 to 1.0935 from 1.0735 at 1.1023 could prompt upside re-acceleration to 100% projection at 1.1201.
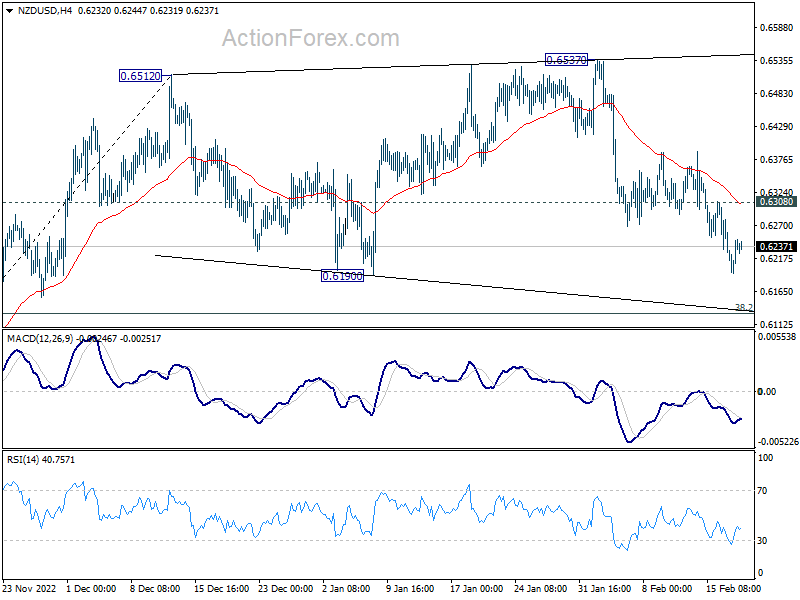
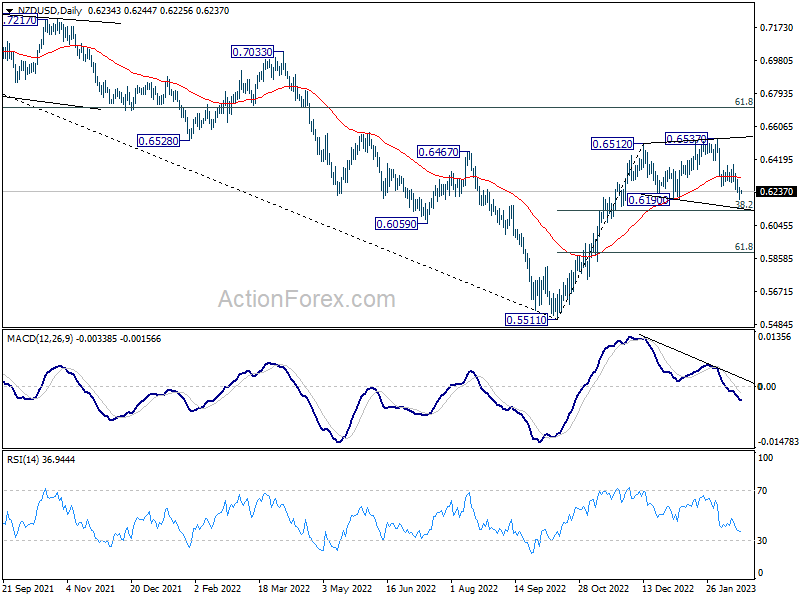
As for NZD/USD, it's still extending the fall from 0.6537, which is seen as the third leg of the consolidation pattern from 0.6512. Deeper decline is expected as long as 0.6308 minor resistance holds, for 38.2% retracement of 0.5511 to 0.6512 at 0.6130. But strong support should be seen there to bring rebound. However, sustained break of 0.6130 will raise the change of near term reversal and target 61.8% retracement at 0.5893.
Forex and Cryptocurrency Forecast
EUR/USD: The Fed Doesn't Hinder the US Economy
January data released on Tuesday, February 14 showed that the US Federal Reserve's victory over inflation is still very, very far away. The core Consumer Price Index (CPI) remained unchanged on a monthly basis at +0.4%. At the same time, although the annual data were slightly lower than the previous value: +6.4% against +6.5%, they exceeded the forecast of +6.2%. Another portion of American statistics came out the next day, February 15. After two months of decline, retail sales in the US showed the highest growth rate in almost 2 years, jumping from -1.1% in December to +3.0% in January (against the forecast of +1.8%).
The initial reaction to this was the strengthening of the dollar (the DXY index reached 104.1 points, the maximum since January 09), and a sharp drop in stock indices. Market participants decided that such macro statistics will force the Fed to further tighten monetary policy actively. If the peak value of the interest rate was predicted at 4.9% in early February with a subsequent decrease by 50 basis points (bp) by the end of the year, the peak is seen now at 5.25%, and a possible decrease only by 25 b.p. in 2023. At the same time, the probability that the rate will be increased three more times, in March, May and June, is 50%.
As already mentioned, the strengthening of the dollar and the sharp fall in stock indices was the first reaction of the market. But then there was an equally sharp reversal and the return of investor risk appetite. Stock indices went up. The market decided that if the US economy coped with the most aggressive interest rate hike in decades quite easily, it would cope with it in the future. Not only retail sales, but also other economic indicators show a convincing rise at the moment. Thus, employment grew by an impressive 517K new jobs, and the country's GDP, according to the leading indicator from the Atlanta Fed, may grow not by 2.2%, but by 2.4% in Q1 2023.
Then the market sentiment changed again. Another piece of statistics showed that the number of Americans who filed new applications for unemployment benefits fell unexpectedly, while producer prices (PPI) rose to a 7-month high in January. In this situation, market expectations regarding the further cycle of monetary restriction have again increased. S&P500, Dow Jones, and Nasdaq headed south together, while DXY headed north to a six-week high of 104.58. After that, on the eve of a long weekend in the US, the Dollar Index fell again to 103.85 points.
EUR/USD reacted accordingly to the volatile DXY fluctuations. As a result, having started last week at 1.0679, it ended it at 1.0694, that is, with almost zero results. At the time of writing the review (evening of February 17), 80% of analysts expect further strengthening of the dollar, 10% expect the strengthening of the euro, and the remaining 10% have taken a neutral position.
This time, the readings of the oscillators on D1 coincide with the opinion of analysts almost completely. 80% of them are colored red (20% signal that the pair is oversold), the remaining 20% are colored gray neutral. Among trend indicators, 60% recommend selling, 40% - buying. The nearest support for the pair is located in the zone 1.0600-1.0620, then there are levels and zones, 1.0560, 1.0500, 1.0440 and 1.0370-1.0400. The bulls will meet resistance in the area of 1.0700-1.0710, 1.0745-1.0760, 1.0800, 1.0865, 1.0895-1.0925, 1.0985-1.1030, 1.1110, after which they will try to gain a foothold in the 1.1260-1.1360 echelon.
The events of the coming week include the publication of business activity indicators (PMI) in Germany and the Eurozone on Tuesday, February 21. The value of the German Harmonized Consumer Price Index (CPI) will become known on Wednesday, February 22. Also on this day, the minutes of the last FOMC (Federal Open Market Committee) meeting will be published late in the evening. Volatility will be provided by data on inflation (CPI) of the Eurozone, as well as on unemployment and US GDP, on Thursday, February 23. We will find out German GDP indicators and statistics on consumer spending by American citizens at the very end of the working week, on Friday, February 24. Traders also need to keep in mind that Monday, February 20 is a day off in the US: the country celebrates President's Day.
GBP/USD: BoE Could Crash the Pound
The pound tried to win back part of its losses at the beginning of last week. GBP/USD, having bounced off the level of 1.2030 on February 13, reached a two-week high of 1.2270 the next day. Then, along with other currencies included in the DXY Index, the pound began to retreat against the dollar. As a result, the local minimum was fixed at 1.1915. This was followed by a return to the initial positions and GBP/USD ended the week at 1.2040.
Neither Inflation data nor data on unemployment in the UK helped the British currency (CPI fell to +10.1% in January against the forecast of +10.3% and +10.5% in December). The market also ignored retail sales statistics, although they rose by +0.5% in January against the forecast of -0.3% and the previous result of -1.2%. The news that the UK and the EU have achieved good results in the protracted Brexit negotiations did not have a noticeable effect on the dynamics of the pound either.
Much more important for the quotes of the British currency was macro statistics from the US, as well as expectations that the Bank of England (BoE) may soon reach the end of the rate hike cycle. "The Bank of England is clearly concerned that a significant rate hike could slow down the economy too much," Commerzbank economists wrote, explaining their bearish view of GBP's prospects, and colleagues from Singapore's United Overseas Bank agreed, according to them GBP/USD may retest the 1.1900 level in the near future.
If we talk about the median forecast of experts, 70% of them vote for the further weakening of the pound, 10% prefer to refrain from forecasts. Only 20% of analysts vote for the strengthening of the pound and the growth of the pair. Among the trend indicators on D1, the balance of power is 85% to 15% in favor of the reds. Reds have a 100% advantage among oscillators. Support levels and zones for the pair are 1.1990-1.2025, 1.1960, 1.1900-1.1915, 1.1840, 1.1800, 1.1720 and 1.1600. When the pair moves north, it will face resistance at the levels 1.2085, 1.2145, 1.2185-1.2210, 1.2270, 1.2335, 1.2390-1.2400, 1.2430-1.2450, 1.2510, 1.2575-1.2610, 1.2700, 1.2750 and 1.2940.
As far as the UK economy is concerned, Tuesday February 21 is of interest on the calendar for the upcoming week, when the country's business activity statistics (PMI) are released.
USD/JPY: Hopes for QT Remain
"The Japanese government has chosen Academician Kazuo Ueda as the new head of the Central Bank based on expectations of a stable inflation target along with a structural increase in wages," said Finance Minister Shunichi Suzuki. And it doesn't seem that this choice went in favor of the Japanese currency. Having started the week at 131.39, USD/JPY fixed a local high at 135.15, and set the last chord of the five-day period at 134.17.
Recall that 71-year-old Kazuo Ueda, a former professor at the University of Tokyo, joined the board of governors of BOJ a quarter of a century ago, in April 1998, and remained there until April 2005. Back in 2000, Ueda spoke out against the Central Bank's abandonment of the zero-rate policy. It seems that even now he will not rush to curtail the ultra-soft monetary policy. This is confirmed by Ueda himself, who stated on February 10 that the current policy of the regulator is adequate, and that it is necessary to continue to adhere to it.
Despite such statements, the question of what this policy will be like under the new leader remains open at the moment. The majority of experts (60%) have taken a wait-and-see attitude. 15% are counting on the growth of USD/JPY in the near future, and 25% expect it to fall. If we talk about a three-month perspective, only 10% of analysts talk about a further weakening of the Japanese currency, 25% are still neutral, but 65% are waiting for tightening monetary policy (QT) and strengthening the yen, contrary to the statements of Kazuo Ueda.
For example, Danske Bank economists predict that the USD/JPY rate will fall and reach 125.00 in three months. A similar position is shared by strategists at BNP Paribas Research. "We expect the strength of the US dollar to end up short-lived," they say. "We believe that the US dollar has entered a multi-year bearish trend, and portfolio flows are becoming increasingly negative for the currency." BNP Paribas predicts that positive yields in Japan could encourage the repatriation of funds by local investors, as a result of which USD/JPY will fall to 121.00 by the end of 2023.
Among the oscillators on D1, 100% points north (15% of them are in the overbought zone). For trend indicators, 75% look north, and 25% look in the opposite direction. The nearest level of support is located in zone 134.00, followed by levels and zones 133.60, 132.80-133.20, 131.85-132.00, 131.25 130.50, 129.70-130.00, 128.90-129.00, 128.50, 127.75-128.10, 127.00-127.25 and 125.00. Levels and resistance zones are 134.40, 134.75-135.10, 135.60, 136.00, 137.50, 139.35, 140.60, 143.75.
No important macro data on the state of the Japanese economy is expected this week. In addition, it must be borne in mind that Thursday, February 23, is a day off in Japan, the country celebrates the Emperor's Birthday.
CRYPTOCURRENCIES: Five Reasons for BTC's Growth
The topic of regulating the cryptocurrency market has been getting louder and louder since last spring. Many influencers argue that one can count on a massive influx of funds from institutional investors only if a clear regulatory framework is in place. Here is just one of the latest statements by MicroStrategy co-founder Michael Saylor. "What is really needed," he said, "is oversight. [...] Clear guidance from Congress is needed. We need clear rules of conduct from the SEC (Securities and Exchange Commission) of the United States." And it must be said that such calls from representatives of big capital respond to the minds and actions of government officials. For example, Senator Elizabeth Warren is already actively recruiting conservative Republicans in the US Senate to support her bills, which significantly tighten the regulation of the crypto industry.
We note that the tragic events of 2022, caused by the collapse of a number of leading representatives of the industry, caused a sharp surge in the activity of US supervisory authorities. And the regulators began to work with redoubled energy this year. To begin with, they attacked the Kraken crypto exchange, which was actually banned from providing staking services. But the truck did not stop there and ran into the infrastructure company Paxos, which is responsible for issuing USDP, PAXG and Binance BUSD stablecoin. This is an investigation launched by the New York State Department of Financial Services (NYDFS) against this company. The regulator later ordered the firm to stop issuing the BUSD stablecoin. The SEC also announced its readiness to sue Paxos.
This situation led to a massive outflow of funds from the stablecoin. Many users have started exchanging BUSD for USDT. But it's still half the trouble. Some frightened users simply decided to leave Binance. On February 14 alone, the net outflow of funds from this exchange amounted to $831 million, a record since the collapse of FTX.
Binance CEO Changpeng Zhao responded to pressure from the US authorities by calling on industry participants to consider moving to another country. He considers Dubai (UAE), Bahrain and France to be jurisdictions with favorable regulation. The CEO of Binance was supported by Uniswap founder Hayden Adams. "It's a shame to watch the US efforts in the cryptosphere," he wrote. "Innovative companies get an additional incentive to go abroad. It's as if the government banned the development of the Internet 30 years ago."
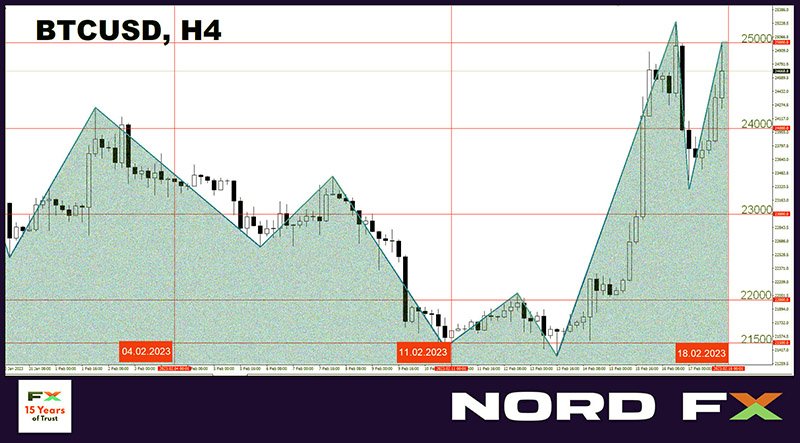
Surprisingly, against this frankly negative background, the price of bitcoin went up, reaching $25.241 on February 16. The last time BTC/USD climbed this high was in mid-August 2022. There have been several reasons for the current rally.
The first of these, paradoxically, is the mentioned attack by the NYFDS and SEC on Kraken and Paxos. US regulators treat PoS coins as toxic assets due to passive income from staking (expectation of profit). Based on this, such coins can receive the status of a security, with all the ensuing legal consequences. Bitcoin, on the other hand, is still the result of the work of miners, which allows it to avoid (at least for now) a similar fate. The network hashrate continues to set records.
Another driver for the growth (and subsequent fall) of digital "gold" quotes is its correlation with the stock market ( S&P500, Dow Jones and Nasdaq).
The third reason is that the main cryptocurrency was oversold in 2022, which caused the average production cost to fall below the market price. And most of the miners were forced to sell off BTC stocks in order to cover operating costs and ensure payments on accounts payable.
The next reason is the Ordinals protocol launched at the end of January, which allows not only to conduct financial transactions in the bitcoin network, but also to transfer any digital objects, including images, audio and video files. The launch of this protocol also resulted in an increase in network activity. The number of non-zero wallets set a new record, and miners received $876,000 in additional income in the form of commissions in less than a month.
The beginning of the BTC rally forced short-term speculators to close short positions, which further stimulated the growth of bitcoin. And that was reason number five.
According to Glassnode specialists, the current fair value of the flagship cryptocurrency is $33,000. This is the figure bitcoin should aim for. A similar figure of $30,000 is cited by Kaleo, a popular analyst with 563,000 Twitter followers. His forecast for the leading altcoin was also quite optimistic. According to Kaleo calculations, the target level for ETH/USD is located in the $3,000 area. Former Goldman Sachs CEO Raoul Pal also gave his forecast for ethereum, setting a target price of this coin around $10,000. Although, such growth will take more time of course.
If we talk about a three-year horizon, according to well-known analyst Willy Woo, the number of users of the first cryptocurrency will grow from the current over 300 million to 1 billion during this time. This will approximately correspond to 12% of the world's population. Willy Woo recalled that it took six months for bitcoin to form an audience of the first 1,000 users. It took five years for that number to rise to 1 million. The network achieved its current figures of more than 300 million, 13.8 years after the formation of the genesis block.
SkyBridge Capital hedge fund founder Anthony Scaramucci called 2023 a "recovery year" for bitcoin. However, his forecast looks rather modest. In his opinion, the value of BTC may "only" double over the next two to three years, up to $50,000.
As for another influencer, best-selling author of Rich Dad Poor Dad, Robert Kiyosaki, he claims that bitcoin will rise to a fantastic $500,000 by 2025. "A giant crash is coming. Depression is possible. The Fed has been forced to print billions in counterfeit money. Gold will be at $5,000, silver at $500, and bitcoin at $500,000 by 2025," Kiyosaki wrote. And he added that gold and silver are the money of the gods, and bitcoin is like a dollar for ordinary people.
Risky assets sank sharply down in the last days of the past week. Following the stock indices, the quotes of crypto-currencies also fell, but then recovered quite quickly. At the time of writing this review (Friday evening, February 16), BTC/USD is trading in the $24,600 zone. The total capitalization of the crypto market is $1.106 trillion ($1.010 trillion a week ago). The Crypto Fear & Greed Index rose from 48 to 61 points in a week and moved from the Neutral zone to the Greed zone.
EUR/USD Weekly Outlook
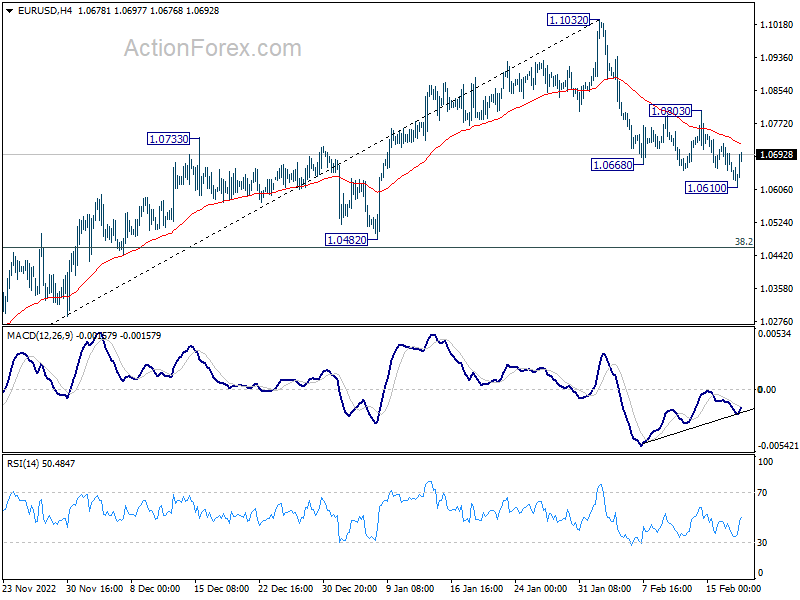
EUR/USD's decline from 1.1032 resumed last week and dipped to 1.0610. But subsequent recovery indicates that a temporary low was formed. Initial bias is turned neutral this week first. Risk will stay on the downside as long as 1.0803 resistance holds. Below 1.0610 will target 38.2% retracement of 0.9534 to 1.1032 at 1.0463. Strong support should be seen around there to bring rebound, at least on first attempt.
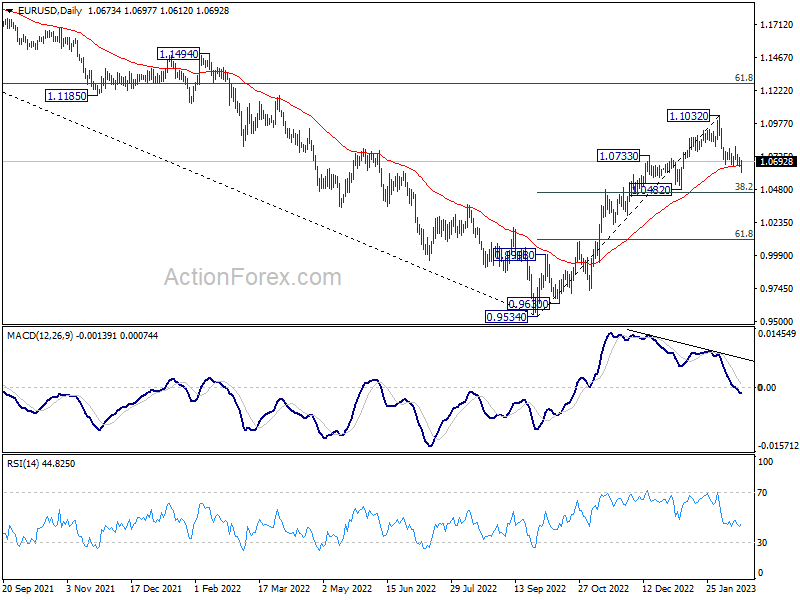
In the bigger picture, the rally from 0.9534 low (2022 low) is a medium term up trend rather than a correction. Further rise is in favor to 61.8% retracement of 1.2348 (2021 high) to 0.9534 at 1.1273 next. This will remain the favored case as long as 1.0482 support holds.
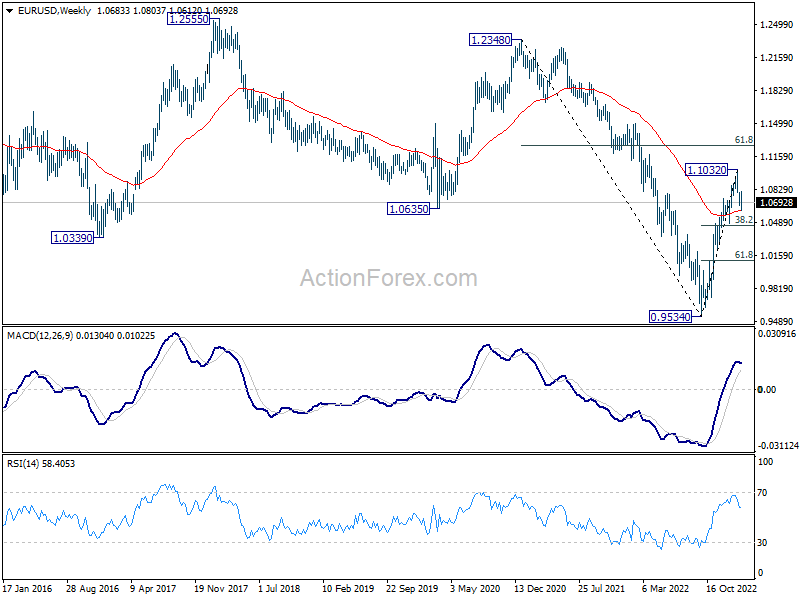
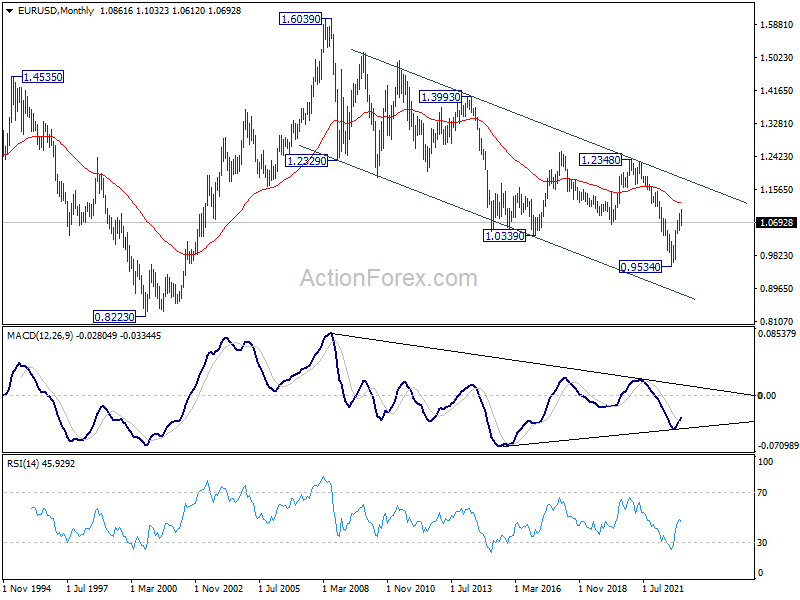
In the long term picture, while it's too early to call for long term trend reversal at this point, the strong break of 1.0635 support turned resistance (2020 low) should at least turn outlook neutral. Focus will turn to 55 month EMA (now at 1.1189). Rejection by this EMA will revive long term bearishness.
USD/JPY Weekly Outlook
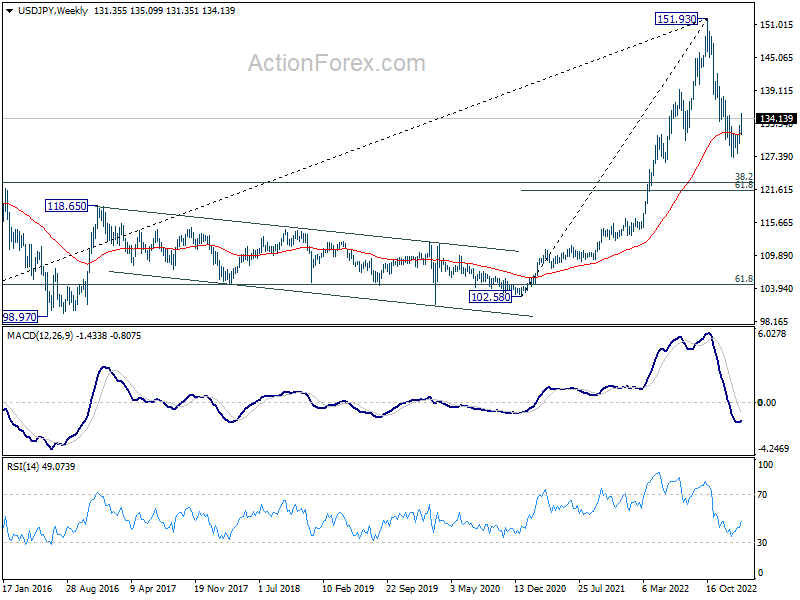
USD/JPY's rebound from 127.20 resumed last week and reached 135.09. But subsequent retreat indicates that a temporary top was formed. Initial bias is turned neutral this week first. On the upside, break of 135.09 will resume the rise to 38.2% retracement of 151.93 to 127.20 at 136.64. Strong resistance could be seen there to complete the corrective rise. On the downside, break of 132.89 will bring deeper fall to 129.79 support.
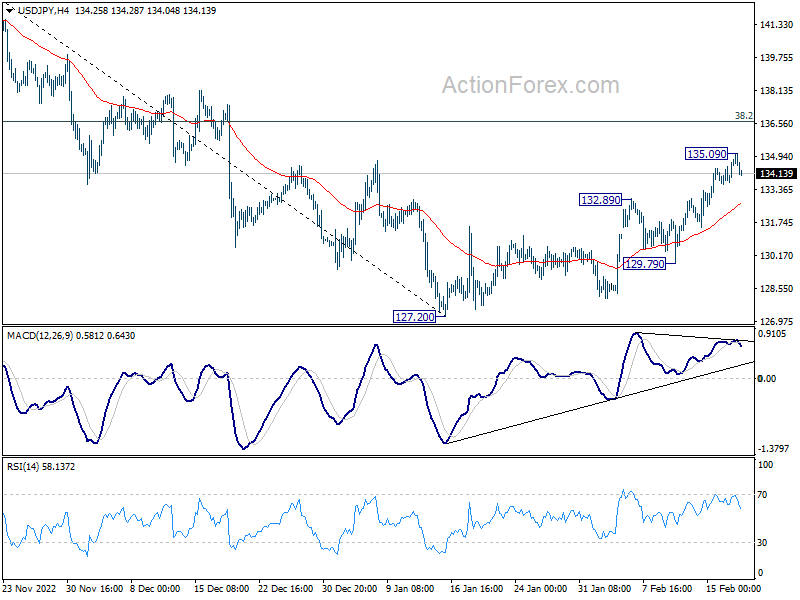
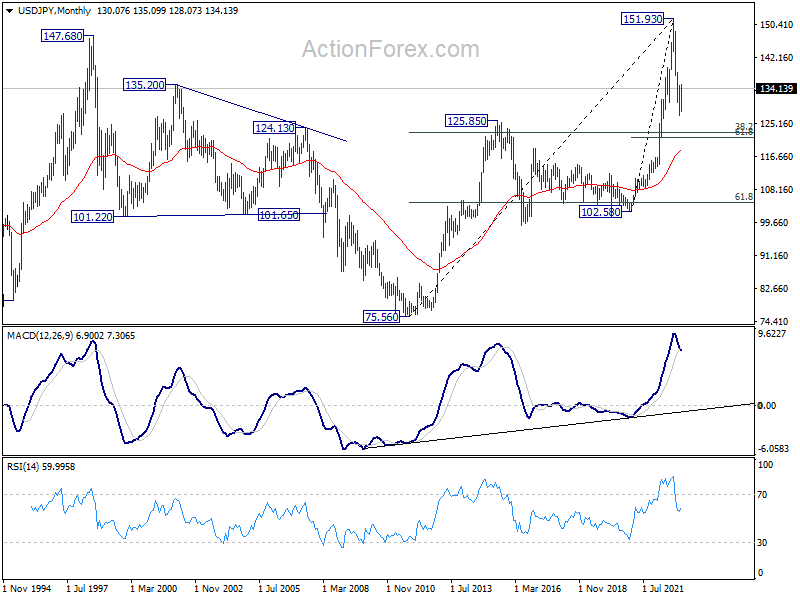
In the bigger picture, prior of 55 week EMA (now at 131.47) raises the chance of medium term bearish reversal, but that's not confirmed yet. Strong rebound from current level, followed by sustained break of 38.2% retracement of 151.93 to 127.20 at 136.64 will argue that price actions from 151.93 is merely a corrective pattern. However, rejection by 136.64 will solidify medium term bearishness for 61.8% retracement of 102.58 to 151.93 at 121.43 and 38.2% retracement of 75.56 to 151.93 at 122.75.
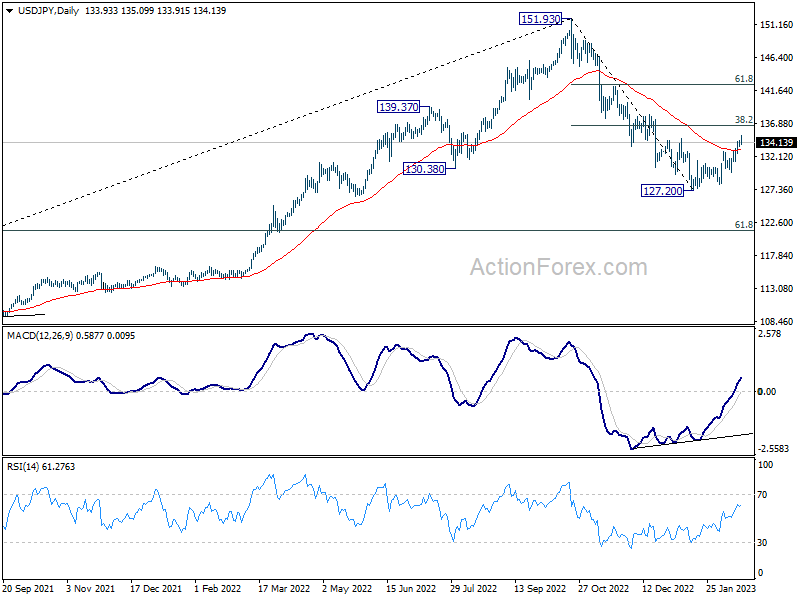
In the long term picture, 151.93 looks increasingly likely a major top. But it's too early to call for long term bearish reversal at this point. Rebound from around 38.2% retracement of 75.56 to 151.93 at 122.75 will keep the case open for price action from 151.93 to be just a corrective pattern.