

Sample Category Title
GBP/USD Weekly Outlook
GBP/USD's decline from 1.2446, the third leg of the corrective pattern from 1.2445, resumed last week by breaking through 1.1960. But recovery from 1.1914 indicates that a temporary low was formed. Initial bias is turned neutral this week first. Risk will stay on the downside as long as 1.2269 resistance holds. Break of 1.1914 will target 1.1840 support and possibly below.
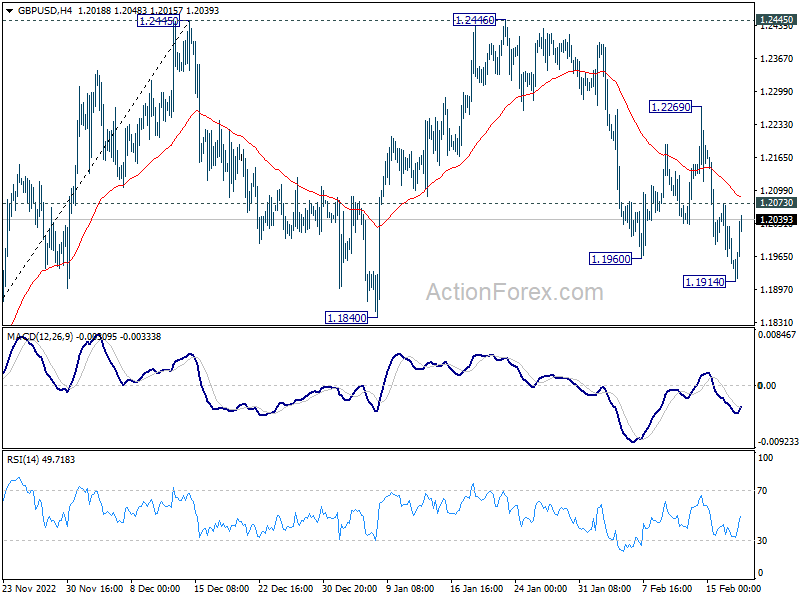
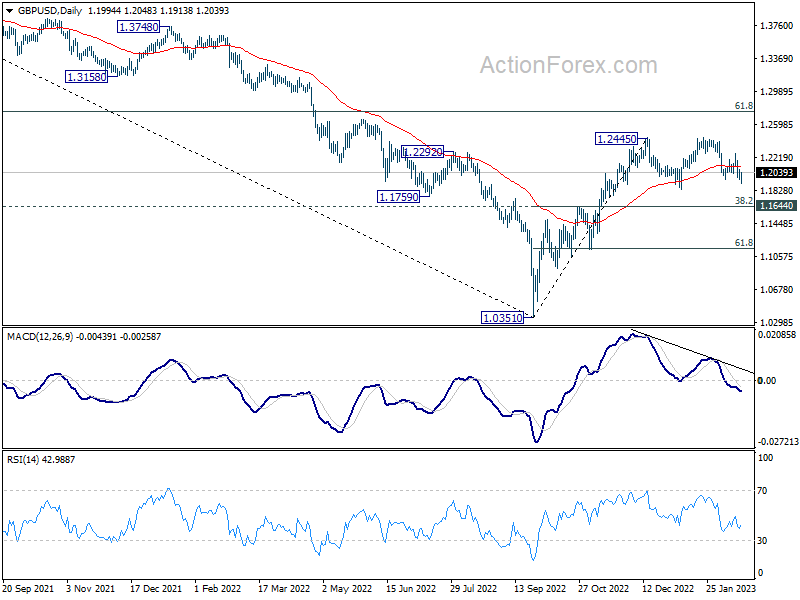
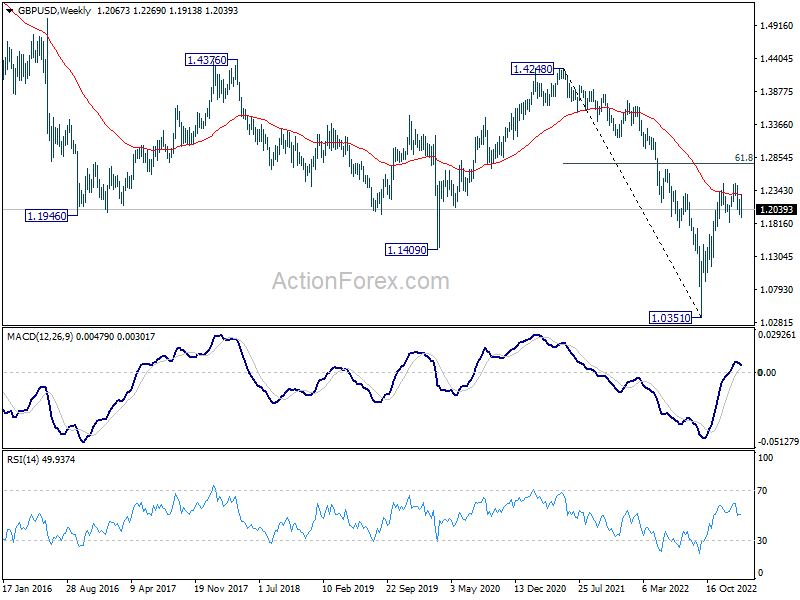
In the bigger picture, rise from 1.0351 medium term bottom is at least correcting whole down trend from 1.4248 (2021 high). Further rise is expected as long as 1.1644 resistance turned support holds. Next target is 61.8% retracement of 1.4248 to 1.0351 at 1.2759. Sustained break there will pave the way back to 1.4248.
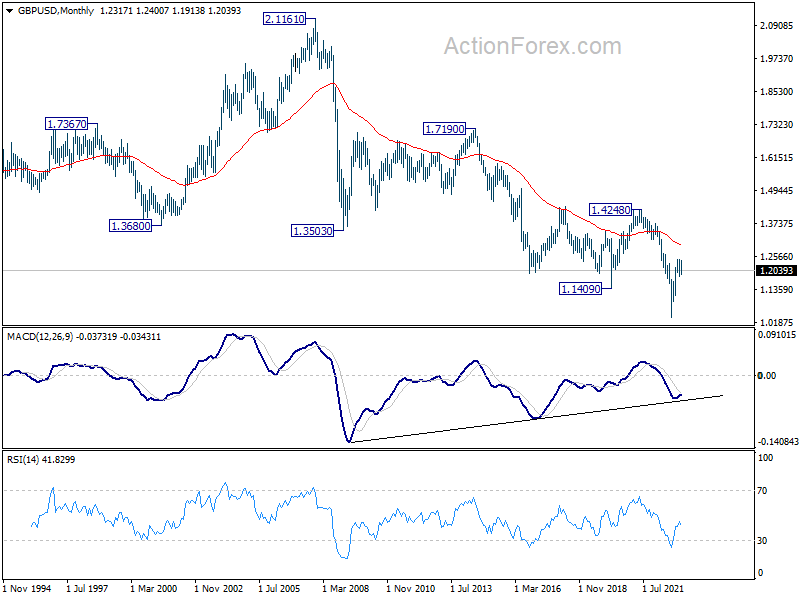
In the longer term picture, as long as 1.4248 resistance holds (2021 high), long term outlook will remain neutral at best. Down trend from 2.1161 (2007) could still resume for another low through 1.0351 at a later stage.
USD/CHF Weekly Outlook
USD/CHF's rebound form 0.9058 resumed last week and rose to 0.9331. But subsequent retreat suggests temporary topping. Initial bias is turned neutral this week first. On the upside, break of 0.9331 will resume the rebound to 38.2% retracement of 1.0146 to 0.9058 at 0.9474. However, break of 0.9135 will indicate that the rebound has completed and bring retest of 0.9058 low.
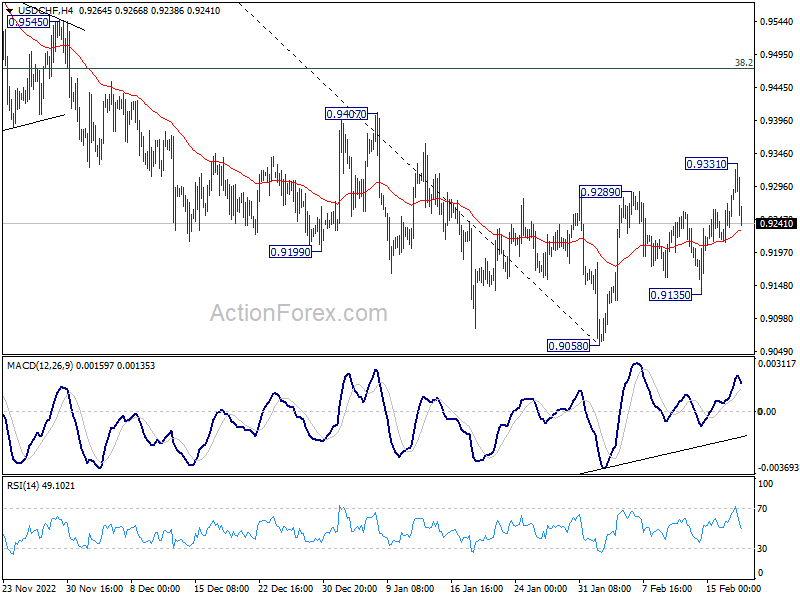
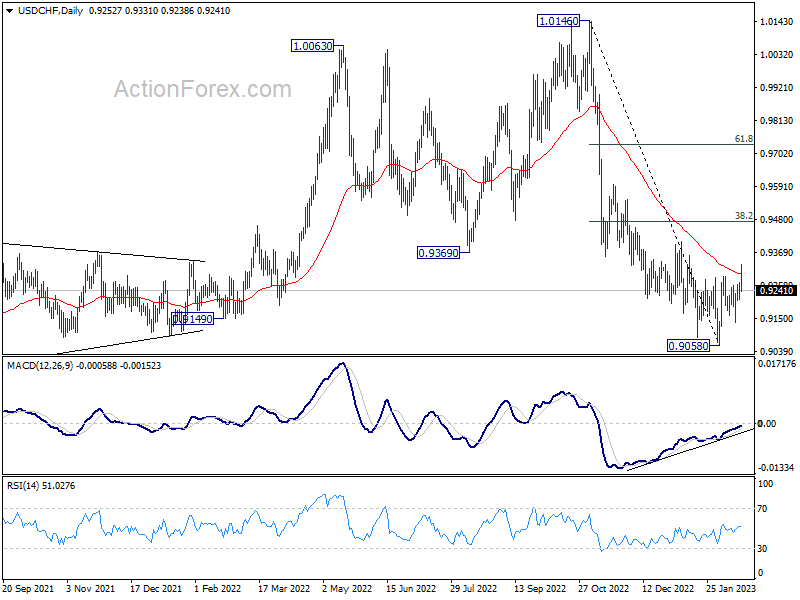
In the bigger picture, decline from 1.0146 is seen as part of a long term sideway pattern. As long as 38.2% retracement of 1.0146 to 0.9058 at 0.9474 holds, another fall is in favor through 0.9058. However, sustained trading above 0.9474 will indicate that the medium term trend has reversed, and open up further rally to 1.0146 again.
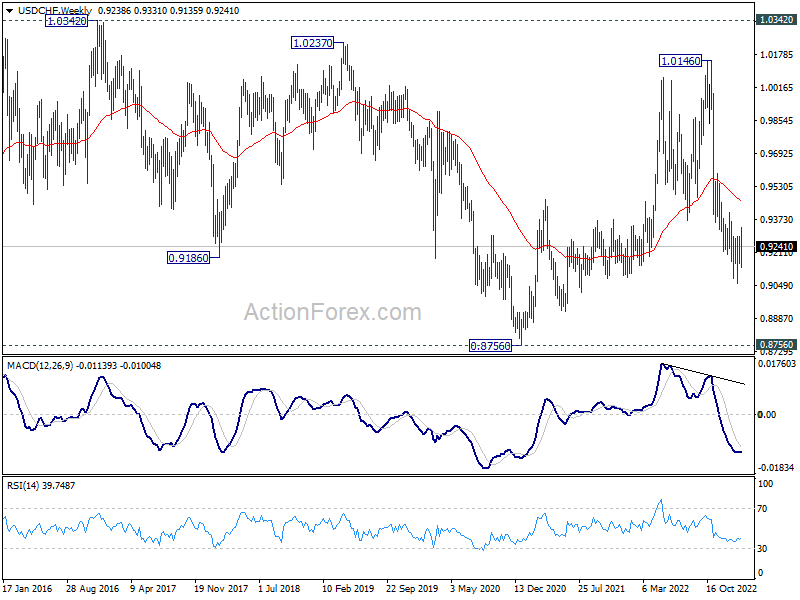
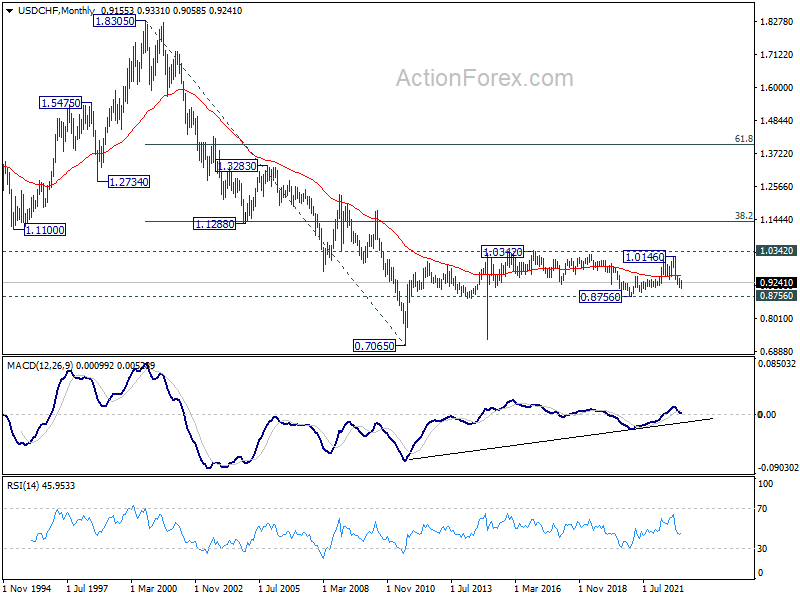
In the long term picture, long term sideway pattern from 1.0342 (2016 high) is extending and it's probably in another medium term down leg. Downside will likely be contained by 0.8756 support in case of deeper fall. Overall, range trading should continue until further development.
AUD/USD Weekly Report
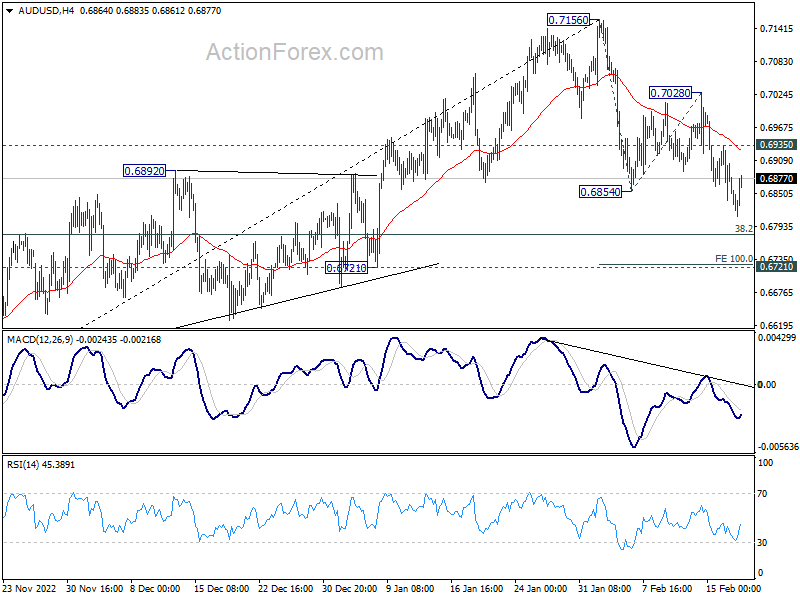
AUD/USD's corrective fall from 0.7156 resumed last week by breaking 0.6854. Initial bias stays on the downside this week for 100% projection of 0.6854 to 0.7028 from 0.6854 at 0.6736, which is close to 0.6721 key structural support. Strong support is expected there to bring rebound. On the upside, above 0.6935 minor resistance will turn intraday bias neutral first. But risk will stay mildly on the downside as long as 0.7028 resistance holds.
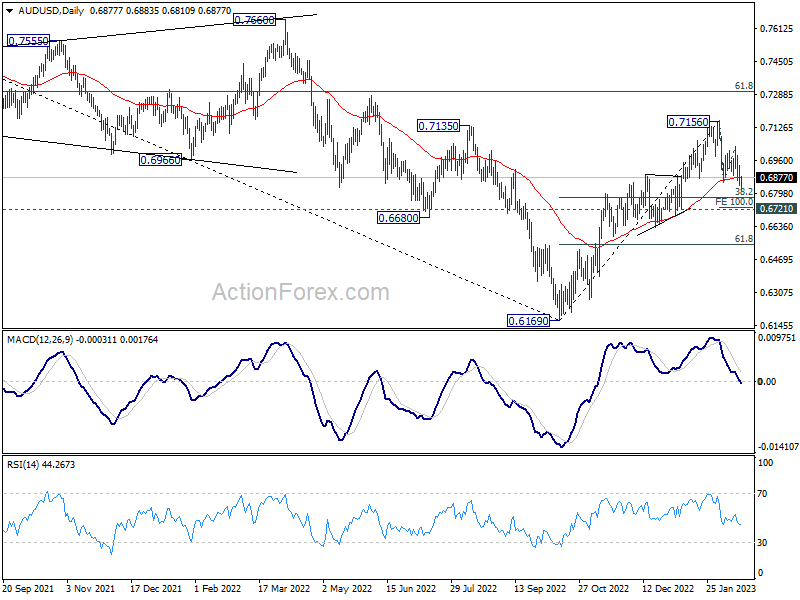
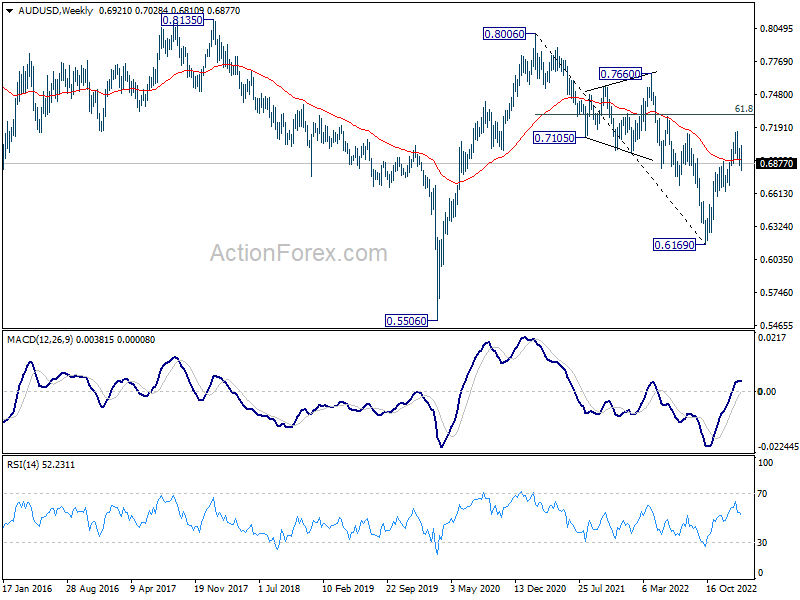
In the bigger picture, corrective decline from 0.8006 (2021 high) should have completed with three waves down to 0.6169 (2022 low). Further rally should be seen to 61.8% retracement of 0.8006 to 0.6169 at 0.7304. Sustained break there will pave the way to retest 0.8006. This will now remain the favored case as long as 0.6721 support holds.
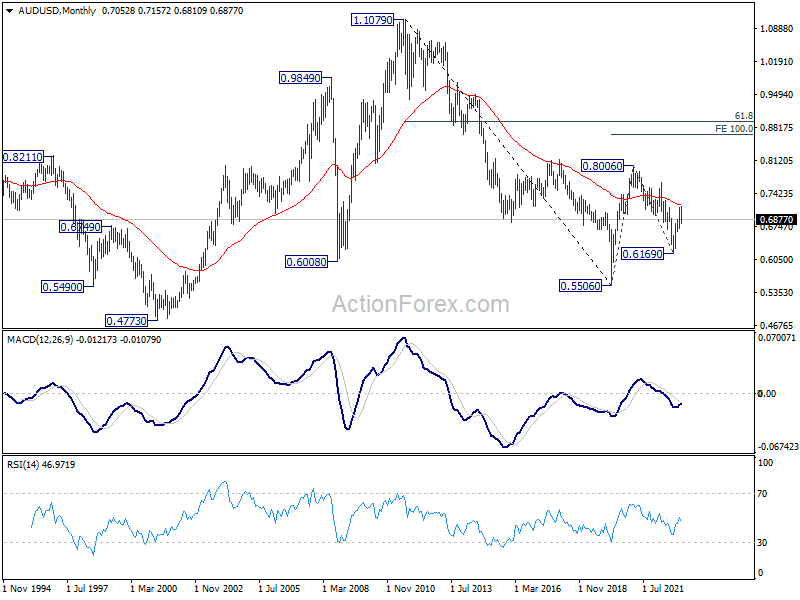
In the long term picture, current development suggests that fall from 0.8006 was merely a correction to the rise from 0.5506 (2020 low). Sustained trading above 55 month EMA (now at 0.7196) will raise the chance of up trend resumption through 0.8006 at a later stage.
USD/CAD Weekly Outlook
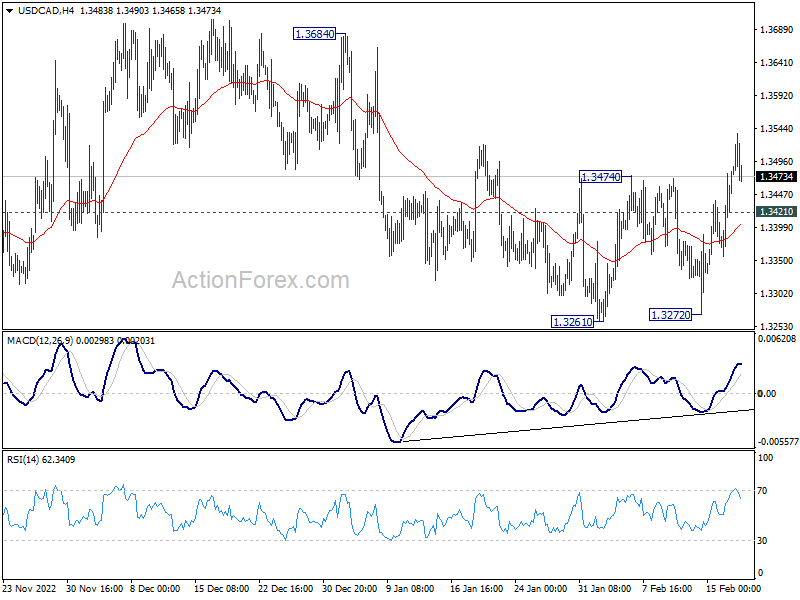
USD/CAD's break of 1.3474 resistance last week confirmed short term bottoming at 1.3261. More importantly, the corrective pattern from 1.3976 should have completed too. Initial bias stays on the upside this week for 1.3684 resistance. Firm break there will bring retest 1.3976 high. Nevertheless, break of 1.3421 minor support will dampen this bullish case and turn intraday bias neutral again.
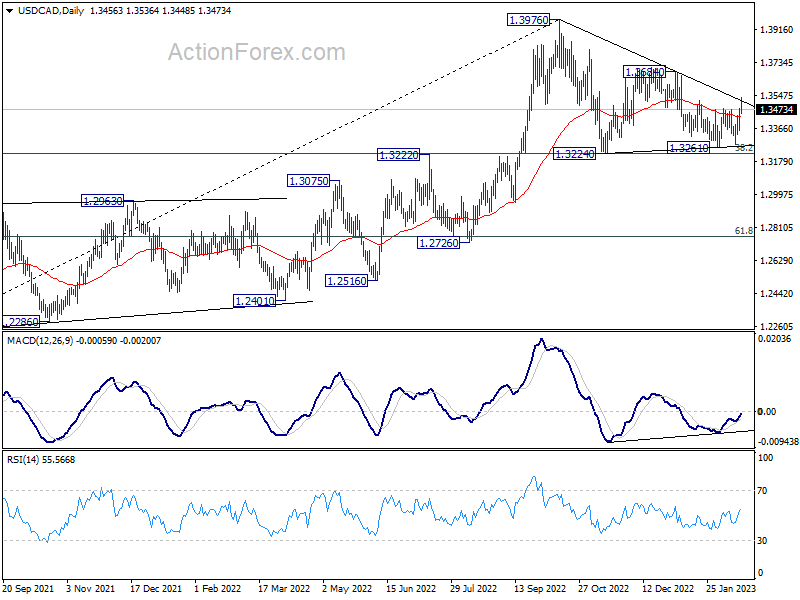
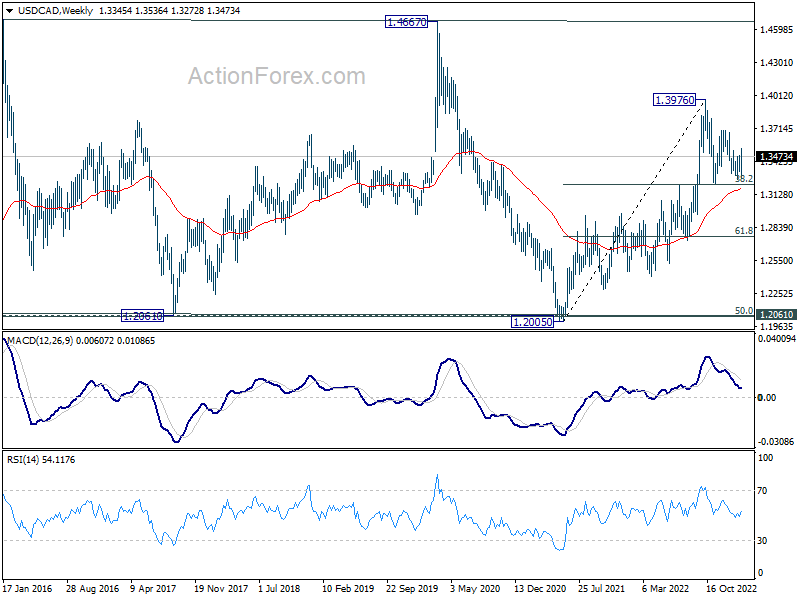
In the bigger picture, as long as 1.3222 cluster support (38.2% retracement of 1.2005 to 1.3976 at 1.3223) holds, larger up trend from 1.2005 (2021 low) is still expected to resume through 1.3976 high at a later stage. However, firm break of 1.3222/3 will indicate that the trend might have reversed. Deeper fall would be seen to next cluster support at 1.2726 (61.8% retracement at 1.2758).
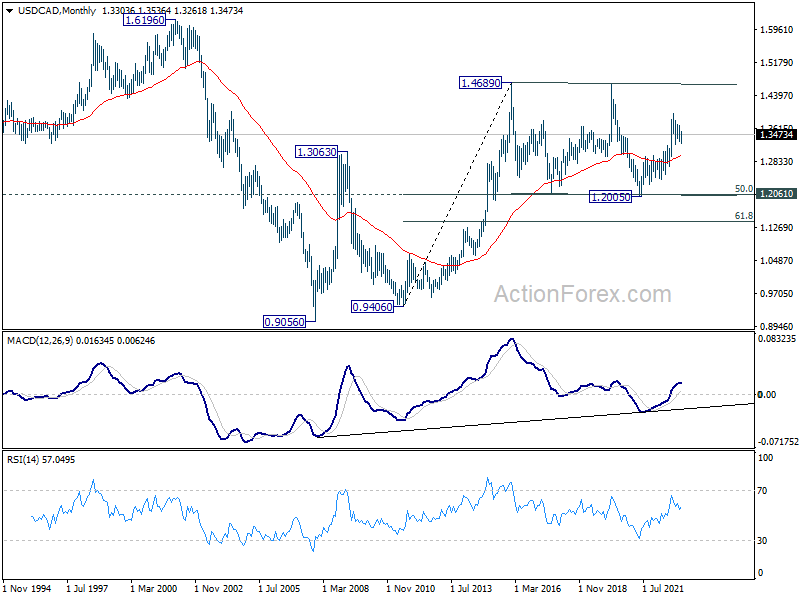
In the longer term picture, price actions from 1.4689 (2016 high) are seen as a consolidation pattern only, which might have completed at 1.2005. That is, up trend from 0.9506 (2007 low) is expected to resume at a later stage. This will remain the favored case as 55 month EMA (now at 1.2967) holds.
GBP/JPY Weekly Outlook
GBP/JPY failed to sustain above 161.80 resistance despite rally attempt. Initial bias remains neutral this week first. On the upside, decisive break of 161.80 will argue that whole correction from 172.11 has completed at 55.33. Further rally should be seen back to 169.26/172.11 resistance zone. On the downside, break of 155.33 low will resume the fall from 172.11 to 153.70 fibonacci level next.
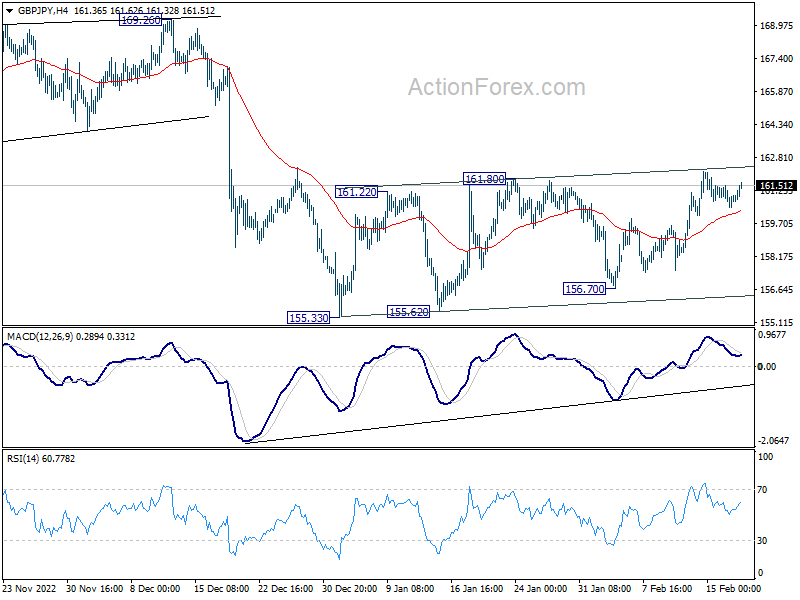
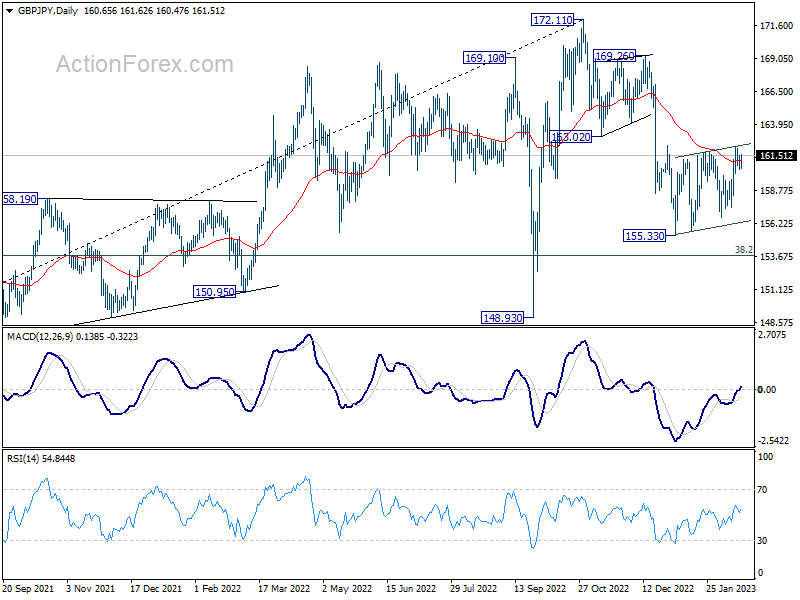
In the bigger picture, as long as 163.02 support turned resistance holds, decline from 172.11 medium term top is expected to continue to 38.2% retracement of 123.94 to 172.11 at 153.70. Sustained break there will raise the change of trend reversal and target 61.8% retracement at 142.34. Nevertheless, break of 163.02 support turned resistance will argue that the decline has completed, and retain medium term bullishness.
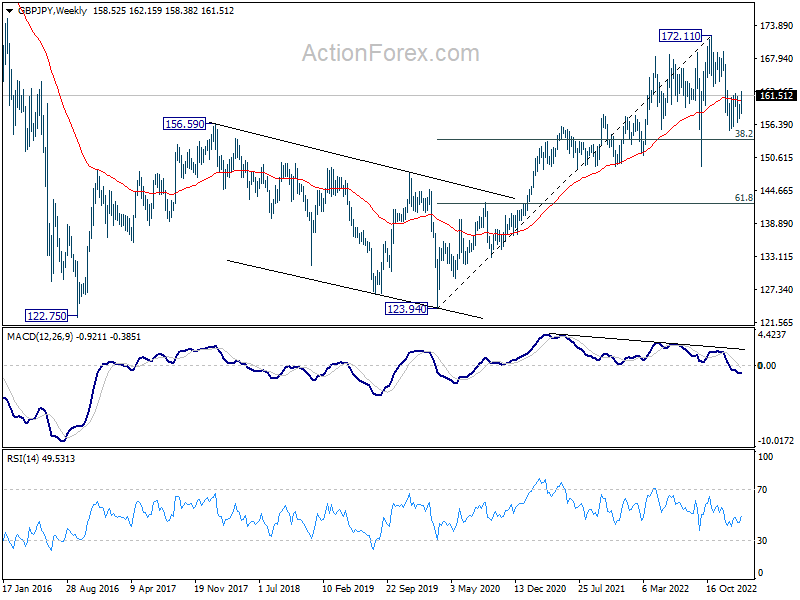
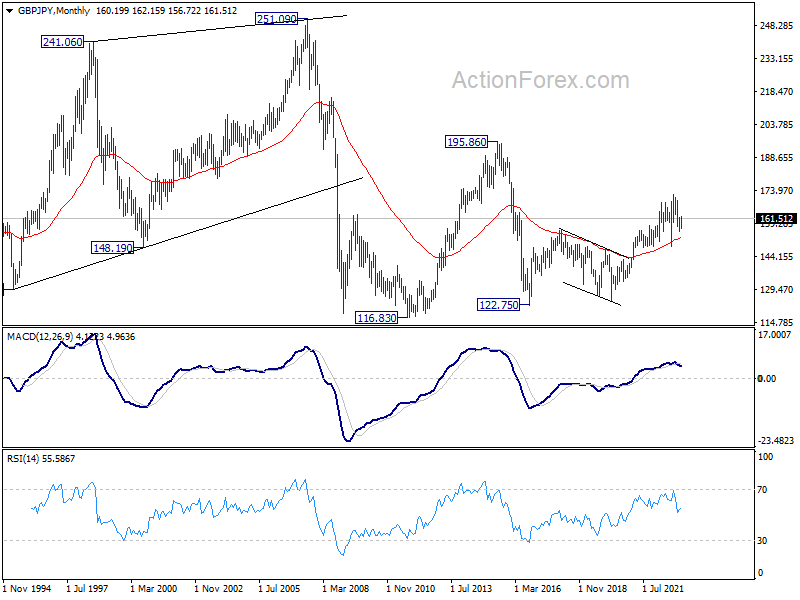
In the longer term picture, as long as 55 month EMA (now at 152.70) holds, rise from 122.75 could still extend higher at a later stage.
EUR/JPY Weekly Outlook
EUR/JPY's break of 142.84 resistance argues that corrective fall from 148.38 has completed at 137.37. Initial bias stays on the upside for further rally to 146.71 resistance. On the downside, though, below 142.33 minor support will dampen this bullish view, and turn intraday bias neutral again.
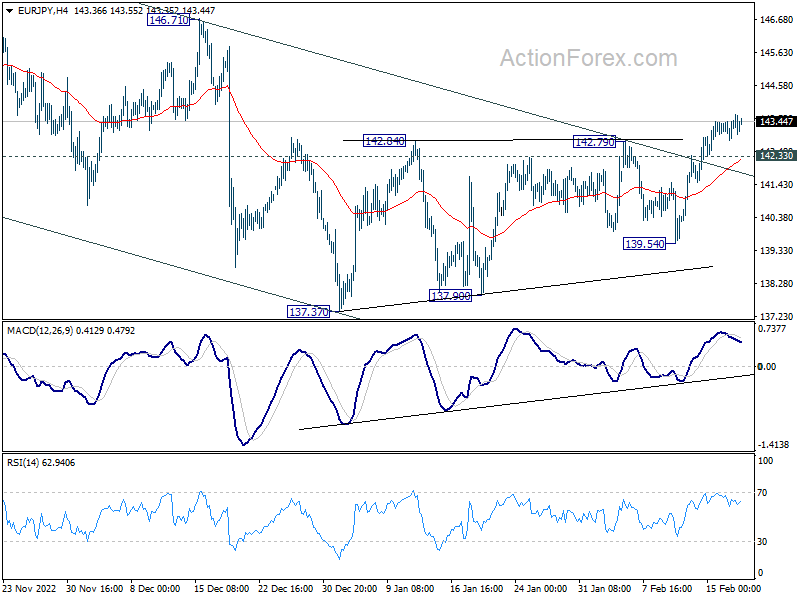
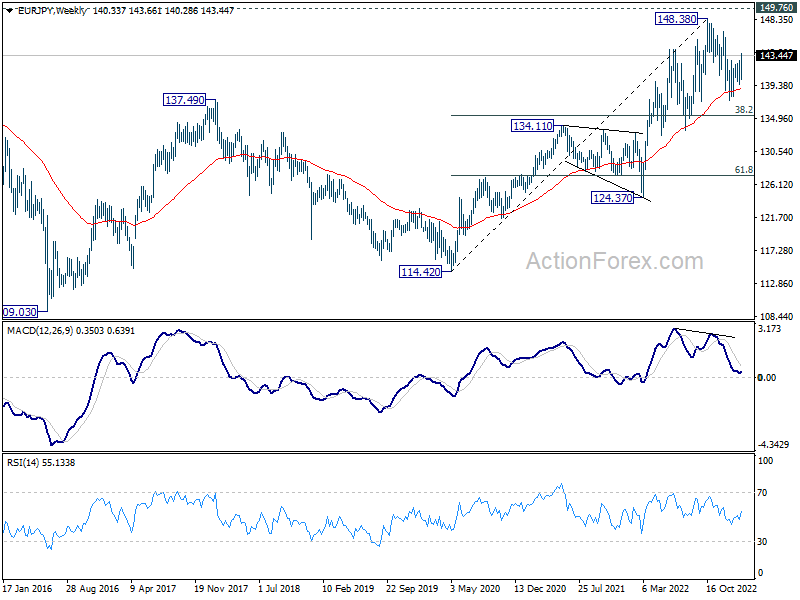
In the bigger picture, as long as 55 week EMA (now at 139.03) holds, larger up trend from 114.42 (2020 low) is still in progress for 149.76 long term resistance. However, firm break of 55 week EMA will bring deeper fall to 38.2% retracement of 114.42 to 148.38 at 135.40. Sustained break there will raise the chance of trend reversal, and target 61.8% retracement at 127.39.
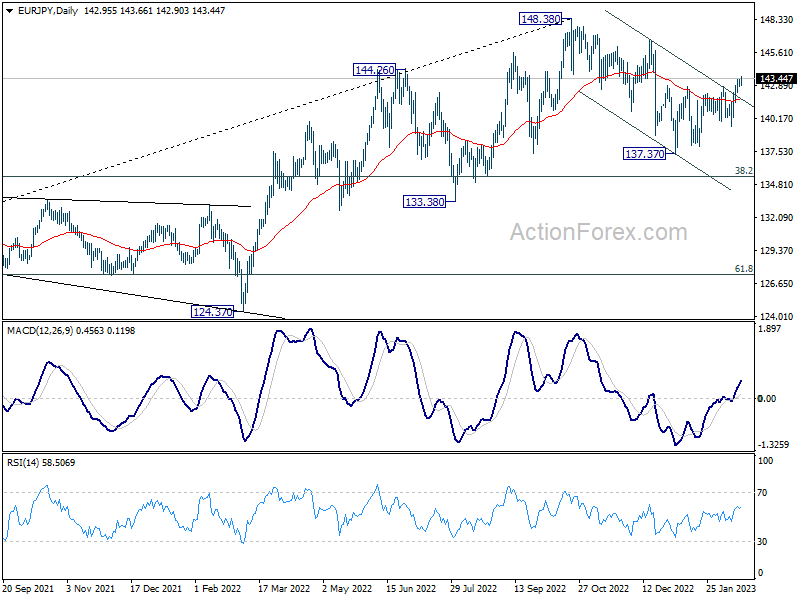
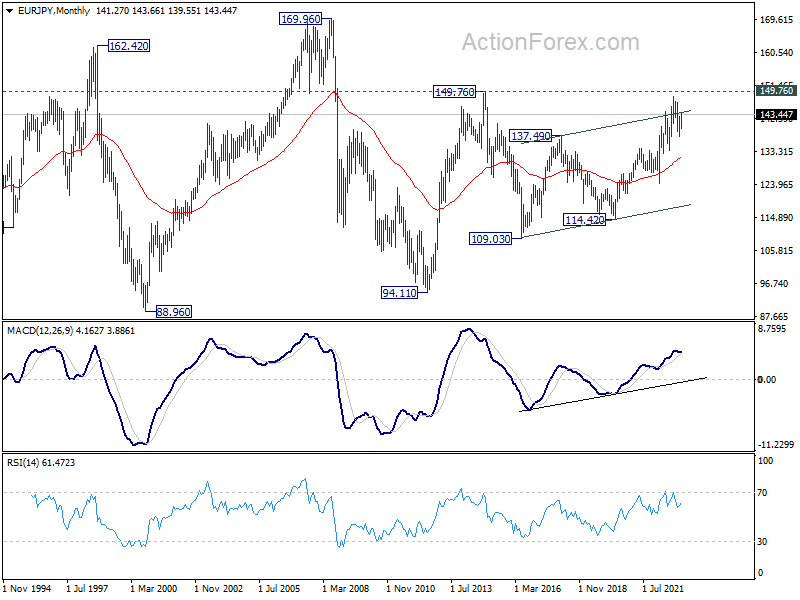
In the long term picture, outlook will stay bullish as long as 134.11 resistance turned support holds (2021 high). Sustained break of 149.76 (2014 high) will open up further rally, as resumption of the rise from 94.11 (2012 low), towards 169.96 (2008 high).
EUR/GBP Weekly Outlook
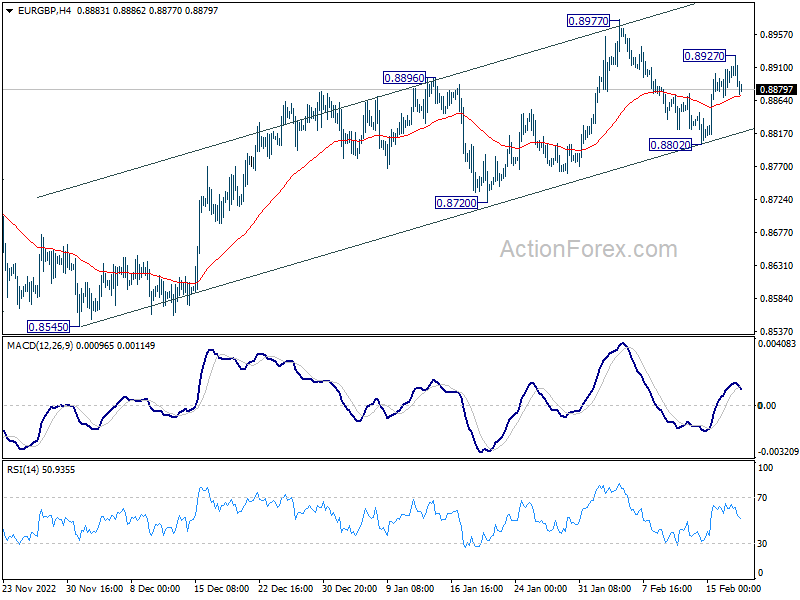
EUR/GBP recovered after hitting channel support last week. But upside was capped at 0.8927. Initial bias is turned neutral this week first. Further rally is expected as long as 0.8802 support holds. Above 0.8927 will target 0.8977 resistance. Firm break there will confirm resumption of whole rally from 0.8545. However, break of 0.8802 will now be a sign of reversal and turn bias back to 0.8720 support instead.
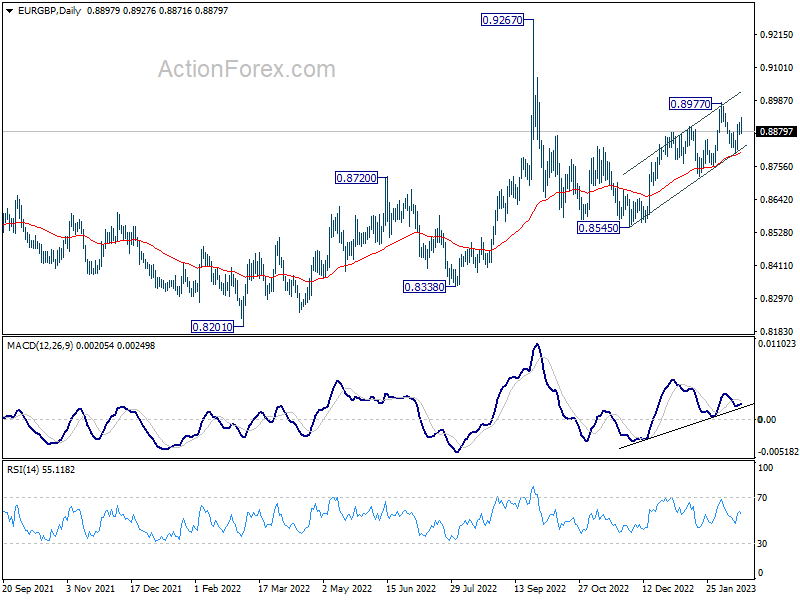
In the bigger picture, the notable support from 55 day EMA (now at 0.8801) retains near term bullishness. Break of 0.8977 should target 0.9267 (2022 high) and possibly above, to resume whole up trend from 0.8201 (2022 low). However, sustained trading below 55 day EMA will set the stage for 0.8545 and below.
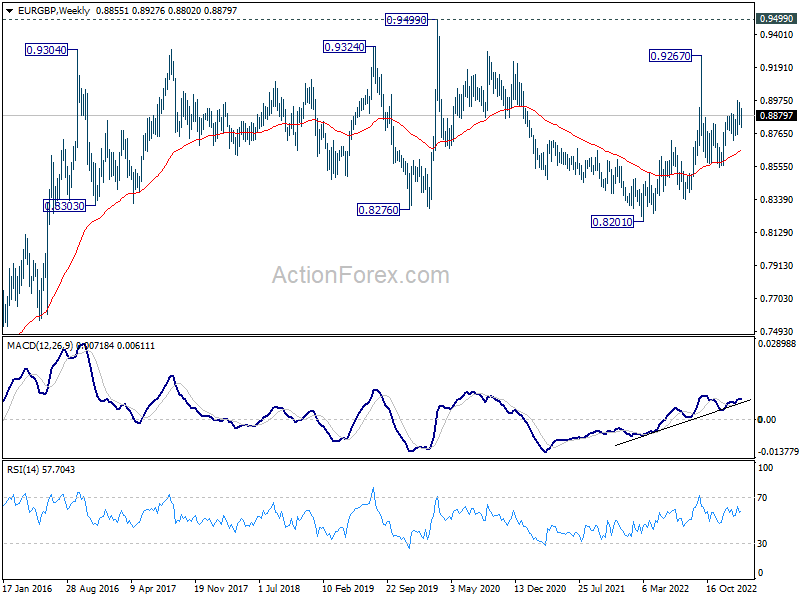
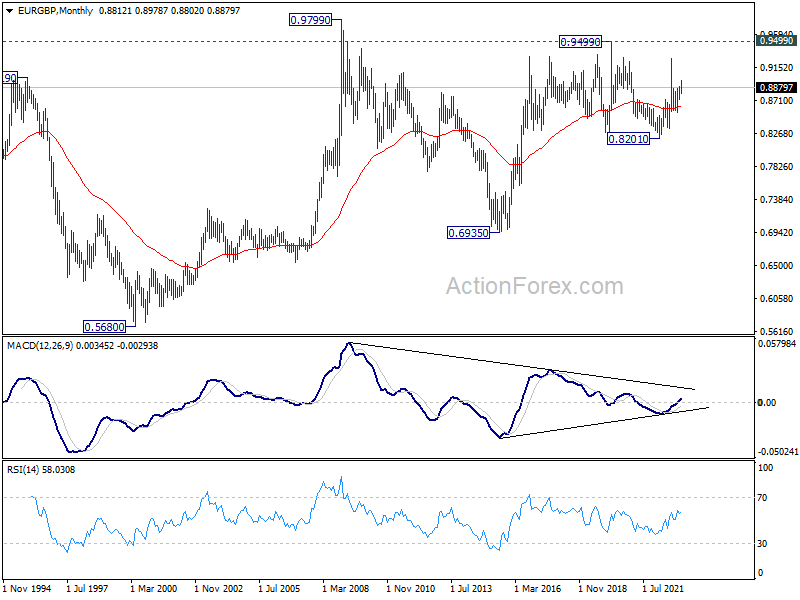
In the long term picture, long term range pattern is extending. But rise from 0.6935 (2015 low) is expected to extend at a later stage, to 0.9799 (2009 high).
EUR/AUD Weekly Outlook
EUR/AUD recovered last week but stayed below 1.5650 resistance. Initial bias remains neutral this week first. On the upside, break of 1.5650 will revive that case that correction from 1.5976 has completed at 1.5254. Intraday bias will be back on the upside for 1.5749 resistance first. On the downside, firm break of 1.5254/71 will carry larger bearish implication and resume the fall from 1.5976.
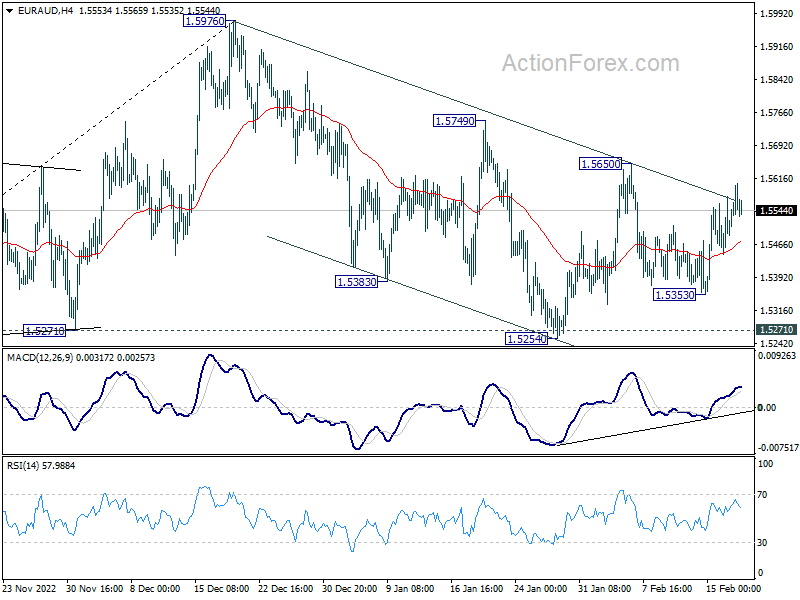
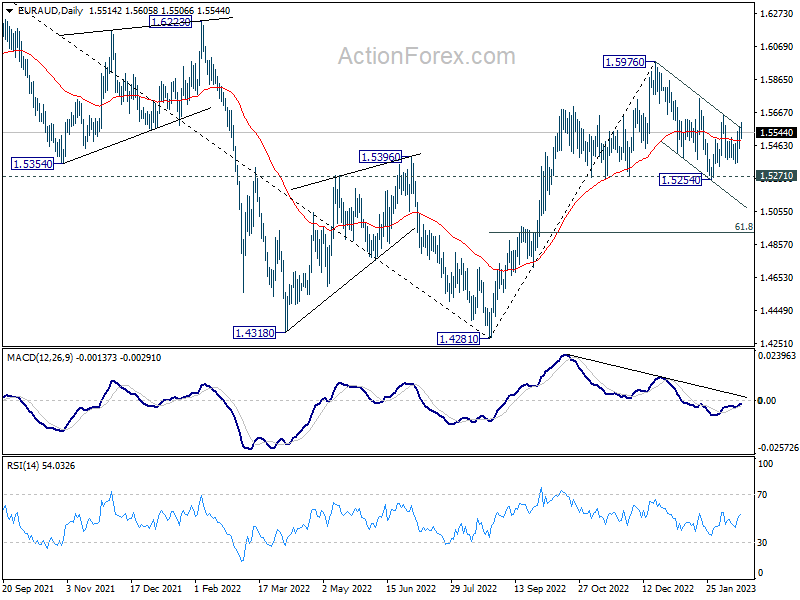
In the bigger picture, it's still early to confirm if rise from 1.4281 represents bullish trend reversal. But as long as 1.5271 support holds, such rally is in favor to continue. Break of 1.5976 will target 1.6434 key resistance next. On the other hand, firm break of 1.5271 will retain medium term bearishness instead.
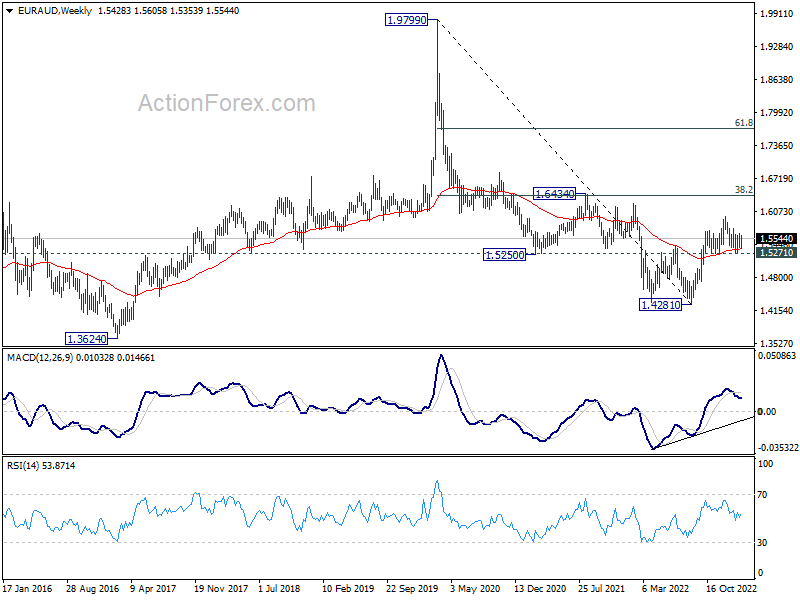
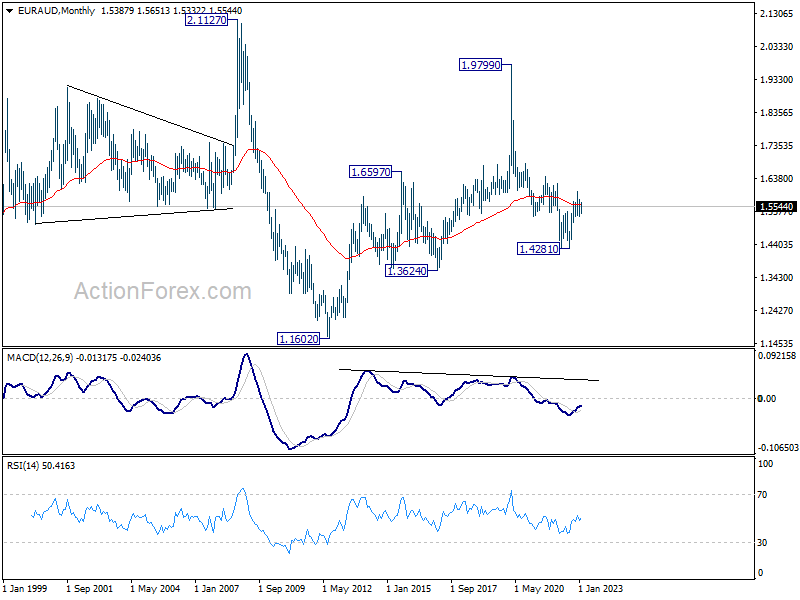
In the longer term picture, focus stays on 55 month EMA (now at 1.5590). Sustained trading above there will raise the chance of bullish trend reversal, and at least bring further rally to 1.6434 cluster resistance, 38.2% retracement of 1.9799 (2020 high) to 1.4281 at 1.6389. However, rejection by 55 month EMA will suggest that down trend from 1.9799 is still in progress for another low below 1.4281.
EUR/CHF Weekly Outlook
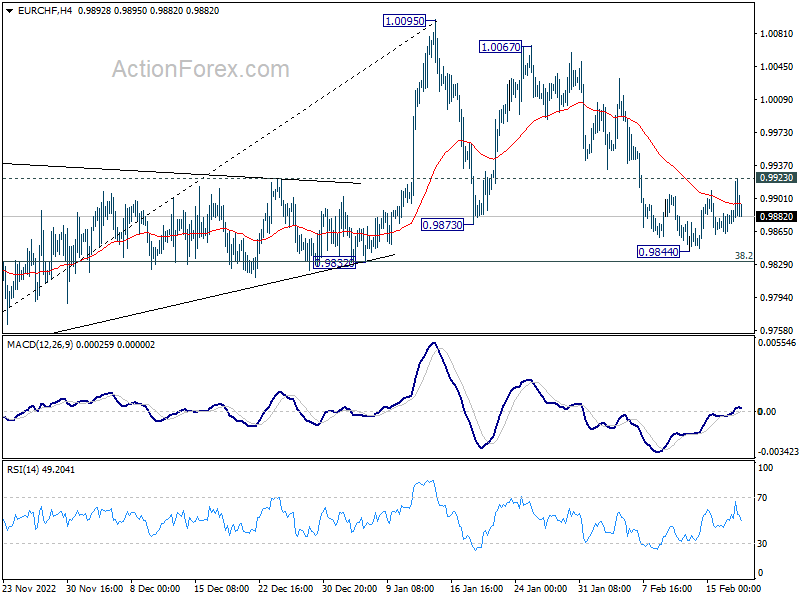
EUR/CHF's recovery was capped at 0.9923 last week despite brief break of 4 hour 55 EMA. Initial bias remains neutral this week first. Still, in case of another fall, downside should be contained by 38.2% retracement of 0.9407 to 1.0095 at 0.9832, to complete the corrective pattern from 1.0095. Break of 0.9923 will turn bias back to the upside for stronger rebound towards 1.0067/0095 resistance zone.
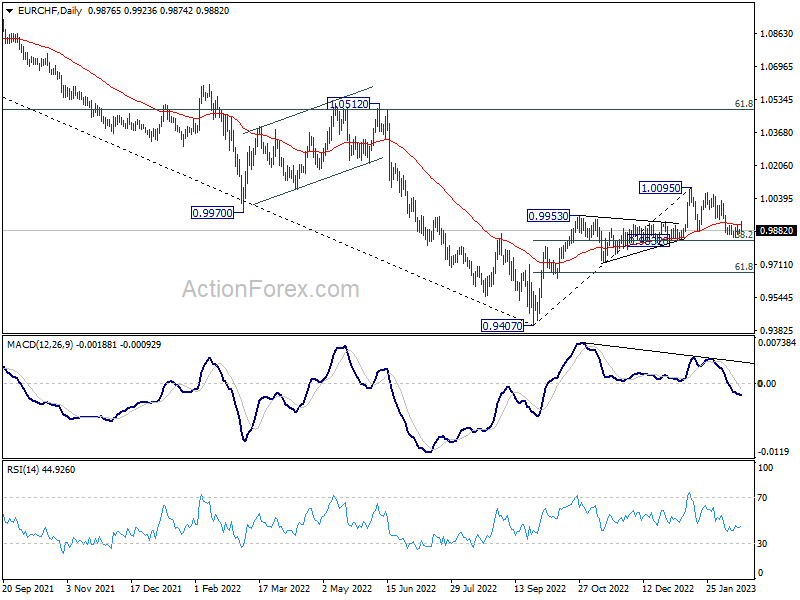
In the bigger picture, the rejection by 55 week EMA (now at 1.0025) mixed up the outlook. On the upside, sustained trading above 55 week EMA will raise the chance of bullish trend reversal. Rise from 0.9407 should then target 1.0505 cluster resistance (2020 low at 1.0505, 61.8% retracement of 1.1149 to 0.9407 at 1.1484). However, firm break of 0.9832 support will revive medium term bearishness and bring retest of 0.9407 low instead.
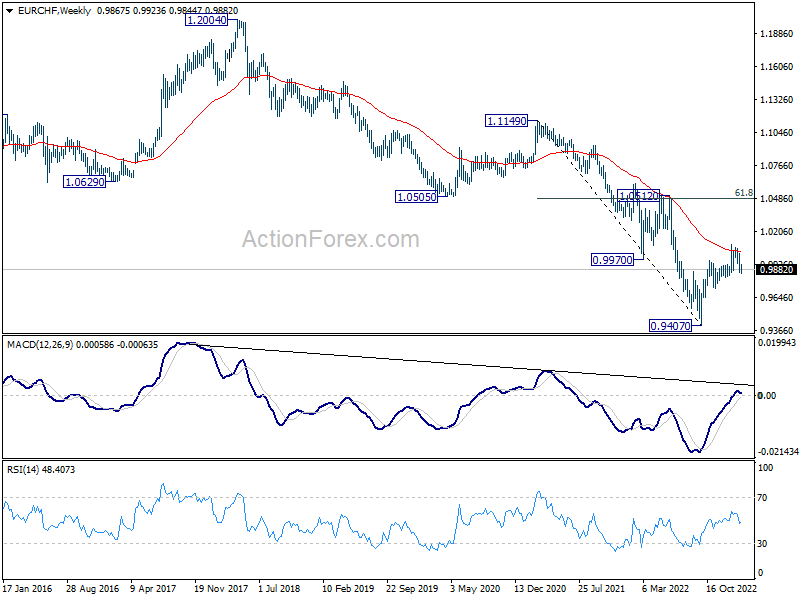
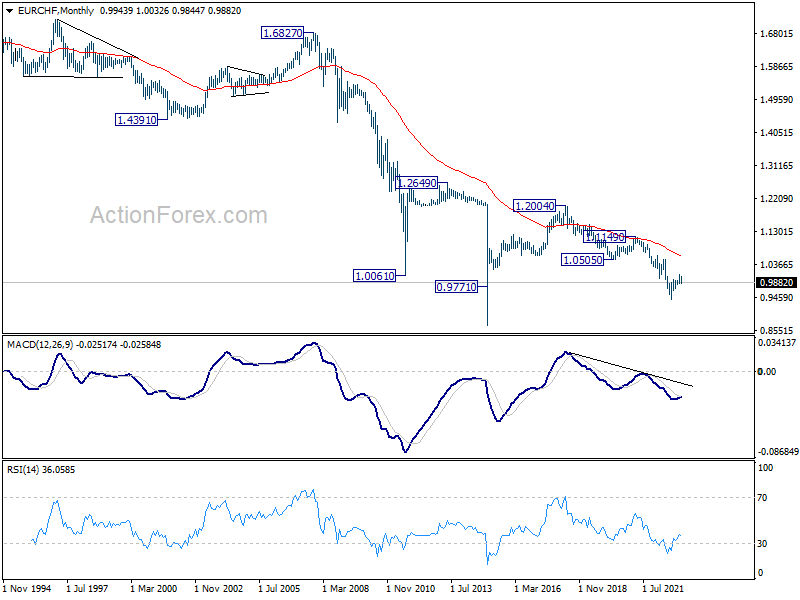
In the long term picture, it's still way to early too call for bullish trend reversal with upside capped well below 55 month EMA and 1.0505 support turned resistance (2020 low).
Dollar Rose on Fed Expectations But Momentum Capped Again By Risk Sentiment
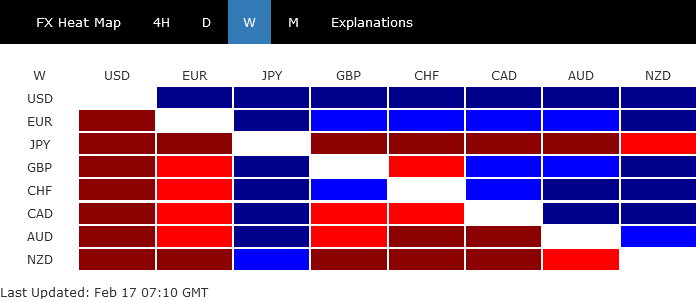
Dollar ended as the best performer last week, after data argued that the slow disinflation process could prompt Fed to tightening further to a higher terminal rate. Yet, buying remained rather uncommitted, as show in Friday's late pull back. Resilient risk sentiment continued to cap the greenback's upside, and could continue to do so.
Elsewhere in the forex markets, Euro ended as second strongest as ECB officials reiterated that they staying the course, and tightening could extend well into summer. Swiss Franc and Sterling were the next strongest ones. Yen was the worst performer on widening yield gap with Europeans and Americans. Also, the nomination of the new BoJ governor provided little hope of a U-turn in monetary policy. Commodity currencies were the worst performers.
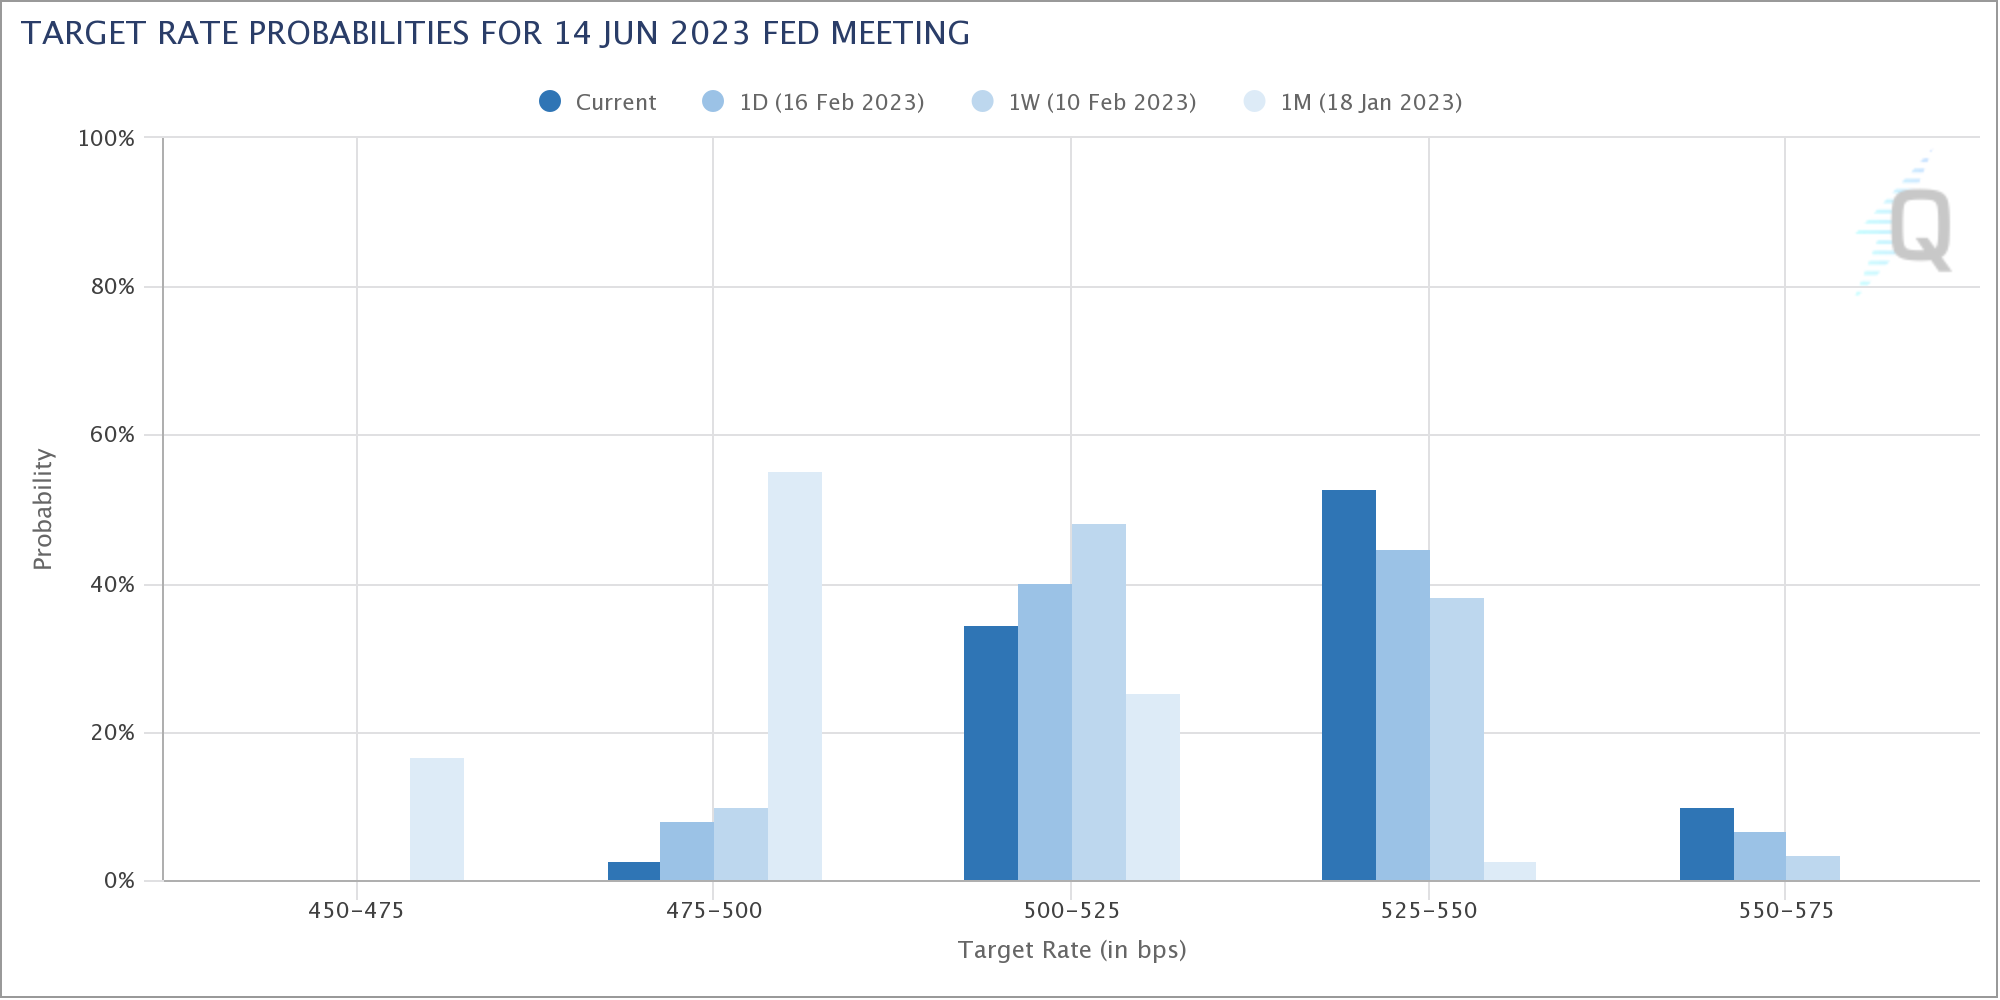
Over 60% chance of three more Fed hikes
January inflation data from the US released last week showed that while disinflation process is continuing, it's disappointingly slow. Together with hawkish comments from Fed officials, markets have been raising their bets on a higher terminal rate.
As indicated by Fed fund futures, there is now 62.9% chance of interest rate reaching 5.25-5.50% after June meeting. That's notably higher than 41.8% a week ago, and that mere 2.7% a month ago. That target range is even higher that Fed's down median estimate of 5.1%, and equivalent to three more 25 bps hike from the current 4.50-4.75%.
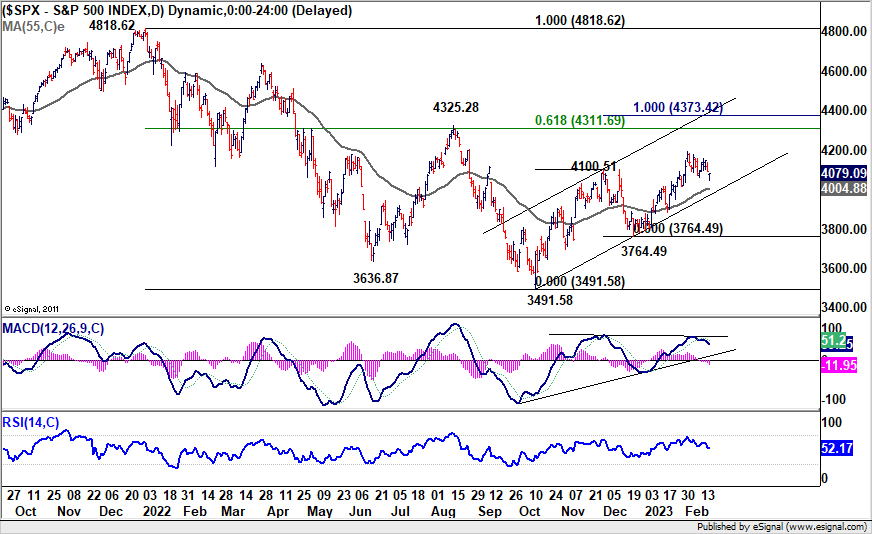
US stocks resilient, S&P 500 and NASDAQ staying on higher track
US stocks have been rather resilient. While there was some selloff after the inflation data, late buying on Friday indicated that investors had not given up. DOW and S&P 500 just closed the weekly slightly lower while NASDAQ ended up with gain.
S&P 500 is holding well inside the channel support that started last year at 3491.58. Further rise is expected as long as 55 day EMA (now at 4004.88) holds. Even as a corrective move, rise from 3491.58 would target 4325.28 resistance, or even further to 100% projection of 3491.58 to 4100.51 from 3764.49 at 4373.42.
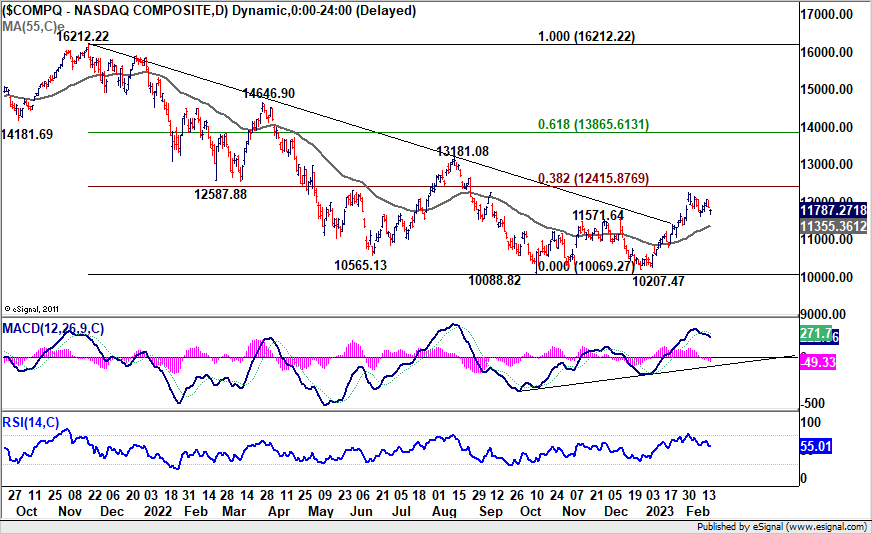
There is also no sign of reversal in NASDAQ despite loss of upside moment. Further rally is expected as long as 55 day EMA (now at 11355.36) holds. Firm break of 38.2% retracement of 16212.22 to 10088.82 at 12415.87 will pave the way to 13181.08 resistance.
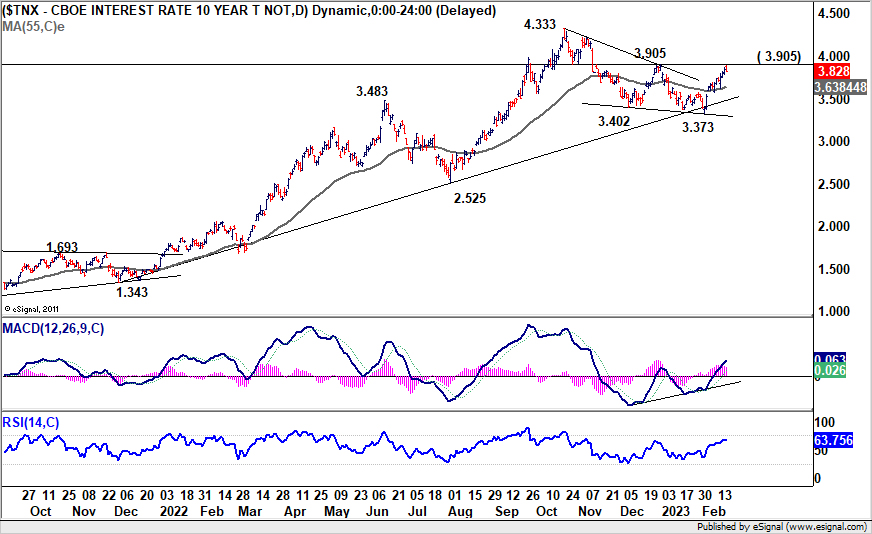
10-year yield pressing 3.905 resistance as rally extended
10-year yield extended the rebound from 3.373 and hit as high as 3.900 but failed to break through 3.905 resistance. Outlook is nonetheless unchanged that corrective pattern from 4.333 has completed with three waves down to 3.373. Further rise is expected as long as 55 day EMA (now at 3.638 holds). Decisive break of 3.905 could set the stage for a retest on 4.333 high.
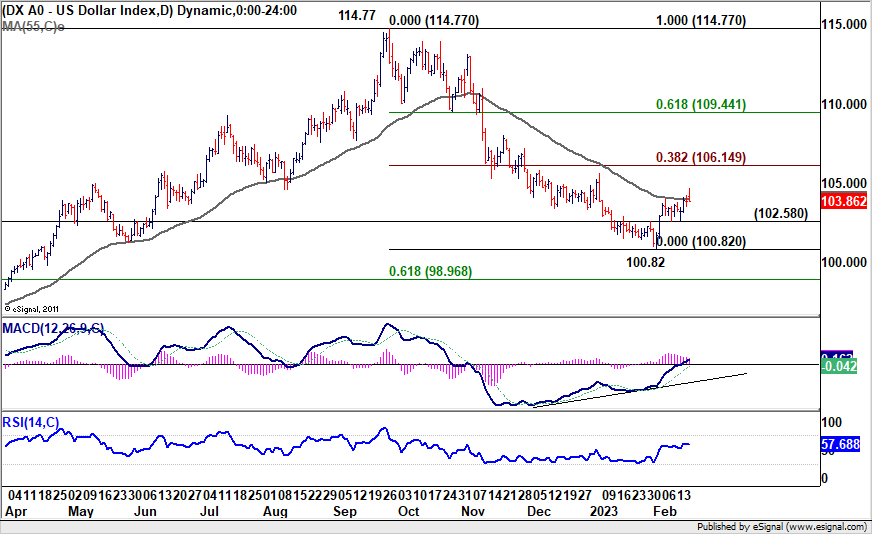
Dollar index extended corrective rebound, with disappointing momentum
Rising treasury yields and expectations of higher Fed terminal rate should be supportive to Dollar. Yet, the positive force has been offset by resilient risk-on sentiment. Overall movements in the greenback remained rather indecisive, except versus Yen for now. That's reflected clearly in Friday's disappointing upside breakout.
The countering forces argue that Dollar index is merely in a corrective rebound, moving two steps forward one step back. For now, further rise is expected in DXY as long as 102.58 support holds. Next target is 38.2% retracement of 114.77 to 100.82 at 106.14. Strong resistance could be seen there to limit upside.
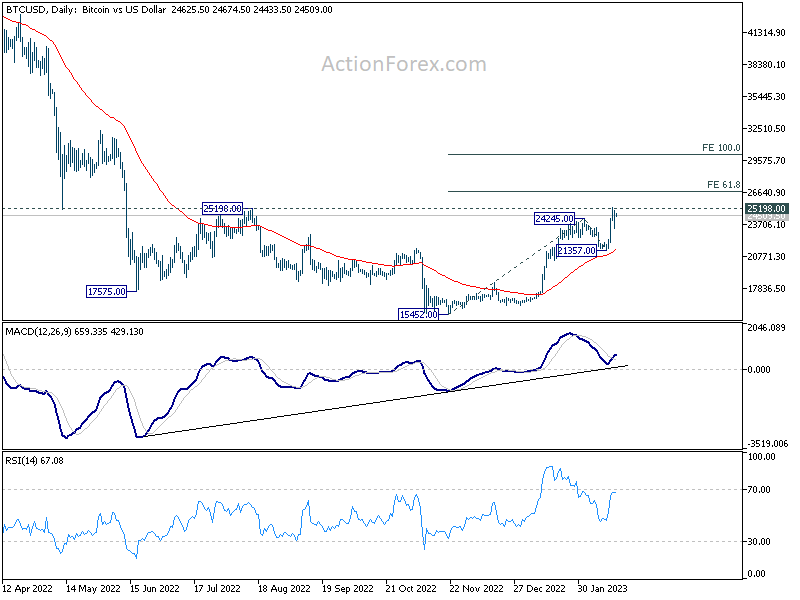
Bitcoin pressing 25198 resistance as risk sentiment improved
Bitcoin is seen as a proxy to overall risk appetite, the development is inline with the bullish outlook in NASDAQ. Rise from 15452 resumed last week and breached 25000 handle. Initial rejection was seen from 25198 structural resistance. But the retreat was so far rather shallow. Further rise is in favor as long as 21357 support holds. Firm break of 25198 will target 61.8% projection of 15452 to 24245 from 21357 at 26791.
For now, it's still early to see if Bitcoin will break through 26791 decisively. But if it does, next target will be 100% projection at 30150. That could also mean that NASDAQ is breaking through 13181.08 resistance as mentioned, which would be another medium term bullish signal for stocks, but bearish signal for Dollar.
USD/CAD Weekly Outlook
USD/CAD's break of 1.3474 resistance last week confirmed short term bottoming at 1.3261. More importantly, the corrective pattern from 1.3976 should have completed too. Initial bias stays on the upside this week for 1.3684 resistance. Firm break there will bring retest 1.3976 high. Nevertheless, break of 1.3421 minor support will dampen this bullish case and turn intraday bias neutral again.
In the bigger picture, as long as 1.3222 cluster support (38.2% retracement of 1.2005 to 1.3976 at 1.3223) holds, larger up trend from 1.2005 (2021 low) is still expected to resume through 1.3976 high at a later stage. However, firm break of 1.3222/3 will indicate that the trend might have reversed. Deeper fall would be seen to next cluster support at 1.2726 (61.8% retracement at 1.2758).
In the longer term picture, price actions from 1.4689 (2016 high) are seen as a consolidation pattern only, which might have completed at 1.2005. That is, up trend from 0.9506 (2007 low) is expected to resume at a later stage. This will remain the favored case as 55 month EMA (now at 1.2967) holds.