Sample Category Title
AUD/USD: Aussie Bounces Strongly after Rejection at Rising Cloud Top
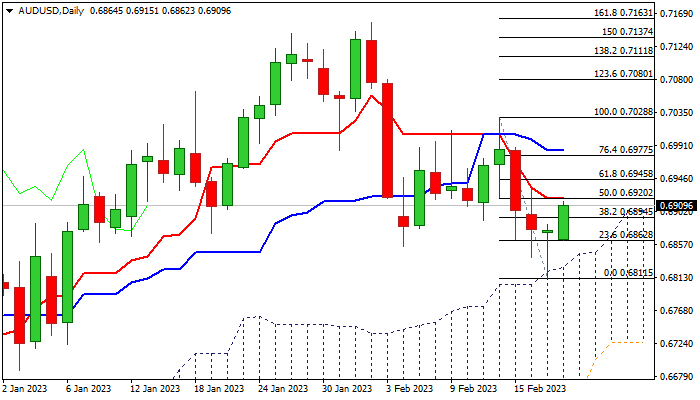
The AUDUSD rebounds strongly on Monday, lifted by further rise in iron ore, one of Australia’s top contributors to earnings from exports, as fresh signals of stronger recovery of China’s demand boosted sentiment.
Daily chart shows improving conditions after Friday’s action faced strong downside rejection at the top of rising daily cloud (daily Doji with very long tail), pointing to strong bids.
Fresh recovery acceleration is pressuring pivotal barrier at 0.6920 (daily Tenkan-sen /50% retracement of 0.7028/0.6811 bear-leg) break of which would further firm near-term structure and open way for stronger recovery.
However, signals on daily chart are still mixed and fresh bulls need extension through pivots at 0.6945/77 (Fibo 61.8% / 76.4% of 0.7028/0.6811) to neutralize underlying bears and expose targets at 0.7000/28 (psychological / Feb 14 peak).
Caution on failure at these levels that would keep the downside vulnerable, despite strong support from rising daily cloud.
Can the UK PMIs Come to the Pound’s Rescue?
After selling the pound due to the slowdown in the UK CPIs for January, traders are now turning their attention to the preliminary PMIs for February, to be released on Tuesday at 07:30 GMT. With the BoE now trailing both the Fed and the ECB in terms of rate hike expectations, can the PMIs come to the pound’s rescue?
Inflation slowdown confirms BoE’s guidance change
At its last meeting, the BoE decided to raise interest rates by 50bps as was broadly expected, but there was a change in the forward guidance, with officials noting that further tightening would be required if there is evidence of more persistent price pressures. In previous statements, they were stating that they “would respond forcefully as needed”.
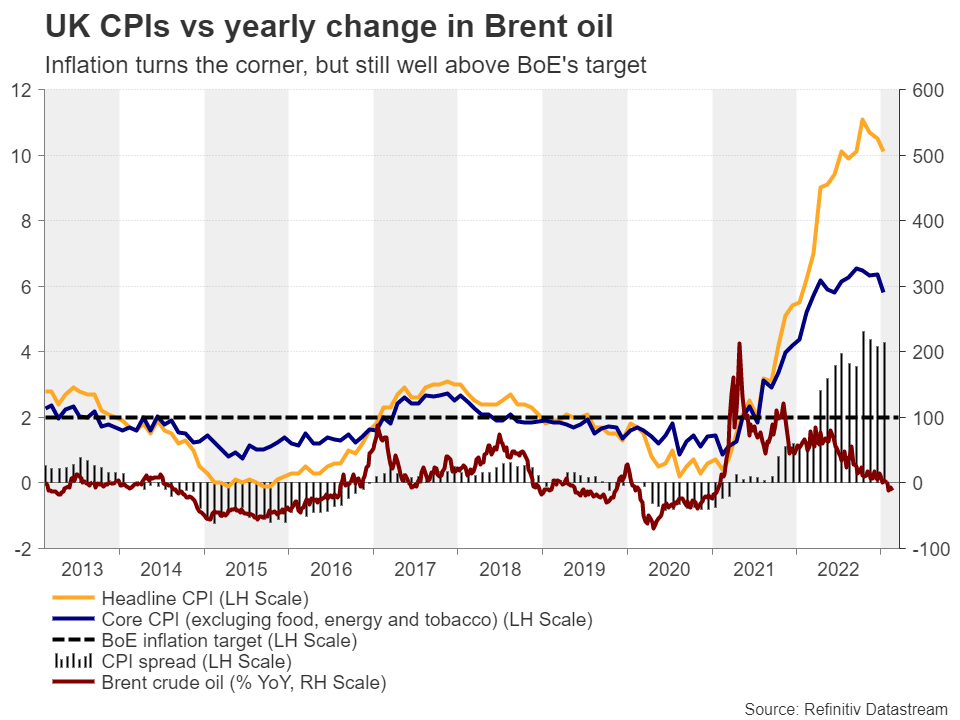
Governor Bailey made it clear that the change reflected a turning of the corner in the fight against inflation, and he was proven right just last Wednesday, when the UK CPIs for January were released. Both the headline and core rates fell to 10.1% y/y and 5.8% y/y from 10.5% and 6.3% respectively, below estimates of 10.3% and 6.2%. Although headline inflation is still in double digits, the slide in the core rate may have bolstered expectations that the BoE is nearing the exit of this tightening campaign.
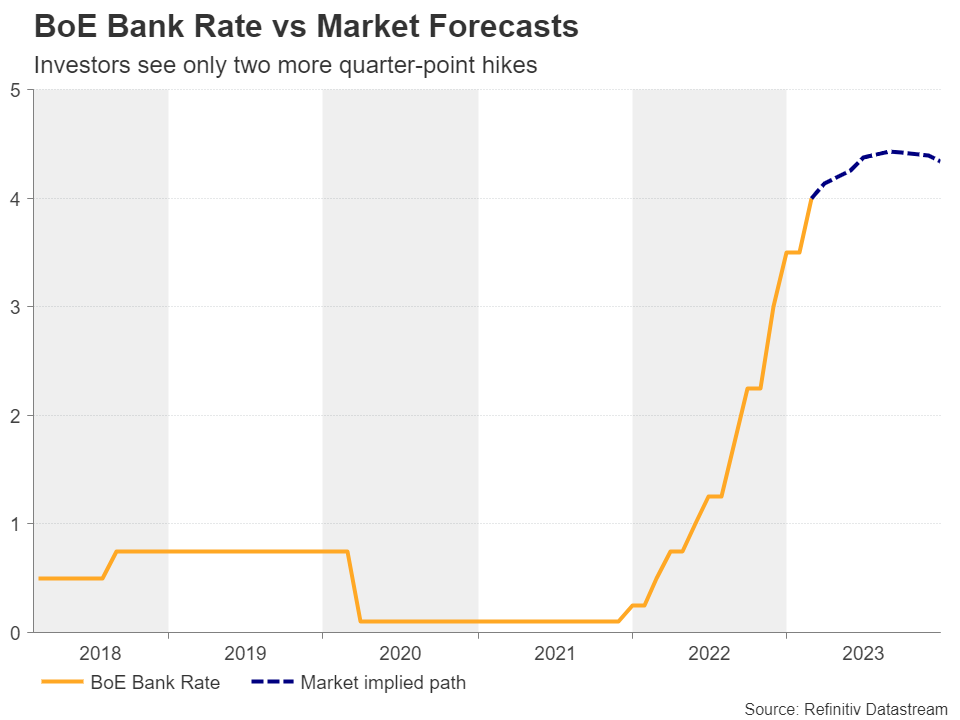
Investors are currently assigning around a 75% probability for a 25bps hike at the upcoming meeting, with the remaining 25% pointing to no action. As for thereafter, they see only one more quarter-point increment before the Bank presses the stop button.
Economic risks are far from vanished
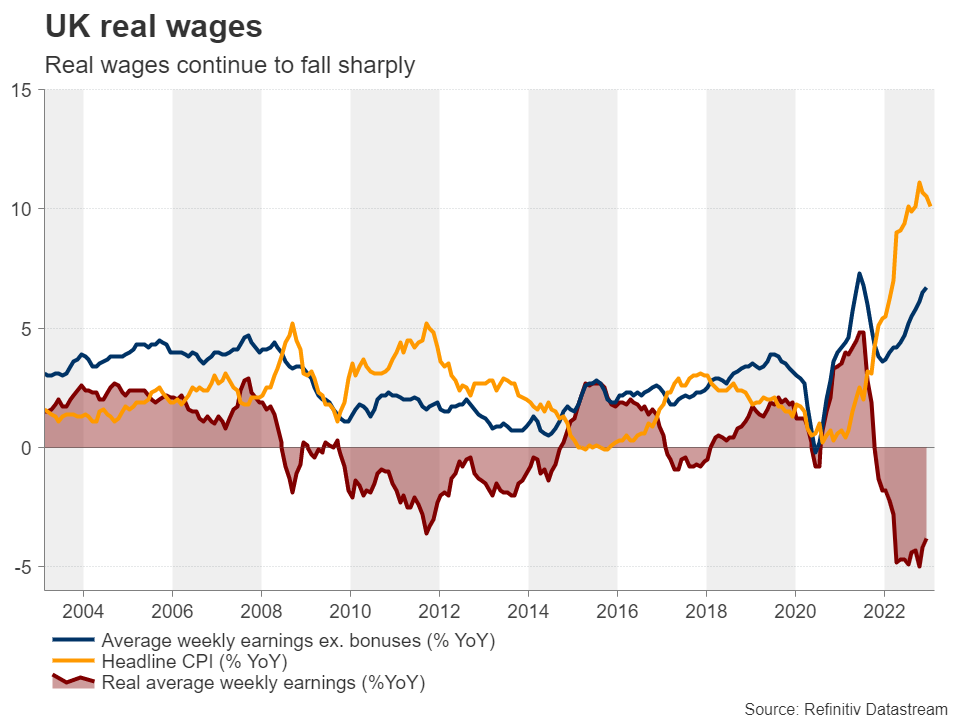
The British economy showed zero economic growth in the last three months of 2022 after contracting 0.2% q/q in Q3, just enough to dodge a recession. That said, the composite PMI slid further below 50 in January, which suggests that although the risks of a sharp recession in the UK have lessened, they are far from vanished. What makes things worse is that inflation for food and non-alcoholic drinks slowed to just 16.7% from a 45-year record of 16.8%, which means that households are still experiencing a severe cost-of-living squeeze. Average earnings excluding bonuses accelerated to 6.7% in December, but this was during a period when headline inflation was at 10.5%, leaving real wage growth well into the negative territory.
On Tuesday, the preliminary PMIs for February are expected to improve but to stay in contractionary territory. Specifically, the manufacturing index is expected to increase to 47.4 from 47.0, while the services index is anticipated to rise to 49.2 from 48.7. This would take the composite PMI up to 48.7 from 48.5. Ergo, another round of below-50 numbers could increase the chances of negative economic growth during the first quarter of 2023. Indeed, the GDP tracker of the National Institute of Economic and Social Research (NIESR) is currently pointing to a 0.2% contraction.
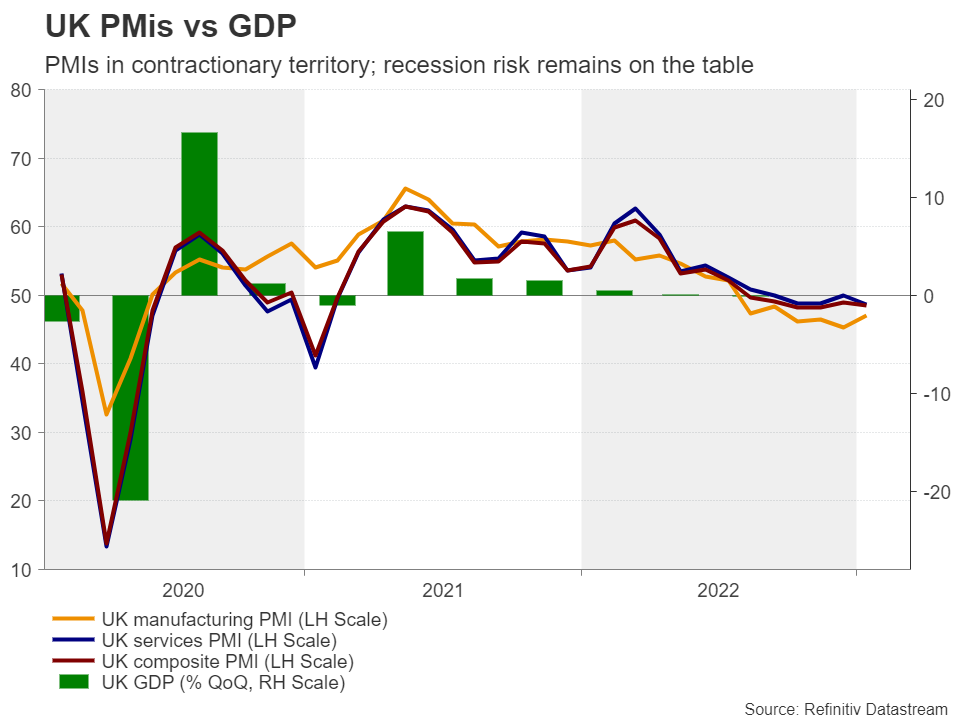
So, how fast or slow the Bank needs to move hereafter has no straightforward answer. On the one hand, they must keep raising interest rates to bring sky-high inflation to heel, but on the other hand, they must be careful enough to not bring about deeper economic wounds. So, even if they improve, the February PMIs could confirm the notion that the BoE may need to proceed much less aggressively than the Fed and the ECB.
Pound’s path of least resistance remains to the downside
The pound could initially rebound somewhat on the improving figures, but should investors maintain bets for only a couple more quarter-point increases, the British currency may be sold again. Pound/dollar could fall below the 1.1900 zone, which has been acting as key support since November 30. This could pave the way towards the 1.1645 barrier, marked by the inside swing high of October 27. If there are no buyers to be found there either, the slide may extend towards the low of November 4, at 1.1350.
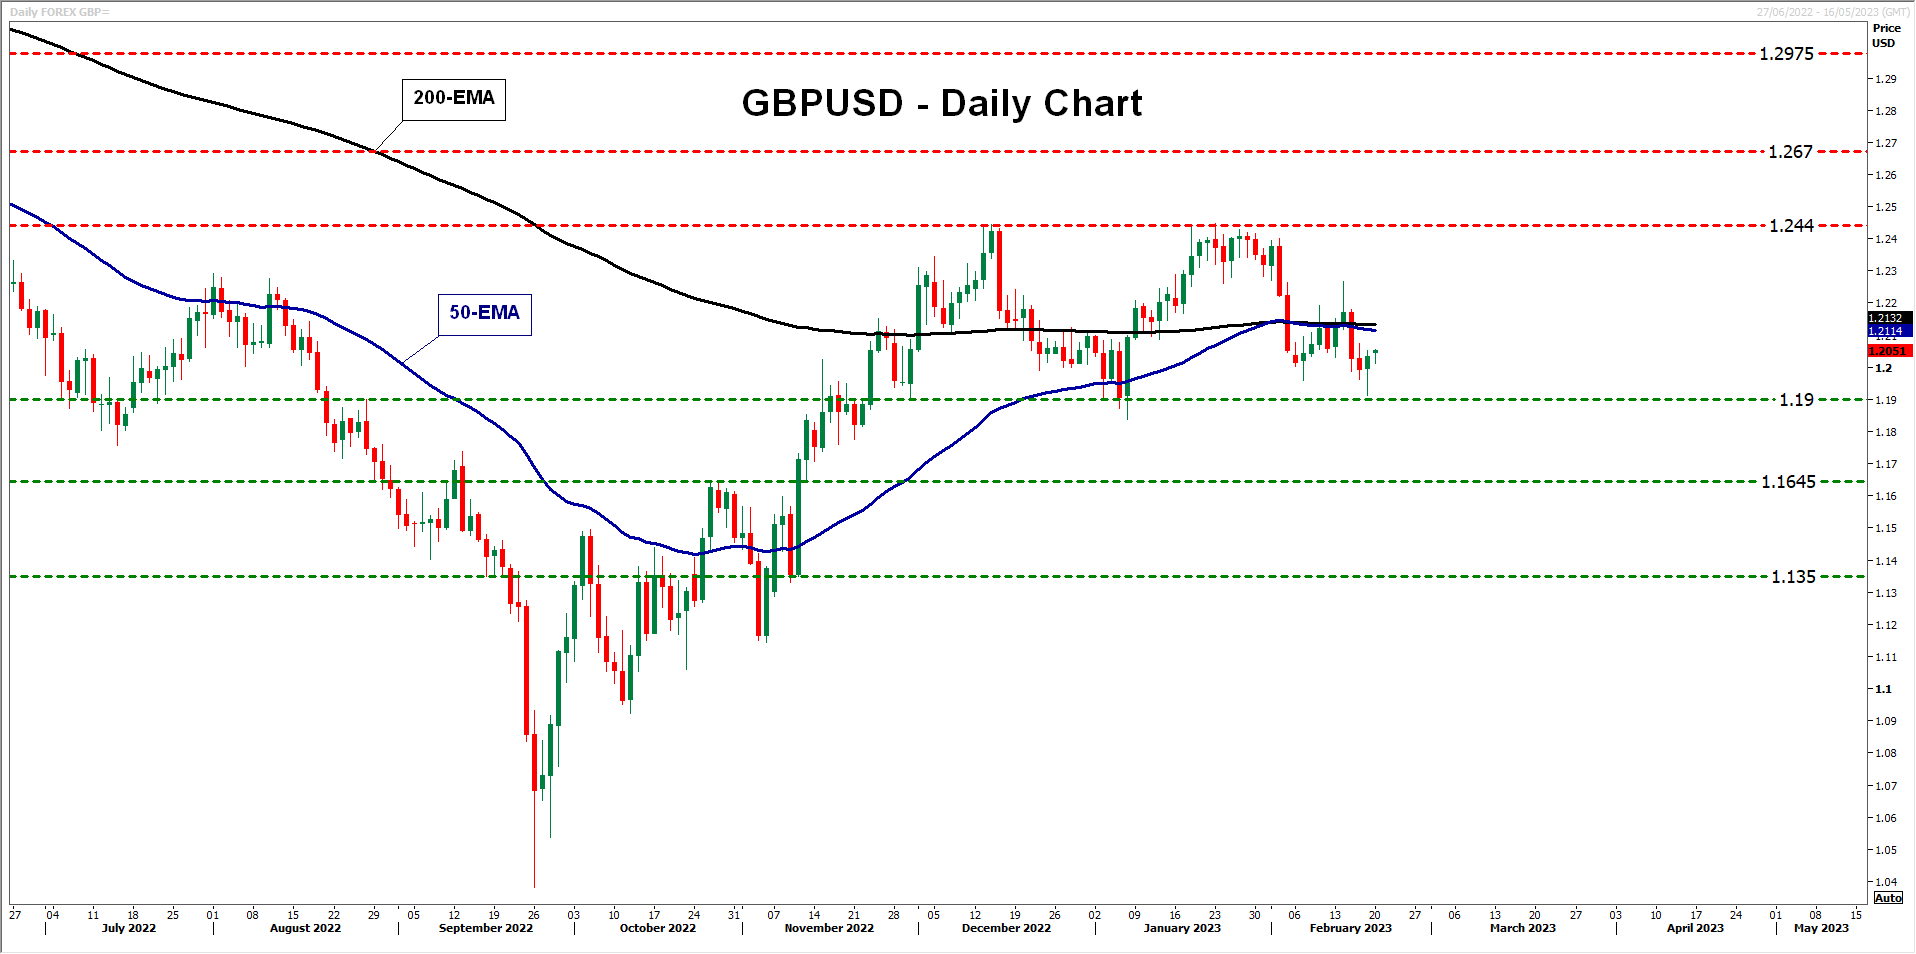
Now, if future data suggests that inflation is stickier than previously expected and at the same time, the economy is in a better-than-feared shape, the pair could rise to the 1.2440 area. Nonetheless, a break above that zone may be needed for the outlook to turn overly positive again. Such a move would confirm a higher high and could initially target the 1.2670 area, defined as resistance by the high of May 27. If the bulls are strong enough to overcome that hurdle as well, they might then climb towards the 1.2975 territory, which provided support back in March and April 2022 before being broken on April 22.
Euro Drifting, Markets Eye PMIs
The euro showed some volatility at the start of last week but since then it has been in calm waters and has stayed close to the 1.0.7 line.We’ll get a look at eurozone and German PMIs on Tuesday.
ECB signals another 50 bp hike
The ECB has been criticized for sending mixed messages to the markets, but Christine Lagarde was crystal clear last week when she told EU lawmakers that “in view of the underlying inflation pressures we intend to raise interest rates by another 50 basis points at our next meeting in March”. Lagarde said the ECB would then evaluate future moves, but with inflation still high, the risks for further rate hikes are skewed to the upside.
The ECB’s primary focus is to tame inflation. Headline inflation fell to 8.5% in January, down from 9.2% in December, but is still unacceptably high. Core CPI has been stickier than expected and wage increases are stemming the drop in inflation. ECB member Isabel Shnabel said last that investors risk underestimating inflation, a warning that the Fed has also made to the markets that have consistently been more dovish about rate policy than the Fed. Schnabel noted that the disinflation process has not started in the eurozone, another signal that the central bank will remain in a hawkish mode for the near future.
Fed members continue to pound out the message that inflation remains too high and more rate hikes are needed. Investors are clearly concerned that the Fed will make good on these statements, which has sent risk sentiment lower and the US dollar higher. The markets had high hopes that the March rate increase would be a ‘one and done’, but it looks like the Fed will continue raising rates into the second quarter. According to CME’s FedWatch, the markets have priced in an 83% of a 25-bp hike and a 17% of a 50-bp increase.
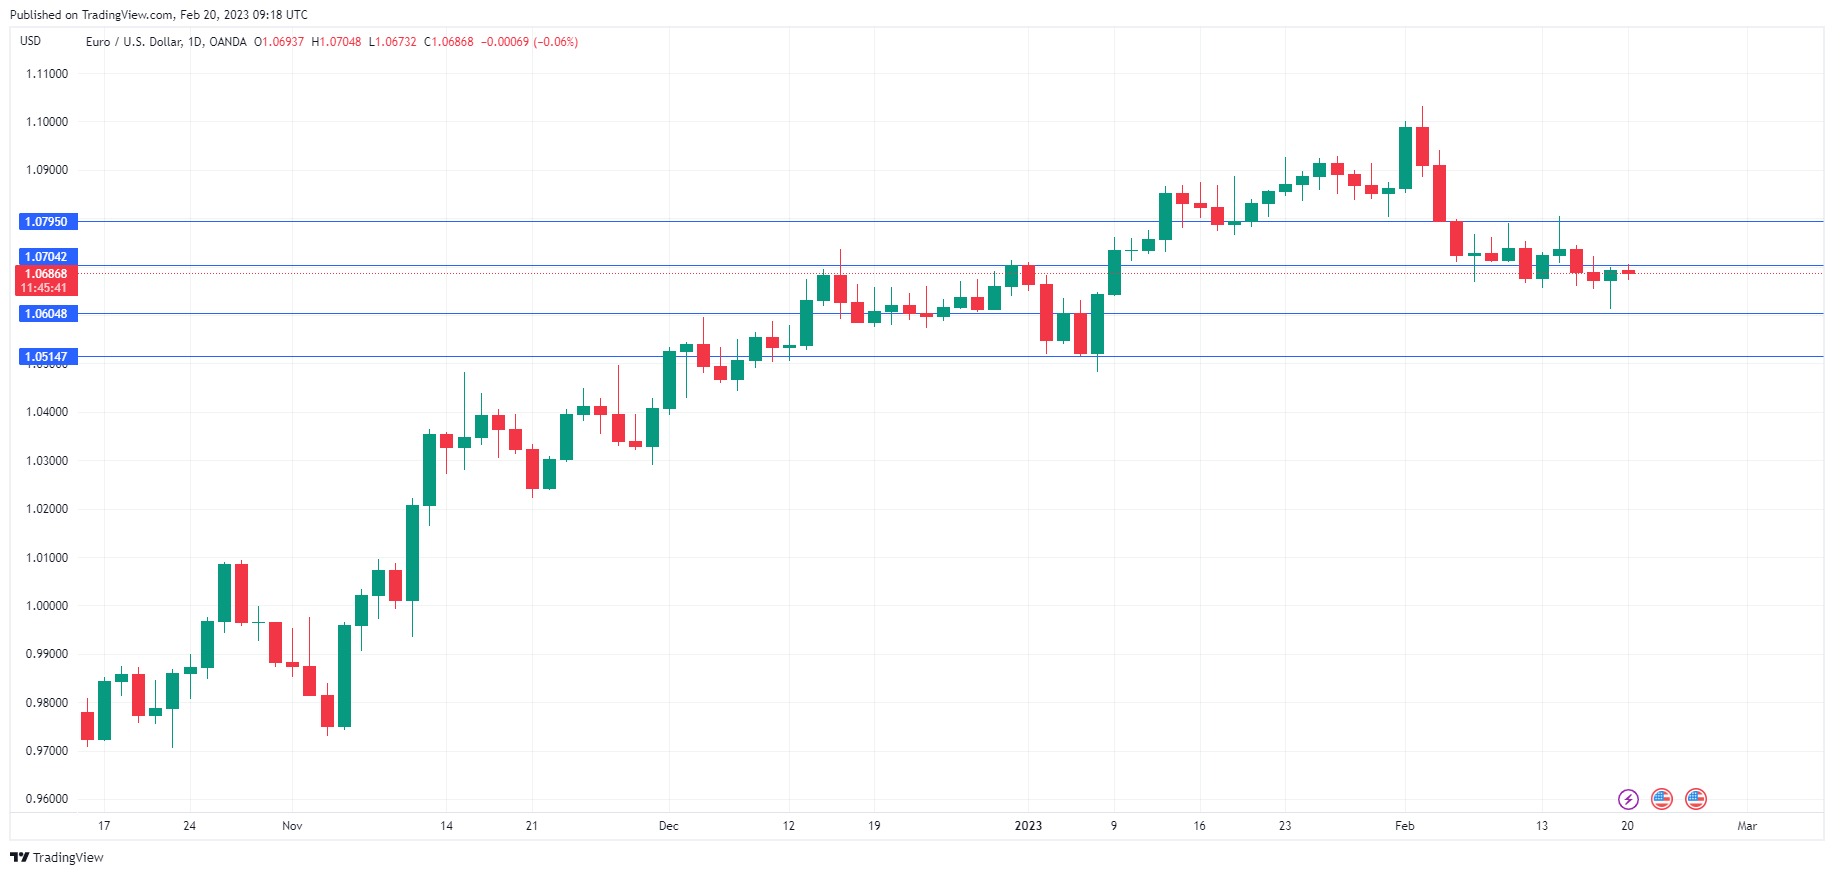
EUR/USD Technical
- EUR/USD is testing resistance at 1.0704. Above, there is resistance at 1.0795
- 1.0604 and 1.0513 are the next support lines
Dollar Index: Bulls Taking a Breather Under New Six-Week Gigh
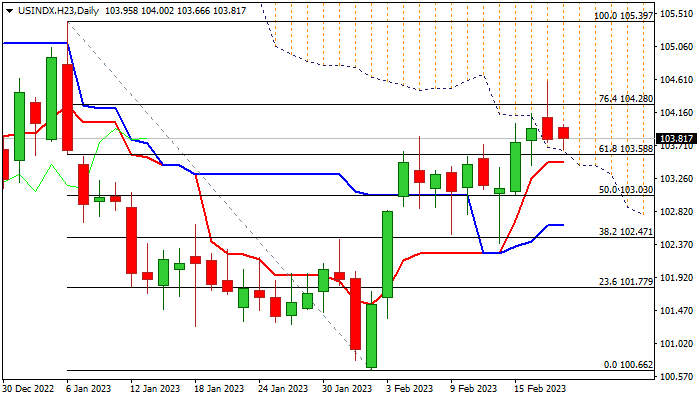
Friday’s close in red with long upper shadow of daily candle and formation of bull-trap above Fibo 76.4% of 105.39/100.66 / top of weekly cloud, signals that bulls might be losing traction.
The price action is so far holding within daily cloud, with cloud base marking strong supports at 103.50 zone, along with broken Fibo 61.8% and daily Tenkan-sen.
Immediate bias is expected to remain with bulls while these supports hold, though initial signals of stall and possible pullback are developing.
Daily Tenkan-sen / Kijun-sen turned sideways, while stochastic is heading south after forming a bearish divergence, though negative signals were so far countered by daily MA’s on bullish configuration and still strong positive momentum.
Expect stronger direction signals on break of either side barriers, with 103.50/00 marking lower pivots (loss of which would weaken near-term structure and risk deeper pullback), while sustained lift above 104.60 (Friday’s spike high / weekly cloud top) would bring bulls fully in play for fresh acceleration higher.
With Monday’s action expected to be quiet due to US holidays, traders turn focus towards economic releases due later this week (US Housing data, GDP, weekly jobless claims, PCE).
Res: 104.28; 104.60; 105.04; 105.39.
Sup: 103.50; 103.03; 102.68; 102.47.
GBP/USD: Bear-Trap Under 200DMA Looks for More Upside Action to be Confirmed
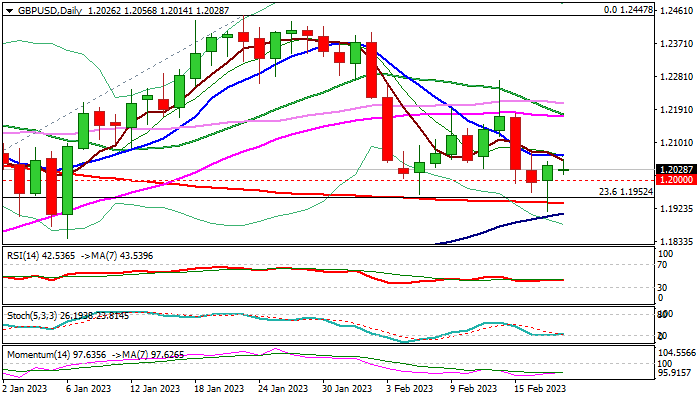
Cable remains constructive at the start of the week, although with limited upside so far, following Friday’s bullish daily candle with long tail, which generated positive signal on strong downside rejection under pivotal 200DMA support (1.1937) and possible bear-trap.
On the other hand, two consecutive weekly Dojis signal strong indecision and lack of direction, which is additionally supported by conflicting signals from daily chart.
Pivotal points lay at 1.1937 (200DMA) and 1.2092/1.2104 (daily Tenkan-sen / cloud top) with break of either side to generate fresh direction signal.
Traders focus on UK PMI data on Tuesday, which would provide fresh information about the condition of Britain’s economy.
Res: 1.2069; 1.2104; 1.2180; 1.2181.
Sup: 1.2000; 1.1952; 1.1937; 1.1908.
EUR/USD Trading in the Middle of a Correction
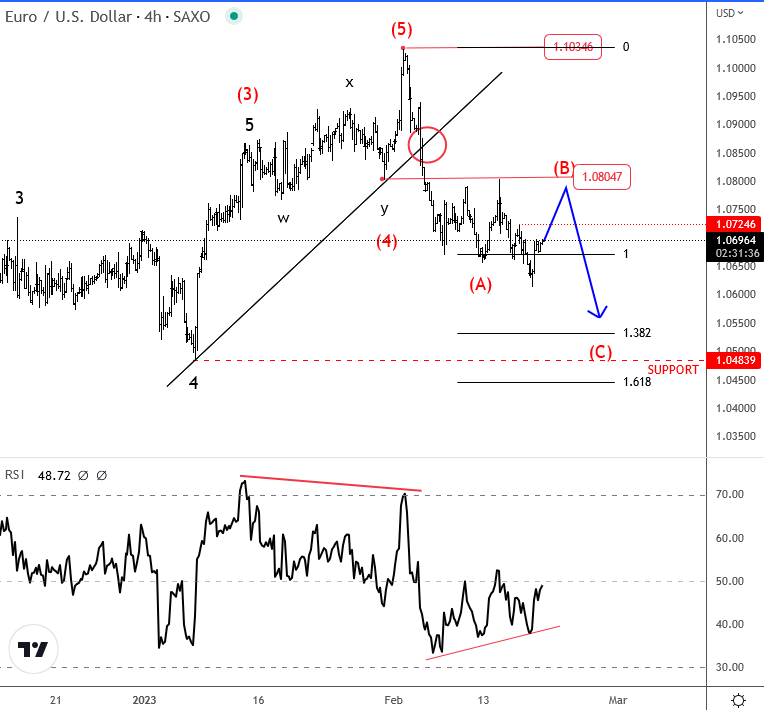
EURUSD reversed sharply to the downside in February, with price falling through the rising trendline support after strong US jobs numbers were reported for January. We saw a perfect reaction down from 1.08 resistance after US CPI came out worse than expected. Pair hit a new low but notice that decline is not progressing at this stage, ahead of holidays in the US. As such, we can see some slow down and choppy price action before downtrend resumes, so ideally that's still wave (B) now in progress. 1.08 remains an important resistance for a turn down into (C) wave.
BoJ Amamiya: Difficult challenge is to determine whether exit conditions are in place
BoJ Deputy Governor Masayoshi Amamiya told the parliament that the central bank has already shifted to a "sustainable monetary easing framework". Thus, it is "appropriate to maintain current policy given underlying price moves."
But he also noted that BoJ has "sufficient operational tools" to achieve a smooth exit from ultra-loose monetary policy.
"The difficult challenge for the BOJ is to determine whether conditions have fallen in place to exit, and how to communicate (its policy intention) to the market," Amamiya added.
Gold’s Decline Takes a Breather; Caution Remains
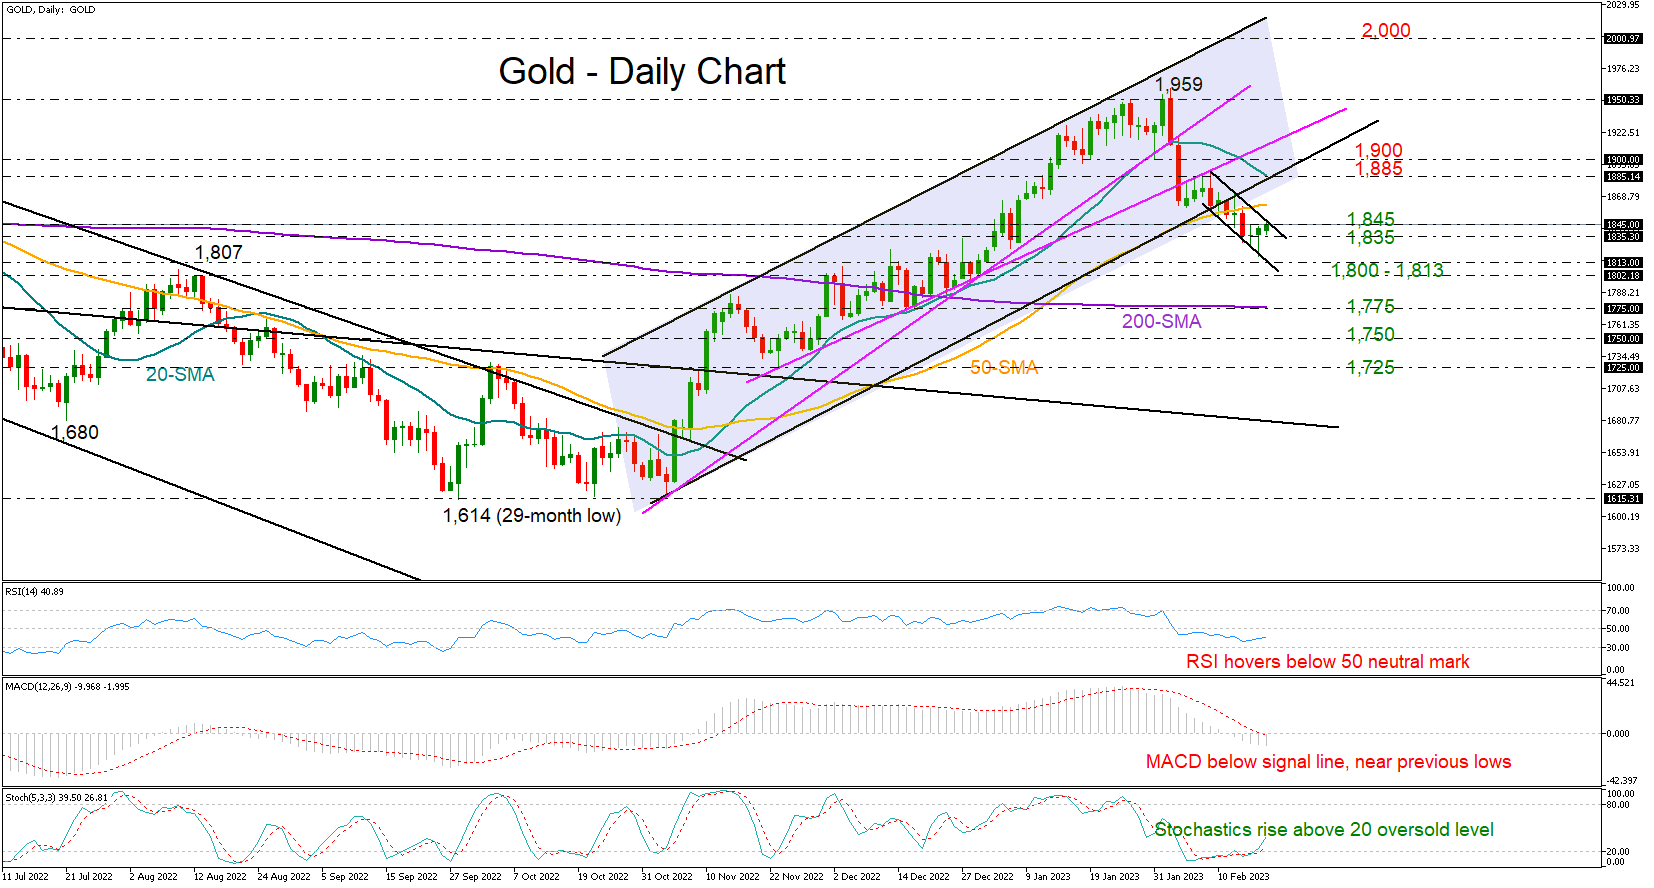
Gold slid to a seven-week low of 1,818 last Friday before closing narrowly back above the 1,835 support for the third consecutive day.
The precious metal was trying to extend its minor gains above the 1,835 base during Monday’s early trading hours. But excluding the upside reversal in the Stochastic oscillator, the RSI and the MACD did not show any meaningful reaction, with the former remaining below its 50 neutral mark and the latter hovering within the negative area and near its previous lows. With the price having exited the bullish channel, retreating below the 50-day simple moving average (SMA) too, sellers will probably keep the upper hand in the short term.
Should the price close below the former 1,835 support area, all eyes will turn to the 1,800 psychological mark as another defeat here would neutralize the broad outlook. A continuation lower could challenge the flattening 200-day SMA at 1,775, a break of which could initially pause around 1,750 before stretching towards the 1,725 low from November 23.
In the event the recovery gains fresh impetus above the upper boundary of the tight bearish short-term channel at 1,845, the door will open for the 50-day SMA at 1,862. A successful move higher could then face strong resistance around the 1,885 region, where the 20-day SMA and the lower band of the broken bullish channel are converging. The 1,900 round level could be the next target.
In a nutshell, gold’s short-term outlook has deteriorated following last week’s channel breakout. The technical signals are not very encouraging at the moment, though a close above 1,845 could allow for some extra recovery.
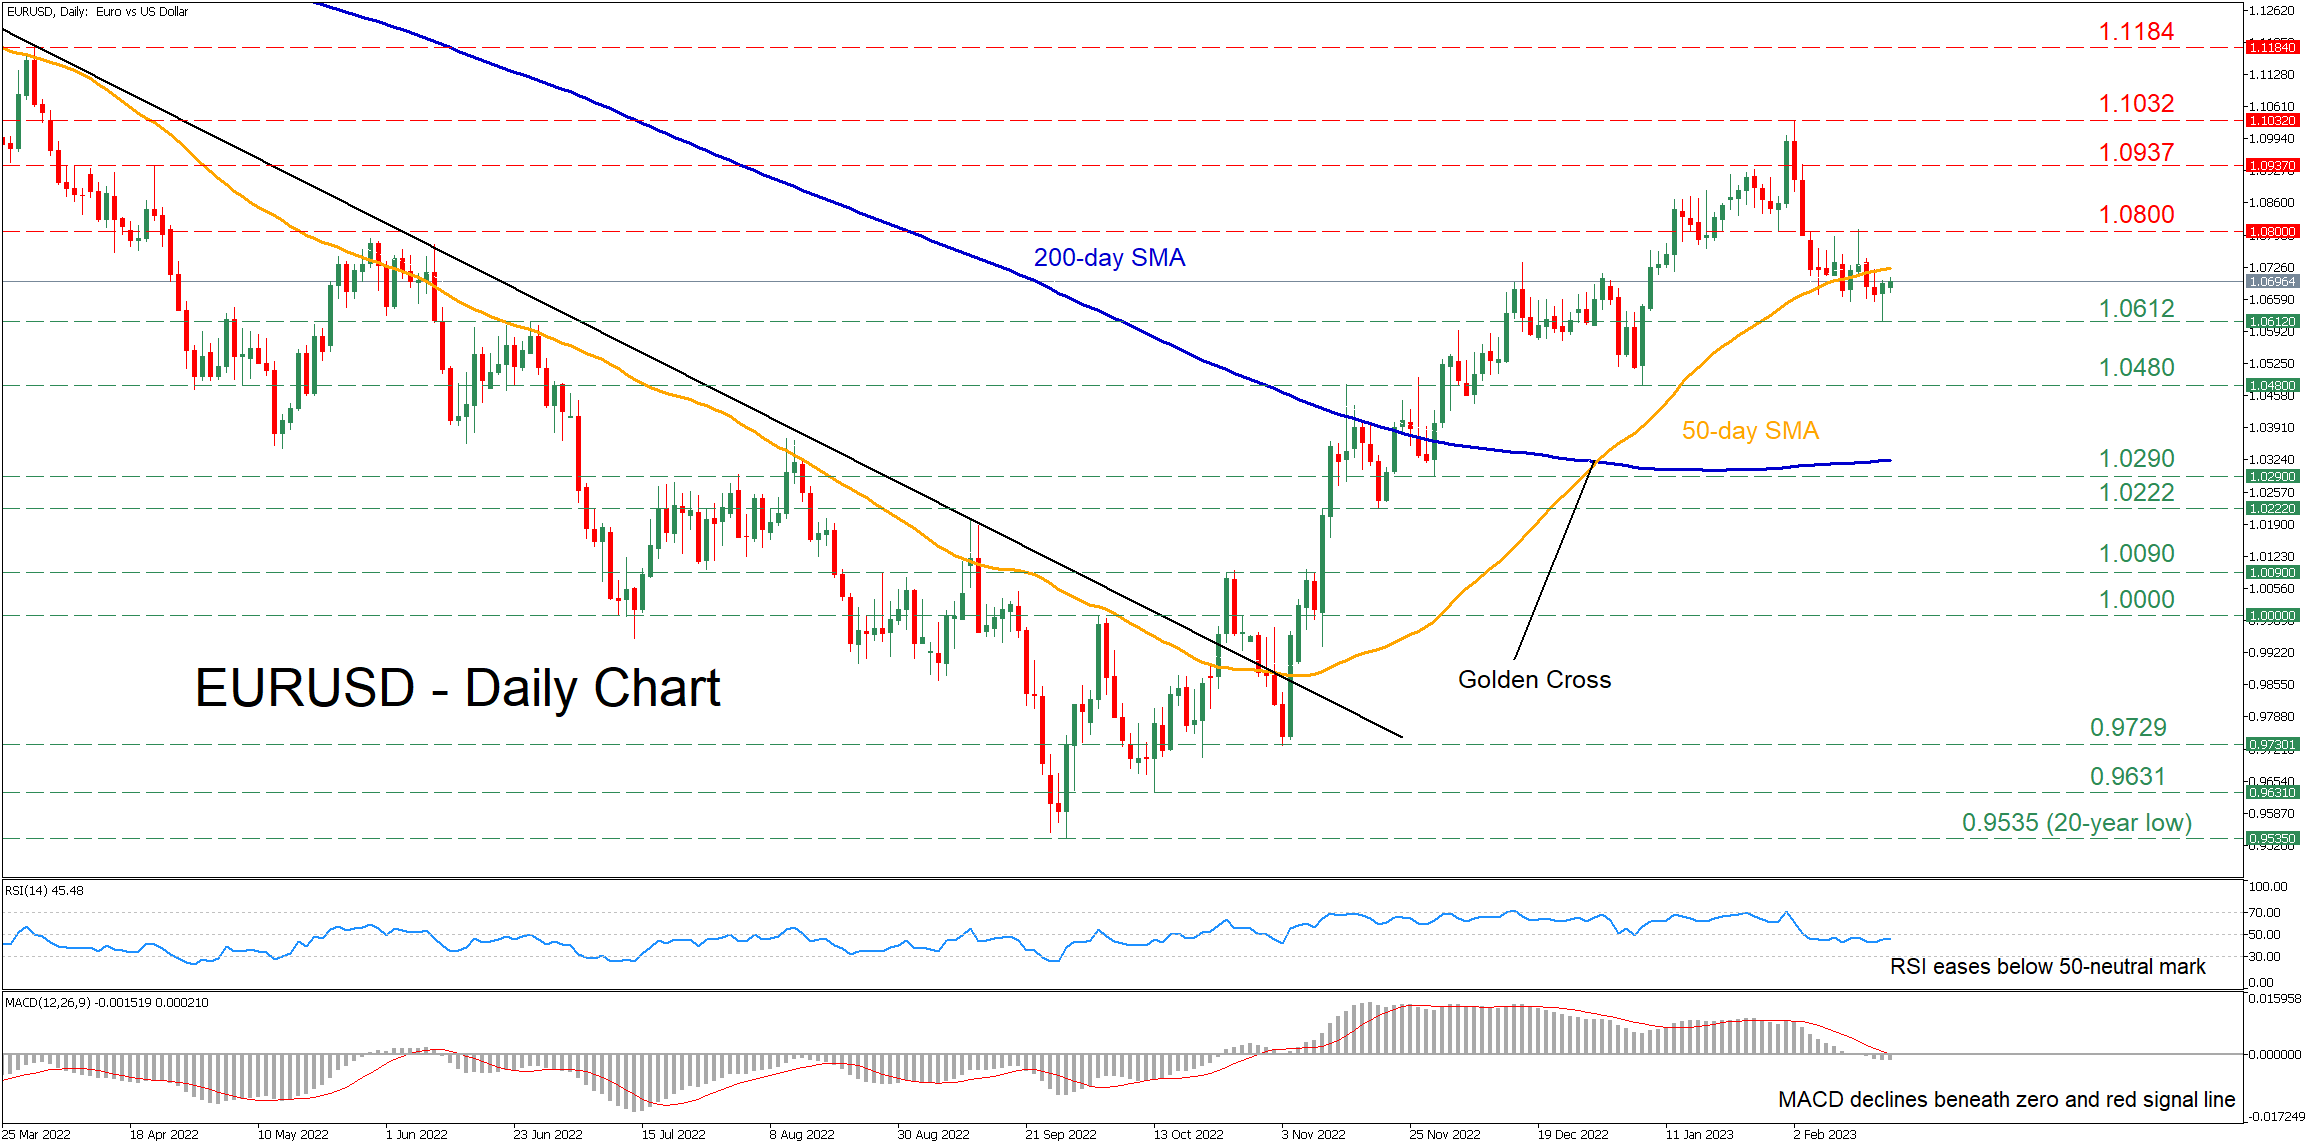
EURUSD Extends Pullback Below 50-day SMA
EURUSD has been on a steep uptrend after finding its feet at the 20-year low of 0.9535, storming to a fresh 10-month high in early February. However, the pair experienced a moderate downside correction, with the price diving below its 50-day simple moving average (SMA) in the last couple of daily sessions.
The momentum indicators currently suggest that bearish forces have gained the upper hand. Specifically, the RSI has flatlined beneath its 50-neutral mark, while the MACD histogram is weakening further below both zero and its red signal line.
Should selling pressures persist, the pair could test its recent support region of 1.0612. Sliding beneath that floor, further declines could cease at the January bottom of 1.0480. Even lower, a violation of the November support of 1.0290, which lies very close to the 200-day SMA, might shift the technical picture back to bearish.
On the flipside, if buyers re-emerge and manage to push the price above its 50-day SMA, initial resistance could be met at the 1.0800 hurdle. Conquering this barricade, the bulls could aim for the crucial 1.0937 region, which also provided strong resistance in April 2022. A break above that zone could open the door for the 10-month peak of 1.1032.
In brief, EURUSD has been under some selling pressure lately, dropping beneath its 50-day SMA for the first time since early November. Therefore, the downside move could extend in the case that the pair fails to reclaim this crucial barrier.
EUR/USD: Key Economic Events this Week Eyed for Fresh Direction Signals
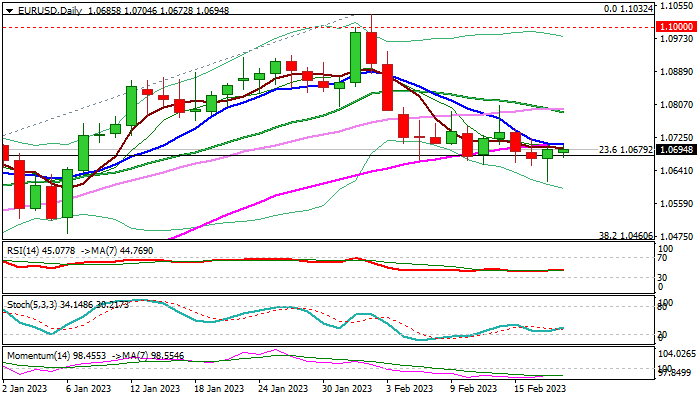
The Euro is trading within a narrow range in early Monday, keeping near-term action in directionless mode for almost two weeks.
Multiple failure at pivotal Fibo support at 1.0679 (23.6% of 0.9535/1.1032) points to strong bids, with Friday’s long-tailed daily candle adding to signals of downside rejection, with the action being underpinned by thick rising daily cloud.
On the other hand, near-term action remains limited by falling 10DMA, with long upper shadows of daily candles, pointing to increased pressure, along with prevailing bearish tone of daily studies (strong negative momentum / MA’s in bearish configuration).
Two strong opposite forces keep the pair in directionless mode and awaiting direction signals.
A number of key economic releases EU and Germany are in focus this week and expected to provide fresh signals and push the Euro out of current range.
Res: 1.0705; 1.0787; 1.0822; 1.0872.
Sup: 1.0679; 1.0612; 1.0519; 1.0483.