Sample Category Title
What Does the New BoJ Governor Mean for Yen?
On February 14, the Japanese government officially nominated Kazuo Ueda for taking the helm at the Bank of Japan when Haruhiko Kuroda steps down in April. This has left investors scratching their heads to figure out whether and when the BoJ will scale back its ultra-loose monetary policy as inflation continues to creep up. What does the new Governor mean for the financial community and how might the yen perform hereafter?
Kazuo Ueda set to succeed Governor Kuroda
At its December gathering, the Bank of Japan decided to adjust its yield curve control policy for the first time since March 2021. Officials decided to widen the range of the target band on the 10-year JGB yield from ±25 to ±50 basis points around 0%, which raised massive speculation that the Bank may have started its own tightening crusade at a time when other major central banks, like the Fed, are getting closer to the exit.
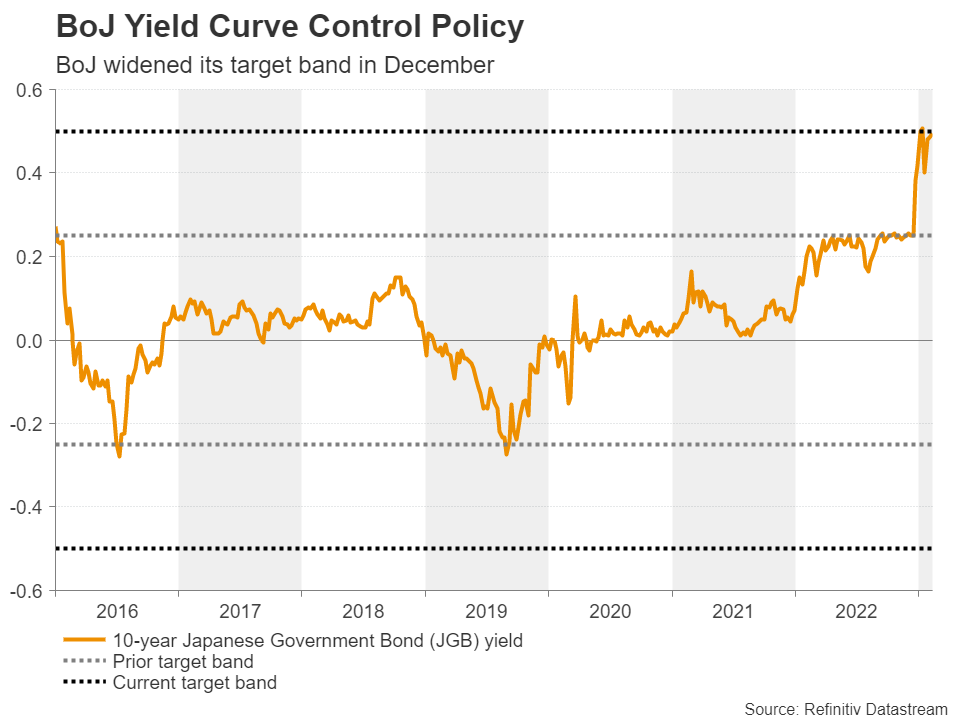
That said, policymakers themselves poured cold water on such expectations at the January gathering, when they decided not to further tweak their yield curve control policy. Rumors that BoJ deputy governor Masayoshi Amamiya, an outright policy dove, will be Kuroda’s successor disappointed yen bulls further and combined with a spectacular jump in US payrolls, this resulted in a rally in dollar/yen.
Just last Friday, the pair pulled back as the yen regained some ground on the first rumor that Ueda will instead be the government’s choice. Traders jumped to the conclusion that he was very unlikely to be as dovish as Amamiya, but they were quickly disappointed again after Ueda said that the current monetary policy remains appropriate.
Perhaps he tried to avoid expressing his personal opinion or making any bold policy comments before he was officially nominated. The government also nominated Ryozo Himino, a former head of Japan’s banking watchdog, and BoJ executive Shinichi Uchida as deputy governors. The nominations still need approval from the Japanese parliament, but with the ruling coalition holding solid majorities in both chambers, it seems like a done deal.
A hawk or a dove?
So, who is Ueda and what does his nomination mean for the BoJ? Kazuo Ueda is an academic with a PhD from the Massachusetts Institute of Technology (MIT). People who know him say that he is a pragmatic policymaker-type academic, who will be willing to adjust according to the needs of the economy. They say that he is a listener and a consensus builder rather than a person with a strong view and a hard line on monetary policy. This makes it hard to categorize him as either a hawk or a dove.
In a column he published last July, Ueda argued against raising interest rates prematurely, but he highlighted the difficulty of maintaining yield curve control as inflation bites harder and pointed to the flaws of this policy. This may be a first sign that he may not be in a rush to take interest rates out of negative territory, but also that he may not hesitate to scrap yield curve control policy entirely should economic conditions warrant so.
Inflation continues to accelerate, wage growth spikes
Regarding Japan’s economy, the country dodged a recession in Q4, as it returned to expansion after contracting in Q3. However, growth was slower than expected as business investment slumped, suggesting that phasing out loose monetary policy conditions may not be an easy task for the Bank of Japan.
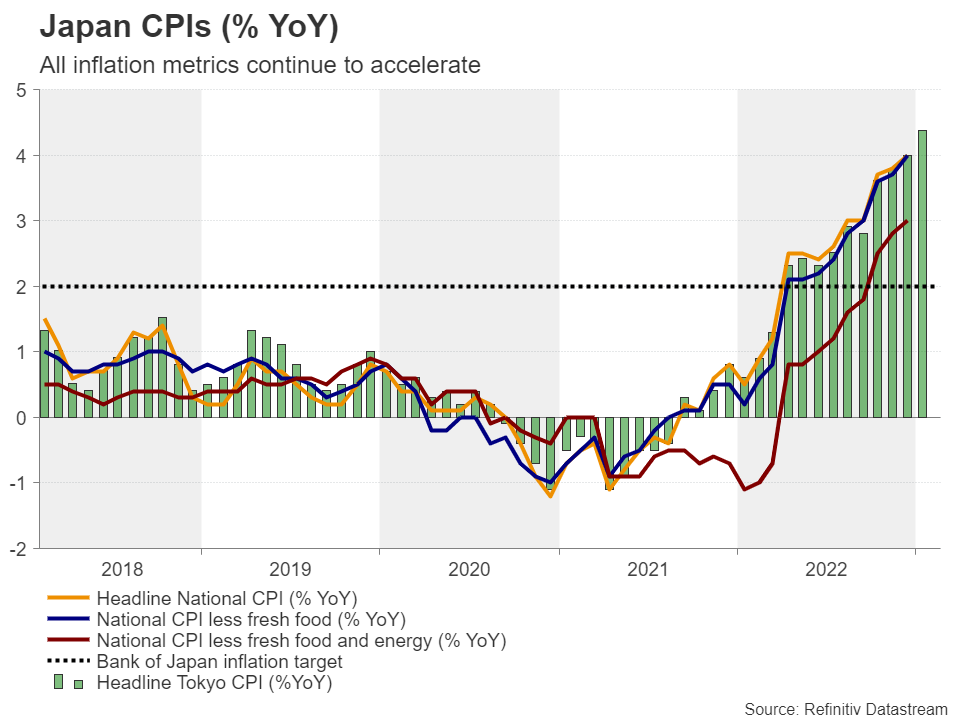
Having said that, though, inflation accelerated to 4% in December in both headline and core terms, which is double the BoJ’s objective of 2% and the highest in 41 years, while the acceleration in the Tokyo CPIs for January keeps the risks tilted to the upside.
The elephant in the room, however, may be the surge in December’s total cash earnings by 4.8% y/y, the fastest pace in 26 years, which led to the first increase in real wages since March despite accelerating inflation. With Governor Kuroda repeatedly stressing the need to keep ultra-loose policy until wages increase by around 3%, it seems strange that the yen did not respond to this data point.
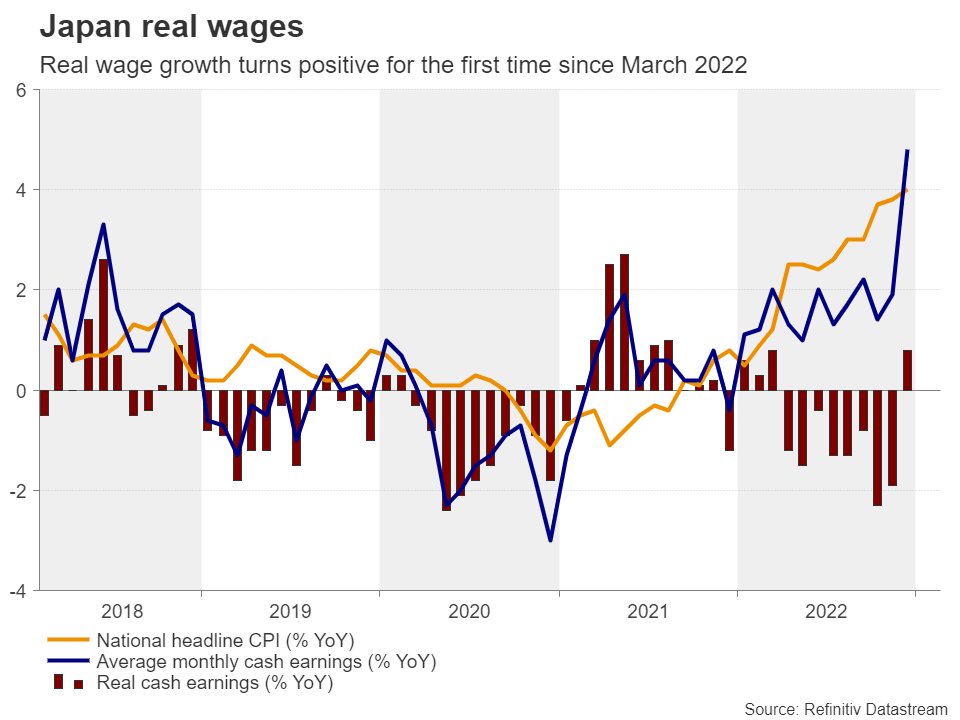
All in all, flying inflation and surging wages are a cocktail that warrants scaling back more accommodation, and that seems to have been the case even before the “shunto” wage negotiations that started on January 23. Should firms agree with unions on pay increases, speculation that the BoJ may need to make another move towards normalization is very likely to increase substantially.
Normalization bets could fuel yen’s engines
With Ueda appearing to be a patient person in terms of interest rates, the focus will be on yield curve control and whether it can be abandoned. Should he become more vocal on that front as he gets closer to taking the spot, the yen’s engines may restart but whether the prevailing downtrend in dollar/yen could resume remains a mystery.
The dollar has been enjoying gains recently as investors substantially raised their implied path with regards to the Fed’s future rate increases, while on top of that, China’s reopening and estimates that the Eurozone may have averted a recession have kept risk sentiment supported and thereby the safe-haven yen weak.
A long way to go before dollar/yen downtrend resumes
For the prevailing downtrend in dollar/yen to continue, a clear dip below 127.20 may be needed. This will confirm a lower low on the daily chart and may pave the way towards the psychological zone of 125.00, marked by the inside swing high of March 28, 2022. If that zone fails to withstand the pressure, its break may set the stage for extensions towards the low of March 31 at 121.25.
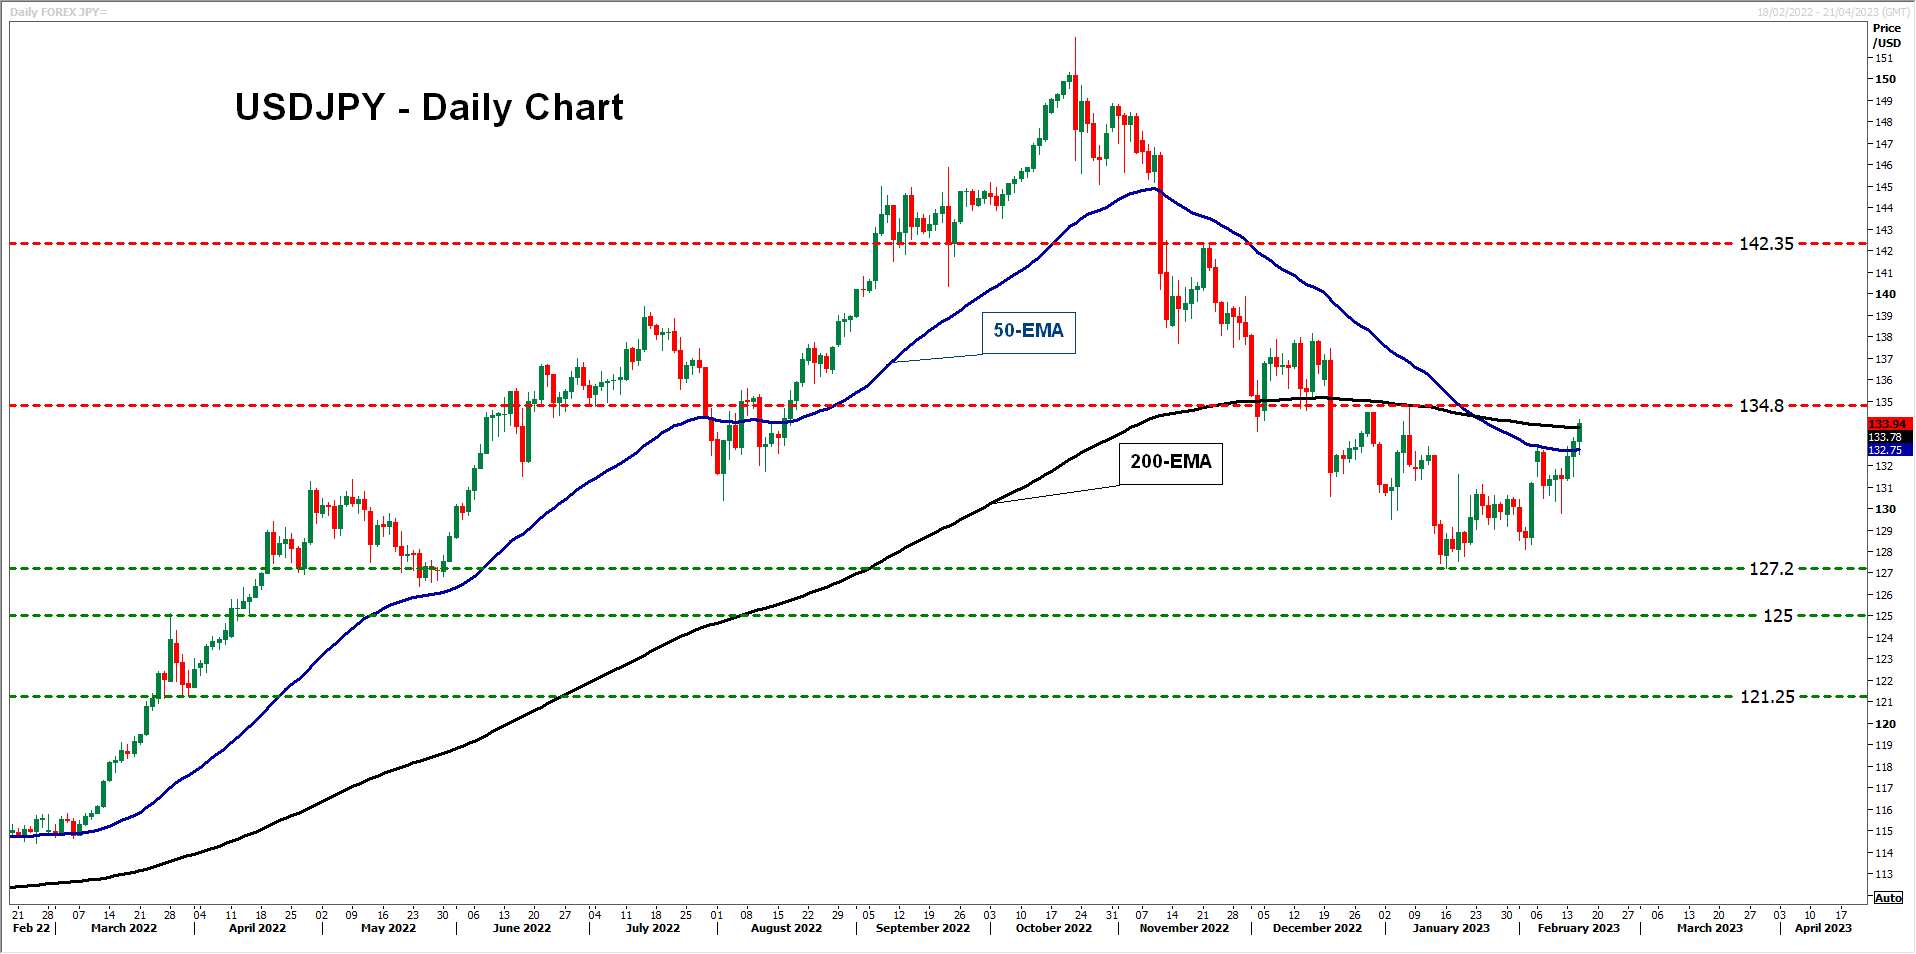
Now, if Ueda’s language is interpreted as more dovish than expected, dollar/yen may extend its recovery. A break above 134.80 would take the pair above both the 50- and 200-day exponential moving averages (EMAs) and may allow advances towards the key territory of 138.00. That zone acted as key resistance between December 7 and 16 and provided decent support between November 15 and 28. Should the bulls defeat the bears there as well, they may then extend their march towards the peak of November 22 at 142.35.
Bitcoin Price Rallies Over 10% To Clear Hurdles
Key Highlights
- Bitcoin price started a fresh increase above the $23,000 resistance.
- BTC broke a major bearish trend line at $22,215 on the 4-hours chart.
- Gold price declined further below $1,850 and $1,842.
- EUR/USD remains at a risk of more losses below 1.0700.
Bitcoin Price Technical Analysis
Bitcoin price formed a base and started a fresh increase above $22,000 resistance. BTC/USD surpassed key hurdles near $22,200 to move into a short-term positive zone.
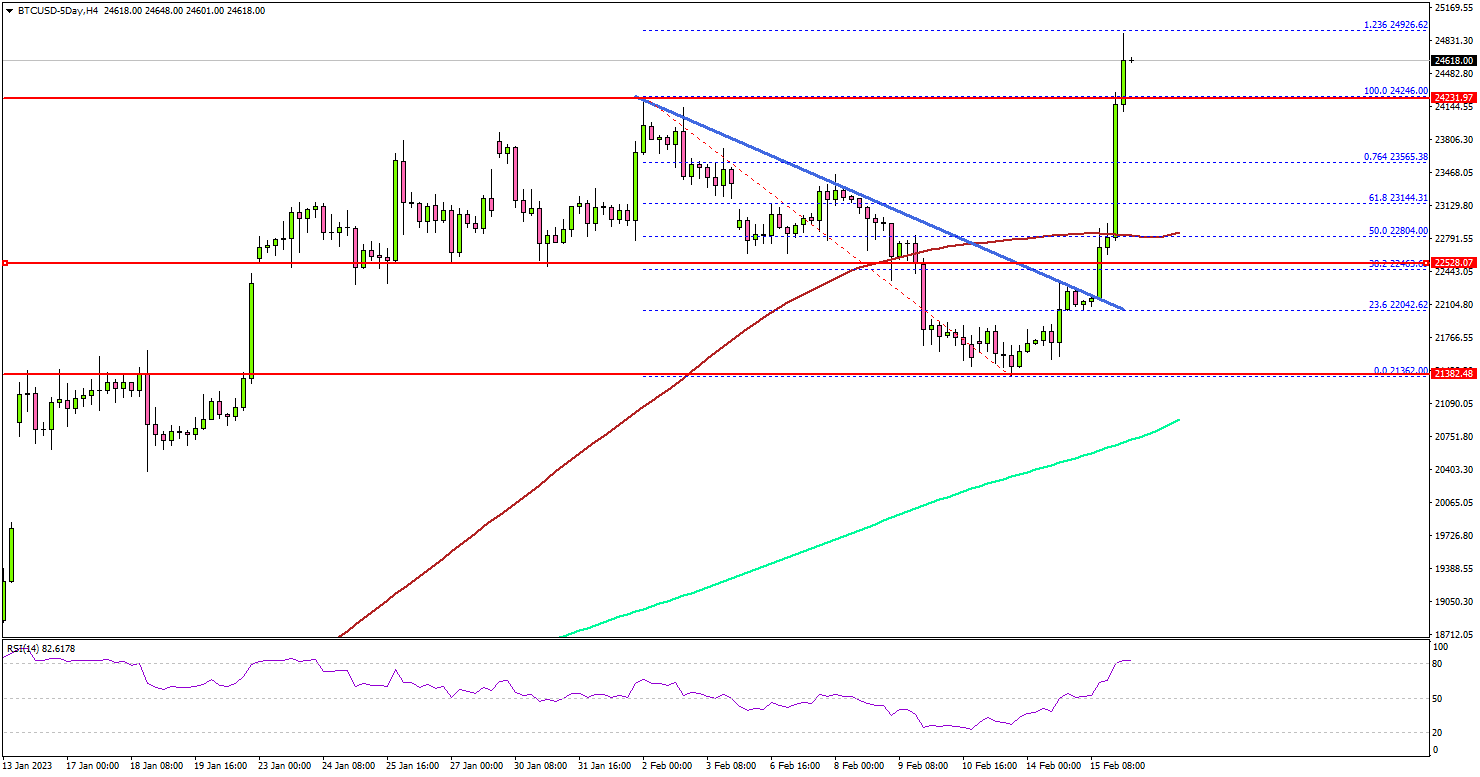
Looking at the 4-hours chart, the price traded above the $22,400 resistance and remained well above the 200 simple moving average (green, 4-hours). It also cleared a major bearish trend line at $22,215.
BTC surged above the $22,800 resistance and the 100 simple moving average (red, 4-hours). Finally, there was a spike above the last swing high at $24,246.
The bears appeared near the $25,000 resistance zone. It is close to the 1.236 Fib extension level of the downward move from the $24,246 swing high to $21,362 low. A close above the $25,000 level may perhaps start another steady increase in the coming sessions.
In the stated case, the price could rise towards the $26,200 level. Any more gains could set the pace for a move towards the $27,000 level.
On the downside, an initial support sits near the $24,250 level. The main breakdown support sits near the $23,250 zone. If there is a downside break and close below $23,250, bitcoin might start another decline in the coming days. In the stated case, it could revisit the $22,500 support or even test $21,400.
Economic Releases
- US Initial Jobless Claims - Forecast 200K, versus 196K previous.
- US Housing Starts for Jan 2023 (MoM) – Forecast 1.360M, versus 1.382M previous.
- US Building Permits for Jan 2023 (MoM) – Forecast 1.350M, versus 1.337M previous.
US 500 Index Rebound Runs into Trouble at 50% Fibo
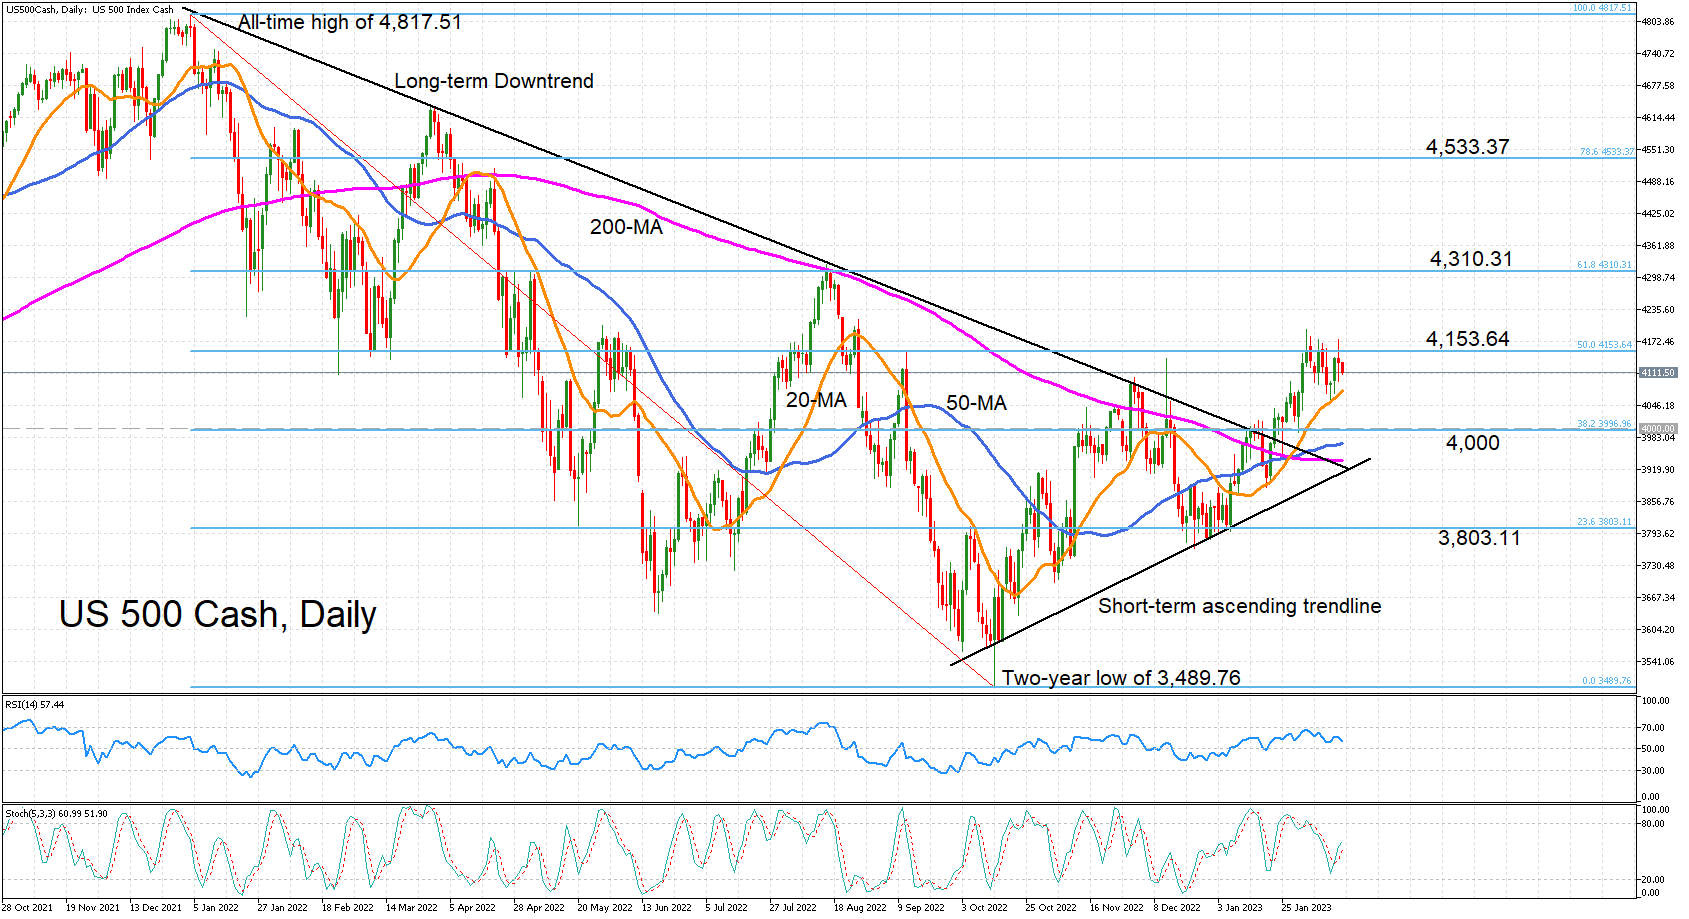
The US 500 stock index (cash) has been edging sideways after the rebound from October’s two-year low of 3489.76 hit the buffers near the 50% Fibonacci retracement of the correction from the all-time high of 4,817.51. The latest upward attempt came on Tuesday, but the bulls could only manage a brief spike above the 50% Fibo of 4,153.64.
The positive momentum has since started to wane, although it has not completely dissipated. The RSI is sloping downwards but is holding a fair distance above the 50 neutral level, while the %K and %D lines of the stochastic oscillator remain positively aligned. Both suggest that further upside is possible in the short term even though the downside risks are increasing.
The 20-day simple moving average (SMA) has been a reliable support for this rebound over the past month and could again shield against steeper selloffs. However, if this support crumbles, there would be nothing stopping the index from hitting the psychologically important 4,000 level. Lower down, the 50- and 200-day SMAs stand ready to halt further declines at 3,970 and 3,938, respectively. But breaching these would bring into scope the ascending trendline as the final hurdle keeping the uptrend intact.
On the other hand, if the bulls succeed in cracking above the 50% Fibonacci, the next big test would come at the 61.8% Fibonacci of 4,310.31, which coincides with the August 2022 top, followed by the 78.6% Fibonacci of 4,533.37.
Summing up, clearing the 50% Fibonacci is essential if the benchmark index will continue to make a recovery towards its all-time high, as is holding above the ascending trendline.
Sunset Market Commentary
Markets
Another US data beat. Retail sales jumped 3% m/m (headline series) in January after two weak months end last year. That’s more than the 2% expected. All 13 categories printed an increase in sales. The control group excluding food services, gas, building materials and cars also rose by a more-than-expected 1.7% m/m. This series is viewed as more indicative for consumer spending. Demand is still robust and has the excellent shape of the labour market to thank for. On a sidenote, the Empire Manufacturing index also recovered by more than anticipated, from -32.9 to -5.8. The recent (exceptionally) strong US data mean the Fed’s work isn’t done, in our view (which is increasingly shared by Fed governors) not even when it hit the December dot plot terminal rate of 5-5.25%. US yields added a few more bps to their earlier advance before paring gains back to pre-retail sales’ levels. Current changes amount to 2.6-3.8 bps across the curve. European yields gain a few bps as well. The euro 10y swap yield is testing the symbolic 3% barrier for the first time since the start of the year. The dollar benefits. Trade-weighted DXY flirted with the 104 recent high. A break didn’t occur though with a not too bad equity sentiment capping the greenback’s gains. EUR/USD is intensively testing support at 1.068. A close at or below that level implies losing the upward sloping trend channel.
UK inflation decelerated more than expected in January, wrongfooting those anticipating a US-like surprise. Price growth eased from 10.5% to 10.1% (10.3% expected). The core gauge fell from 6.3% to 5.8% compared to the 6.2% estimate. The Bank of England put the next rate hike conditional on “evidence of more persistent inflationary pressures”. But among the indicators it has on its watch list aside from inflation, is “tightness of the labour market”. We currently expect two more 25 bps rate hikes to 4.5%. Despite the setback today, UK money markets do too. Gilt yields ease 5.7-10 bps across the curve after surging by double digits (starting with a “2” at the front end) yesterday. Sterling takes a hit and by doing so EUR/GBP’s upward sloping trend channel was saved by the bell. EUR/GBP surpasses 0.8867 resistance and comes close to a test of the next one at 0.8897. Cable (GBP/USD) tests 1.20 support, with dollar strength (after US retail sales) adding to the downleg.
The Kingdom of Belgium successfully auctioned a €5bn 30y (OLO98, June 22, 2054) bond, priced at OLO95 +8 bps compared to +10 bps area guidance. Books ran above €34bn. With today’s syndication, the debt agency has completed about 28% of its €45bn OLO funding need. With the dual debt offering, the Slovak Republic placed a €2bn 12y (Feb 23, 20235) bond, priced at MS+80 (vs +95 guidance) and a €1.5bn 20y (Feb 23, 2043) bond, priced at MS+120 (vs +130 guidance). Books for each bond sale ran above €6.7bn and €5.5bn respectively.
News & Views
According to Statistics Poland, inflation in January reaccelerated to 2.4% M/M and 17.2% Y/Y (from 0.1% M/M and 16.6% Y/Y). The rise was mainly driven by a 6.0% M/M jump in costs for dwelling, including a 10.4% monthly rise in prices for electricity, gas and other fuels as some of last year’s tax cuts were reversed. Food prices increased 1.9% M/M. KBC estimates that core inflation rose to about 12% (11.5% in December). Poland’s central bank last week left its policy rate at 6.75%. The NBP hasn’t officially ended its rate hike cycle. But governor Glapinski assessed the current level as appropriate to bring inflation back to the 2.5% (+/- 1.0%) target. The zloty since end last year weakened from EUR/PLN 4.63 to almost EUR/PLN 4.80 earlier this week. It rebounds slightly further today (4.7575).
Total Norwegian GDP increased 0.2% Q/Q in Q4 2022 compared to 1.3% in Q3. Mainland activity grew at 0.8% Q/Q, the same pace as in Q3. Growth was mainly driven by final consumption expenditure (5.9% Q/Q). Government consumption rose 0.9% Q/Q. Gross fixed capital formation was 2.1% higher. Exports fell 0.8% in Q4, mainly due to gas and oil while imports increased 2.6%. Despite strong fundamentals, the Norwegian krone since September was caught in a weakening trend against the euro. The Norges Bank kept a gradual tightening approach. At the January meeting it left its policy rate unchanged at 2.75%, but signaled an additional step of 25 bps in March. Strong demand and persistent high inflation (Jan 7.0% Y/Y) leave the door open for additional steps post March. After a brief NOK rebound over the previous week (post ‘hawkish’ Riksbank), the krone fails to extend gains (EUR/NOK 10.9175).
USD/JPY Mid-Day Outlook
Daily Pivots: (S1) 131.97; (P) 132.65; (R1) 133.77; More...
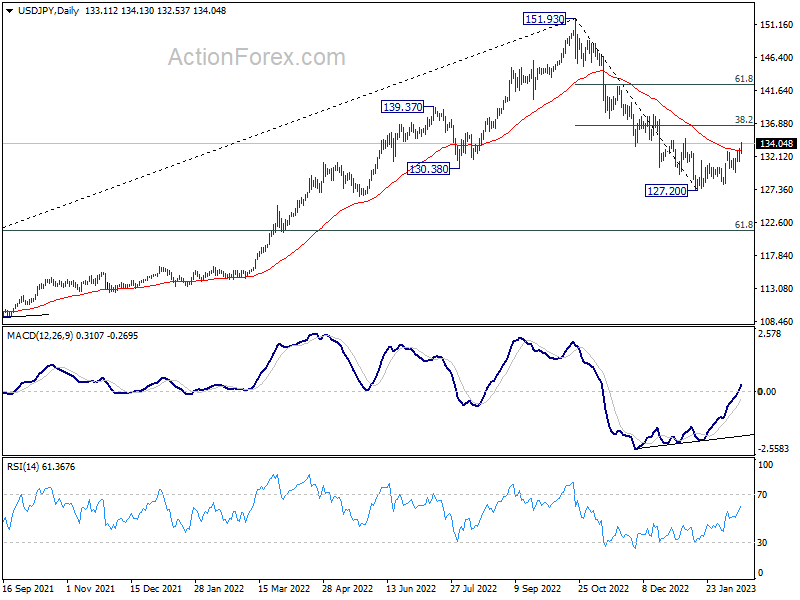
USD/JPY's rise from 127.20 short term bottom is in progress. Intraday bias stays on the upside for 38.2% retracement of 151.93 to 127.20 at 136.64, even as a correction to the decline from 151.39. On the downside, break of 131.49 minor support will turn intraday bias neutral again first.
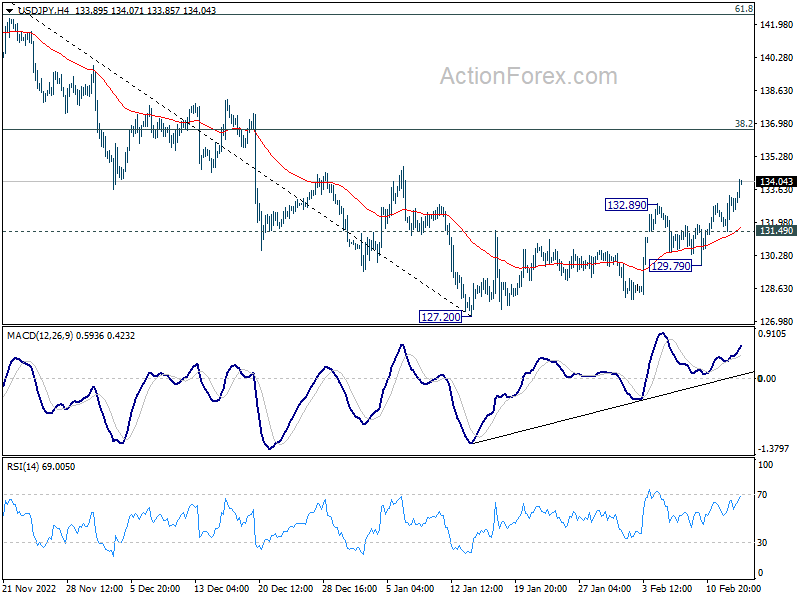
In the bigger picture, prior of 55 week EMA (now at 131.47) raises the chance of medium term bearish reversal, but that's not confirmed yet. Strong rebound from current level, followed by sustained break of 38.2% retracement of 151.93 to 127.20 at 136.64 will argue that price actions from 151.93 is merely a corrective pattern. However, rejection by 136.64 will solidify medium term bearishness for 61.8% retracement of 102.58 to 151.93 at 121.43 and 38.2% retracement of 75.56 to 151.93 at 122.75.
USD/CHF Mid-Day Outlook
Daily Pivots: (S1) 0.9159; (P) 0.9196; (R1) 0.9255; More...
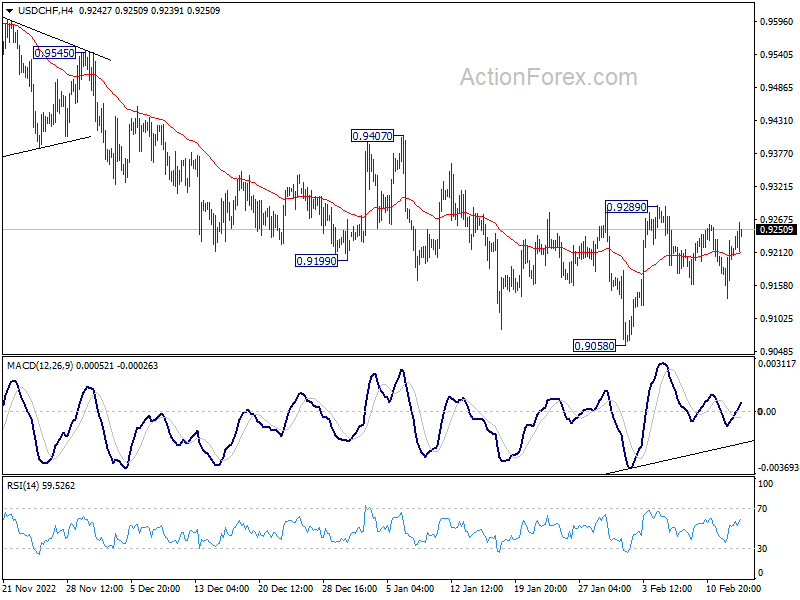
Outlook in USD?CHF remains unchanged and intraday bias stays neutral. On the upside, firm break of 0.9289 resistance will confirm short term bottoming at 0.9058, and bring stronger rise to 0.9407 resistance. On the downside, however, sustained break of 0.9058 will resume larger decline from 1.0146 instead.
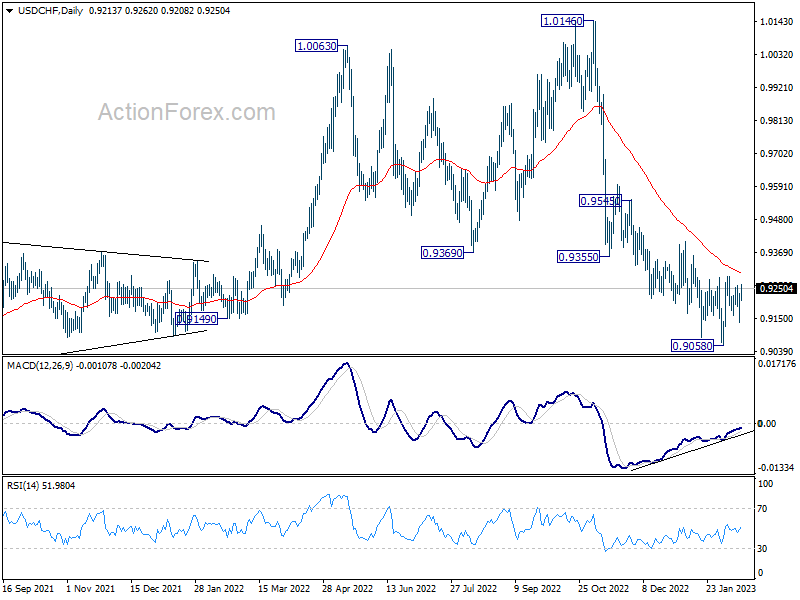
In the bigger picture, rise from 0.8756 (2021 low) has completed at 1.0146, well ahead of 1.0342 long term resistance (2016 high). Based on current downside momentum, fall from 1.0146 should be a medium term down trend itself. Next target is a test on 0.8756 low. Strong support should be seen there to bring rebound. Still, further decline will be expected as long as 0.9407 resistance holds, in any case.
GBP/USD Mid-Day Outlook
Daily Pivots: (S1) 1.2107; (P) 1.2187; (R1) 1.2256; More...
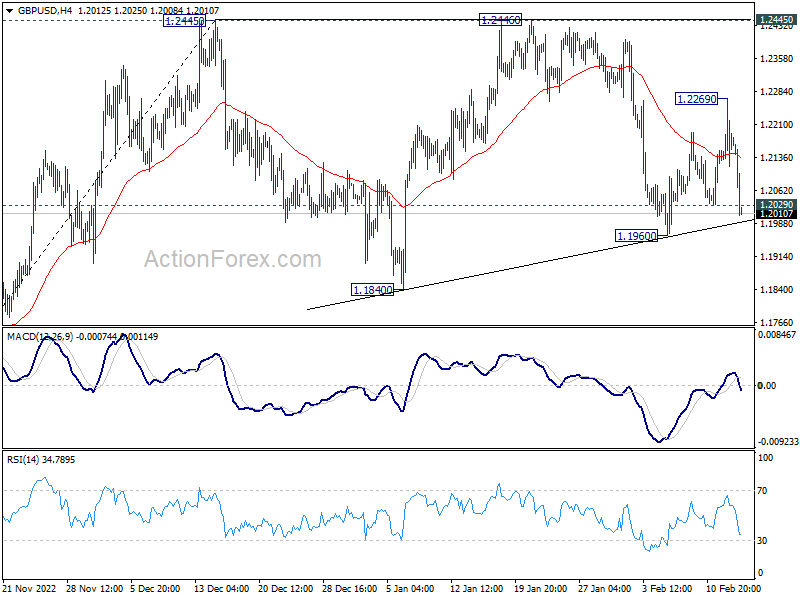
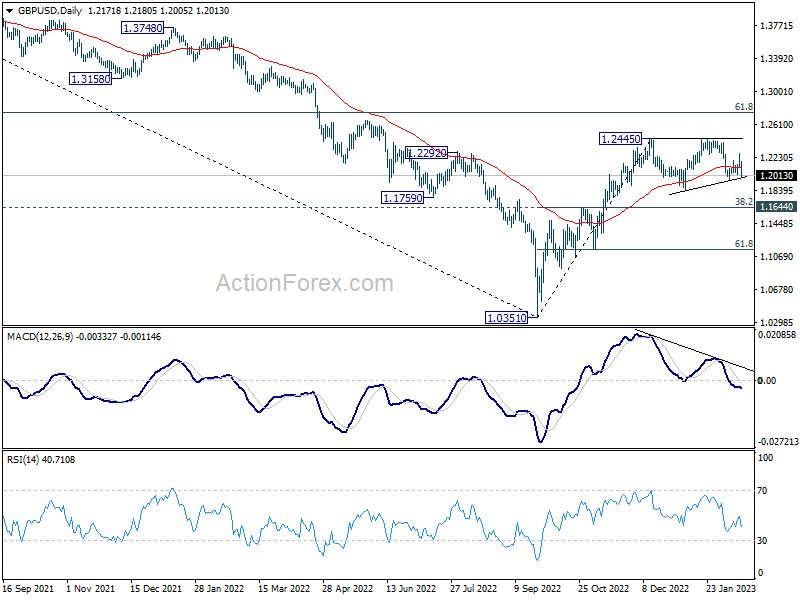
GBP/USD's decline today and break of 1.2029 minor support suggests that fall from 1.2446 is resume. Intraday bias is back on the downside for 1.1960 support first. Break will target 1.1840 support. Overall, price action from 1.2445 are seen as a corrective pattern, break of 1.2269 will suggest that such pattern has finally completed.
In the bigger picture, rise from 1.0351 medium term bottom is at least correcting whole down trend from 1.4248 (2021 high). Further rise is expected as long as 1.1644 resistance turned support holds. Next target is 61.8% retracement of 1.4248 to 1.0351 at 1.2759. Sustained break there will pave the way back to 1.4248.
US: Retail Sales Bounce Back in January, Beating the Estimate
Retail sales rebounded from December's weakness (unrevised at -1.1% m/m), gaining 3.0% month-on-month in January. Today's reading was a full percentage point higher than the consensus forecast for growth of 3.0%.
Sales at motor vehicle & parts dealers accounted for most gains with a 5.9% m/m gain in January. Gasoline station receipts were flat on the month despite a bounce back in gas prices.
Excluding autos and gas, sales were up 2.6% m/m – also above consensus expectations for a more moderate gain of 0.9% m/m.
Sales at building materials and garden equipment stores - another volatile category - were up 0.3% m/m. Stores in these category have the highest build-up in inventories relative to pre-pandemic average and may come under pricing pressure in the coming months.
Retail sales in the "control group" that excludes the above category and is used as a gauge personal consumption expenditures (PCE), rose by 1.7% m/m from a downwardly revised 0.7% m/m decline in December (-0.5% m/m reported previously). Again, this was above the consensus forecast for an increase of 1.0%.
- Among these, the largest contribution came from food services & drinking places (+7.2% m/m), with sales at general merchandise stores (+3.2% m/m) and non-store retailers (+2.8% m/m) were right behind. Sales at furniture stores, electronics & appliance stores (+4.1% m/m), miscellaneous stores retailers (+2.8% m/m), clothing & accessory stores (+2.5% m/m), and health & personal care stores (+1.9% m/m) each contributed one tenth of a percentage point to today's gains.
- The weakest growth was reported by food & beverage stores, which gained 0.1% on the month.
Key Implications
Like the weather, consumers mood warmed up for shopping in January. The biggest gains were picked up by auto dealers, where demand for cars was at least partially met by improving supply, as production continues to recover. But other categories prints were also very strong, with the three-months trend in real sales turning positive, gaining 2.8% on the month.
Several indicators suggest that the services sector continues to reclaim its place as the force that steadies the economy. January's ISM services report that proved December's contraction was a blip and demand factors are strong. An upward trend in real sales at restaurants and our estimates of leisure and travel activity (based on high-frequency card spend data) further corroborate consumers' healthy appetite for services spending. With that, we expect consumer spending growth to come in around half a percentage point in the first quarter of 2023.
EUR/USD Mid-Day Outlook
Daily Pivots: (S1) 1.0694; (P) 1.0749; (R1) 1.0791; More...
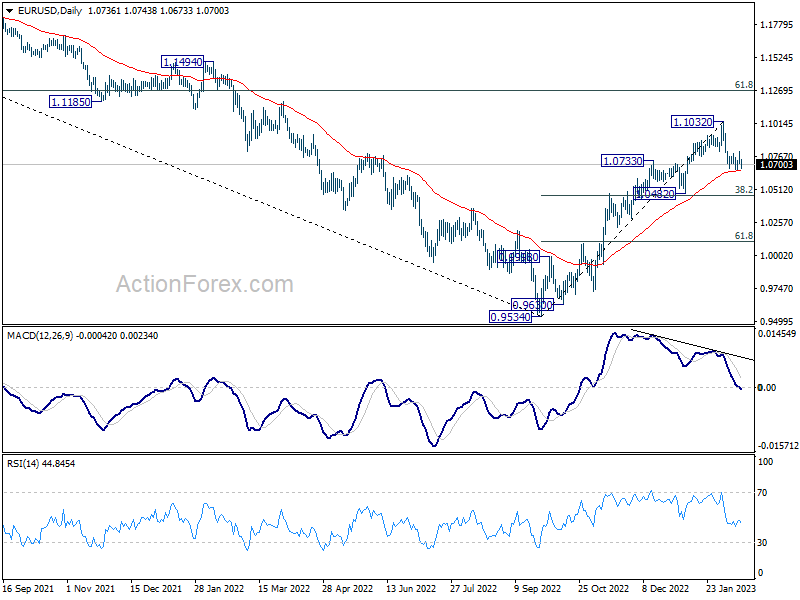
Focus is back on 1.0654 temporary low in EUR/USD with today's fall. Firm break there will resume the corrective fall from 1.1032 to 38.2% retracement of 0.9534 to 1.1032 at 1.0463. Strong support should be seen around there to bring rebound, at least on first attempt. On the upside, firm break of 1.0803 minor resistance will turn bias back to the upside for retesting 1.1032 high instead.
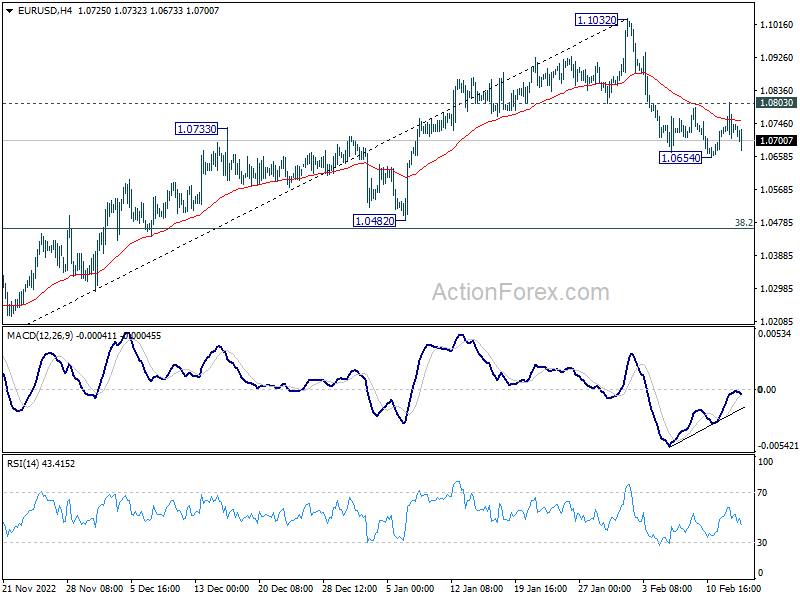
In the bigger picture, the rally from 0.9534 low (2022 low) is a medium term up trend rather than a correction. Further rise is in favor to 61.8% retracement of 1.2348 (2021 high) to 0.9534 at 1.1273 next. This will remain the favored case as long as 1.0482 support holds.