Sample Category Title
GBP/JPY: Will the Bullish Trend Reach 176.39?
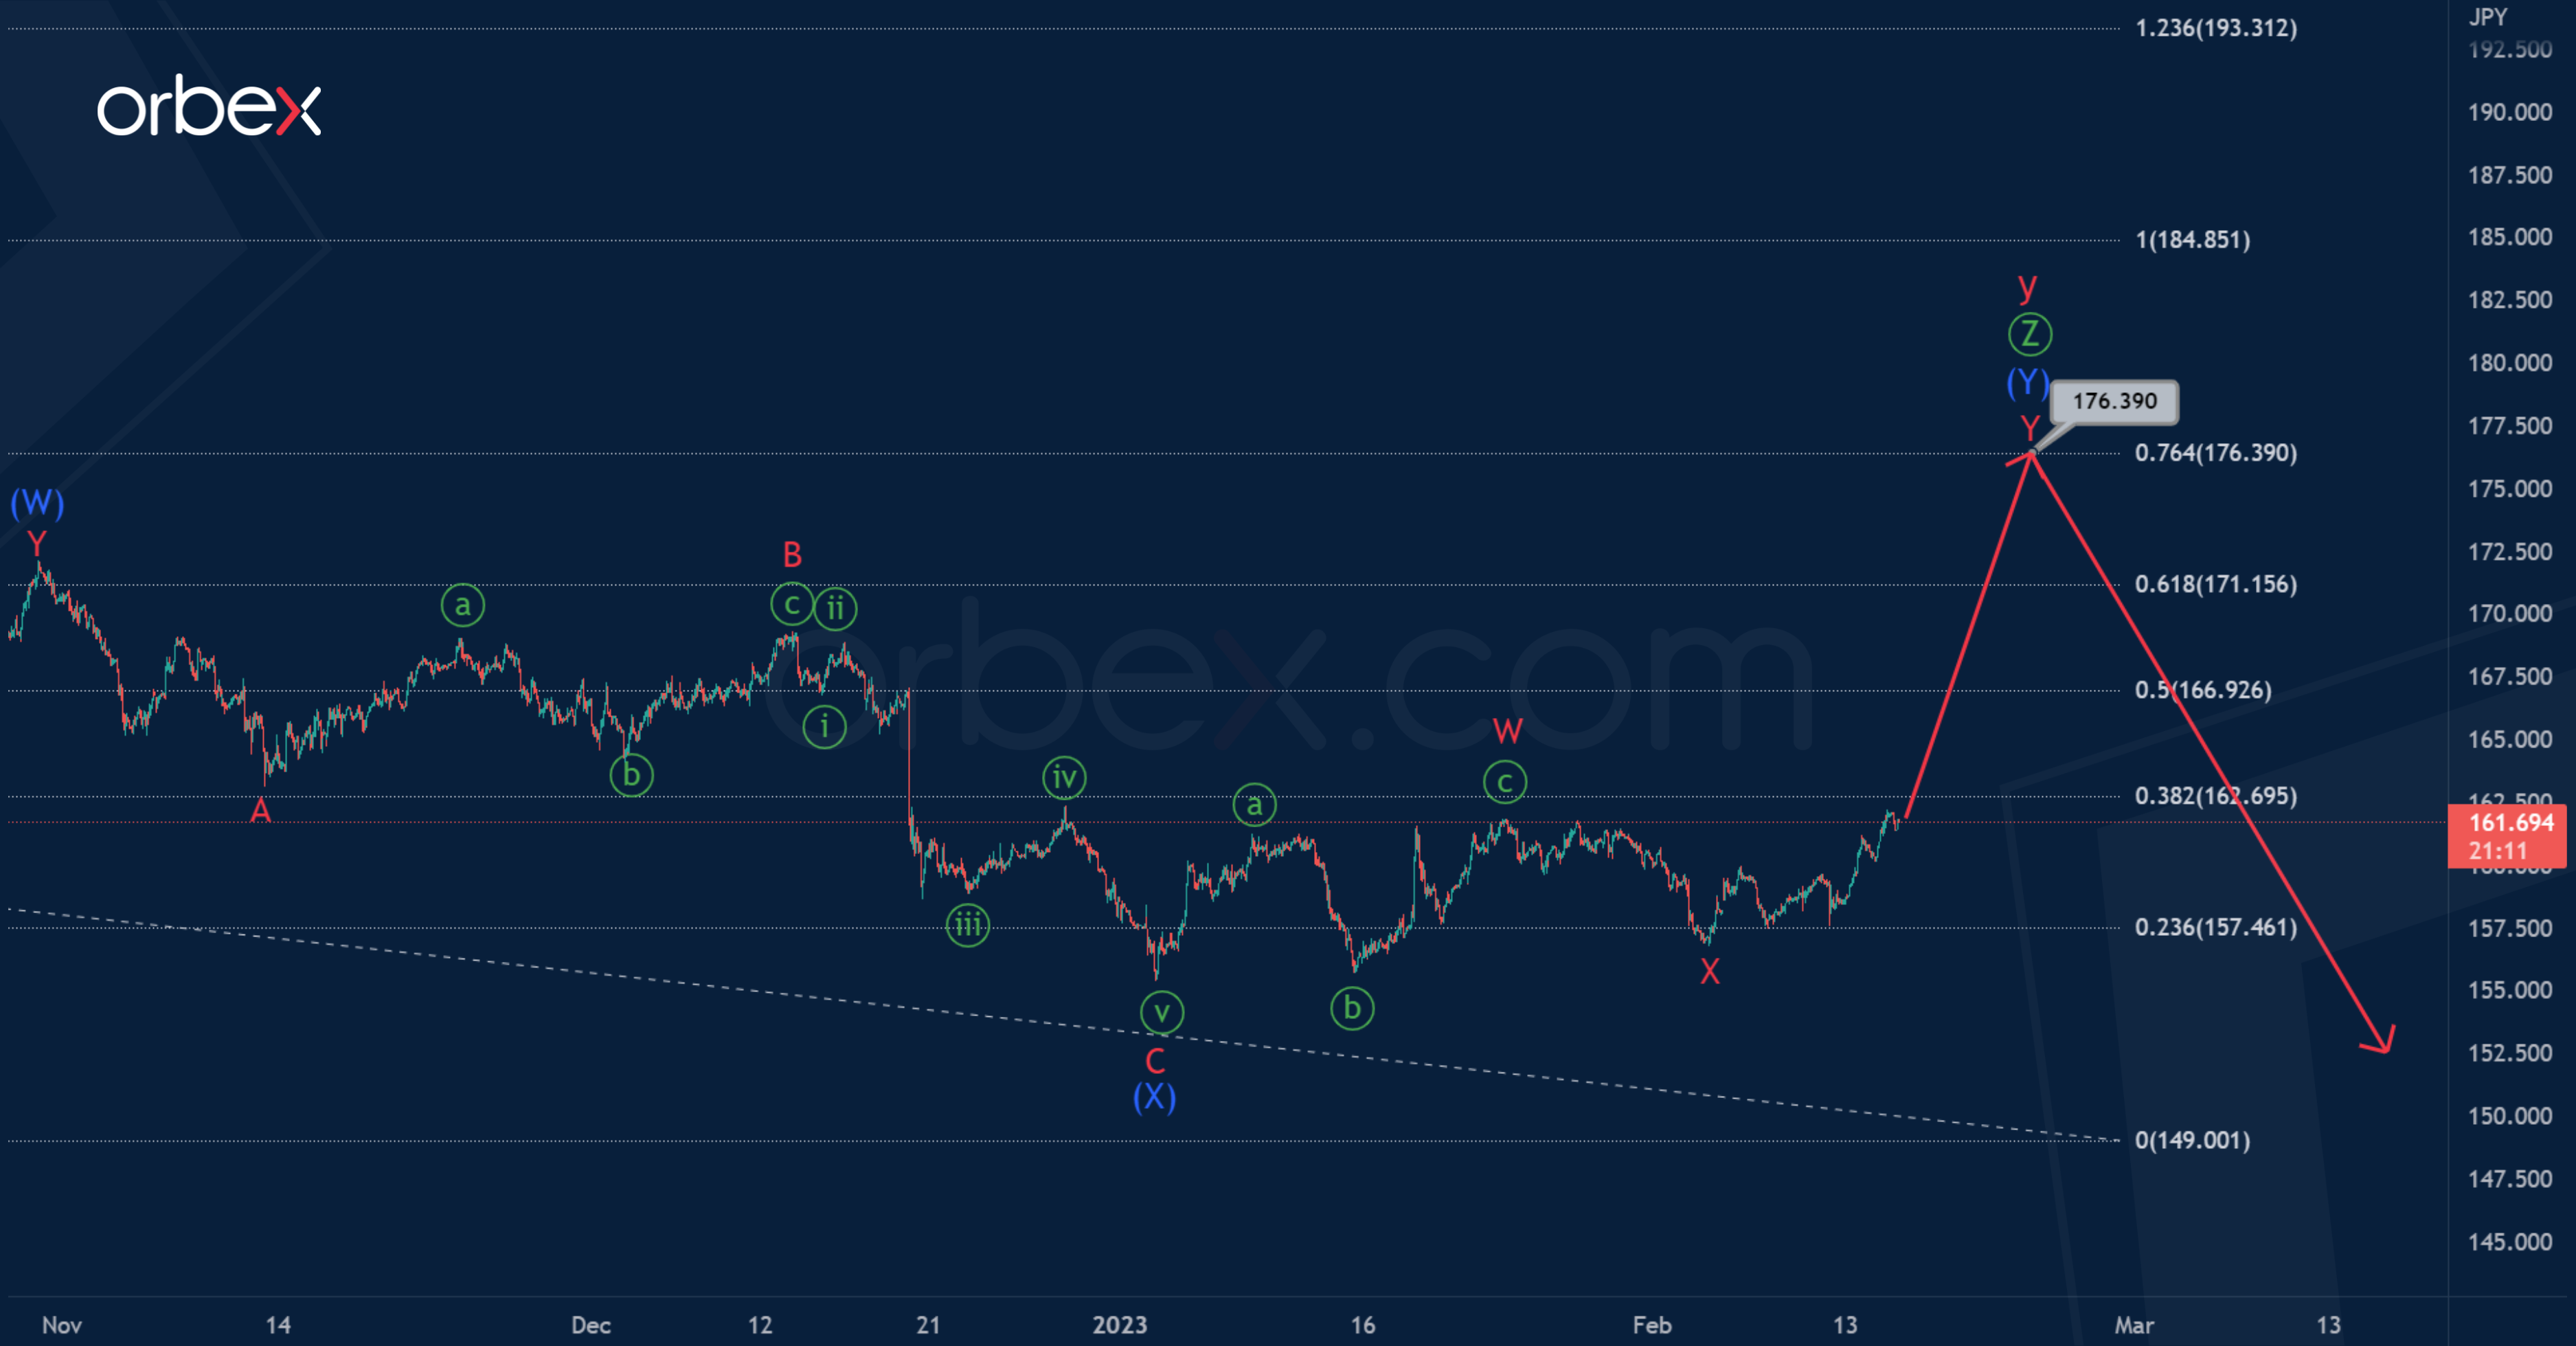
GBPJPY seems to be forming a large correction pattern - a triple zigzag Ⓦ-Ⓧ-Ⓨ-Ⓧ-Ⓩ, or rather its final part - the wave Ⓩ. It may take the form of an intermediate double zigzag (W)-(X)-(Y).
It is assumed that two sub-waves (W) and (X) have already been formed. Now the last actionary wave (Y) is being built, which can take the form of a double zigzag W-X-Y. To complete this double zigzag , a minor sub-wave Y is needed.
The bulls are targeting at 176.39. At that level, wave (Y) will be at 76.4% of previous actionary wave (W).
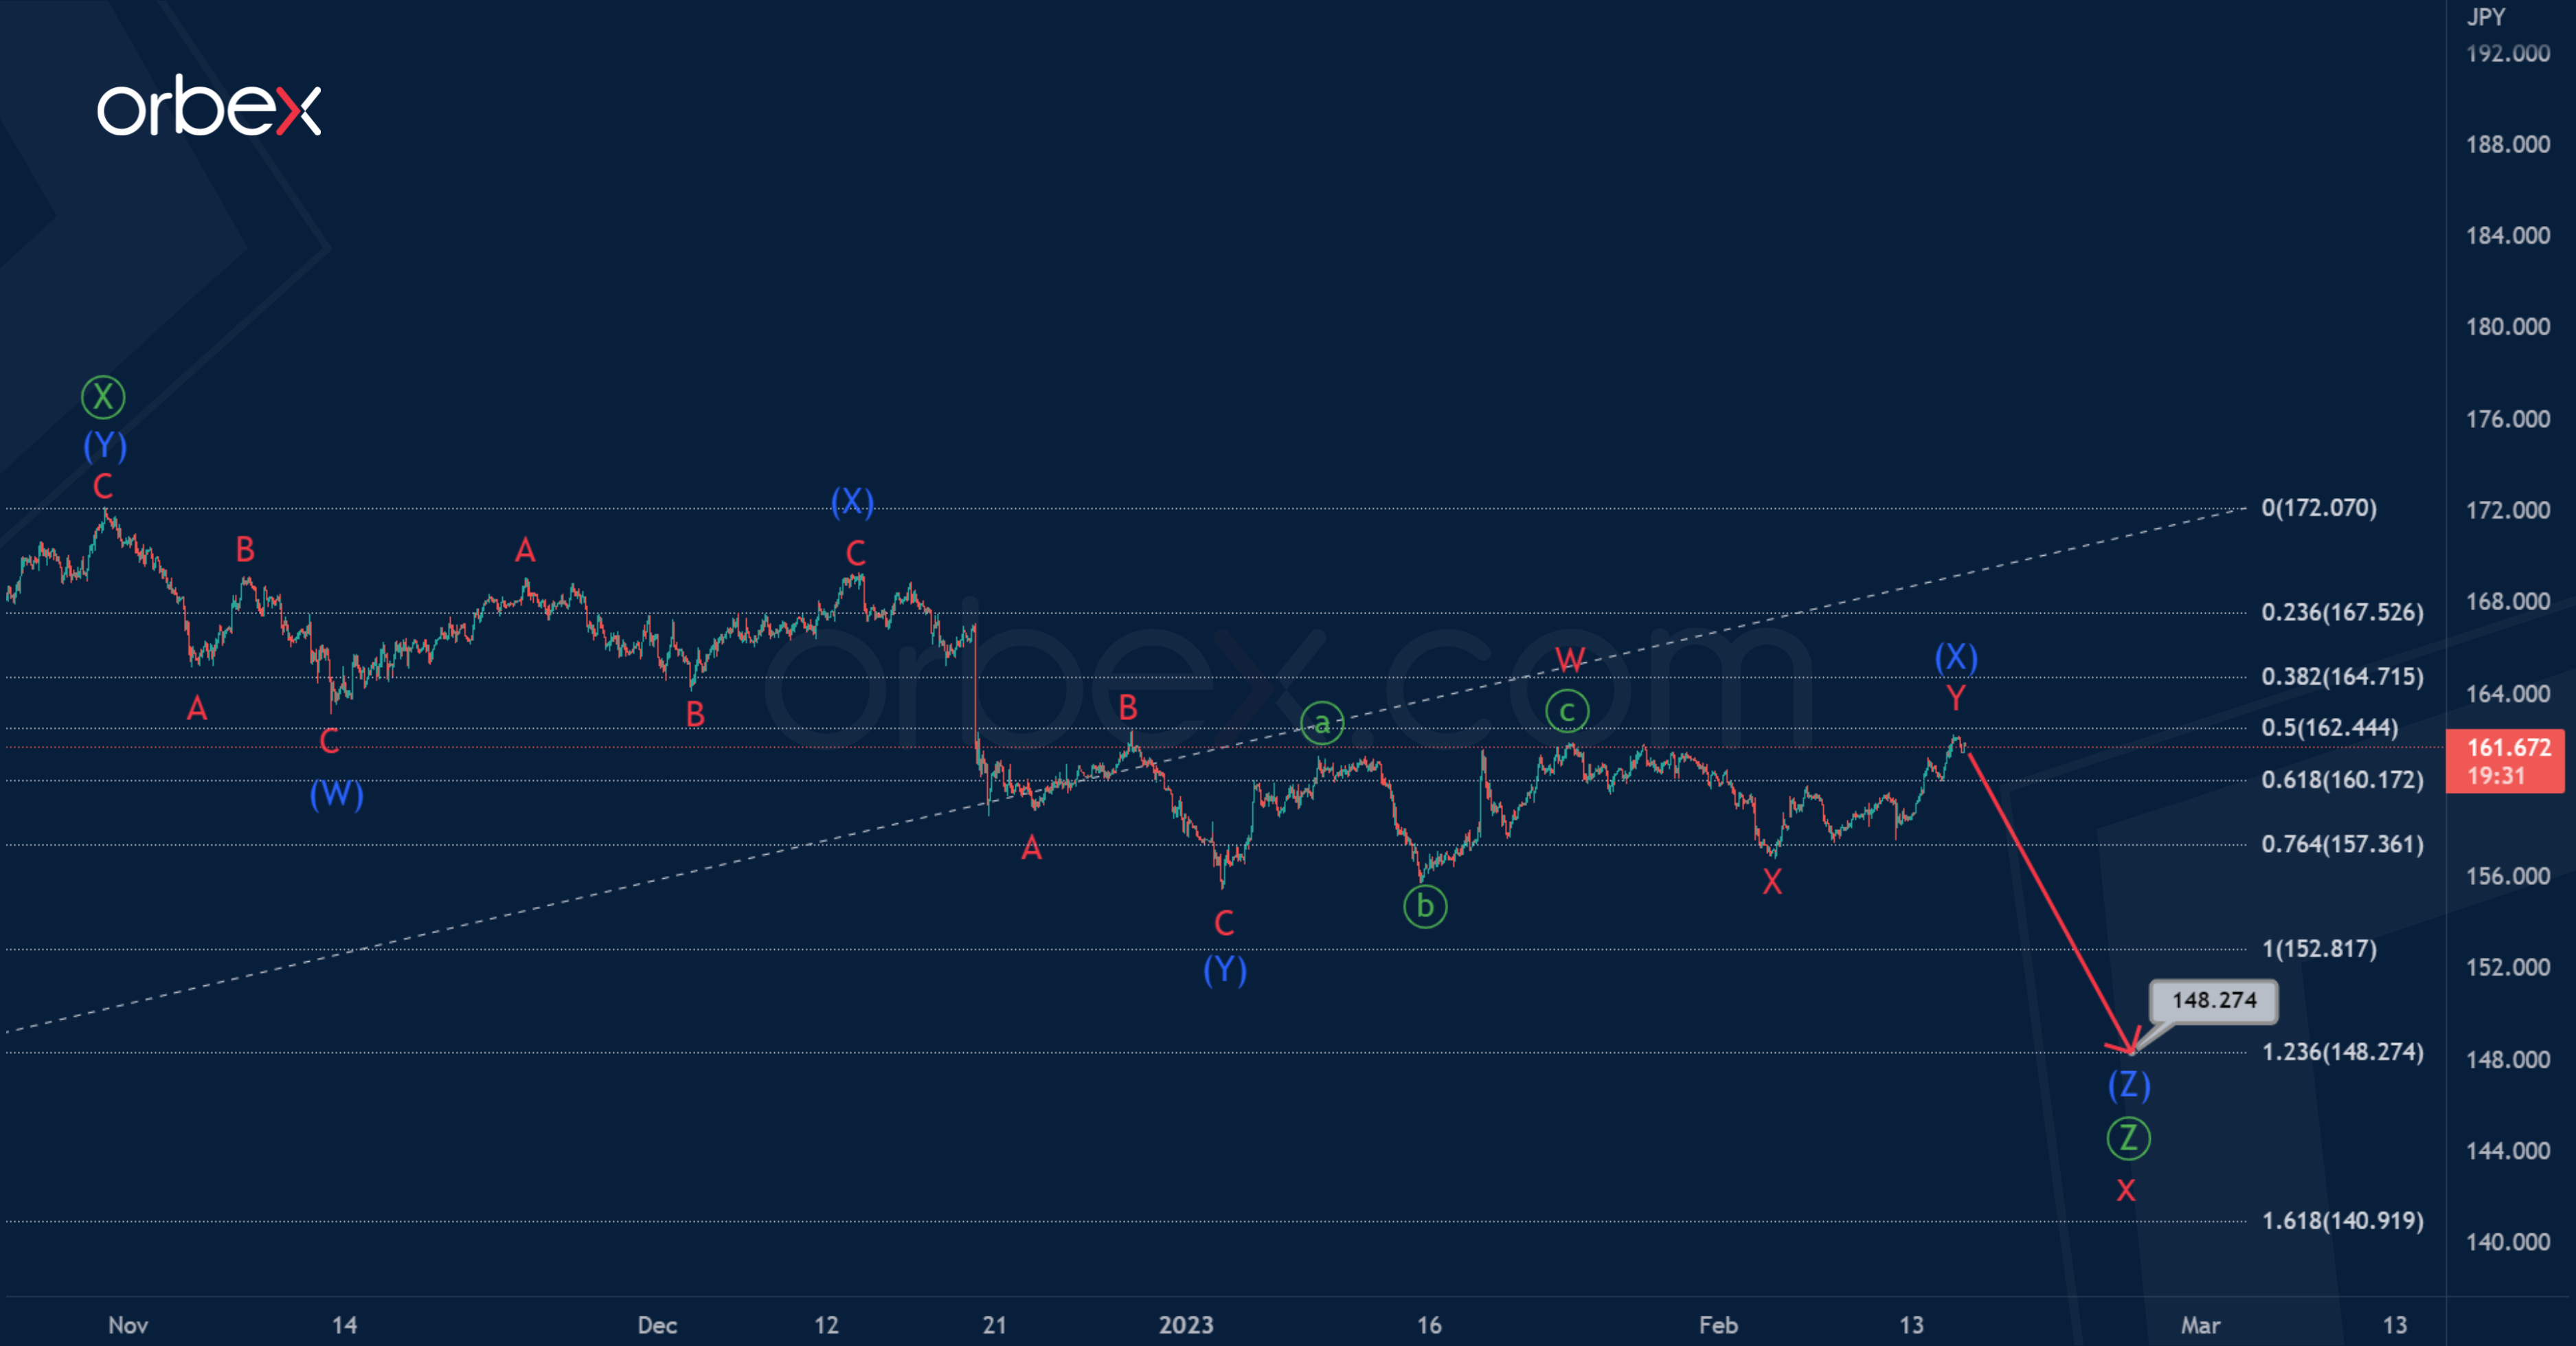
Let’s consider an alternative scenario, as seen above. According to this, a bearish intervening wave x is formed. It can end in the form of a triple zigzag, for the construction of which a final sub-wave Ⓩ is needed.
The current structure of the primary wave Ⓩ suggests an intermediate triple zigzag (W)-(X)-(Y)-(X)-(Z). The first four zigzag sub-waves have already been completed. In the near future, we expect a fall in the sub-wave (Z) to 148.27.
At the specified level, wave Ⓩ will be at 123.6% of actionary wave Ⓨ.
USD/JPY Pair Started a Fresh Increase from 128.20
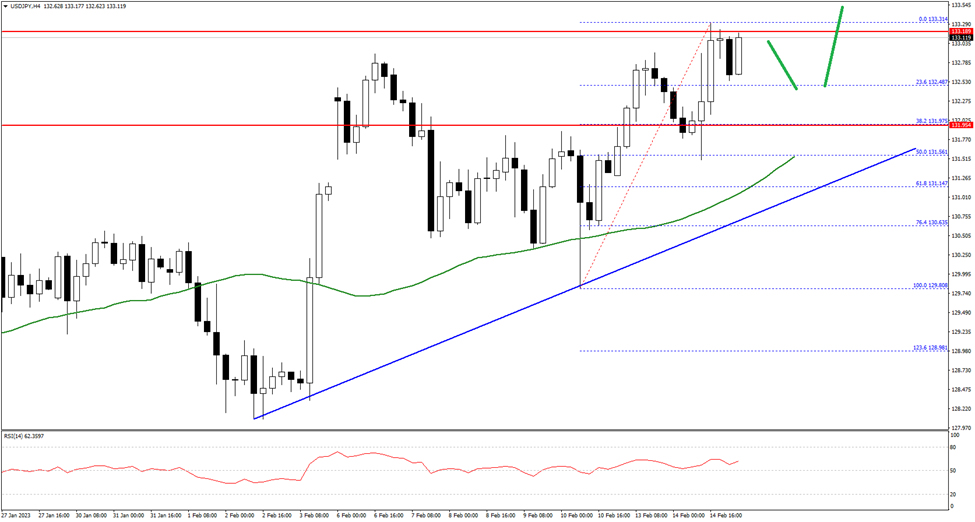
The US Dollar started a fresh increase from the 128.20 support zone against the Japanese Yen. The USD/JPY pair climbed above the 130.00 level to move into a positive zone.
There was a clear move above the 131.20 zone and the 50 hourly simple moving average. The pair is now consolidating above the 132.50 zone. An immediate resistance on the upside is near the 133.30 level.
The next major resistance is near 133.50 on FXOpen. A clear break above the 133.50 resistance could push the price towards 134.00. The next major resistance is near the 134.65 level, where the bears might emerge.
On the downside, an initial support is near the 132.50 zone. The next support sits near the 132.00 zone and a trend line on the hourly chart, below which there is a risk of more downsides towards the 131.20 level.
EURJPY Battles With Upper Boundary of Trading Range
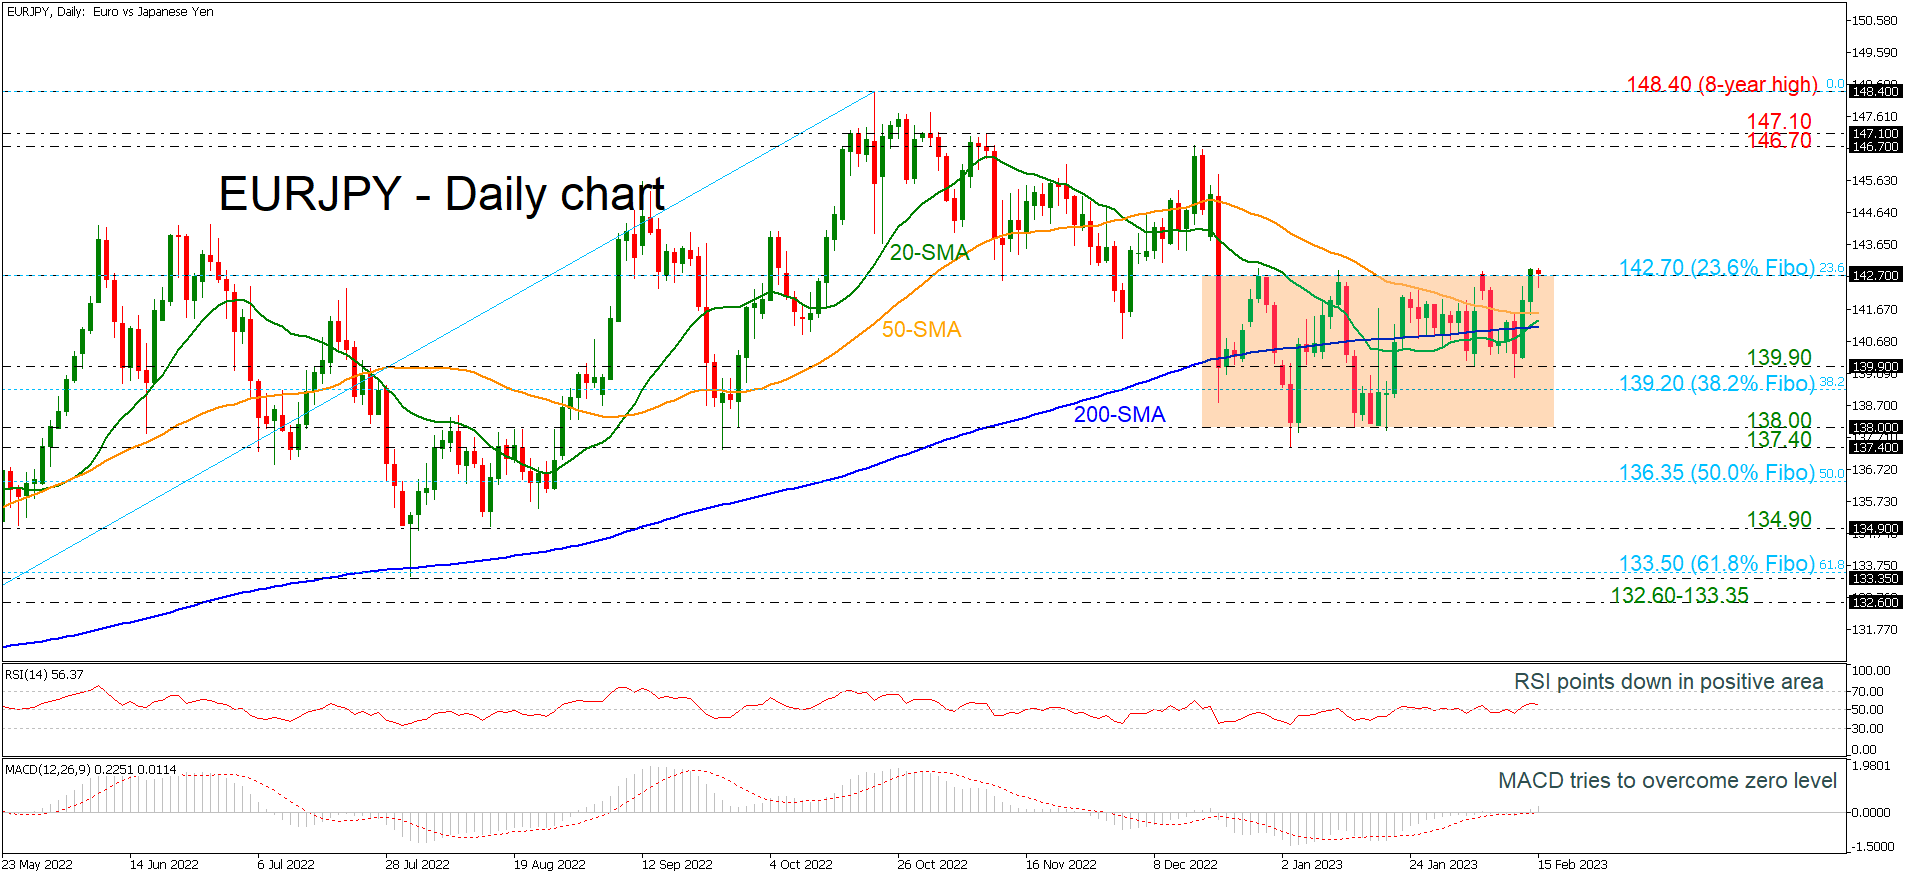
EURJPY is struggling to surpass the upper boundary of the trading range at 142.70, which is also the 23.6% Fibonacci retracement level of the upward wave from 124.40 to 148.40.
In trend indicators, the 20-day simple moving average (SMA) posted a bullish crossover within the 200-day SMA, mirroring the latest rebound off the 139.90 support level. The MACD is extending the positive move above its trigger and zero lines; however, the RSI is pointing down in the bullish territory.
Should the price close decisively above the roof of the channel, seen at 142.70, bulls could extend the upside move towards the 146.70-147.10 resistance area. Further advances could then target the barrier of the eight-year high of 148.40.
On the other hand, a decline could meet the 50-day SMA currently at 141.50 and the bullish crossover of the 20- and 200-day SMAs at 141.10. Slightly lower, the price could retest the middle line of the range approximately at 139.90 before the test of the 38.2% Fibonacci at 139.20. Even lower, the 138.00 psychological mark is a crucial level for a rebound but any moves below it could switch the outlook to negative hitting 137.40 and the 50.0% Fibonacci at 136.35.
All in all, EURJPY shows some signs of bullish movements in the short-term, but it needs to overcome successfully the 23.6% Fibonacci at 142.70.
FTSE 100 Consolidates Gains
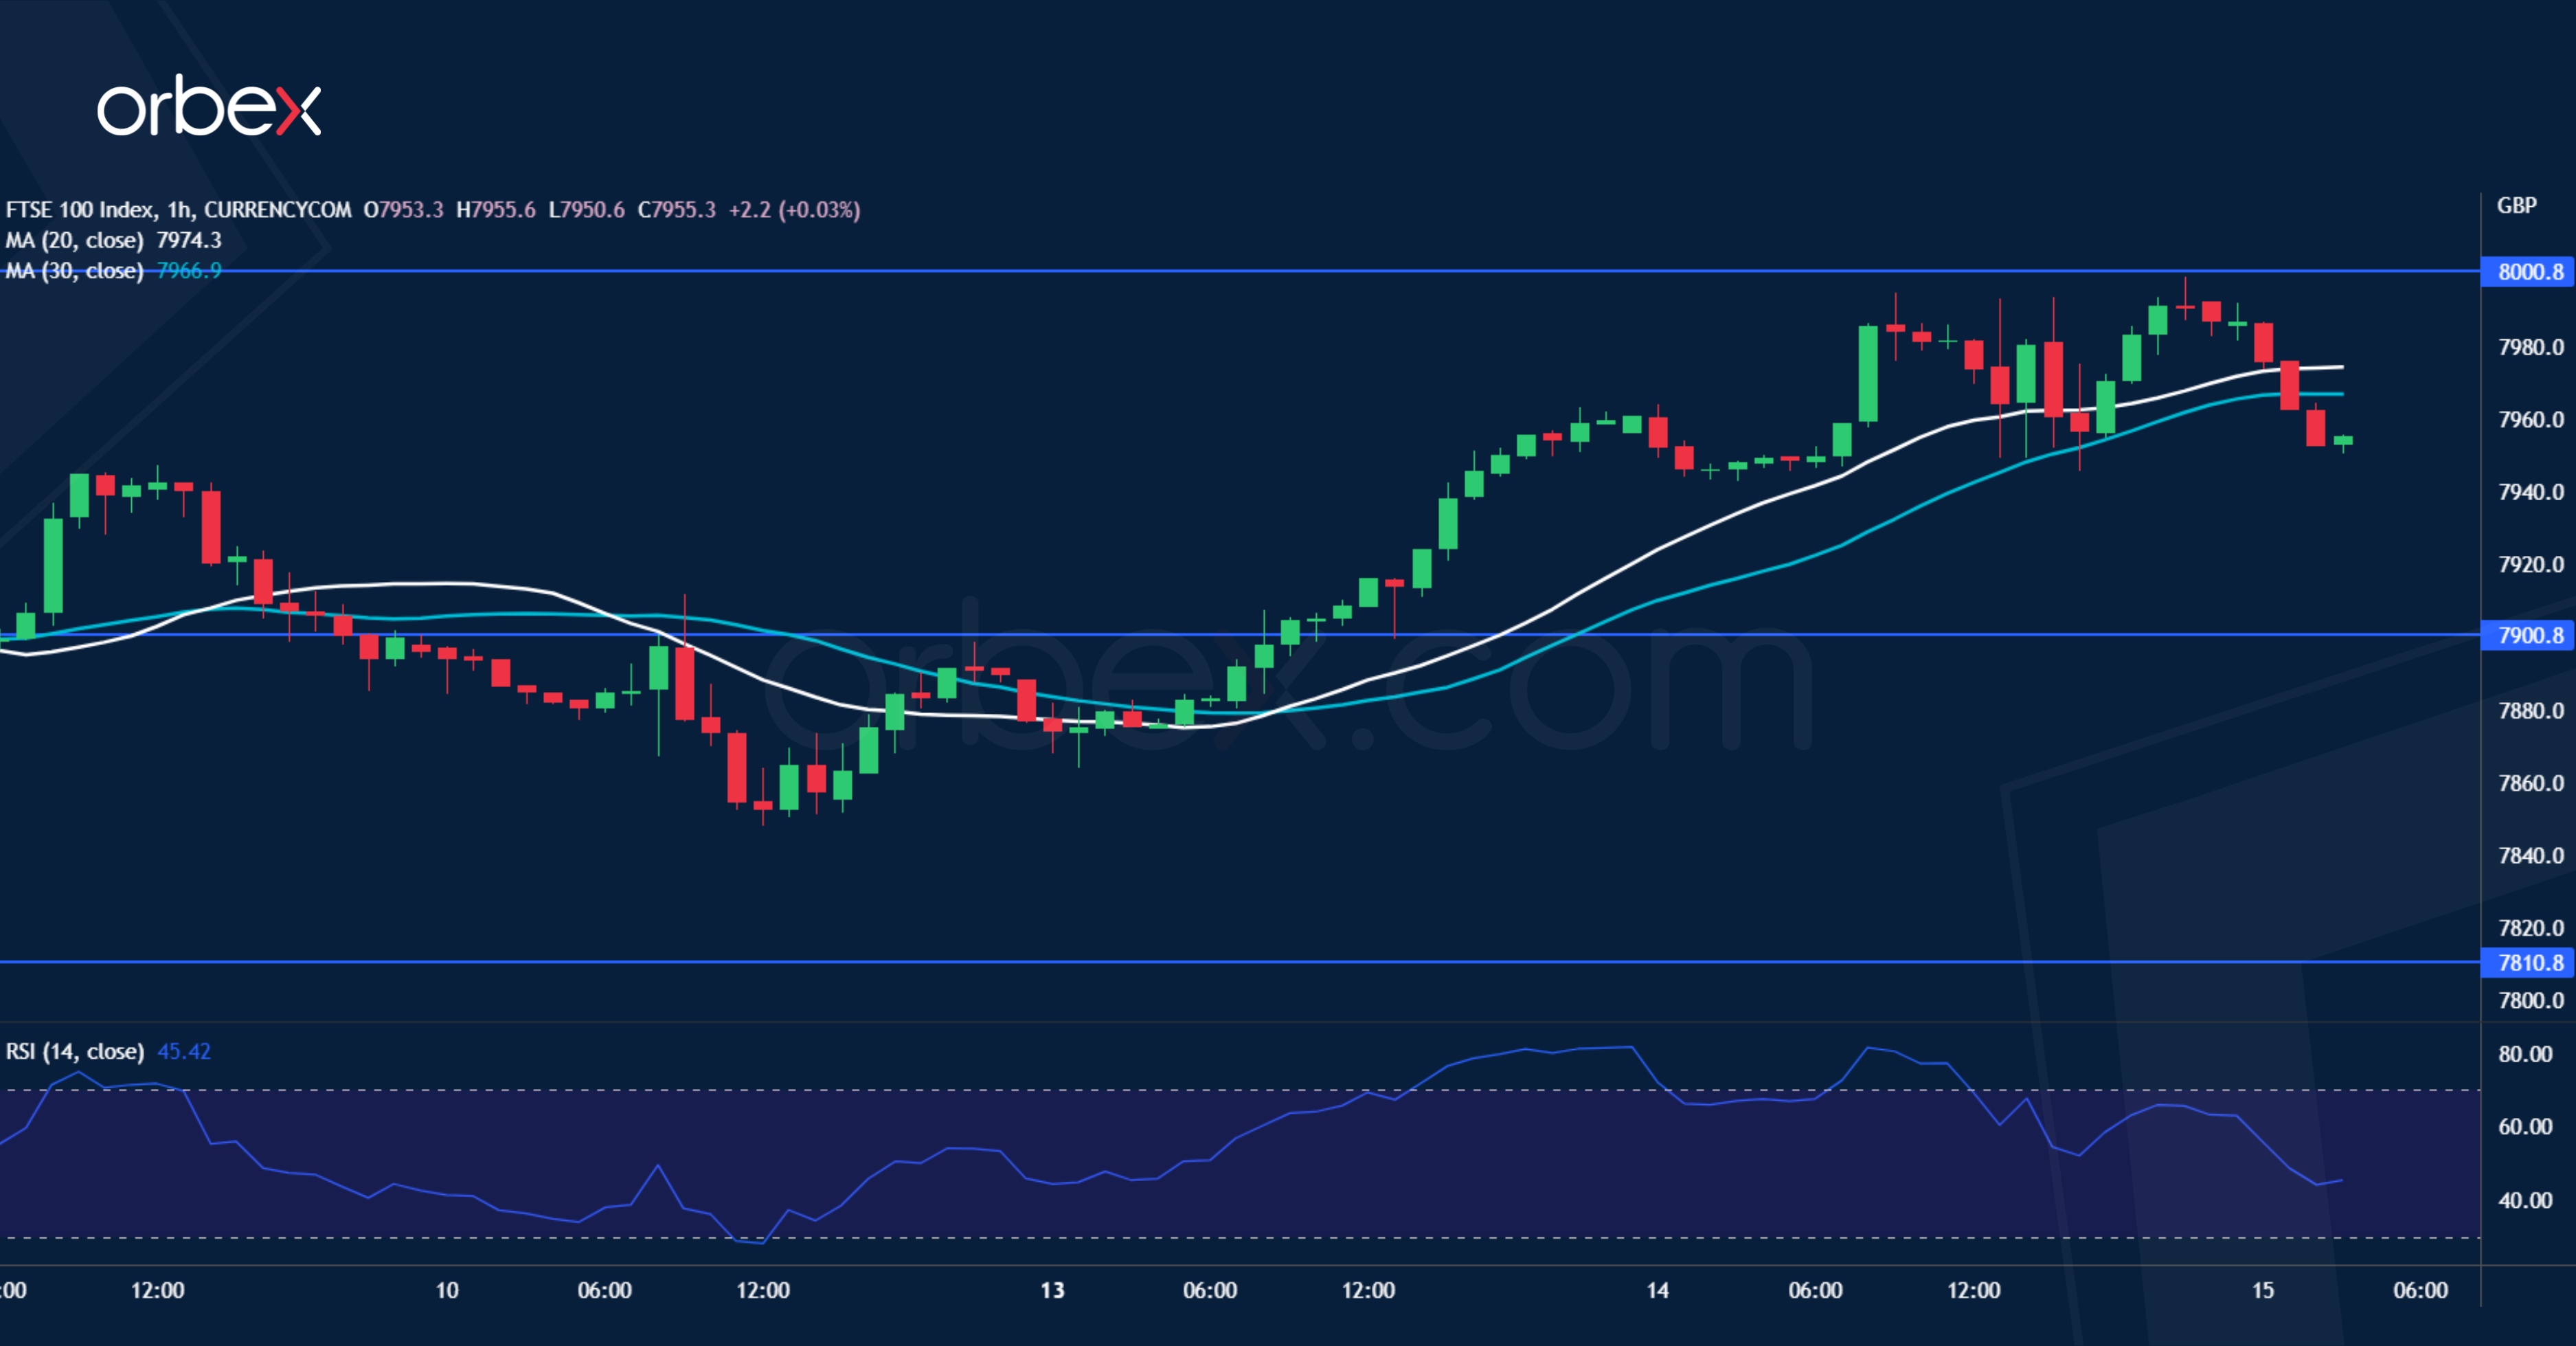
Equities tread water as stubborn inflation tempers the hope that the Fed could pause rate hikes. Still, the FTSE 100 remains on an upward trajectory after bouncing off the 20-day SMA on the daily chart. This is a strong sign that the uptrend has resumed in the medium-term. But the short-term price action could struggle with the hourly RSI showing signs of overextension as the index reaches the round number 8000. A pullback would allow the bulls to catch their breath and 7900 will be the first level to be tested.
XAU/USD Continues Lower
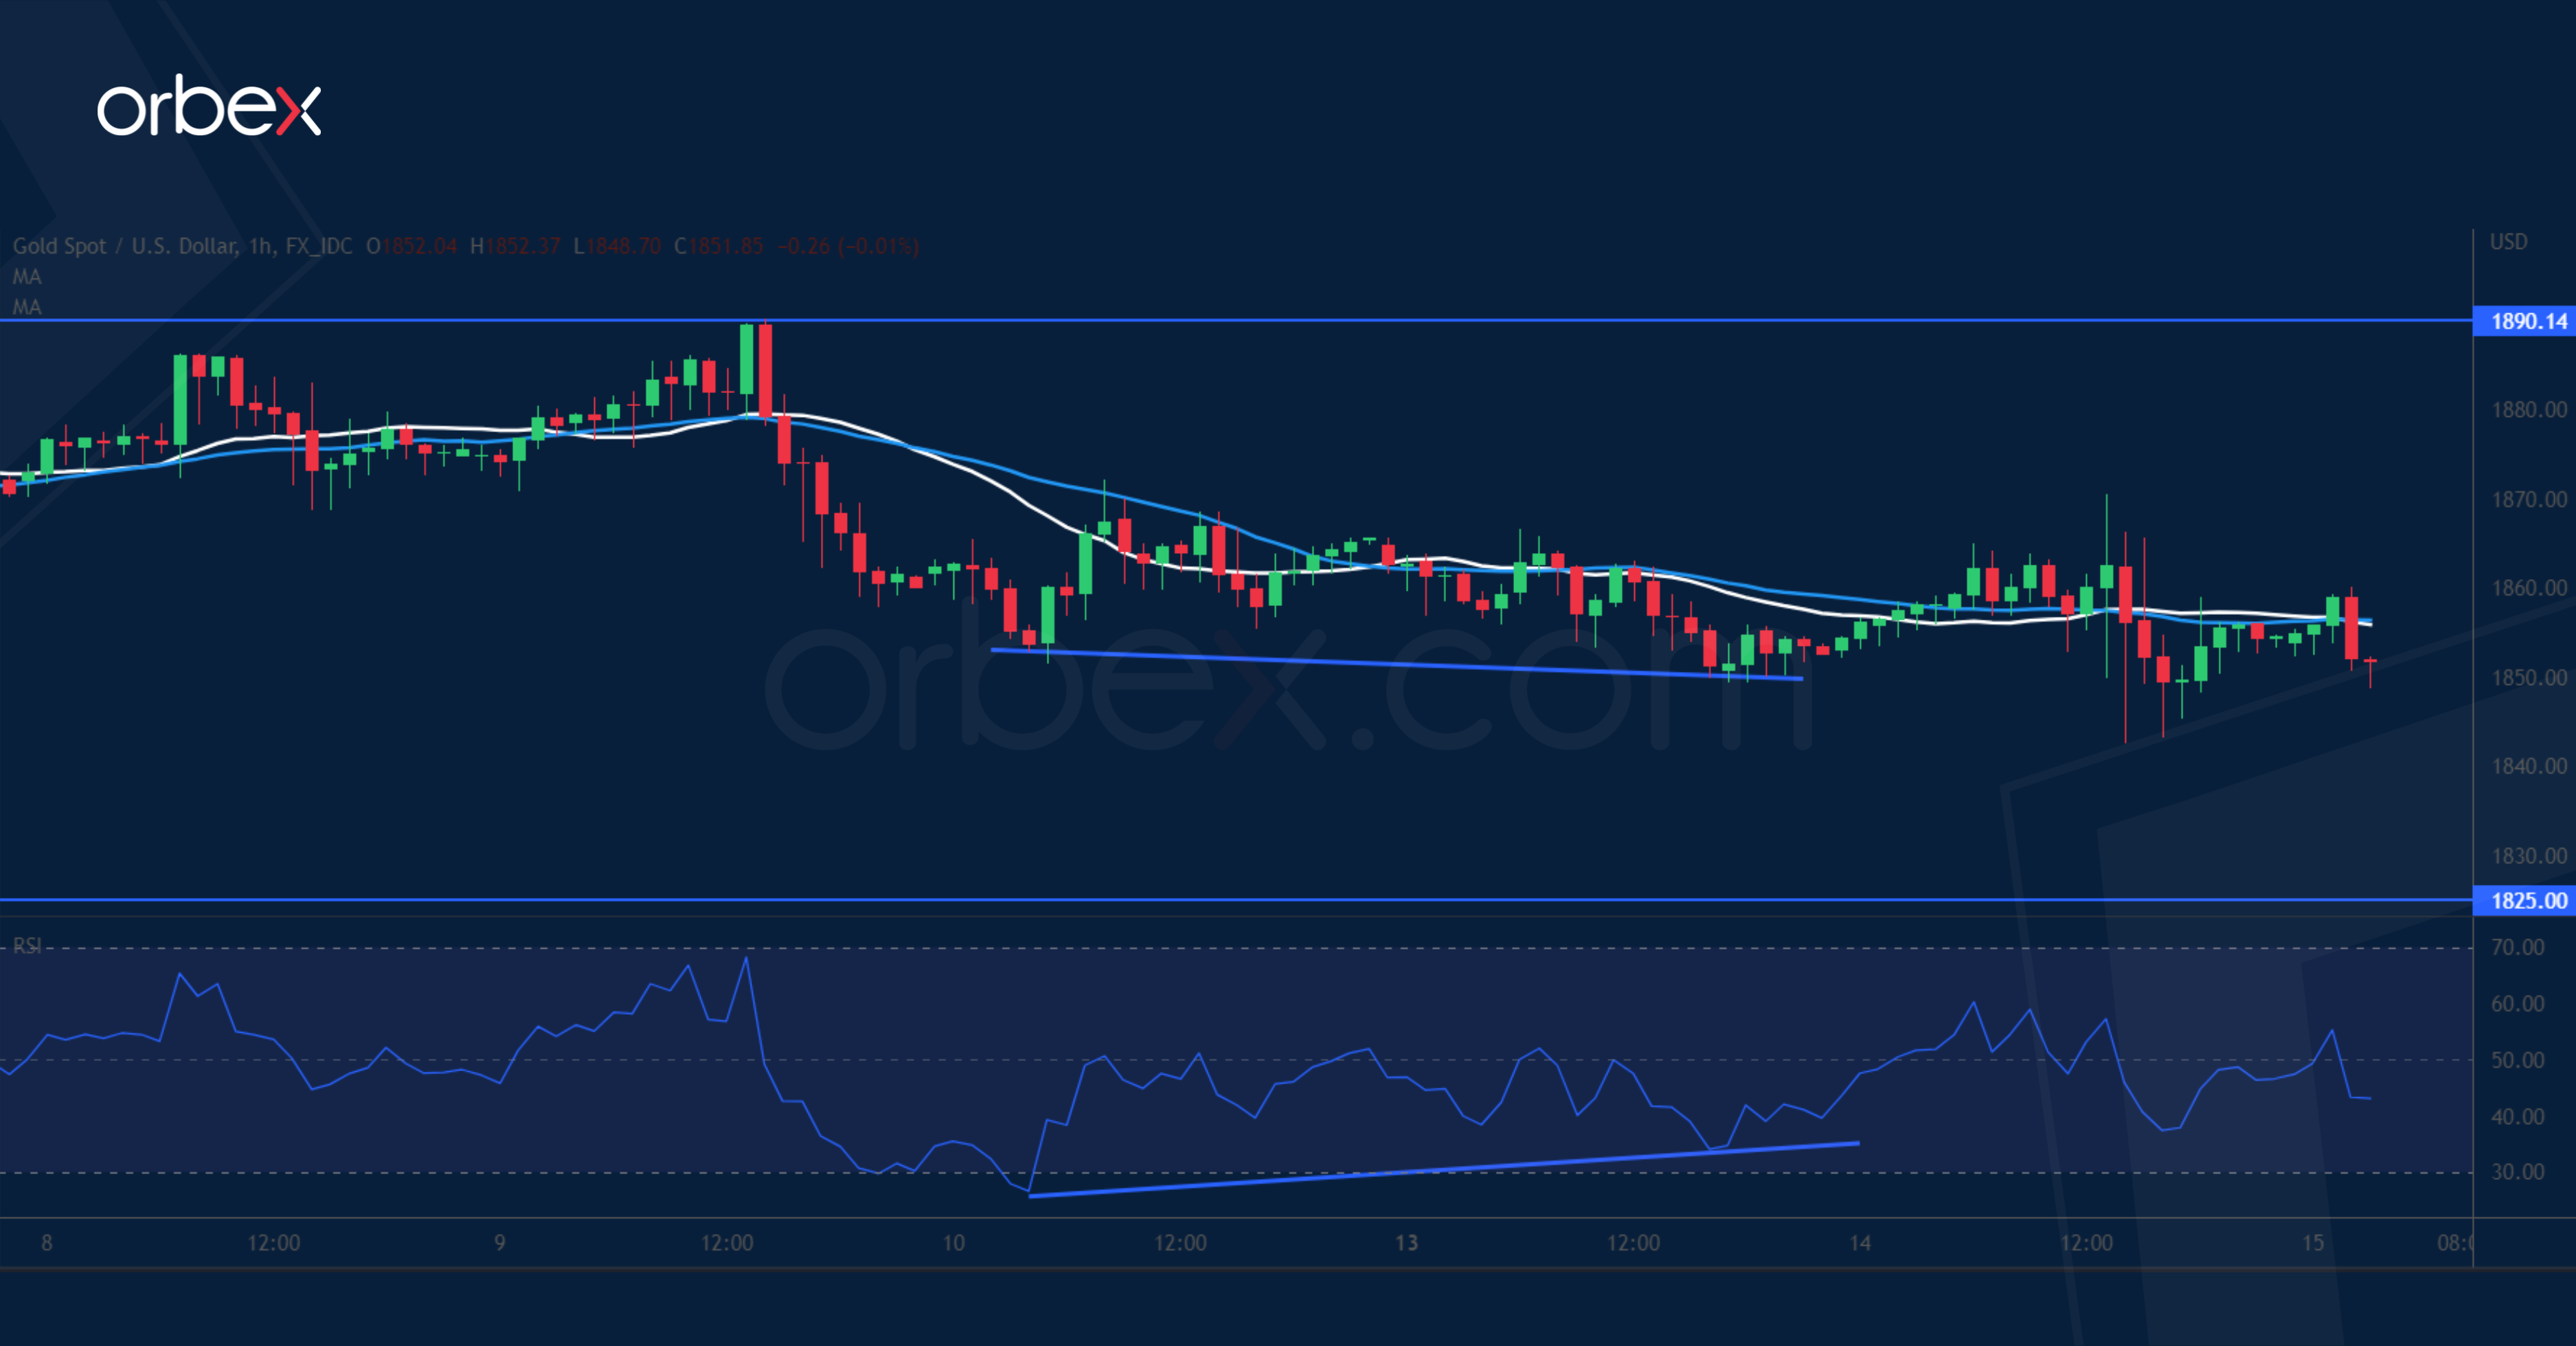
Gold inched lower as US Treasury yields rose amid expectations of tighter monetary policy by the Fed. The metal has been struggling to find a floor after its price made a U-turn from its 9-month high at 1960. 1850 from a previous bullish breakout at the start of the year has failed to stop the bleeding. A bullish RSI divergence shows a slowdown in the downward momentum but there is no confirmation yet of a turnaround, which would be a rise above 1890. In the meantime, 1825 is likely to be the next stop.
EUR/USD Struggles to Bounce Back
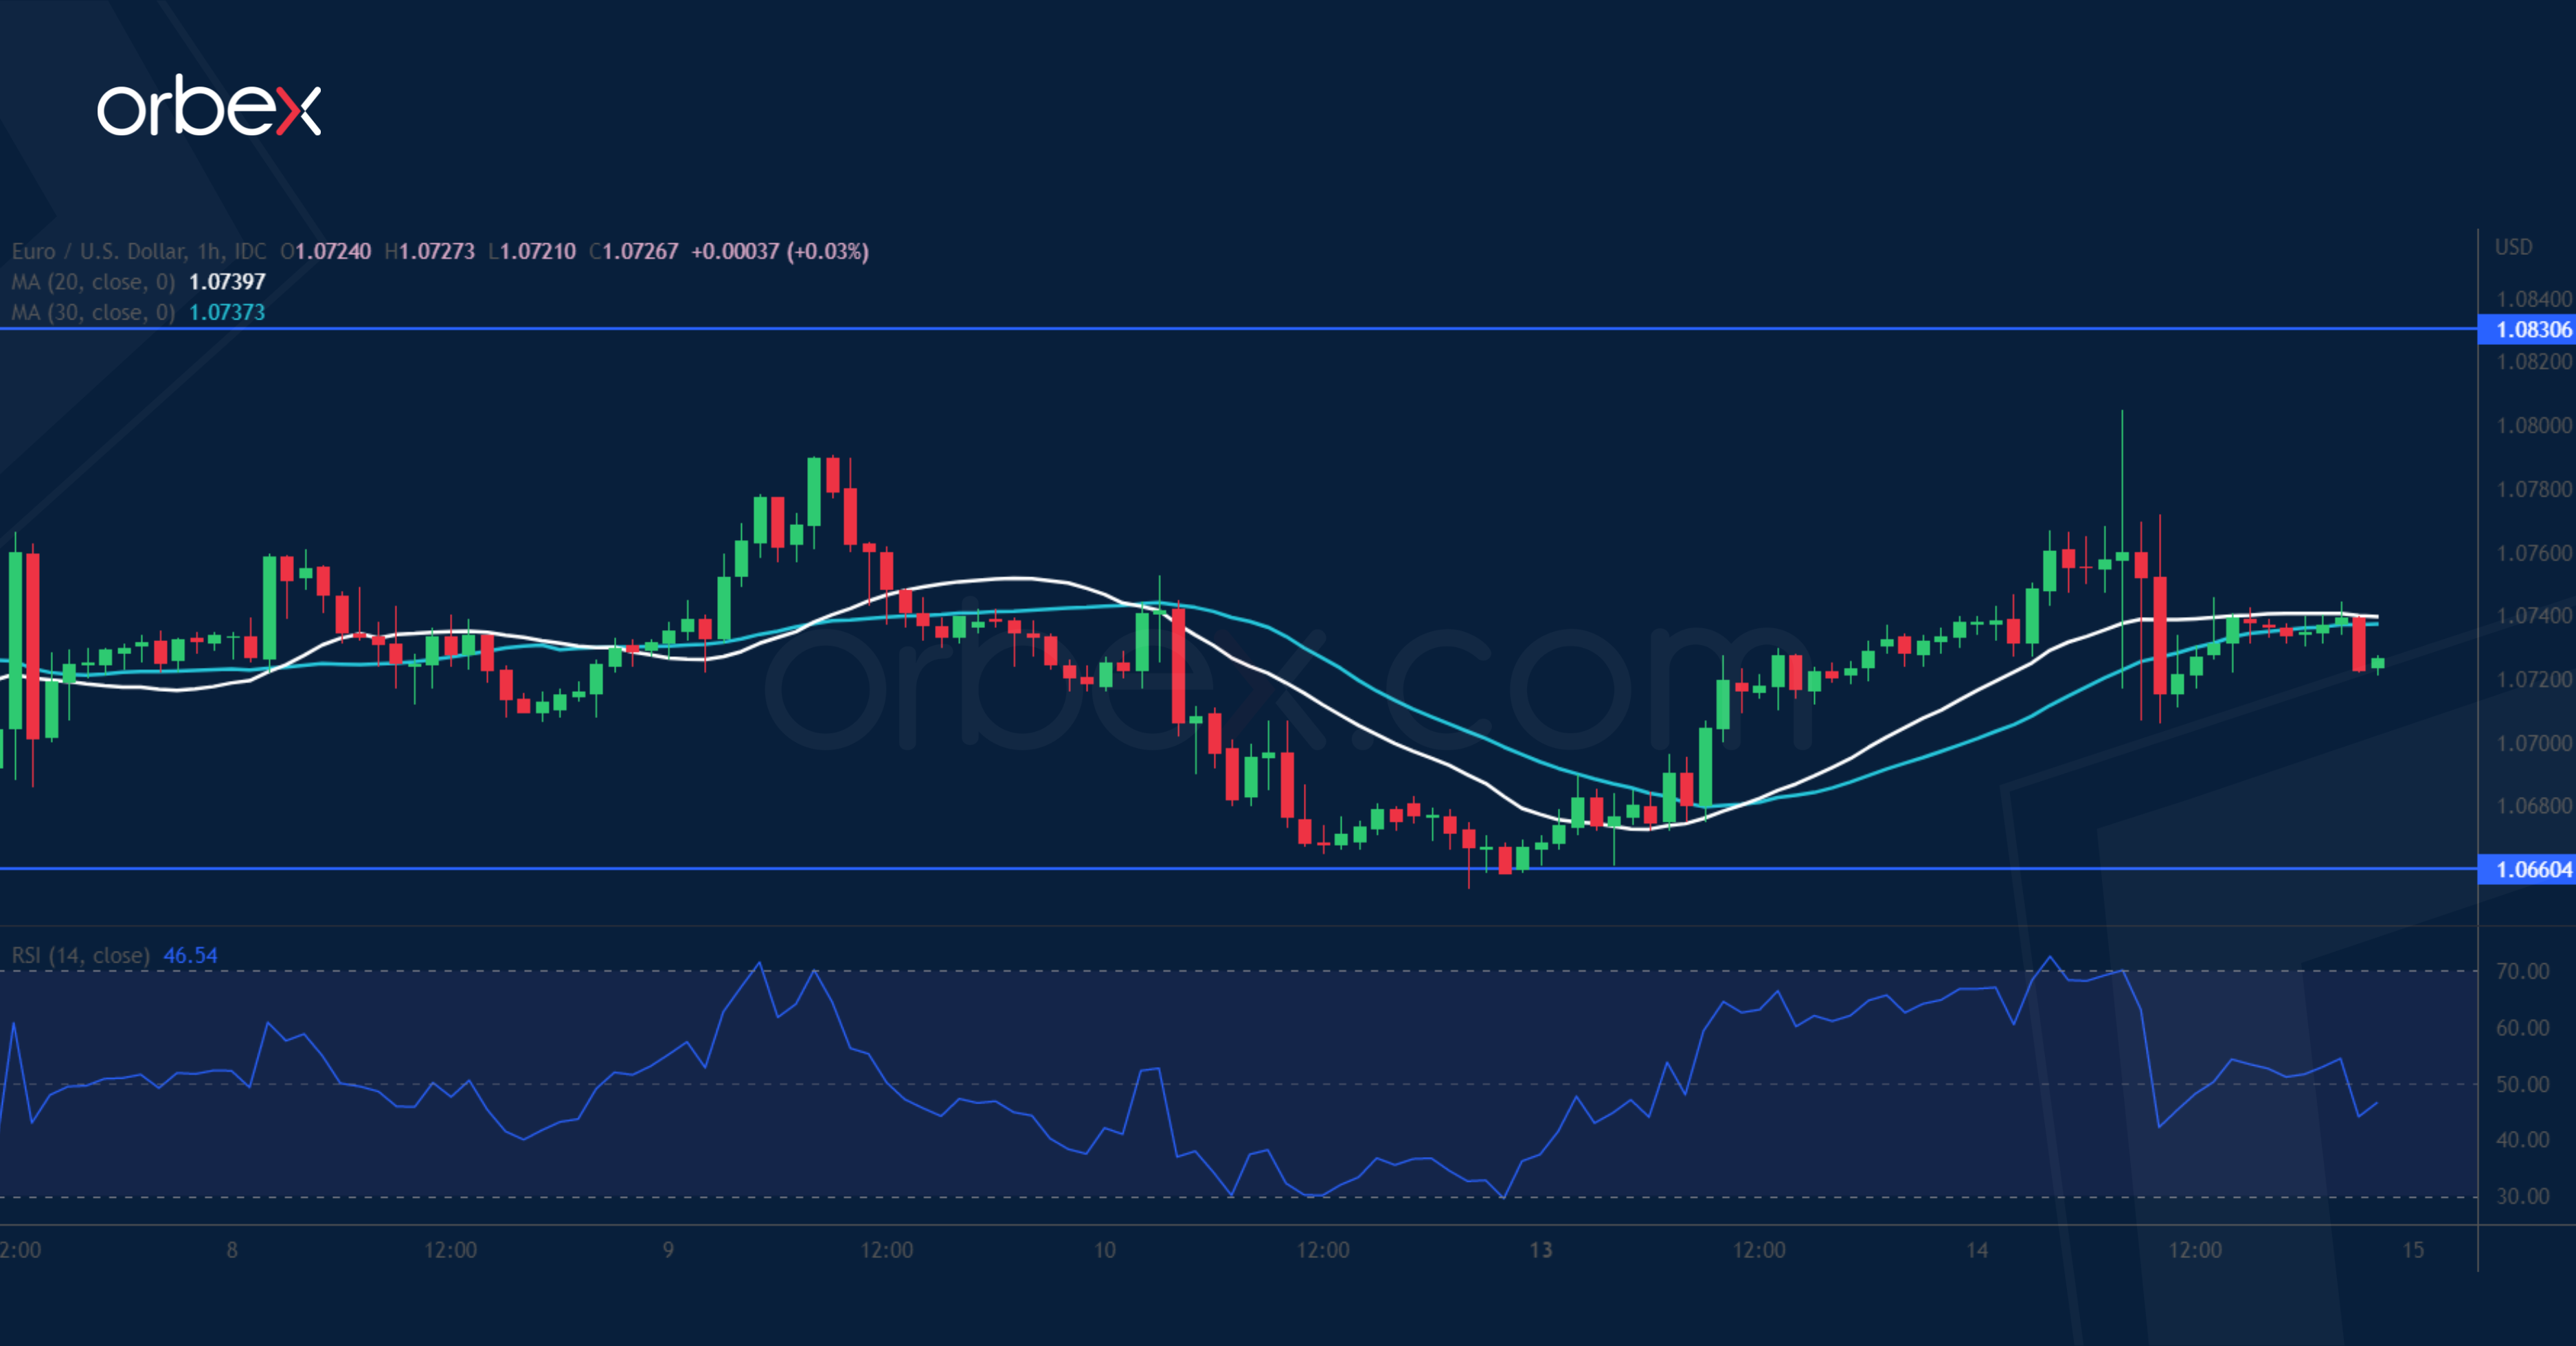
The US dollar jumped after January’s inflation did not slow down as fast as expected. The pair came to rest at the start of the breakout rally in early January (1.0660). The top of a previously faded rebound (1.0790) showed a spike with an upper shadow indicating rejection of the upside. The former demand zone around 1.0830 is the hurdle ahead and only a close above 1.0940 would reignite hopes of a bullish continuation. Otherwise, a drop below 1.0660 would bring back the selling pressure and drive the euro towards 1.0500.
A Small Setback
Equity markets are poised to open a little softer on Wednesday following similar moves in Asia overnight as investors weigh up the latest setback in US data.
The inflation report really needed to over-deliver after the red-hot labour market figures earlier in the month and it simply didn't do it. The trend remains positive but it may be stalling and that won't give the Fed any encouragement to stop raising interest rates.
The next 25 basis point hike was never really in doubt anyway but now markets are factoring in much more, including another in May and a good chance of one more in June. What's more, those rate cuts that were priced in for the end of the year only a couple of weeks ago are no more. Markets are pricing in the possibility of one but the anticipated year-end rate is now significantly higher, as is the terminal rate.
A long way to go
UK inflation may still be far too high but the January CPI report has offered some cause for optimism, slipping faster than expected on both a headline and core basis. The headline number remains above 10% so there's still a very long way to go but favourable base effects and lower energy prices should go a long way in driving this much lower over the course of the year. The BoE may be particularly encouraged by the core decline as this is where we're likely to see stubborness but we must remember that this is just one release and there will likely be many setbacks over the course of the year.
Large inventory build weighs
Oil prices are a little lower again today but remain broadly within the same range they've traded in over the last couple of months. China has been a very bullish development for crude oil but the global economy as a whole is much more uncertain. In addition, the US decision to release oil from the SPR has come as a surprise given previous commitments to refill the reserve.
What's more, a shockingly large inventory build reported by API on Tuesday is contributing to the decline ahead of today's widely followed EIA report. If that's backed up later today, we could continue to see oil drift away from its range highs.
Gold correction continues
The corrective move in gold is continuing today after the yellow metal did not get the lift from the US inflation report that some were hoping for. It's now broken back below $1,850 and could continue lower from here, with the next support potentially coming around $1,820-$1,830, although a bigger test may come around $1,780-$1,800.
Ultimately the recent data has not been particularly favourable and that's been evident in the shift in interest rate expectations this year. A higher terminal rate and potentially no rate cuts this year is not a good near-term development for the yellow metal.
Correction run its course?
Bitcoin enjoyed a decent rebound on Tuesday despite broader market sentiment being more challenging on the back of the US inflation report. We continue to see resilience in cryptos which is very encouraging despite regulatory headlines not being particularly good. Of course, it's now retraced back to a level that was a notable area of support in late January and early February before it corrected and we'll soon see whether that's become a bearish resistance zone or the corrective move has run its course.
GBP/JPY Daily Outlook
Daily Pivots: (S1) 160.72; (P) 161.45; (R1) 162.78; More...
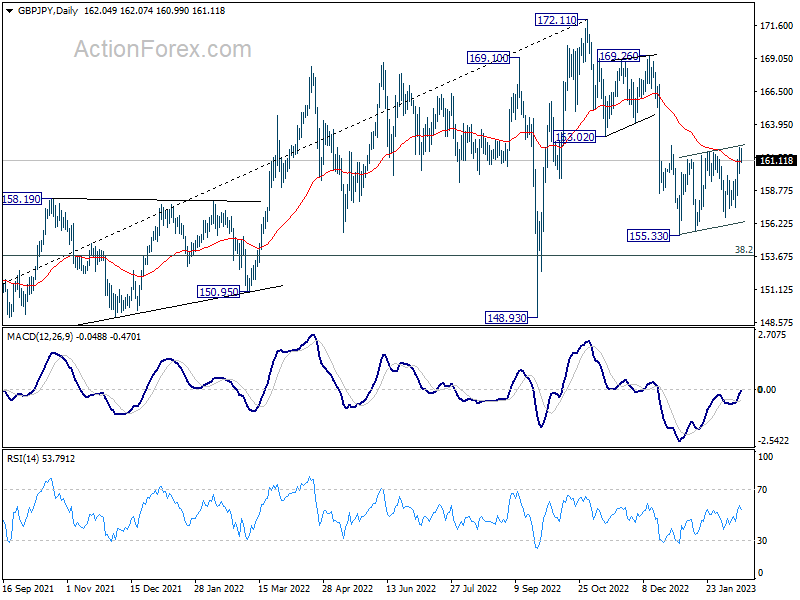
Immediate focus is now on 161.80 resistance. Decisive break there, and sustained trading above 55 day EMA (now at 160.99) will argue that whole decline from 172.11 has completed. Bias will be back on the upside for 169.26/172.11 resistance zone. On the downside, break of 155.33 low will resume the fall from 172.11 to 153.70 fibonacci level next.
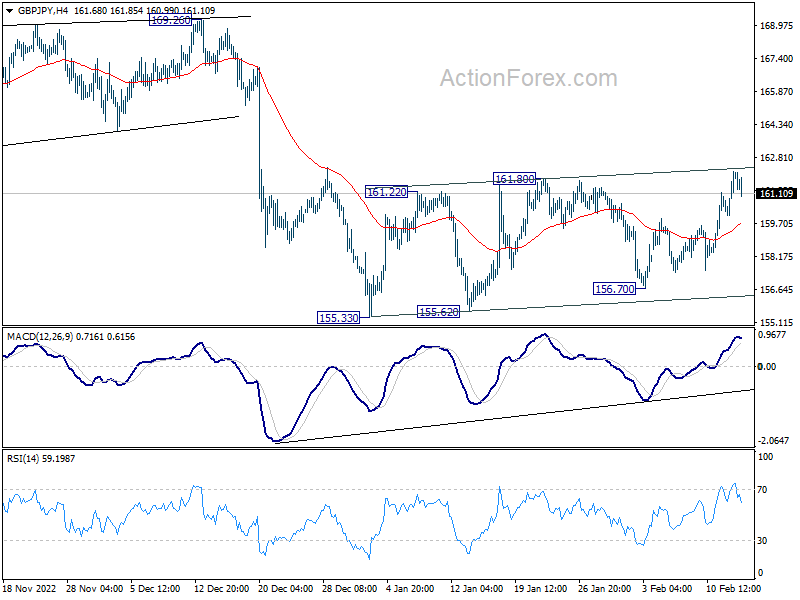
In the bigger picture, as long as 163.02 support turned resistance holds, decline from 172.11 medium term top is expected to continue to 38.2% retracement of 123.94 to 172.11 at 153.70. Sustained break there will raise the change of trend reversal and target 61.8% retracement at 142.34. Nevertheless, break of 163.02 support turned resistance will argue that the decline has completed, and retain medium term bullishness.
EUR/JPY Daily Outlook
Daily Pivots: (S1) 141.96; (P) 142.45; (R1) 143.39; More....
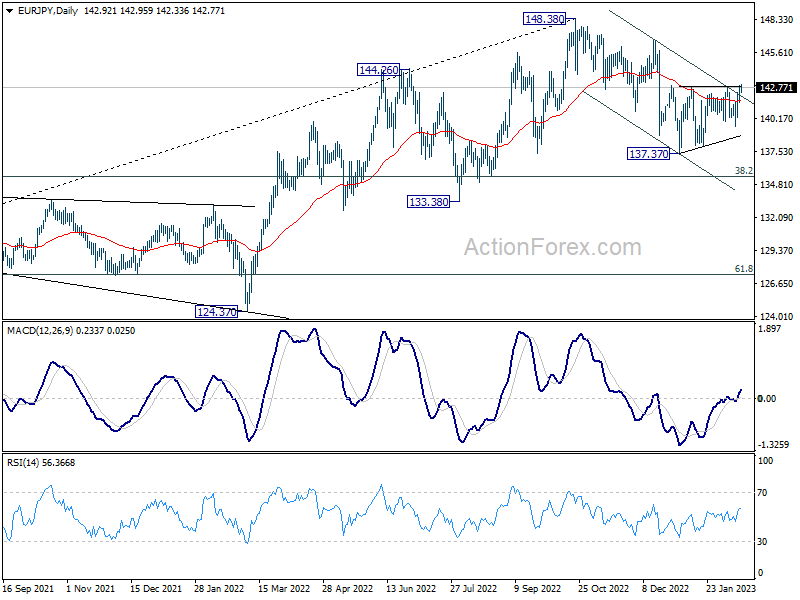
Immediate focus is now on 142.79 resistance in EUR/JPY. Firm break there will argue that the correction from 148.38 has completed at 137.37 already. Further rise would be seen to 146.71 resistance next. On the downside, break of 139.54 will resume the whole fall from 148.38 through 137.37, to 135.40 fibonacci level.
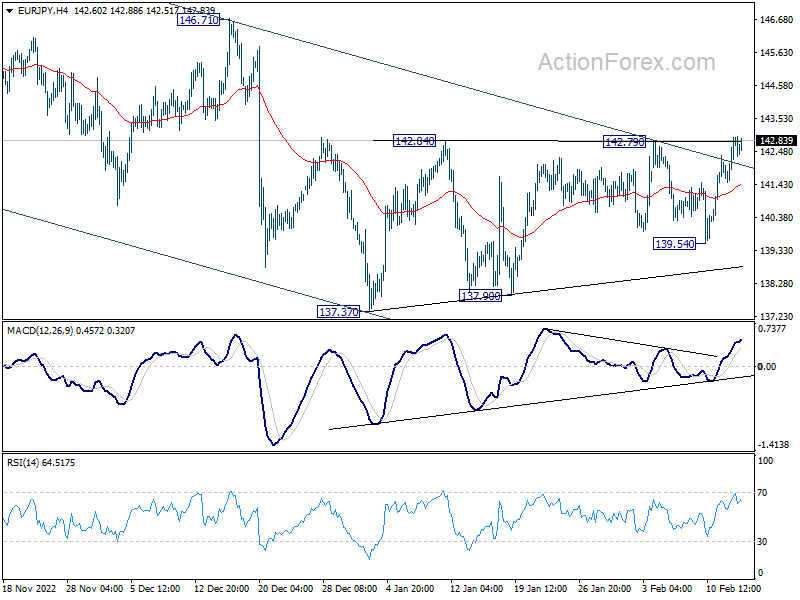
In the bigger picture, as long as 55 week EMA (now at 138.87) holds, larger up trend from 114.42 (2020 low) is still in progress for 149.76 long term resistance. However, firm break of 55 week EMA will bring deeper fall to 38.2% retracement of 114.42 to 148.38 at 135.40. Sustained break there will raise the chance of trend reversal, and target 61.8% retracement at 127.39.
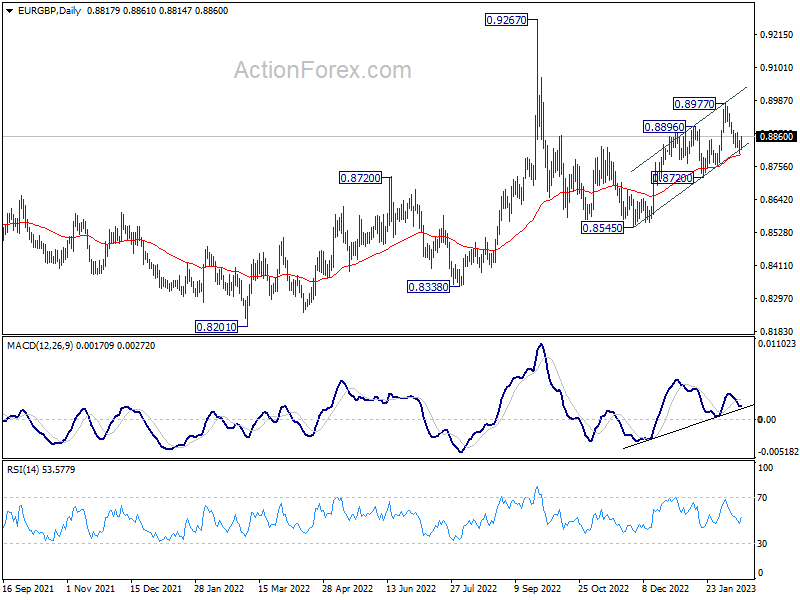
EUR/GBP Daily Outlook
Daily Pivots: (S1) 0.8798; (P) 0.8823; (R1) 0.8843; More...
Intraday bias in EUR/GBP stays neutral first. Break of 0.8873 minor resistance will indicate that pull back from 0.8977 has completed. Bias will be back on the upside for retesting 0.8977 first. Below 0.8802 will bring deeper fall. But overall outlook will stay bullish as long as 0.8720 support holds.
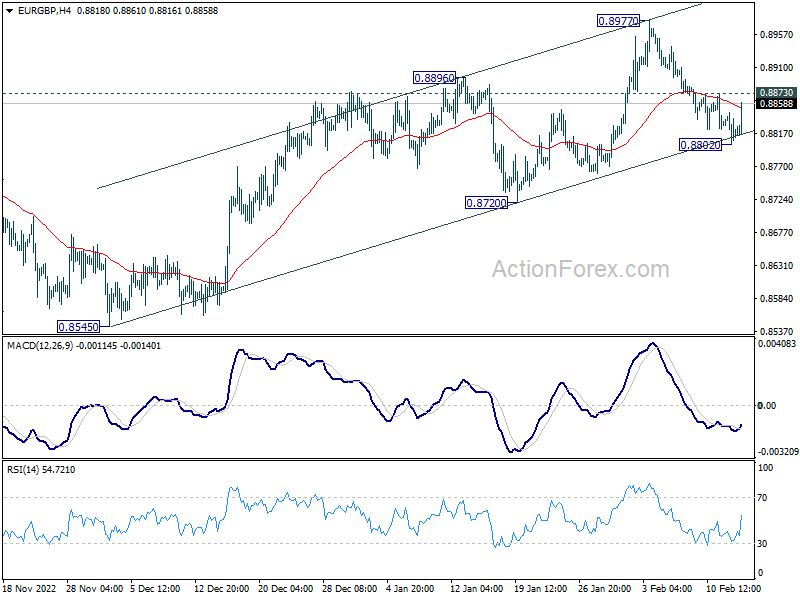
In the bigger picture, the notable support from 55 day EMA (now at 0.8780) retains near term bullishness. Break of 0.8896 should target 0.9267 (2022 high) and possibly above, to resume whole up trend from 0.8201 (2022 low). However, break of 0.8270 support and sustained trading below 55 day EMA will set the stage for 0.8545 and below.