Sample Category Title
Gold Price Faces Key Challenges, US CPI Declined To 6.4%
Key Highlights
- Gold price struggled to clear the $1,865 resistance zone.
- A key bearish trend line is forming with resistance near $1,862 on the 4-hours chart.
- EUR/USD and GBP/USD spiked lower after the US CPI release before recovering.
- The US Consumer Price Index increased 6.4% in Jan 2023 (YoY), down from 6.5%.
Gold Price Technical Analysis
Gold price struggled to start a recovery wave above $1,870 against the US Dollar. The price made a couple of attempts, but the bulls failed to clear $1,865 and $1,870.
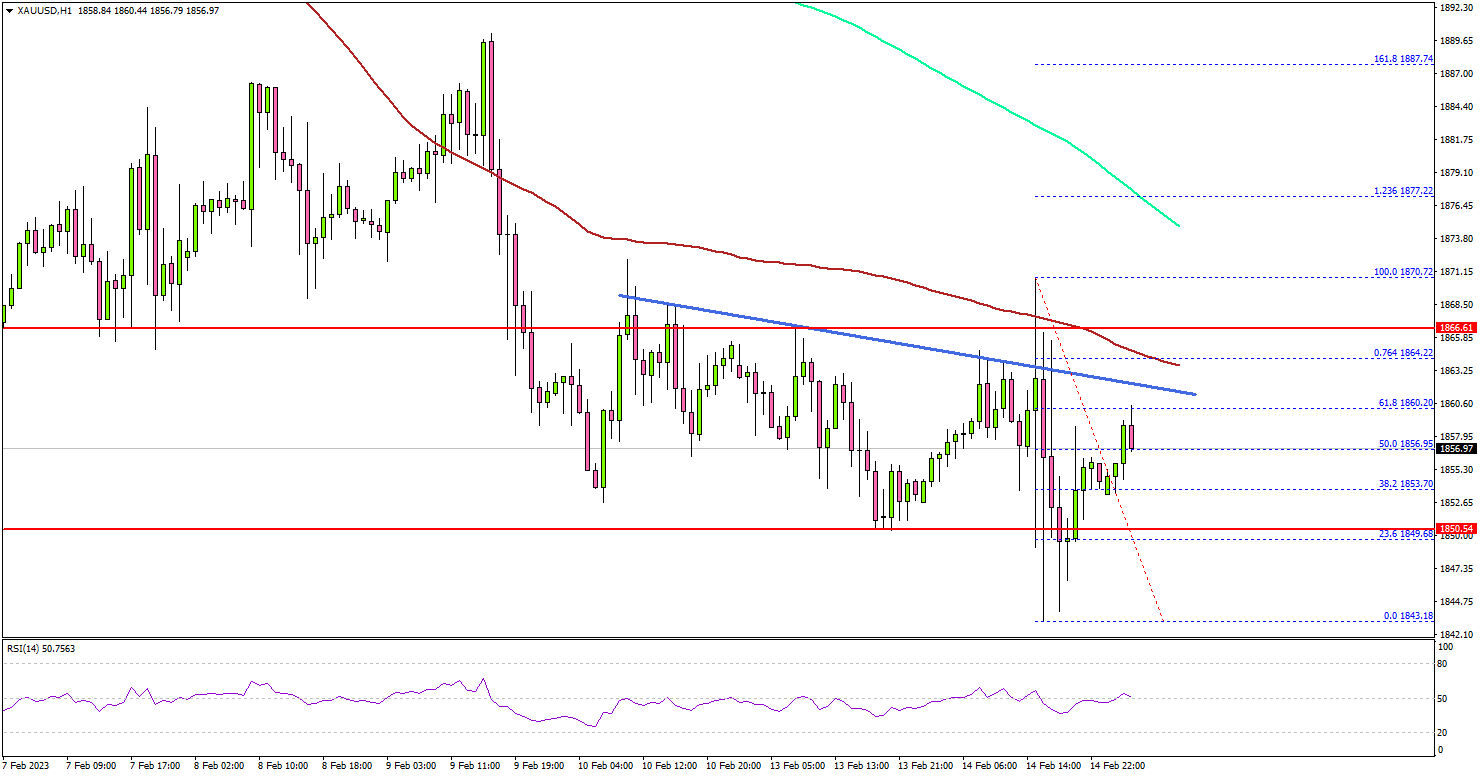
The 4-hours chart of XAU/USD indicates that the price declined sharply after the US CPI data was released. The US Bureau of Labor Statistics stated the US CPI declined to 6.4% on a yearly basis in January from 6.5% in December.
There was a strong decline below the $1,865 and $1,860 support levels. The price even spiked below the $1,850 level. However, the bulls were active near the $1,842 zone.
The price recovered and climbed above the $1,850 level. It is still facing a strong resistance near $1,865. There is also a key bearish trend line forming with resistance near $1,862 on the same chart.
The main resistance is near the $1,870 zone and the 100 simple moving average (red, 4-hours), above which the price might rise towards the 200 simple moving average (green, 4-hours).
On the downside, an initial support is near the $1,850 level. The next major support is near the $1,842 level, below which gold price might struggle to stay above the $1,835 zone. In the stated case, gold price could slide towards the $1,820 support.
Looking at EUR/USD, the pair also spiked lower below the 1.0750 level before recovering higher. It is still facing hurdles near 1.0800.
Economic Releases to Watch Today
- UK Consumer Price Index for Jan 2023 (YoY) – Forecast 10.3%, versus +10.5% previous.
- UK Core Consumer Price Index for Jan 2023 (YoY) – Forecast +6.2%, versus +6.3% previous.
- US Retail Sales for Jan 2023 (MoM) – Forecast -0.2%, versus +0.6% previous.
Fed Logan: We shouldn’t lock in on a peak interest rate or a precise path of rates
Dallas Fed President Lorie Logan said, "we must remain prepared to continue rate increases for a longer period than previously anticipated, if such a path is necessary to respond to changes in the economic outlook or to offset any undesired easing in conditions."
"And even after we have enough evidence that we don't need to raise rates at some future meeting, we'll need to remain flexible and tighten further if changes in the economic outlook or financial conditions call for it," she added.
"The most important risk I see is that if we tighten too little, the economy will remain overheated and we will fail to keep inflation in check," Logan said. "That could trigger a self-fulfilling spiral of unanchored inflation expectations that would be very costly to stop."
"My own view is that, given the risks, we shouldn't lock in on a peak interest rate or a precise path of rates," she said.
Fed Barkin: Gonna be a lot more inertia, persistence to inflation
Richmond Fed President Thomas Barkin told BloombergTV that today's US CPI data is "about as expected".
"Inflation is normalizing but it's coming down slowly. I just think there's gonna be a lot more inertia, a lot more persistence to inflation than maybe we'd all want," he added.
Japanese Yen Swings on US Inflation
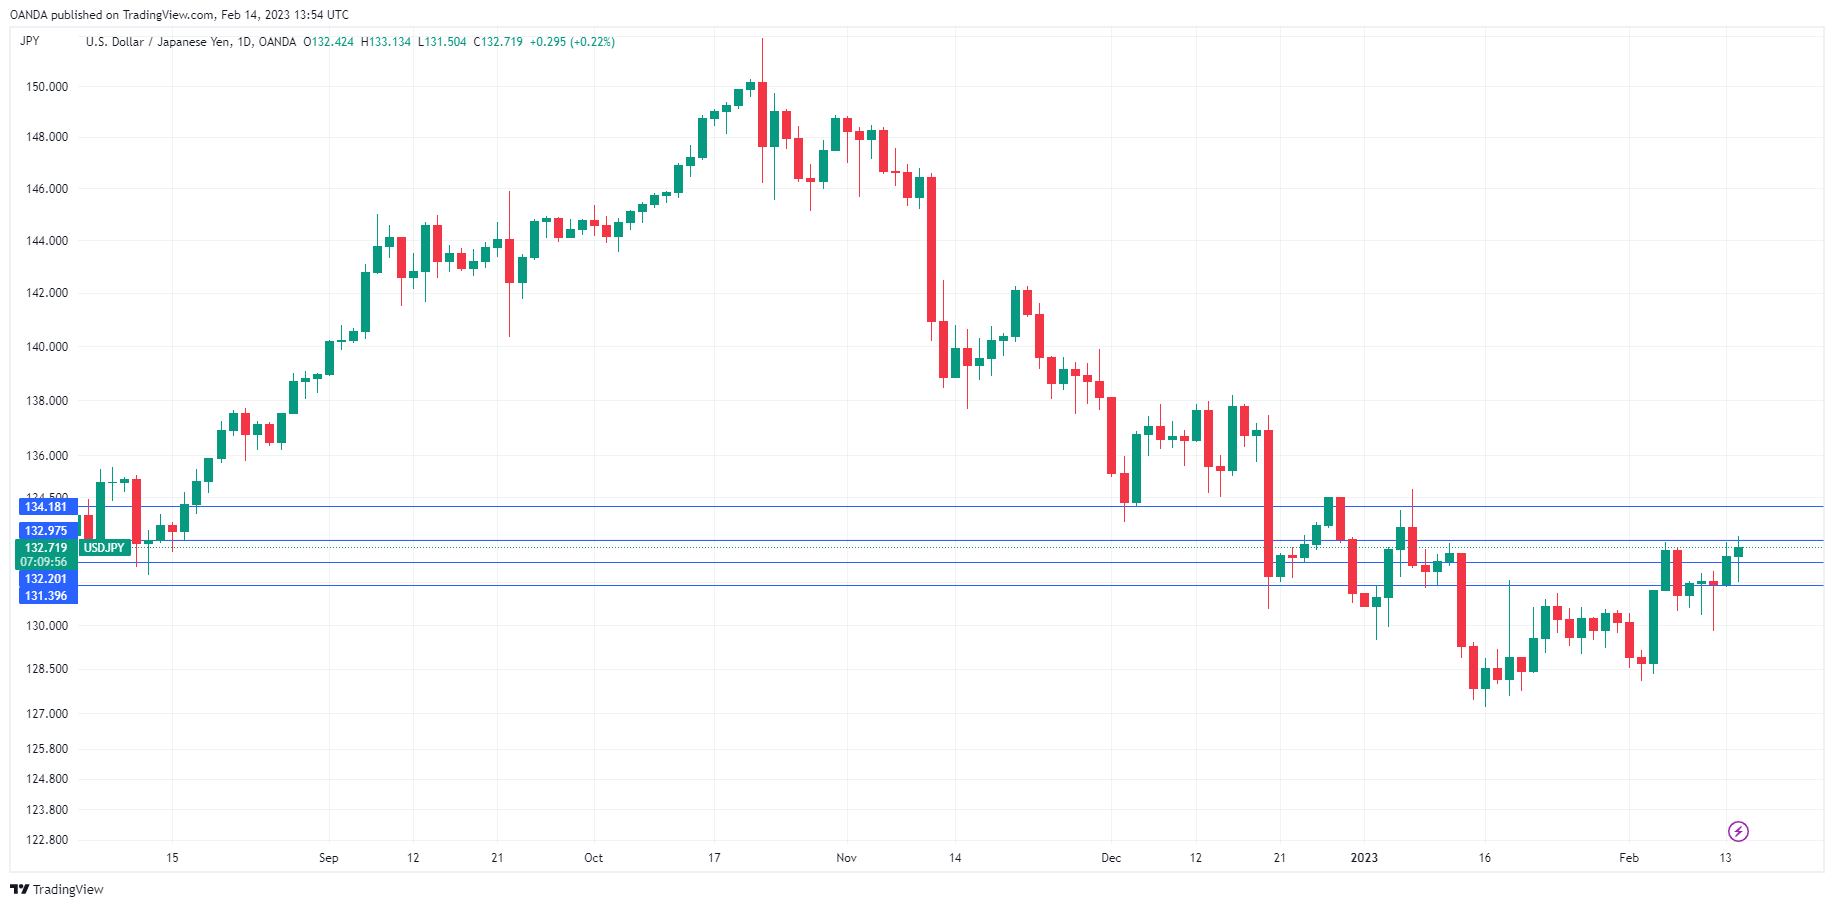
The Japanese yen has shown some strong movement on Tuesday. In the North American session, USD/JPY is trading at 132.85, up 0.32%.
US inflation slows, but less than expected
US inflation in January ticked lower to 6.4%, down from 6.5% but higher than the forecast of 6.2%. It was a similar story for the core rate, which dropped from 5.7% to 5.6%, above the forecast of 5.5%. The markets seemed uncertain how to react and USD/JPY showed sharp swings in both directions before steadying.
The numbers appear to support the Fed’s position that more rate hikes are needed for a longer period than previously expected, which could mean a higher terminal rate than the Fed had previously projected. The markets had continuously questioned this ‘higher and longer’ stance and had priced in rate hikes late in the year. We won’t be hearing much talk of rate cuts until inflation falls at a faster pace. Disinflation, which had pushed the dollar lower in recent months, appears to have lost some steam.
BoJ names Ueda as next governor
After plenty of speculation about the next BoJ governor, it’s official. The BoJ has nominated Kazuo Ueda, which was a surprise choice. When reports surfaced that Ueda was the likely pick, the yen moved briefly moved higher, as the markets viewed the choice as a signal for fresh thinking and a change in policy. Ueda said last week that current policy settings were appropriate and the yen gave back those gains. It’s possible that Ueda was being diplomatic and did not wish to make any waves before he was even nominated.
We may have to wait until he takes over the helm of the BoJ in April before we know his stance on monetary policy. He could decide to abolish the yield control curve (YCC), as he has criticized YCC in the past. This would mean the end of the cap on 10-year bond yields, which the BoJ recently increased from 0.25% to 0.50%, resulting in the yen rising sharply. Will Ueda raise interest rates? That would be a massive shift in policy, and Ueda may prefer to get his feet wet first in his new position as governor before making any dramatic moves.
USD/JPY Technical
- USD/JPY has support at 131.38 and 130.71
- There is resistance at 132.96 and 134.18
Sunset Market Commentary
Markets
Trading on almost all markets was conditional to the publication of the US January CPI as this report was supposed provide the ‘ultimate reality check’ on the Fed’s (and by extension other central bankers’) call to continue raising rates and to keep them at a higher level for quite some time. The report was very close to expectations. Headline inflation printed at 0.5% M/M and 6.4% Y/Y (from 6.5%). Core inflation rose at a 0.4% monthly pace (similar to December) to be 5.6% higher compared to the same month last year (was 5.7%). Housing (0.8% M/M) was the most important contributor to the January price rise. Food prices rose 0.5% M/M and transportation costs 0.4%. Price declines were registered for used cars (-1.9%,) and medical care (-0.4%) but the weight of these items is relatively small. Understandably, markets initially didn’t know which card to play. In volatile trading the US yield curve currently continues its bearish inversion with the 2-y gaining 7 bps, the 10-y +3 bps while the 30-y yield trades little changed. German yields are rising 4/6 bps points across the curve. ECB’s Makhlouf indicated that the ECB could raise its policy rate above 3.50% and leave it there for a while. The euro 2-y swap (3.45%) and 2-y Bund yield (2.83) are setting new cycle peak levels. On equity markets, the Euro Stoxx 50 tested recent peak (4275) but higher yields post US CPI blocked further gains (currently unchanged). US indices erased opening losses. Oil trader marginally lower (Brent $85.75 p/b) even as OPEC sees the market in 2023 slightly tighter both on a higher demand and lower supply.• On FX markets, the dollar also show some nervous swings immediately after the CPI release. Finally, the risk-driven decline came to a halt. USD/JPY extends its recent (partially yen-driven) rebound and is currently testing first resistance near 132.90. EUR/USD reversed an initially trip to the high 1.07 area to currently trade unchanged near 1.073. A bit strangely, the US CPI report also aborted further gains of sterling, not only against the dollar, but also against the euro. A strong UK labour market report (+ 102k jobs in January; weekly earnings ex-bonus at 6.7%) made markets question recent rather soft BoE guidance post the February policy meeting. The 2-y UK yield is gaining 17 bps (was 7 bps before the US CPI). Markets are growing ever more confident that the BoE will (have to) raise its policy rate to 4.50% in the summer. EUR/GBP over the previous days was captured in a ST downtrend channel and today filled bids in the 0.881 area, just to reverse this sterling gain after the US data (0.8835). Cable even loses a few ticks in a daily perspective (1.2130, after an intraday top near 1.2250).
News & Views
The Hungarian Q4 flash GDP estimate showed growth contracting by 0.4% Q/Q, somewhat less than feared (-1.1% Q/Q) but still a second consecutive negative number (downward revision to -0.7% Q/Q in Q3) putting the country in a technical recession. In (NSA) Y/Y terms, GDP grew by 0.4%. In 2022, the volume of GDP grew by 4.6%. In a brief comment, the Hungarian Central Statistical Office only elaborates somewhat on the Y/Y-release. There was significant growth especially in the manufacture of motor vehicles, trailers and semi-trailers, as well as that of electrical equipment within industry and mostly in real estate activities as well as transportation and storage among market services. A considerable downturn in agriculture slowed the Y/Y-increase. A detailed GDP-release will be published on March 2. The Hungarian forint holds its remarkable momentum, trading at EUR/HUF 380 for the first time since May last year. Preliminary Polish GDP numbers, showed a 2.4% Q/Q GDP decline in the final three months of 2022 with the Y/Y-number printing at 2%. Details will be available on Feb 28. The Polish zloty joins today’s CE-momentum with EUR/PLN dropping from 4.8 (weakest PLN since October) towards 4.76.
The Turkish government ordered private pension funds to boost their holdings of Turkish stocks to stop the post-earthquake decline (cumulative -15% on Feb 7&8) when trading is expected to resume tomorrow. Pension funds will be required to allocate 30% of the funds the government contributes to individual pension contributions to Turkish stocks instead of 10% previously. The weighting of a single stock in their portfolio will also be increased from 1% to 5%.
January CPI: Still A Long Way from Mission Accomplished
Summary
Inflation is not going away quietly. Consumer prices increased 0.5% in January, the biggest monthly move since October. Firmer food inflation and a rebound in energy prices helped boost the headline number. Excluding food and energy, the core CPI increased 0.4% amid a slight pickup in core goods and a solid 0.5% rise in core services prices. Over the past three months, the core CPI rose at a 4.6% annualized pace, an acceleration from the 4.3% run-rate seen over the three-month period ending in December and notably stronger than the 3.1% pace that was originally reported with the December CPI report.
In our view, inflation is still set to grind lower, but the process is likely to be bumpy and take time. Despite some directional improvement over the past couple of quarters, prices are still growing well-above the Fed's 2% target, and the tight labor market suggests that there are still inflationary pressures that could forestall a full return to 2% inflation. We continue to look for the FOMC to raise the fed funds rate by another 25 bps at both the March and May meetings and to hold the target range at 5.00%-5.25% through the year's end to ensure that high inflation will be quelled for good.
Inflation Continues at a Vexing Pace
January's CPI report underscored that the battle against inflation will not be quickly won. Consumer prices rose 0.5% over the month after tame gains of 0.2% and 0.1% in November and December, respectively. The strong outturn in January led the year-over-year inflation rate to tick down only a tenth of a percentage point to 6.4%. Excluding food and energy, "core" prices increased 0.4% in January and 5.6% over the past year.
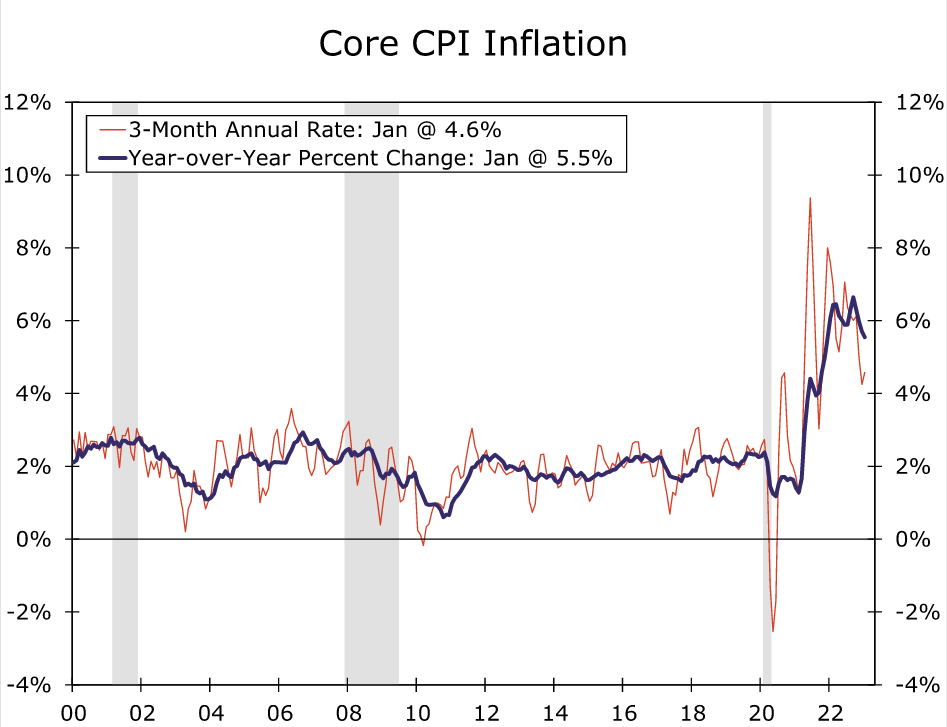
Annual revisions to the seasonal factors that were released on Friday foreshadowed that, while inflation has come off its peak, momentum remains stronger than the prior three monthly reports indicated. The three-month annualized pace of core CPI inflation through December was revised up to 4.3% from 3.1% previously. The January report further dampens enthusiasm that inflation is rapidly slowing. In light of the strong core inflation reading in January, the three-month annualized rate quickened to 4.6% from the 4.3% pace registered in December.
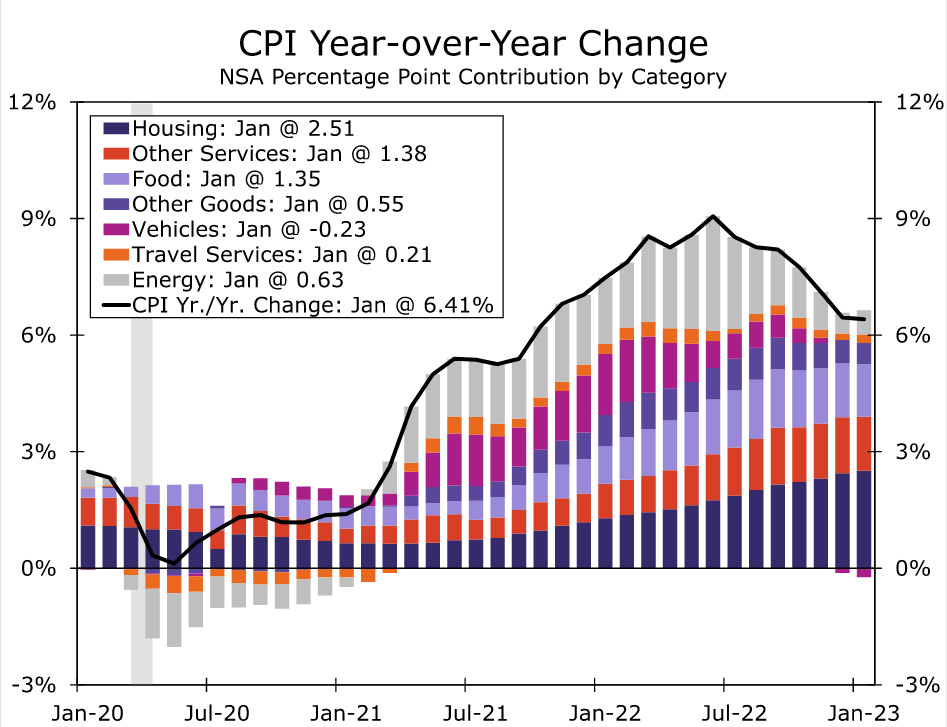
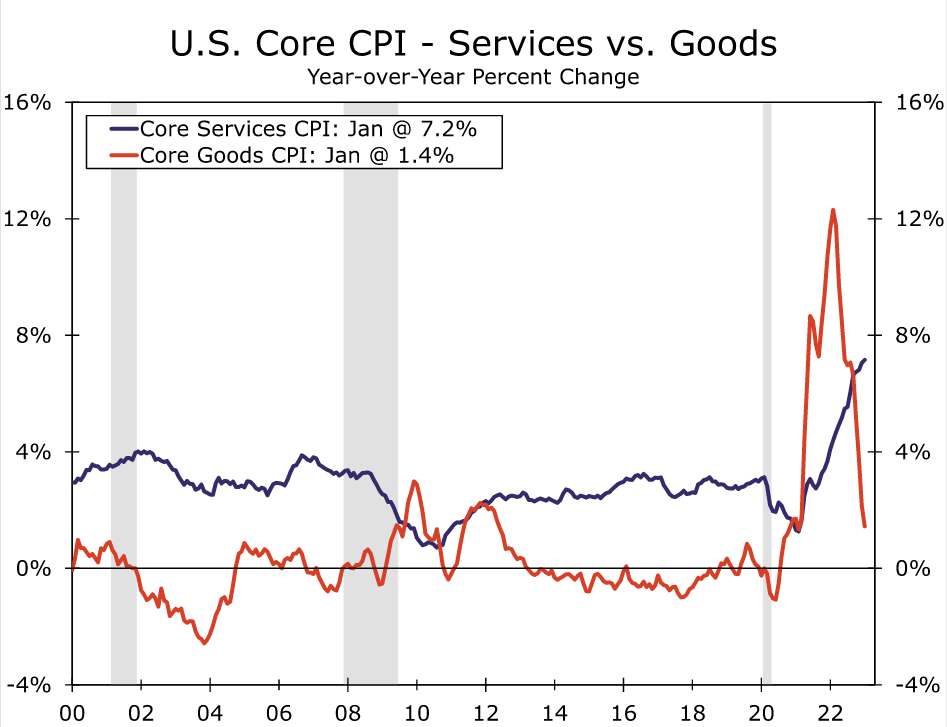
Core goods prices increased a scant 0.1% in January. The normalization in used auto prices continued with prices falling 1.9% in the month, the seventh consecutive month of deflation. New vehicle prices also increased a relatively tame 0.2%. That said, not all goods' categories posted disinflationary prints. Apparel prices rose 0.8% in January, and inflation for medical drugs and supplies jumped 1.1%. Overall, core goods inflation has slowed markedly over the past year, but as broken out in a nearby chart, the improvement has been primarily driven by vehicles.
Core services prices once again advanced faster than goods with a 0.5% rise in January. Rent and owners' equivalent rent growth each eased slightly but remained strong with gains of 0.7%, as the long lag between these measures and market-based rents has yet to reflect the ongoing disinflation in residential housing costs. Travel-related services prices were mixed, with lodging away from home up 1.2%, car rentals up 3.0% but airline fares down 2.1%. The core services ex-primary shelter measure that Chair Powell and other FOMC members have cited as a "super-core" measure of inflation increased 0.4% over the month and at a 3.2% three-month annualized rate.
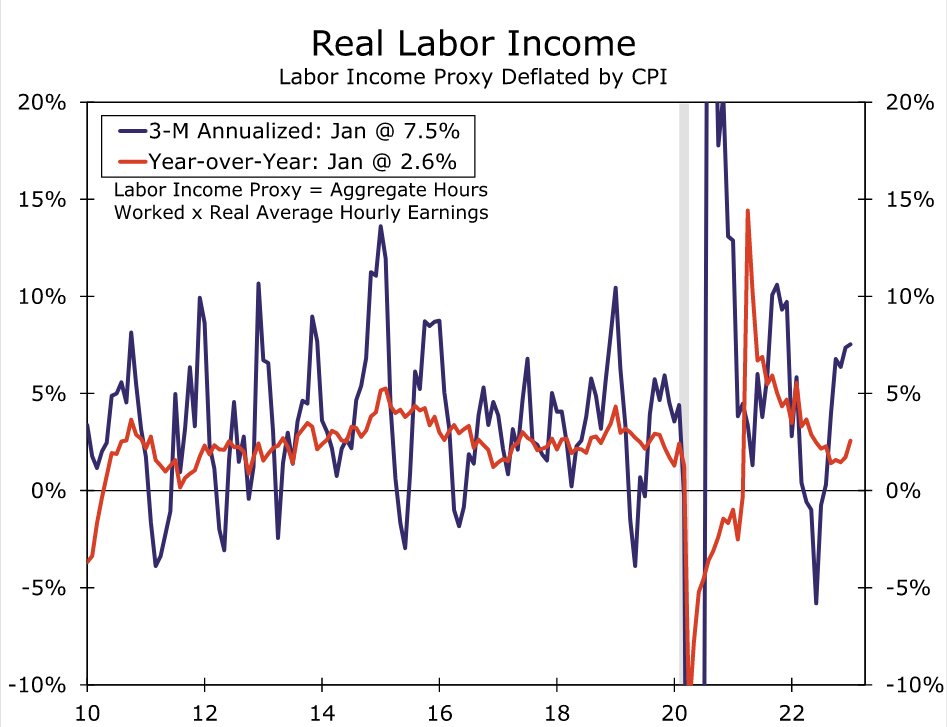
At the same time core prices continue to grow at an elevated pace, prices for necessities continue to bite. Supporting the rebound in inflation in January was a 2.0% rise in energy prices. A 2.4% rise in gasoline prices ends, or at the very least disrupts, a downward run that saw gasoline prices falling 24% over the second half of 2022 and played a meaningful role in the improvement of real income dynamics in recent months. Since peaking in June, headline CPI inflation has fallen 2.7 percentage points on a year-over-year basis, with energy goods alone shaving off 2.3 points. At the same time, consumers have yet to benefit from plummeting natural gas prices, with energy services up 2.1% in January. Price increases at the grocery store slowed only slight in January (up 0.4%) and remain more than 11% higher than a year ago.
Still More Work to Do
Today's report makes clear that there will be some bumps on the road back to 2% inflation. We continue to look for inflation to trend lower, but we believe getting back to an inflation rate the Fed can live with on a sustained basis will neither be quick nor painless. While inventory dynamics and higher interest rates are putting downward pressure on goods and shelter prices, the tight labor market continues to emit upward pressure on prices across all categories. Over the past three months, the core CPI increased at a 4.6% annualized rate. Although this is down from the highs of last year, it remains too high to meet the Fed's mandate of price stability.
As we wrote in our recent monthly U.S. Economic Outlook, the prospects for a "soft landing" have increased relative to a few months ago. Among other factors, slower inflation, most notably for energy and food, have helped propel solid gains in real disposable incomes. However, the upshot of a remarkably resilient U.S. labor market is that it may cause inflation to remain stubbornly above the Fed's 2% target for price growth. Labor demand and cost growth remain inconsistent with 2% inflation, and that keeps the chance of a recession still more likely than not, in our view. We have not seen the end of Fed tightening this cycle, let alone the full effects. We continue to look for the FOMC to raise the fed funds rate by another 25 bps at both the March and May meetings and to hold the target range at 5.00%-5.25% through the year's end to ensure that high inflation will be quelled for good.
S&P 500 Wave Analysis
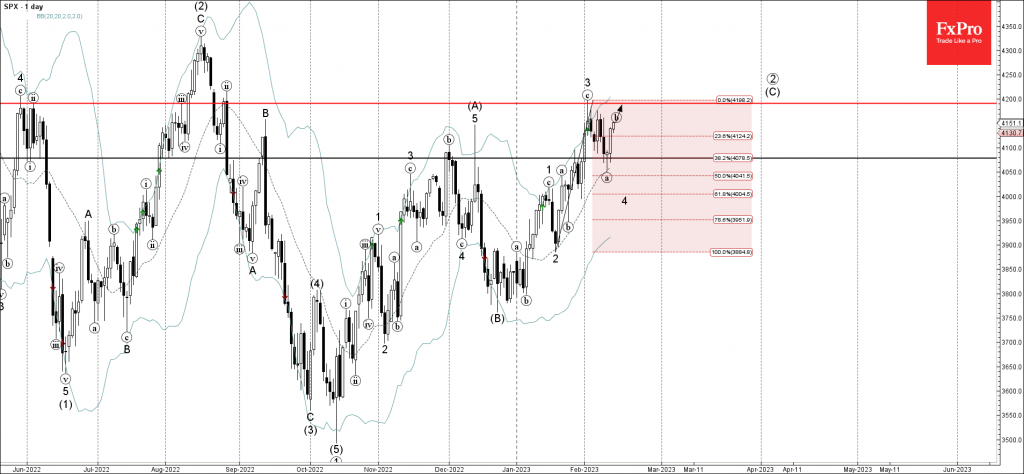
- S&P 500 reversed from support level 4080.00
- Likely to rise to resistance level 4200.00
S&P 500 index recently reversed up from the support level 4080.00 (former resistance from the end of January), standing near the 20-day moving average and the 38.2% Fibonacci correction of the upward impulse from January.
The upward reversal from the support level 4080.00 created the daily Japanese candlesticks reversal pattern Morning Star – which ended earlier wave a.
S&P 500 index can be expected to rise further toward the next resistance level 4200.00 (which stopped the previous impulse wave 3).
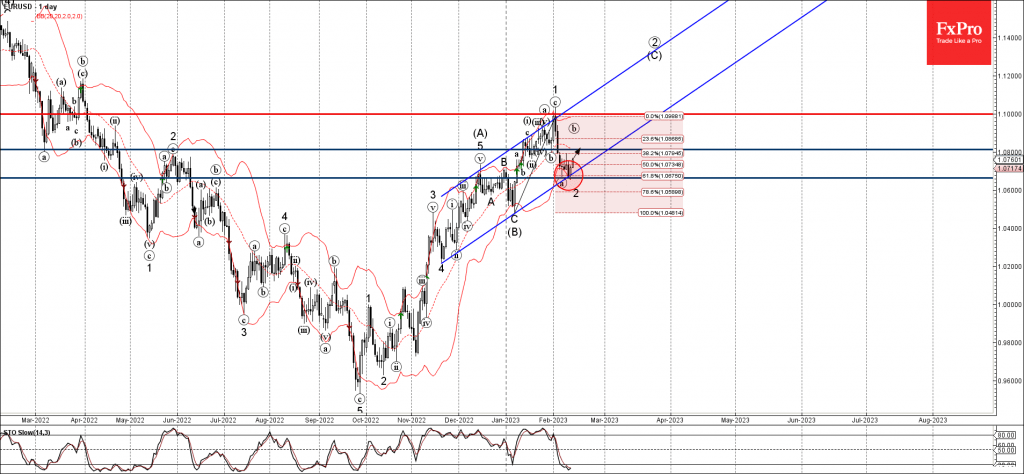
EURUSD Wave Analysis
- EURUSD reversed from support level 1.0665
- Likely to rise to resistance level 1.0800
EURUSD recently reversed up from the key support level 1.0665 (former resistance from December), standing near the lower daily Bollinger Band and the 61.8% Fibonacci correction of the upward impulse from January.
The support level 1.0665 was further strengthened by the intersecting lower support trendline of the daily up channel from November.
Given the oversold daily Stochastic, EURUSD can be expected to rise further toward the next resistance level 1.0800 (top of the previous wave B).
USD/JPY Mid-Day Outlook
Daily Pivots: (S1) 131.48; (P) 132.19; (R1) 133.14; More...
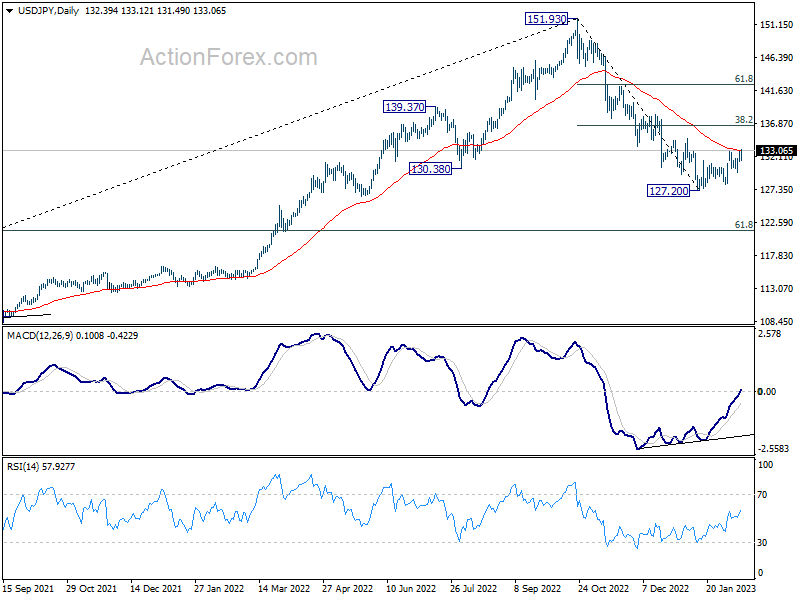
Breach of 132.89 minor resistance suggests that rebound from 127.20 is resuming. Intraday bias is back on the upside for 38.2% retracement of 151.93 to 127.20 at 136.64, even as a correction to the decline from 151.39. On the downside, break of 131.49 minor support will turn intraday bias neutral again first.
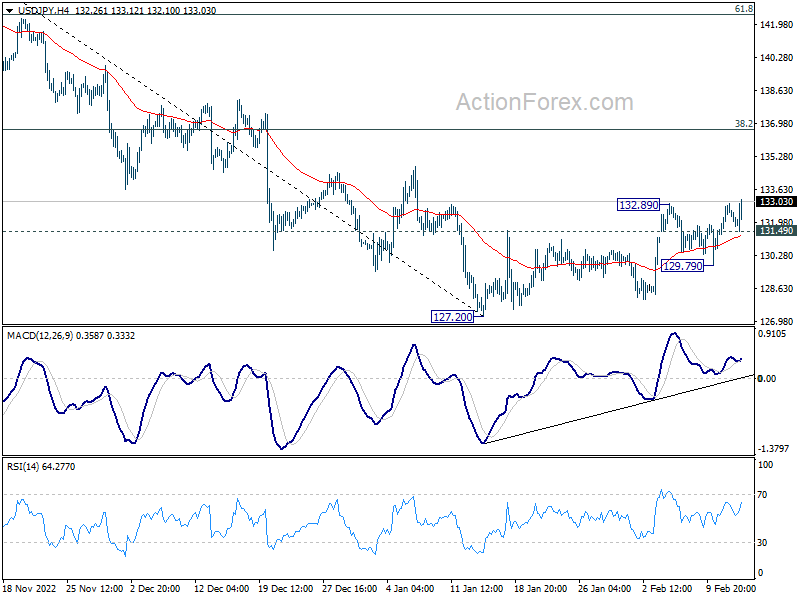
In the bigger picture, prior of 55 week EMA (now at 131.47) raises the chance of medium term bearish reversal, but that's not confirmed yet. Strong rebound from current level, followed by sustained break of 38.2% retracement of 151.93 to 127.20 at 136.64 will argue that price actions from 151.93 is merely a corrective pattern. However, rejection by 136.64 will solidify medium term bearishness for 61.8% retracement of 102.58 to 151.93 at 121.43 and 38.2% retracement of 75.56 to 151.93 at 122.75.