

Sample Category Title
AUD/USD Daily Report
Daily Pivots: (S1) 0.6929; (P) 0.6979; (R1) 0.7036; More...
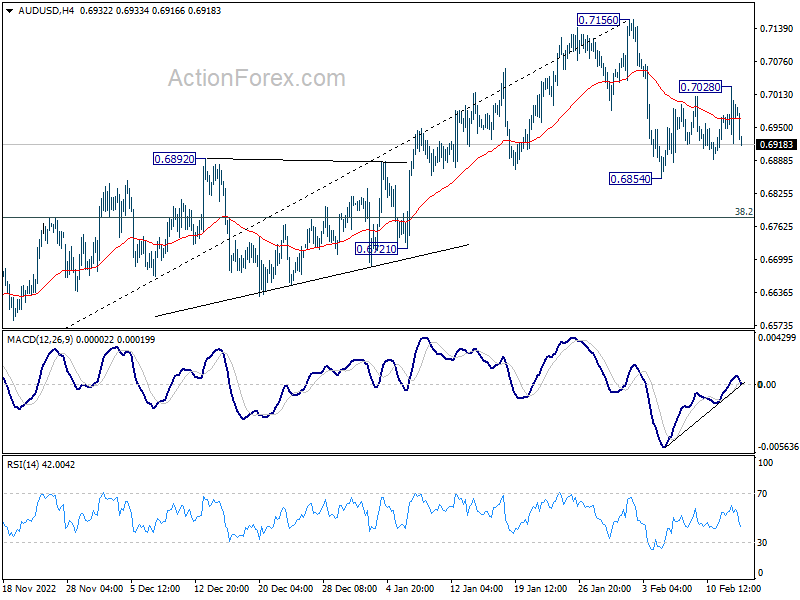
AUD/USD edged higher to 0.7028 but quickly retreated. Intraday bias remains neutral first. On the downside, break of 0.6854 will resume the correction from 0.7156 to 38.2% retracement of 0.6169 to 0.7156 at 0.6779. On the upside, break of 0.7028 will turn bias back to the upside for retesting 0.7156 high instead.
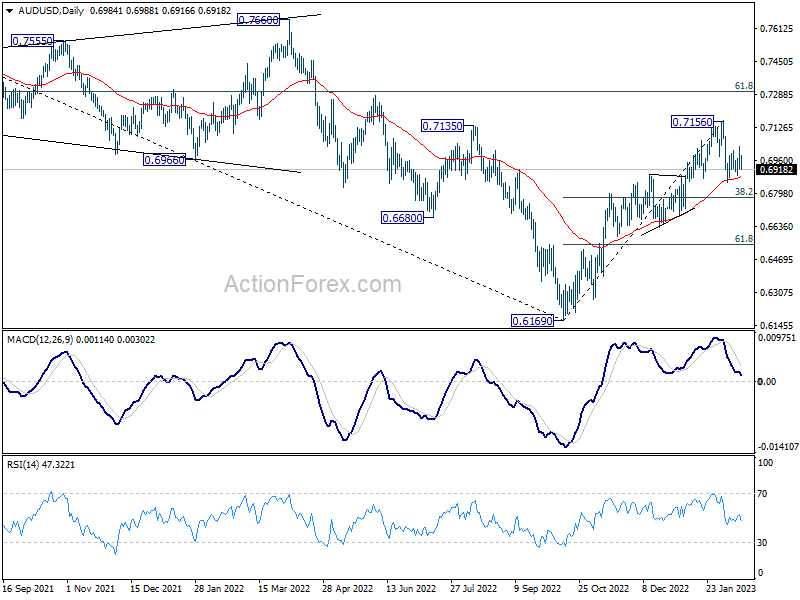
In the bigger picture, corrective decline from 0.8006 (2021 high) should have completed with three waves down to 0.6169 (2022 low). Further rally should be seen to 61.8% retracement of 0.8006 to 0.6169 at 0.7304. Sustained break there will pave the way to retest 0.8006. This will now remain the favored case as long as 0.6721 support holds.
EUR/USD Daily Outlook
Daily Pivots: (S1) 1.0694; (P) 1.0749; (R1) 1.0791; More...
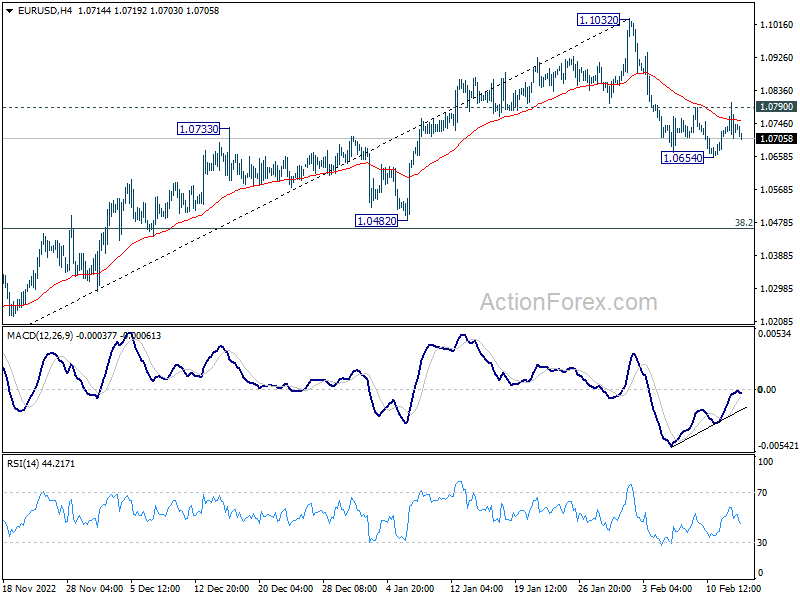
Intraday bias in EUR/USD remains neutral for the moment. On the downside, break of 1.0654 will resume the corrective fall from 1.1032 to 38.2% retracement of 0.9534 to 1.1032 at 1.0463. Strong support should be seen around there to bring rebound, at least on first attempt. On the upside, firm break of 1.0790 minor resistance will turn bias back to the upside for retesting 1.1032 high instead.
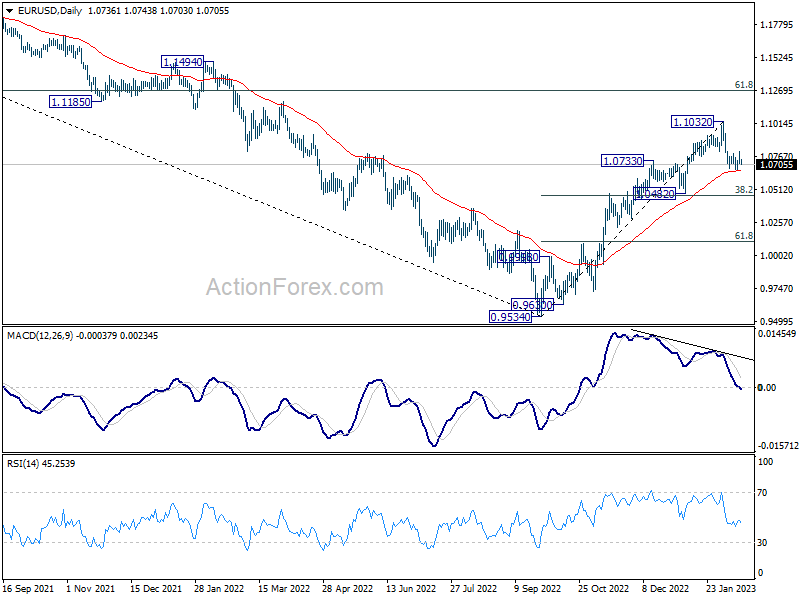
In the bigger picture, the rally from 0.9534 low (2022 low) is a medium term up trend rather than a correction. Further rise is in favor to 61.8% retracement of 1.2348 (2021 high) to 0.9534 at 1.1273 next. This will remain the favored case as long as 1.0482 support holds.
GBP/USD Daily Outlook
Daily Pivots: (S1) 1.2107; (P) 1.2187; (R1) 1.2256; More...
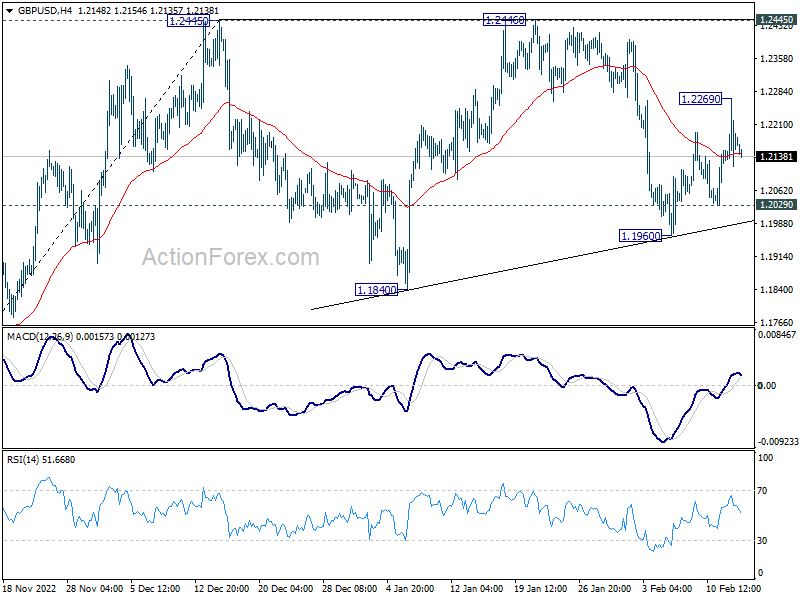
Intraday bias in GBP/USD is turned neutral again as rebound stalled after hitting 1.2269. Still, the favored case is that corrective pattern from 1.2445 has completed at 1.1960 already. Above 1.2269 will bring retest of 1.2445/6 resistance zone. On the downside however, break of 1.2029 will extend the corrective pattern with another fall through 1.1960, towards 1.1840 support.
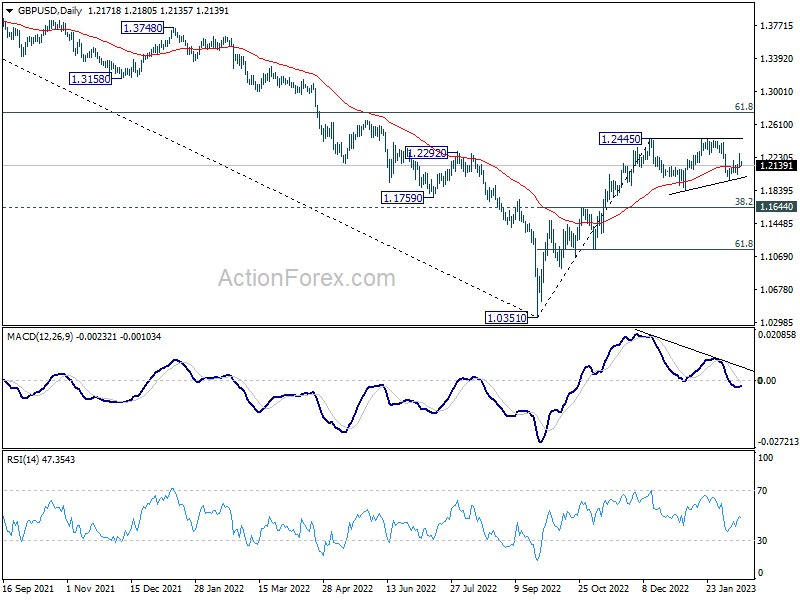
In the bigger picture, rise from 1.0351 medium term bottom is at least correcting whole down trend from 1.4248 (2021 high). Further rise is expected as long as 1.1644 resistance turned support holds. Next target is 61.8% retracement of 1.4248 to 1.0351 at 1.2759. Sustained break there will pave the way back to 1.4248.
USD/CHF Daily Outlook
Daily Pivots: (S1) 0.9159; (P) 0.9196; (R1) 0.9255; More...
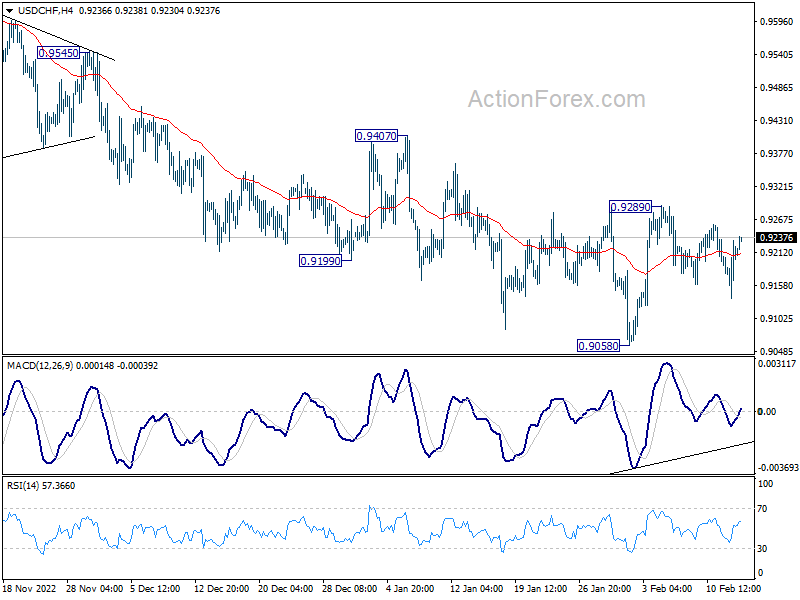
Intraday bias in USD/CHF remains neutral and outlook is unchanged. On the upside, firm break of 0.9289 resistance will confirm short term bottoming at 0.9058, and bring stronger rise to 0.9407 resistance. On the downside, however, sustained break of 0.9058 will resume larger decline from 1.0146 instead.
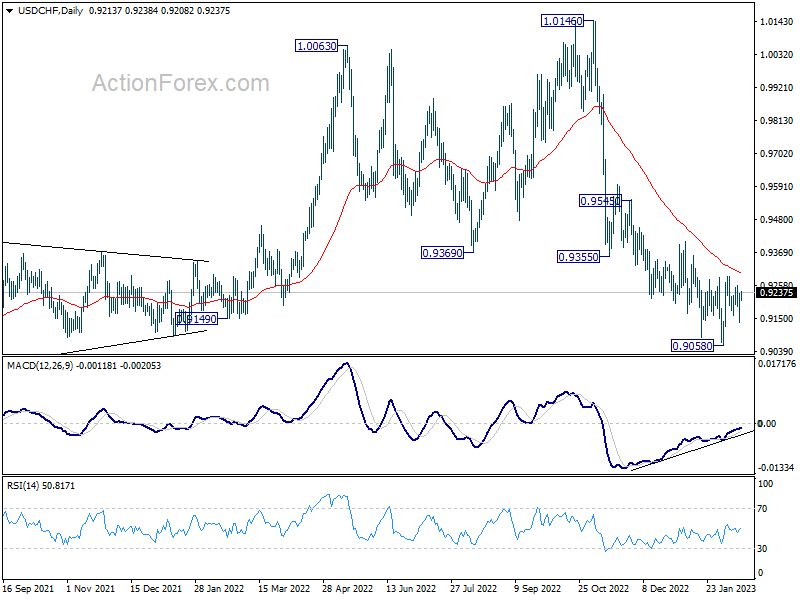
In the bigger picture, rise from 0.8756 (2021 low) has completed at 1.0146, well ahead of 1.0342 long term resistance (2016 high). Based on current downside momentum, fall from 1.0146 should be a medium term down trend itself. Next target is a test on 0.8756 low. Strong support should be seen there to bring rebound. Still, further decline will be expected as long as 0.9407 resistance holds, in any case.
USD/JPY Daily Outlook
Daily Pivots: (S1) 131.97; (P) 132.65; (R1) 133.77; More...
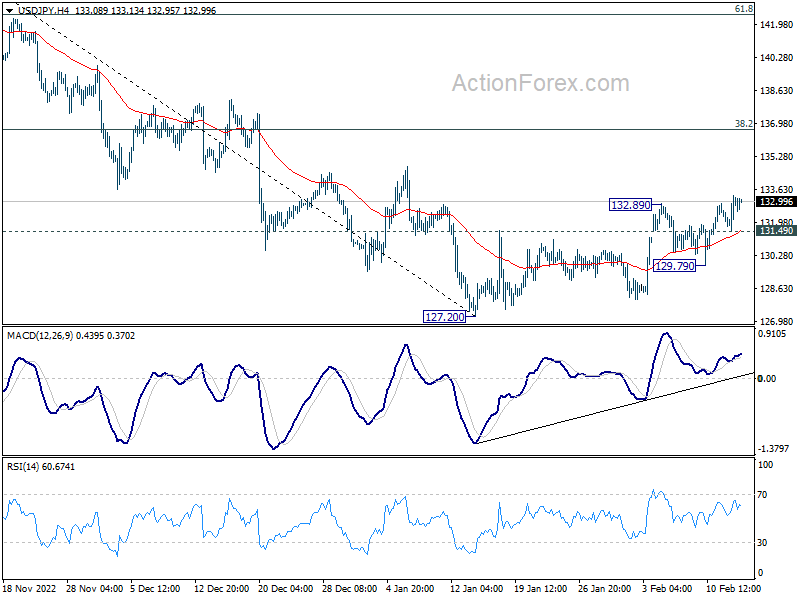
Intraday bias in USD/JPY stays on the upside at this point. Rebound from 127.20 short term bottom should extend to 38.2% retracement of 151.93 to 127.20 at 136.64, even as a correction to the decline from 151.39. On the downside, break of 131.49 minor support will turn intraday bias neutral again first.
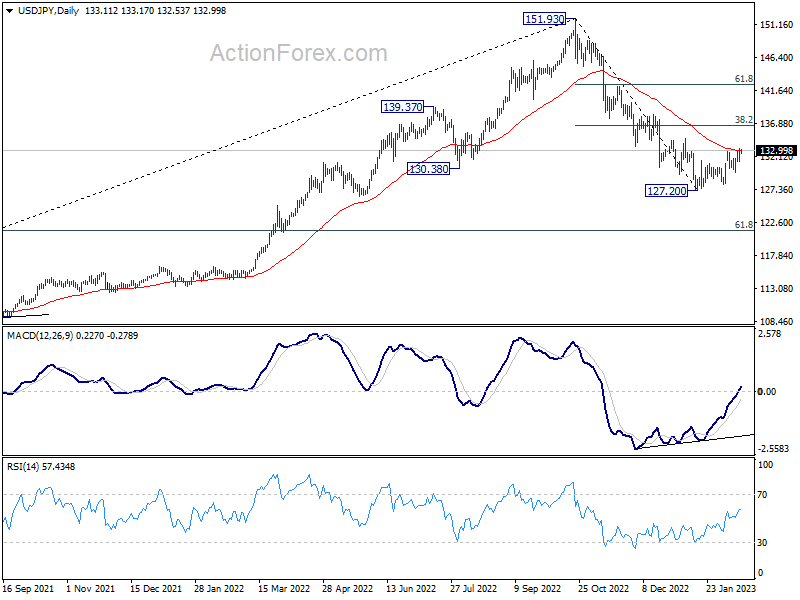
In the bigger picture, prior of 55 week EMA (now at 131.47) raises the chance of medium term bearish reversal, but that's not confirmed yet. Strong rebound from current level, followed by sustained break of 38.2% retracement of 151.93 to 127.20 at 136.64 will argue that price actions from 151.93 is merely a corrective pattern. However, rejection by 136.64 will solidify medium term bearishness for 61.8% retracement of 102.58 to 151.93 at 121.43 and 38.2% retracement of 75.56 to 151.93 at 122.75.
Yen Weakness Continues, Sterling Ready For More Upside
Yen's weakness is currently a clearer development in the rather indecisive markets. Germany and UK benchmark yields are extending near term rally while US 10-year yield stands firm above 3.7%. On the other hand, 10-year JGB yield is still capped by BoJ imposed ceiling. Dollar is mixed for now after traders refused to commit over yesterday's CPI data. On other hand Sterling looks ready to ride on any upside surprise in today's consumer inflation data. A question is whether the Pound's rally, if happens, could take Euro and Swiss higher, or pressured them.
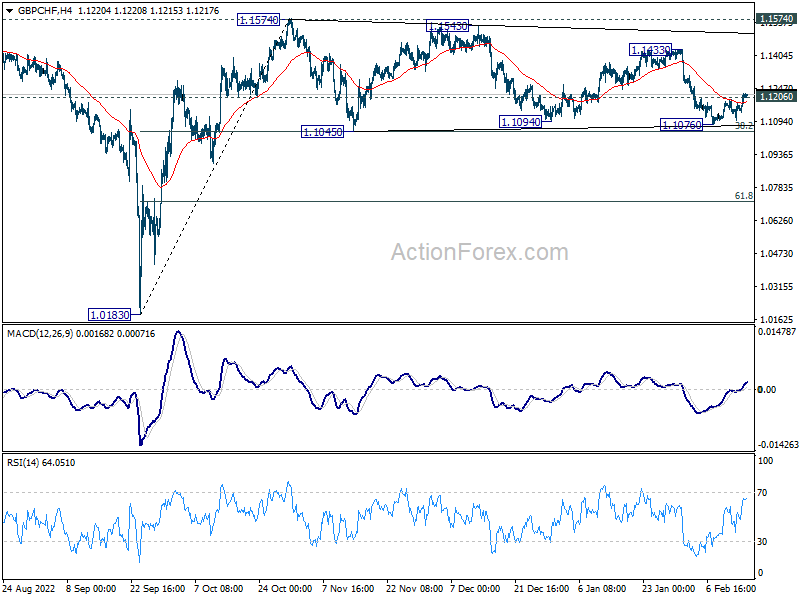
Technically, GBP/CHF is making some progress in breaking 1.1206 minor resistance. Upside acceleration today would add to the case that whole corrective pattern from 1.1574 has completed. 1.1433 resistance should be the next target. Firm break there will set the stage to resume larger rally from 1.0813 through 1.1574 later in the month. Let's see how it goes.
In Asia, Nikkei closed down -0.42%. Hong Kong HSI is down -1.51%. China Shanghai SSE is down -0.47%. Singapore Strait Times is down -1.06%. Japan 10-year JGB yield is down -0.007 at 0.503. Overnight, DOW dropped -0.46%. S&P 500 dropped -0.03%. NASDAQ rose 0.57%. 10-year yield rose 0.044 to 3.761.
Fed Harker: It's going to be above 5%
Philadelphia Fed President Patrick Harker commented on yesterday's inflation report and said "it was good and it was moving down, but not quickly." He added that FOMC will have to "let the data dictate" tightening, and, "It's going to be above 5% in the Fed funds rate. How much above 5? It's going to depend a lot on what we're seeing."
"In my view, we are not done yet… but we are likely close," he said. "At some point this year, I expect that the policy rate will be restrictive enough that we will hold rates in place and let monetary policy do its work," he noted in a prepared speech".
"Rates are now at a level that allow us to slow down and proceed cautiously and, to my mind, the days of us raising 75 basis points at a time have surely passed," Harker said. "Just at the last meeting, I voted for a hike of 25 basis points — what some would call slow but actually is closer to cruising speed when it comes to tightening."
Fed Williams: We need all the gears turning at the right pace
York Fed President John Williams said yesterday, "We will we stay the course until our job is done... We must restore balance to the economy and bring inflation down to 2 percent on a sustained basis."
"We need all the gears turning at the right pace to restore balance between demand and supply in the entire economy," said Williams. "We still have some way to go to achieve that goal."
He expects core inflation, as measured by core PCE reading at 4.4% in December, to fall to 3% this year and then 2% over the next few years. Growth will likely slow to just 1% this year, with unemployment rate to rise to between 4% and 5%.
RBA Lowe: I don't think we're at the peak of interest rate yet
RBA Governor Philip Lowe said in a Senate hearing, "I don't think we're at the peak (on interest rate) yet, but how far we have to go up I don't know." He noted that inflation, which is currently sitting at 7.8%, was still "wage too high". Unemployment would need to rise before there were any major changes to inflation.
"I understand why some people focus on the risks on the one side, but we've got to be attentive to the risk from higher inflation," Lowe warned. "It's corrosive for the economy. And all the evidence is if inflation stays high for too long, expectations adjust and that leads to higher interest rates and more unemployment.."
"The risks are two sided, and we're trying to navigate our way through a narrow path."
Looking ahead
UK inflation data is the major focus in European session, with CPI and PPI featured. Eurozone will release trade balance and industrial production.
Later in the day, US retail sales will take center stage, and Empire State manufacturing, industrial production, NAHB housing index and business inventories will be featured. Canada will release housing starts, manufacturing sales and wholesale sales.
USD/JPY Daily Outlook
Daily Pivots: (S1) 131.97; (P) 132.65; (R1) 133.77; More...
Intraday bias in USD/JPY stays on the upside at this point. Rebound from 127.20 short term bottom should extend to 38.2% retracement of 151.93 to 127.20 at 136.64, even as a correction to the decline from 151.39. On the downside, break of 131.49 minor support will turn intraday bias neutral again first.
In the bigger picture, prior of 55 week EMA (now at 131.47) raises the chance of medium term bearish reversal, but that's not confirmed yet. Strong rebound from current level, followed by sustained break of 38.2% retracement of 151.93 to 127.20 at 136.64 will argue that price actions from 151.93 is merely a corrective pattern. However, rejection by 136.64 will solidify medium term bearishness for 61.8% retracement of 102.58 to 151.93 at 121.43 and 38.2% retracement of 75.56 to 151.93 at 122.75.
Economic Indicators Update
| GMT | Ccy | Events | Actual | Forecast | Previous | Revised |
|---|---|---|---|---|---|---|
| 04:30 | JPY | Tertiary Industry Index M/M Dec | -0.40% | 0.00% | -0.20% | 0.10% |
| 07:00 | GBP | CPI M/M Jan | -0.40% | 0.40% | ||
| 07:00 | GBP | CPI Y/Y Jan | 10.30% | 10.50% | ||
| 07:00 | GBP | Core CPI Y/Y Jan | 6.20% | 6.30% | ||
| 07:00 | GBP | RPI M/M Jan | 0.10% | 0.60% | ||
| 07:00 | GBP | RPI Y/Y Jan | 13.20% | 13.40% | ||
| 07:00 | GBP | PPI Input M/M Jan | 0.80% | -1.10% | ||
| 07:00 | GBP | PPI Input Y/Y Jan | 15.40% | 16.50% | ||
| 07:00 | GBP | PPI Output M/M Jan | -0.20% | -0.80% | ||
| 07:00 | GBP | PPI Output Y/Y Jan | 14.40% | 14.70% | ||
| 07:00 | GBP | PPI Core Output M/M Jan | 0.70% | 0.10% | ||
| 07:00 | GBP | PPI Core Output Y/Y Jan | 11.90% | 12.40% | ||
| 10:00 | EUR | Eurozone Trade Balance (EUR) Dec | -16.0B | -15.2B | ||
| 10:00 | EUR | Eurozone Industrial Production M/M Dec | -0.80% | 1.00% | ||
| 13:15 | CAD | Housing Starts Jan | 252K | 249K | ||
| 13:30 | CAD | Manufacturing Sales M/M Dec | 0% | |||
| 13:30 | CAD | Wholesale Sales M/M Dec | 0.50% | |||
| 13:30 | USD | Empire State Manufacturing Index Feb | -15.6 | -32.9 | ||
| 13:30 | USD | Retail Sales M/M Jan | 1.70% | -1.10% | ||
| 13:30 | USD | Retail Sales ex Autos M/M Jan | 0.90% | -1.10% | ||
| 14:15 | USD | Industrial Production M/M Jan | 0.40% | -0.70% | ||
| 14:15 | USD | Capacity Utilization Jan | 79.00% | 78.80% | ||
| 15:00 | USD | NAHB Housing Market Index Feb | 37 | 35 | ||
| 15:00 | USD | Business Inventories Dec | 0.40% | 0.40% | ||
| 15:30 | USD | Crude Oil Inventories | 2.4M |
Technical Outlook and Review
USD/JPY:
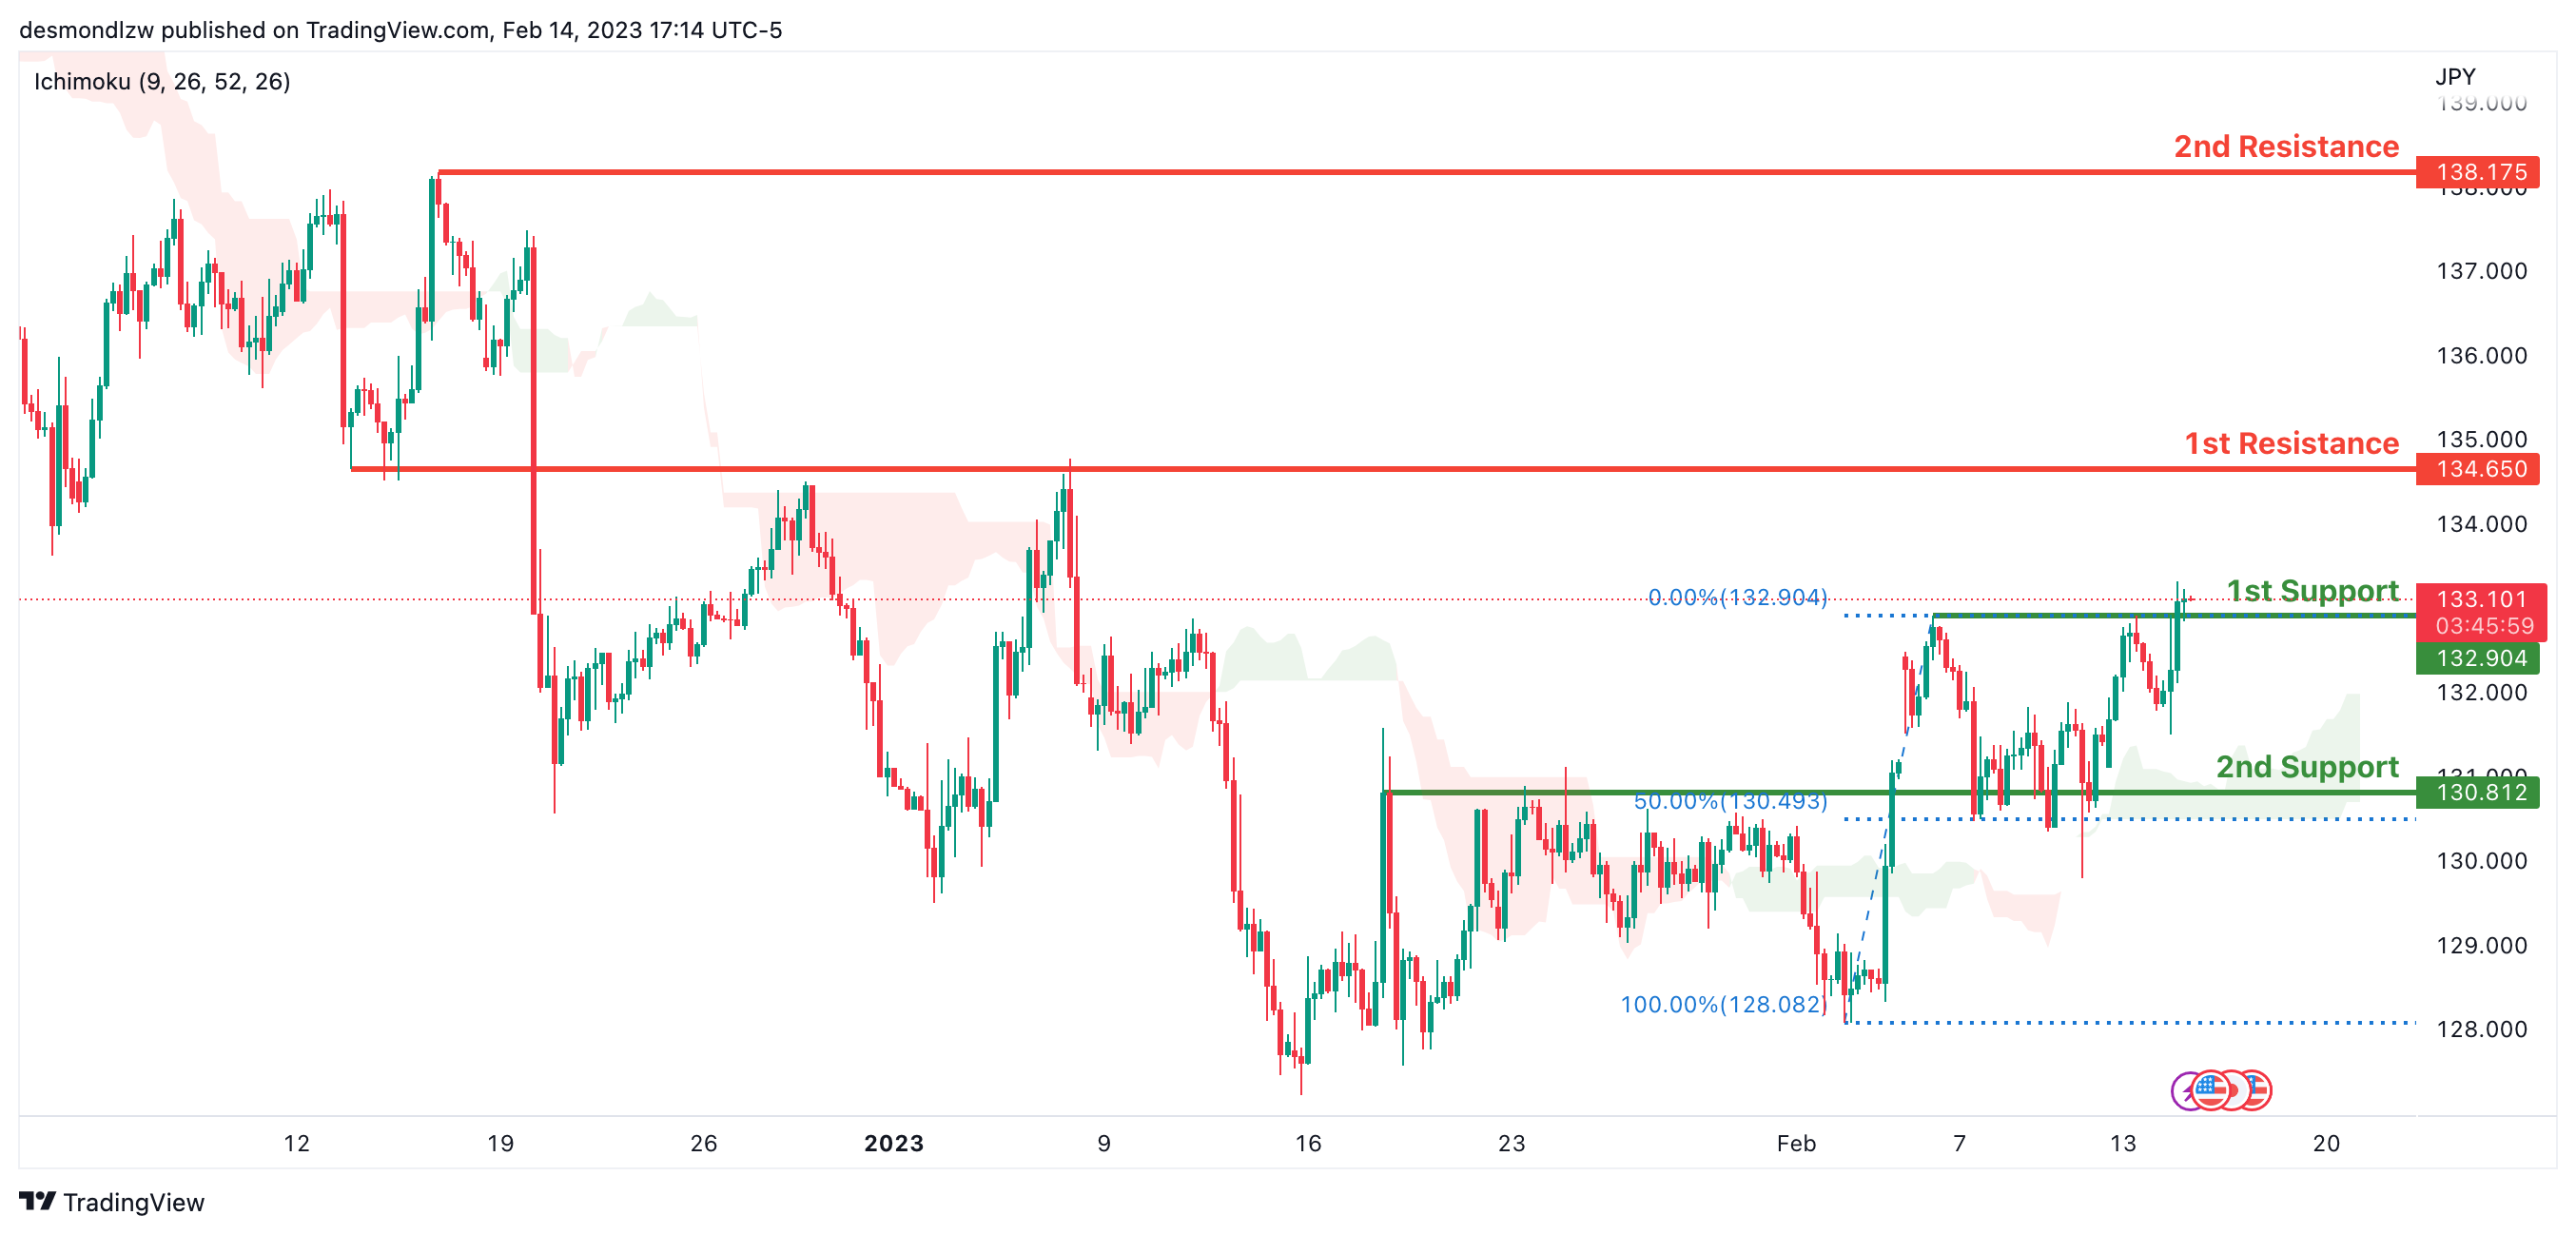
Looking at the H4 chart, my overall bias for USDJPY is bullish due to the current price crossing above the Ichimoku cloud, indicating a bullish market. If this bullish momentum continues, expect the price to possibly continue heading towards the 1st resistance at 134.650, where the overlap resistance is. In an alternate scenario, price could possibly head back down to retest the 1st support at 132.904, where the overlap support is.
Areas of consideration:
- H4 time frame, 1st resistance at 134.650
- H4 time frame, 1st support at 132.904
DXY:
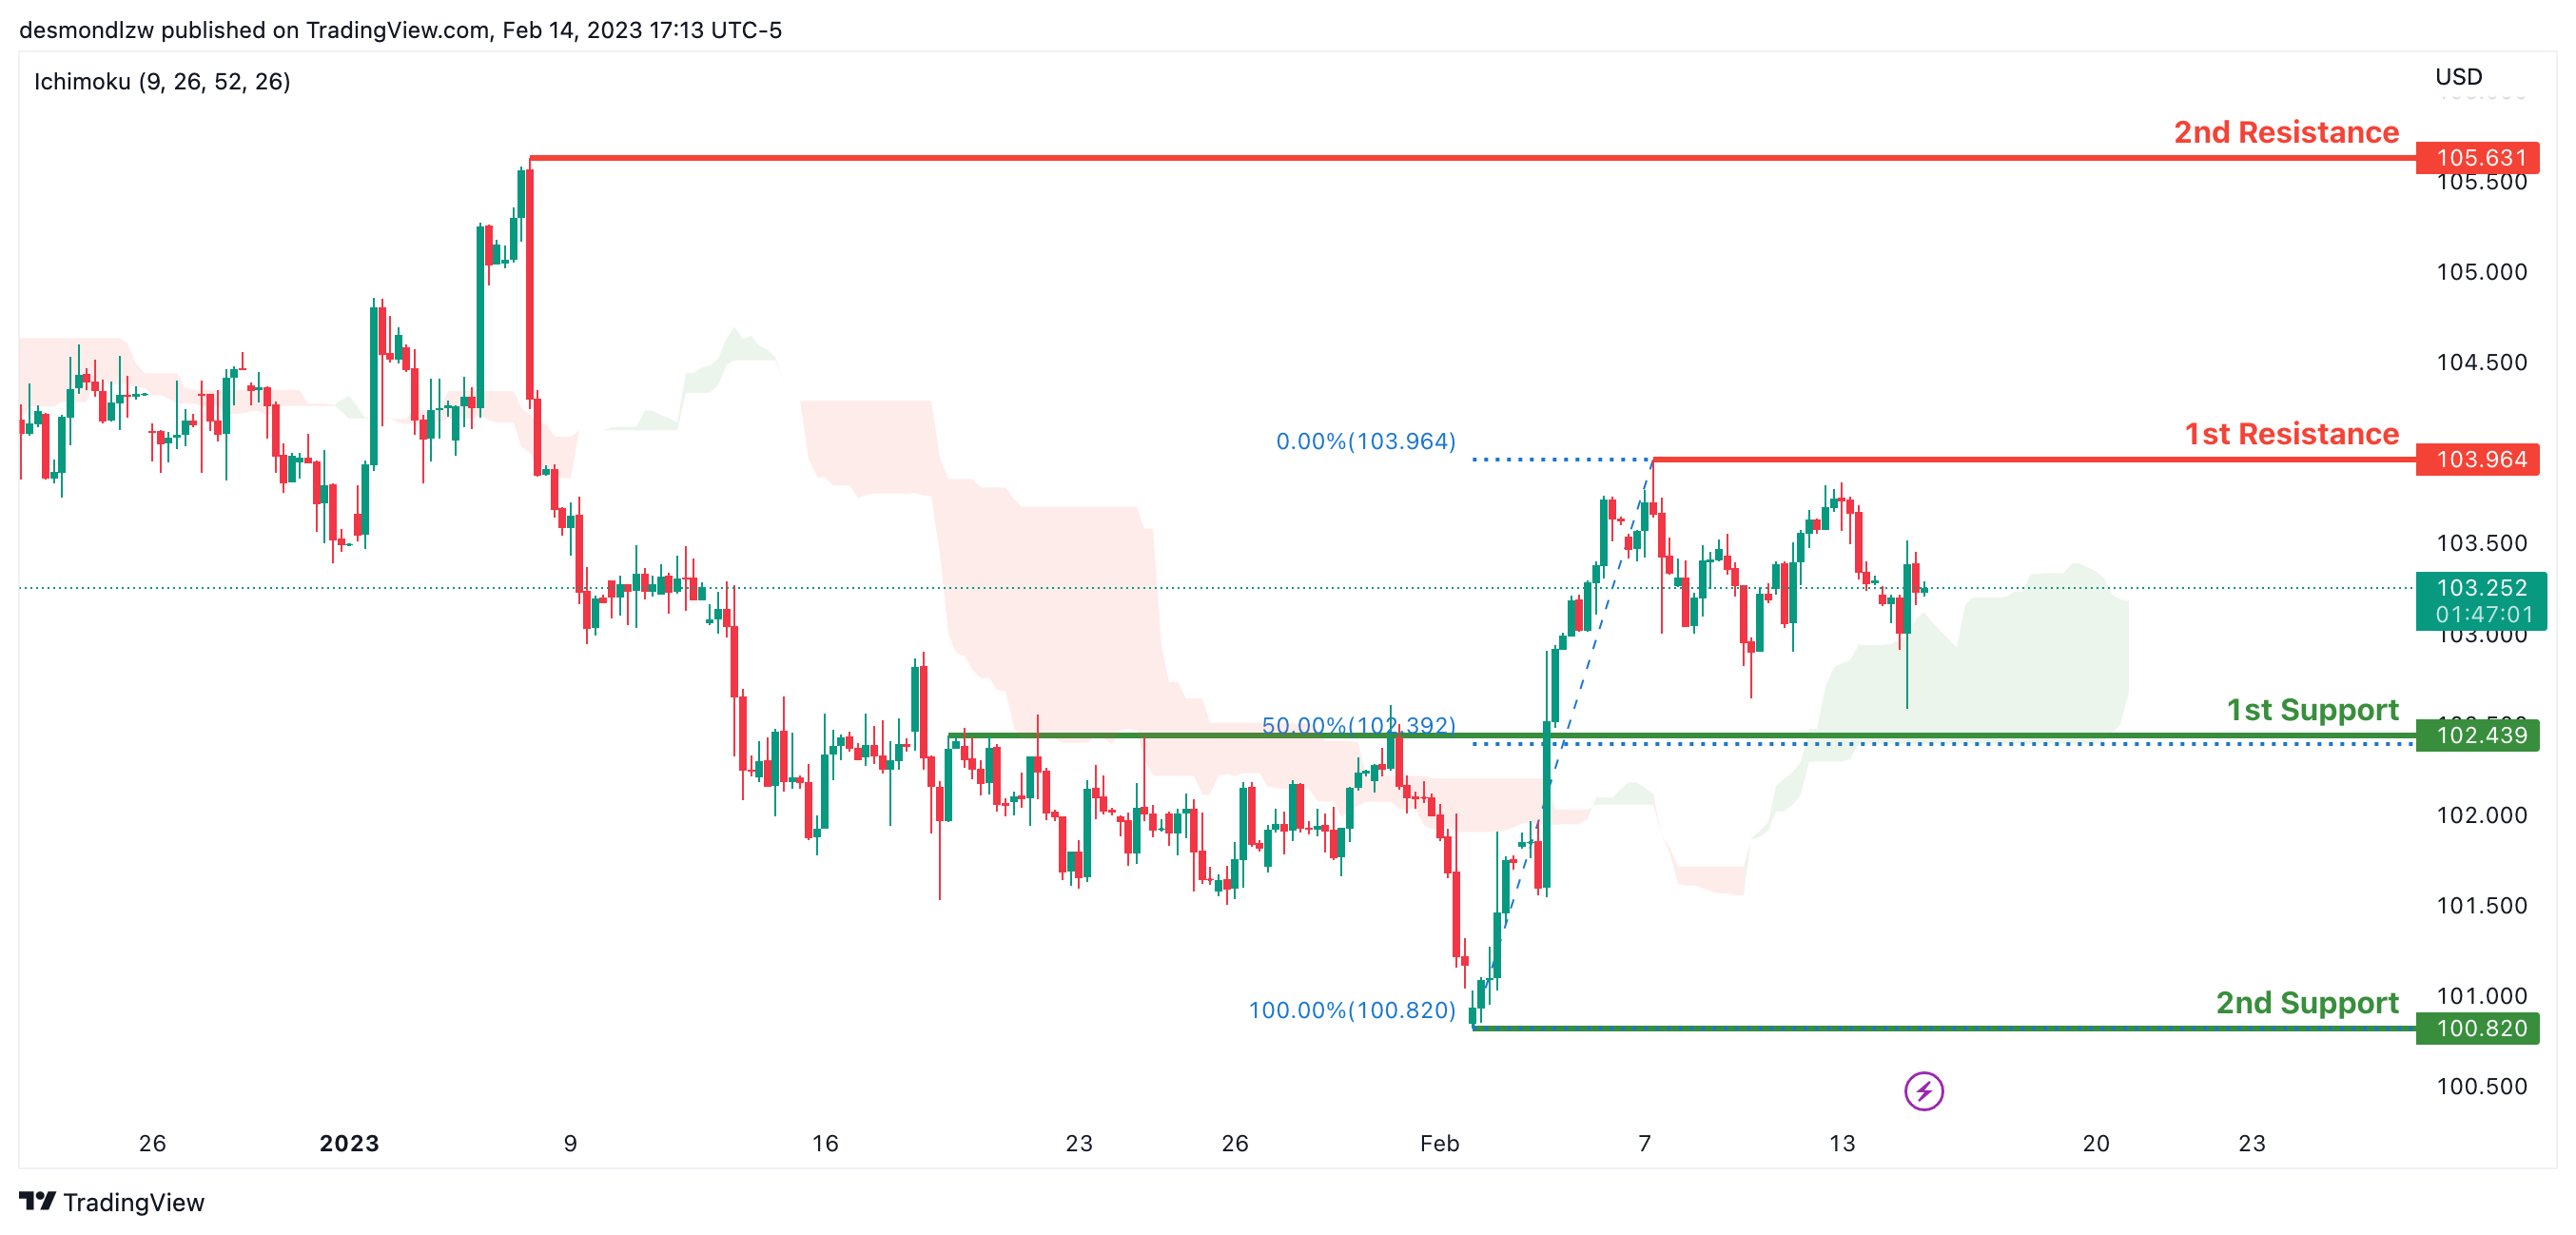
Looking at the H4 chart, my overall bias for DXY is bullish due to the current price crossing above the Ichimoku cloud, indicating a bullish market. If this bullish momentum continues, expect the price to possibly continue heading towards the 1st resistance at 103.964, where the previous swing high is. In an alternative scenario, price could head back down to retest the 1st support at 102.439, where the 50% Fibonacci line and overlap support is.
Areas of consideration:
- H4 time frame, 1st resistance at 103.964
- H4 time frame, 1st support at 99.241
EUR/USD:
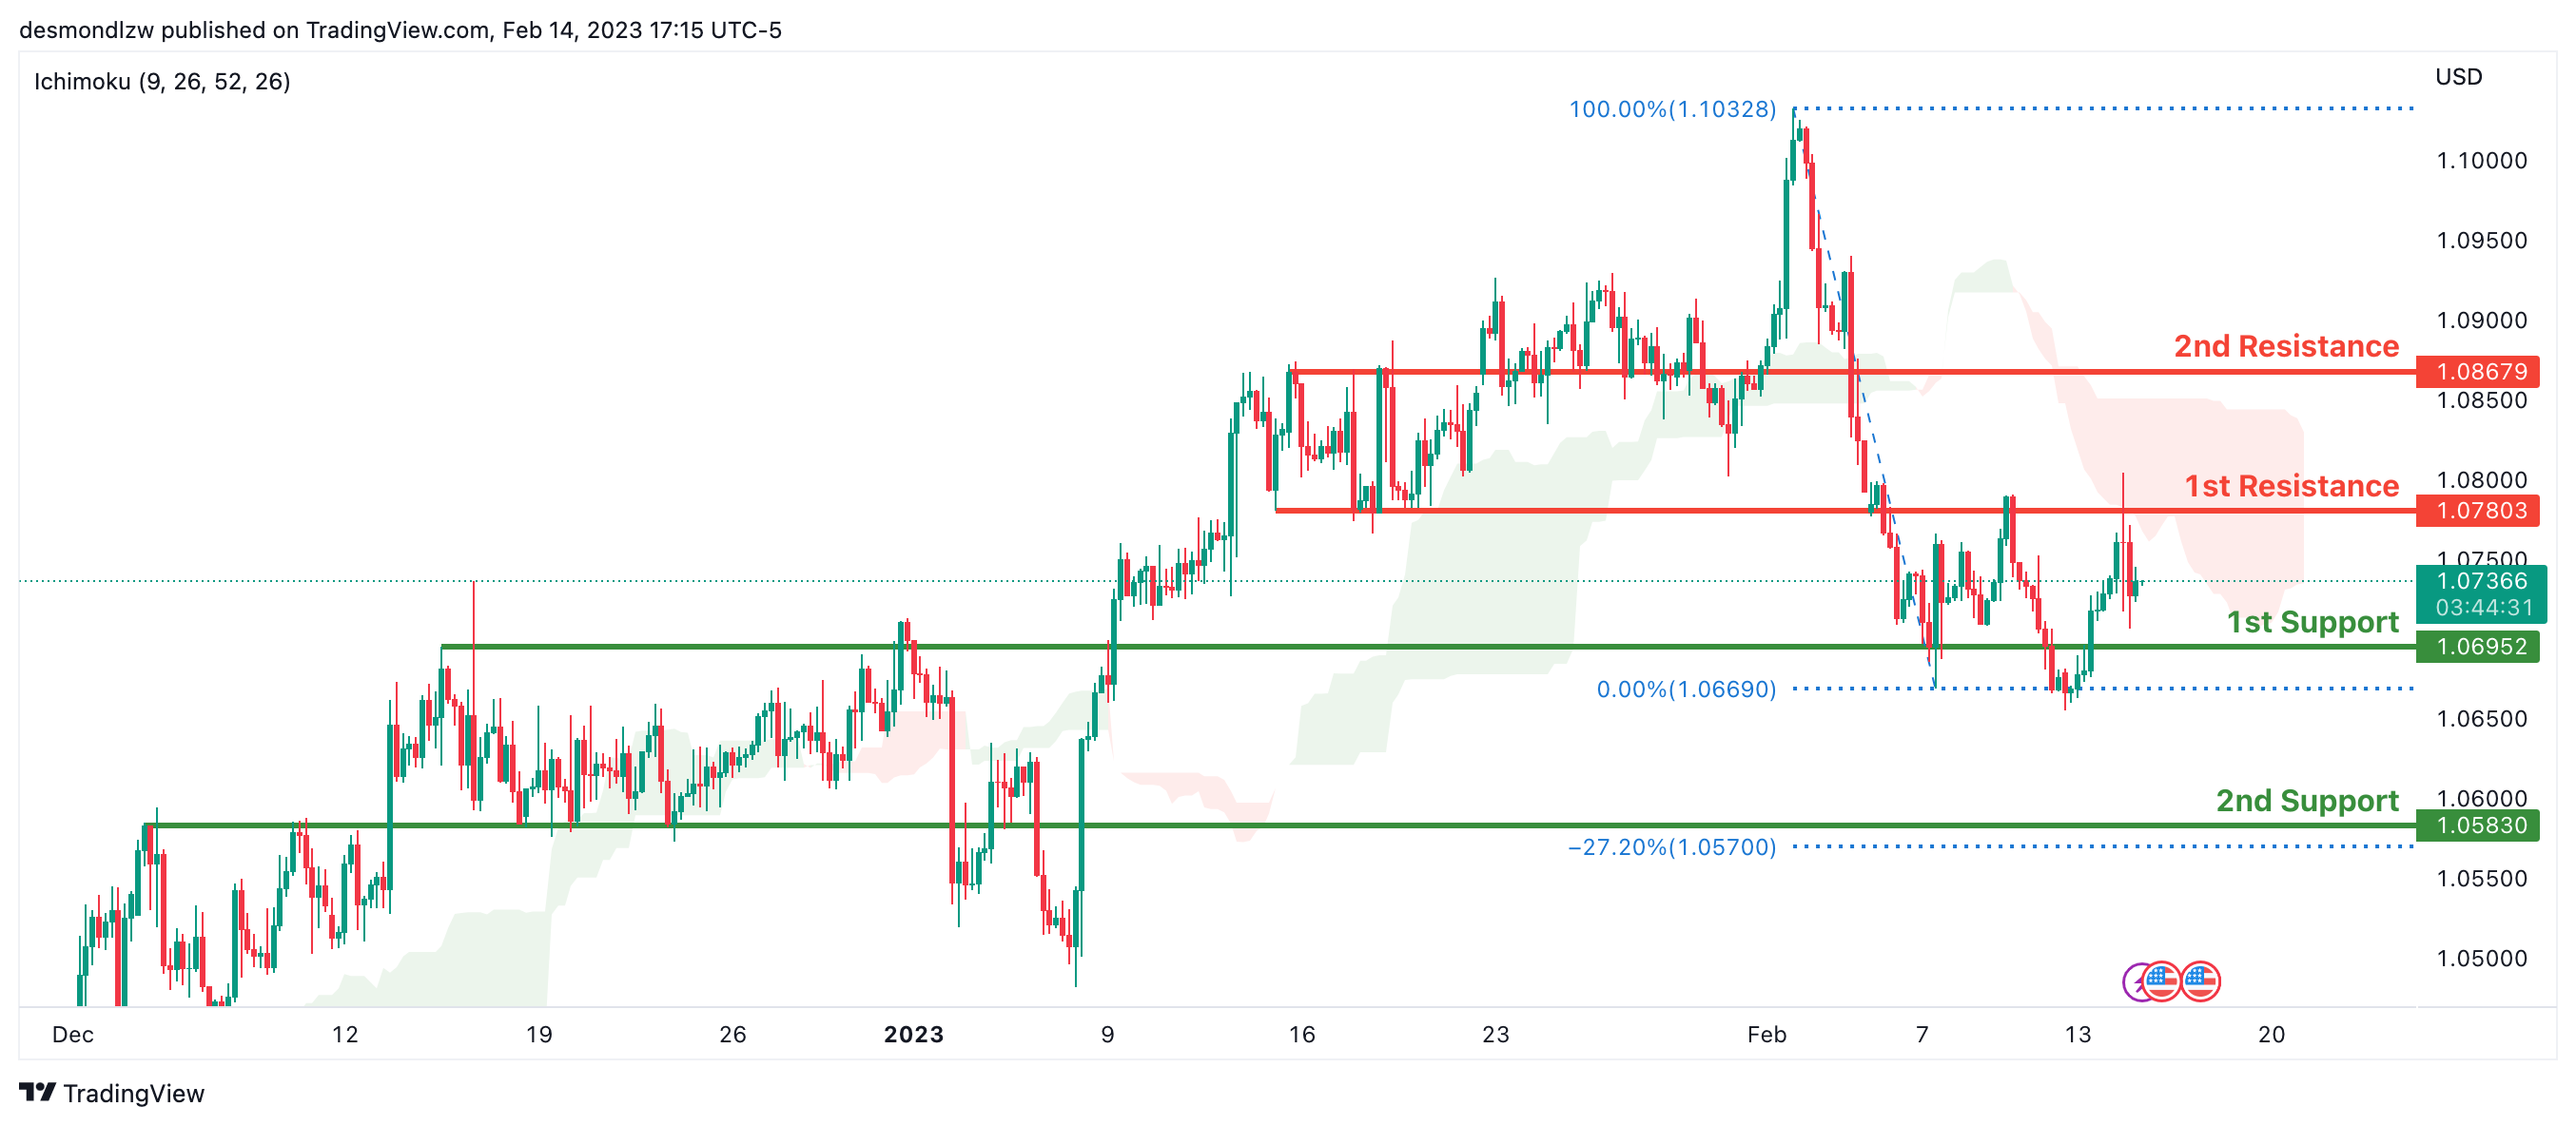
Looking at the H4 chart, my overall bias for EURUSD is bearish due to the current price crossing below the Ichimoku cloud, indicating a bearish market structure. If this bearish momentum continues, expect the price to possibly continue heading towards the 1st support at 1.06952, where the overlap support is. In an alternate scenario, price could possibly head back up to retest the 1st resistance at 1.07803, where the overlap resistance is.
Areas of consideration :
- H4 1st resistance at 1.07803
- H4 1st support at 1.06952
GBP/USD:
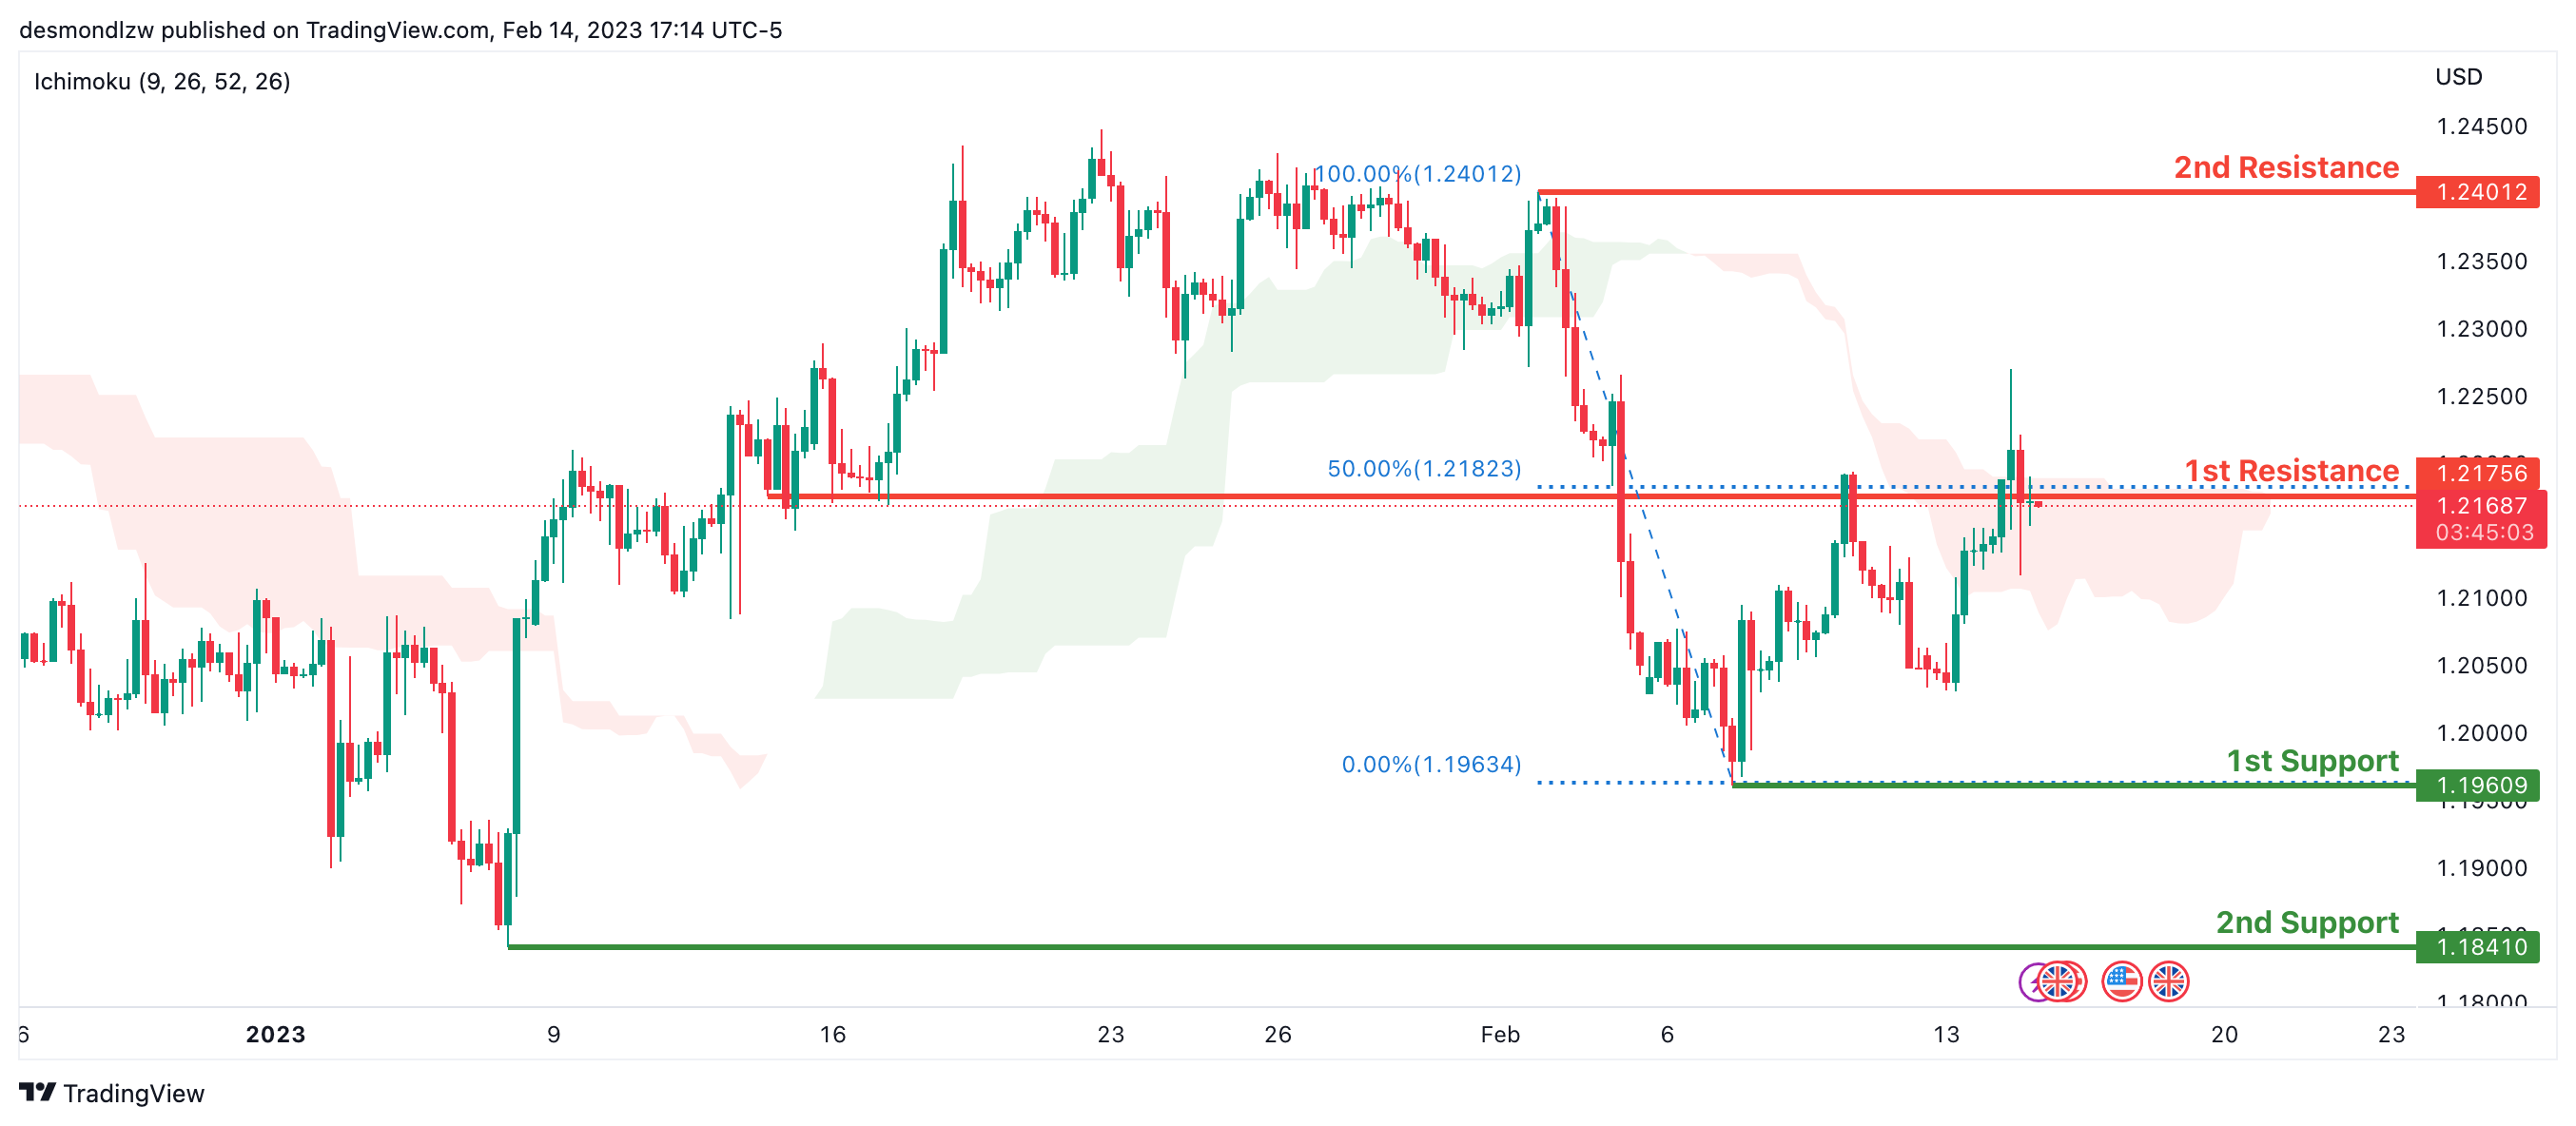
Looking at the H4 chart, my overall bias for GBPUSD is bearish due to the current price crossing below the Ichimoku cloud, indicating a bearish market. If this bearish momentum continues, expect the price to possibly continue to head towards the 1st support at 1.19609, where the recent swing low is. In an alternate scenario, price could head back up to retest the 1st resistance line at 1.21756 where the overlap resistance and 50% Fibonacci line is.
Areas of consideration:
- H4 1st resistance at 1.21756
- H4 1st support at 1.19609
USD/CHF:
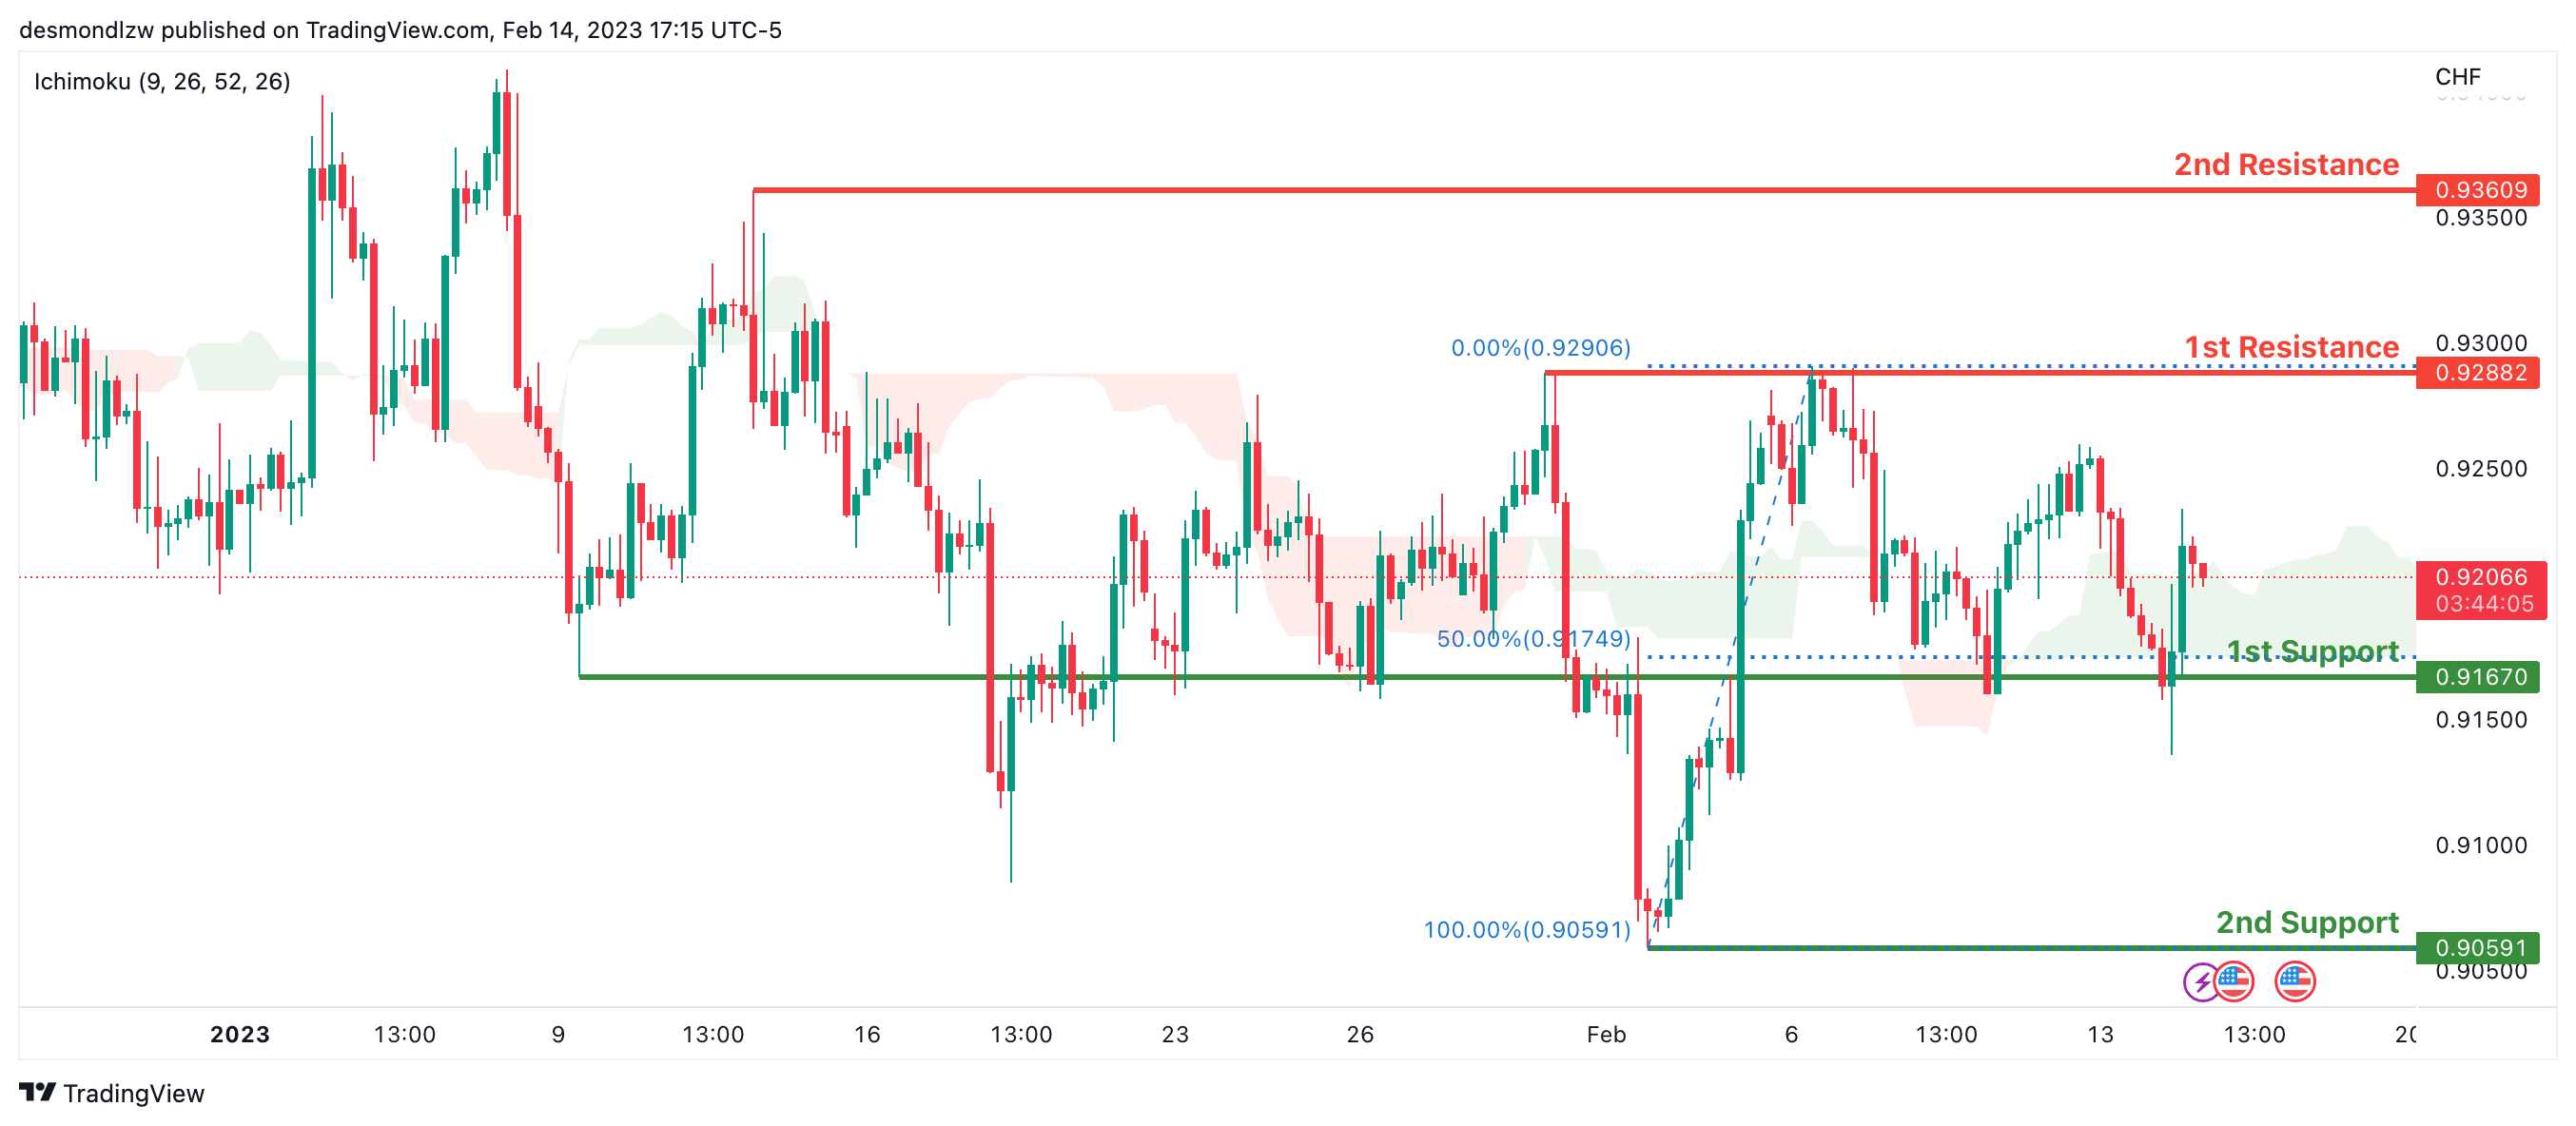
Looking at the H4 chart, my overall bias for USDCHF is bullish due to the current price being above the Ichimoku cloud, indicating a bullish market. If the current bullish trend continues, expect the price to possibly break the 1st resistance at 0.92882, where the previous swing high is, before heading towards the 2nd resistance at 0.93609 where the intermediate high is. In an alternative scenario, price could possibly head back down to retest the 1st support at 0.90591, where the recent swing low and 50% Fibonacci line is.
Areas of consideration
- H4 1st support at 0.90591
- H4 1st resistance at 0.92882
- H4 2nd resistance at 0.93609
XAU/USD (GOLD):
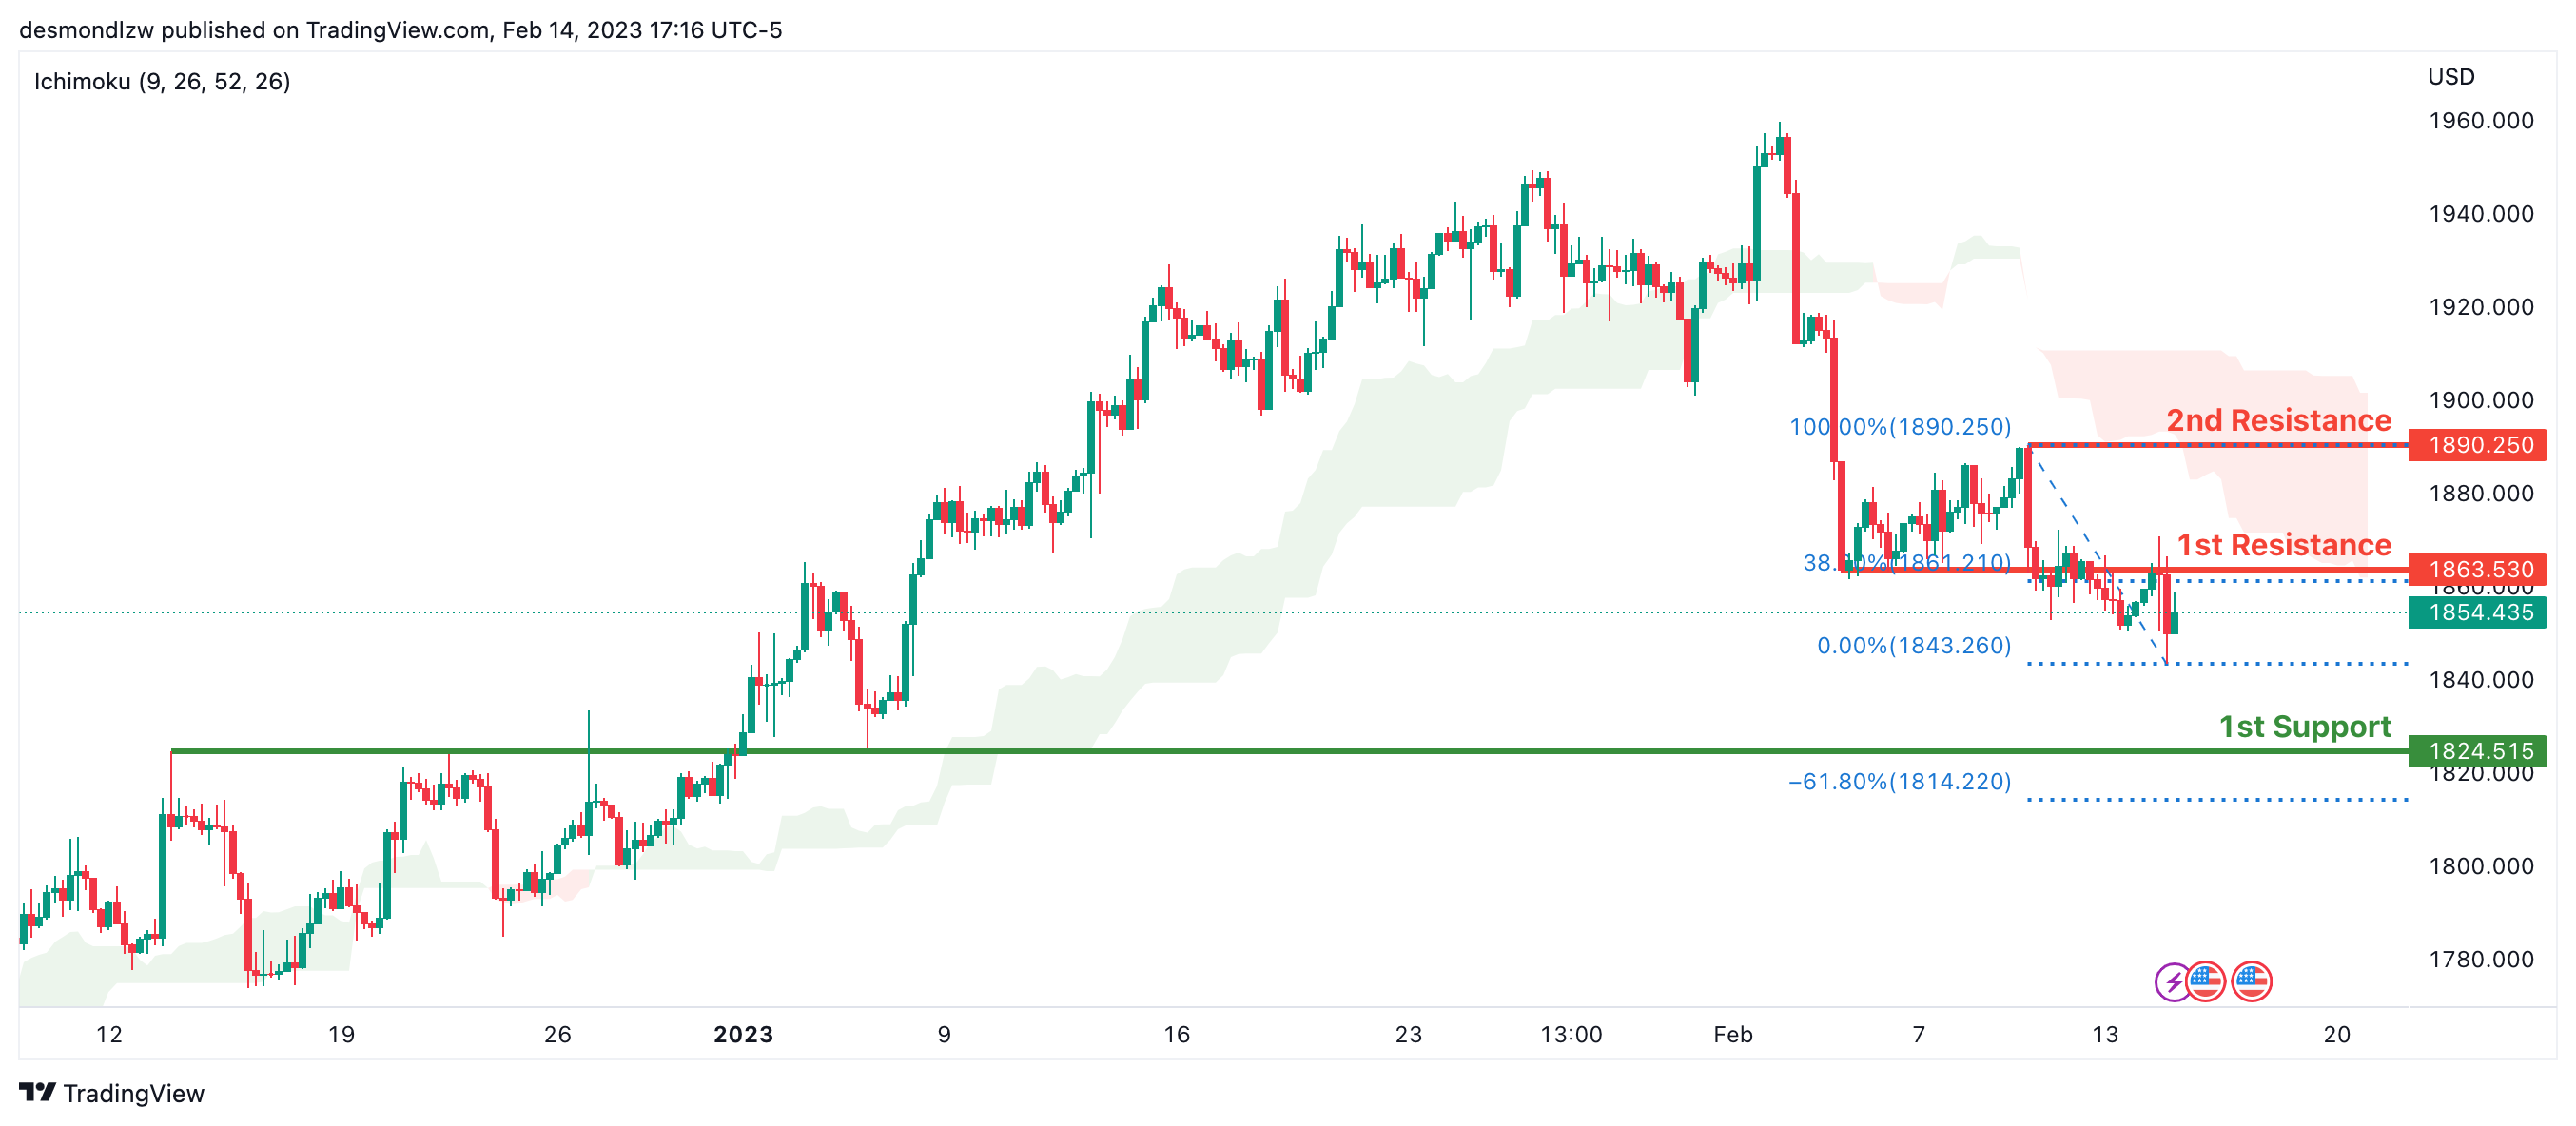
Looking at the H4 chart, my overall bias for XAUUSD is bearish due to the current price being below the Ichimoku cloud, indicating a bearish market. If this bearish momentum continues, expect the price to possibly continue heading towards the 1st support at 1824.515 where the overlap support and -61.8% Fibonacci expansion line is. In an alternative scenario, price could possibly head back up to retest the 1st resistance at 1863.530, where the previous swing low and 38.2% Fibonacci line is.
Areas of consideration:
- H4 time frame, 1st resistance at 1863.530
- H4 time frame, 1st support at 1824.515
AUD/USD:
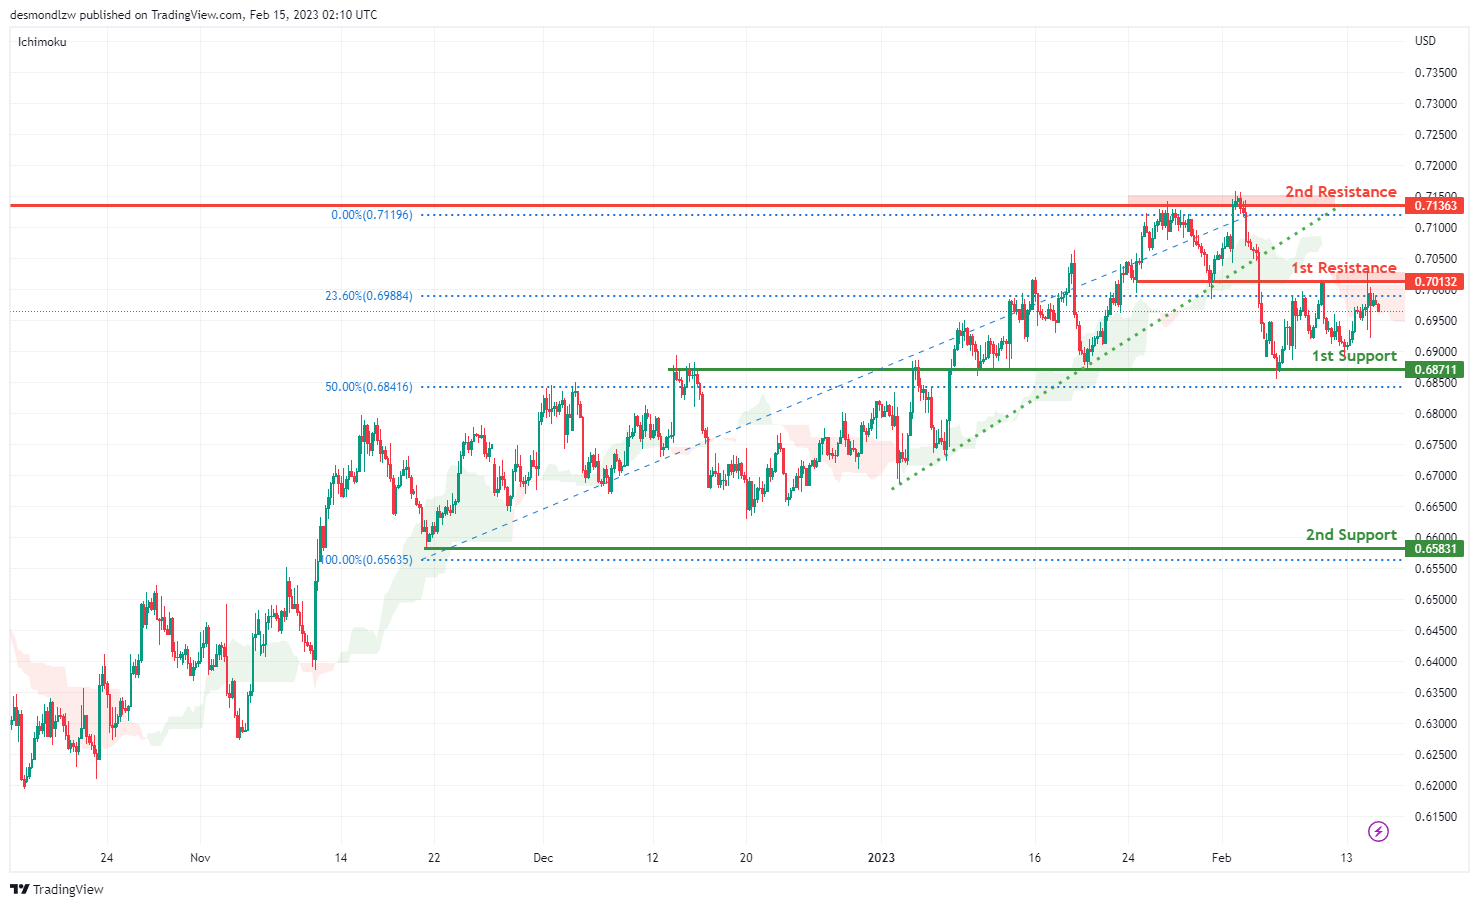
Looking at the H4 chart, my overall bias for AUDUSD is bearish due to the current price being below the Ichimoku cloud, and the ascending trend line has been broken, indicating a change of market structure.
The 1st support is at 0.68711 which is the overlap support and in line with the 50% Fibonacci retracement. The 2nd support is at 0.65831 which is the recent swing low.
In an alternate scenario, the price could possibly go back up towards the 1st resistance level at 0.70132 which is the recent swing high and in line with the 23.6% Fibonacci retracement. There is 2nd resistance at 0.71363 which is the previous swing high.
Areas of consideration
- H4. 2nd resistance at 0.71363
- H4. 1st resistance at 0.70132
- H4, 1st support at 0.68711
- H4, 2nd support at 0.65831
NZD/USD:
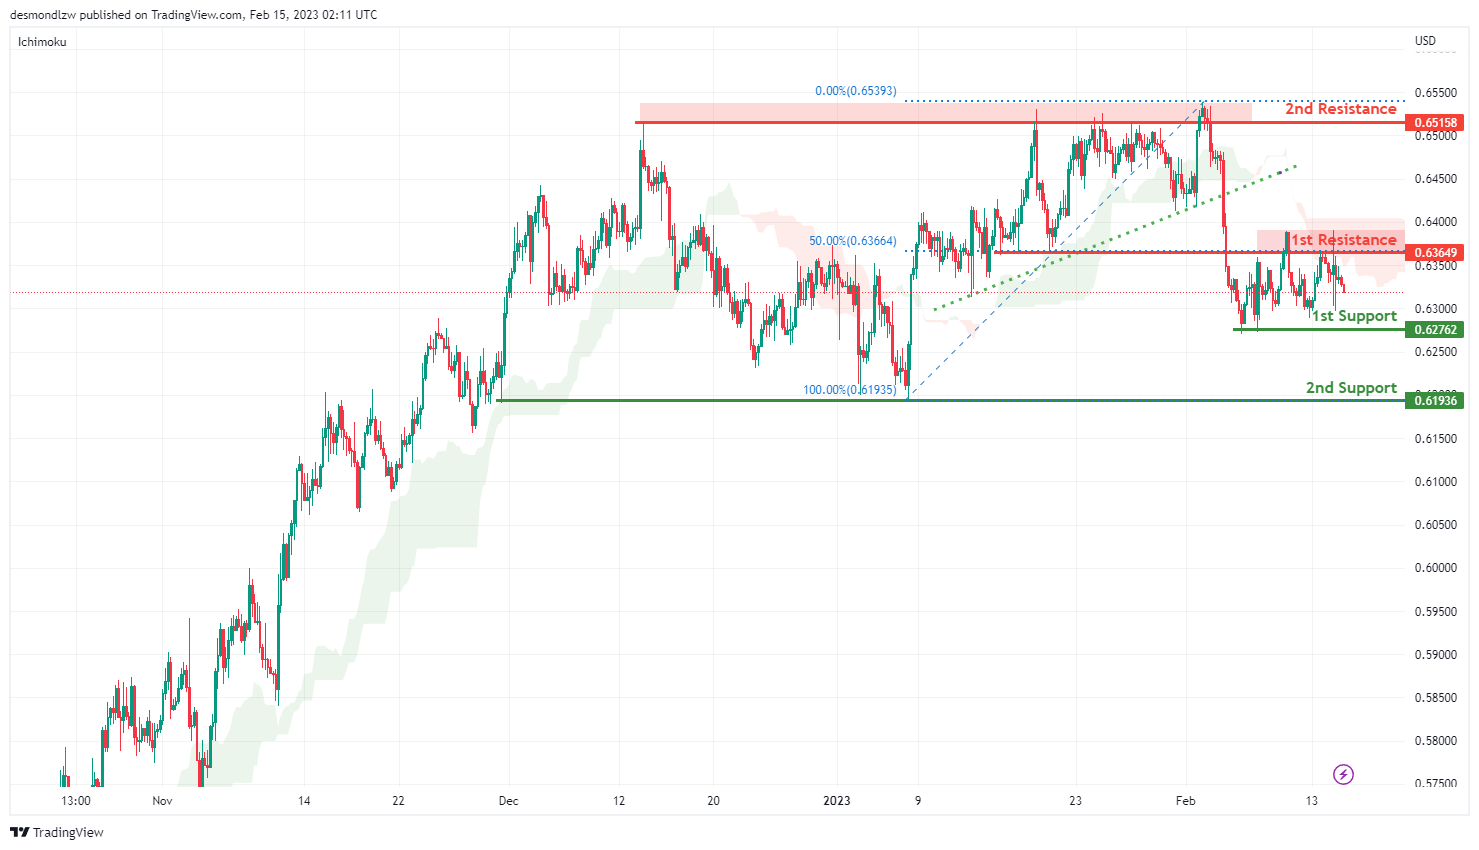
Looking at the H4 chart, my overall bias for NZDUSD is bearish, as the current price is below the Ichimoku Cloud, and the ascending trend line has been broken, indicating a change of market structure. Expecting the price to go down towards the 1st support at 0.62762 which is the recent overlap swing low. It is also inline with 23.6% Fibonacci retracement. The 2nd support is at 0.61936.
In an alternate scenario, price could possibly go up towards the 1st resistance level at 0.63649 which is the recent overlap swing high andin line with 50% Fibonacci retracement. . There is a 2nd resistance at 0.65158.
Areas of consideration:
- H4 time frame, 2nd resistance at 0.65158
- H4 time frame, 1st resistance at 0.63649
- H4 time frame, 1st support at 0.62762
- H4 time frame, 2nd support at 0.61936
USD/CAD:
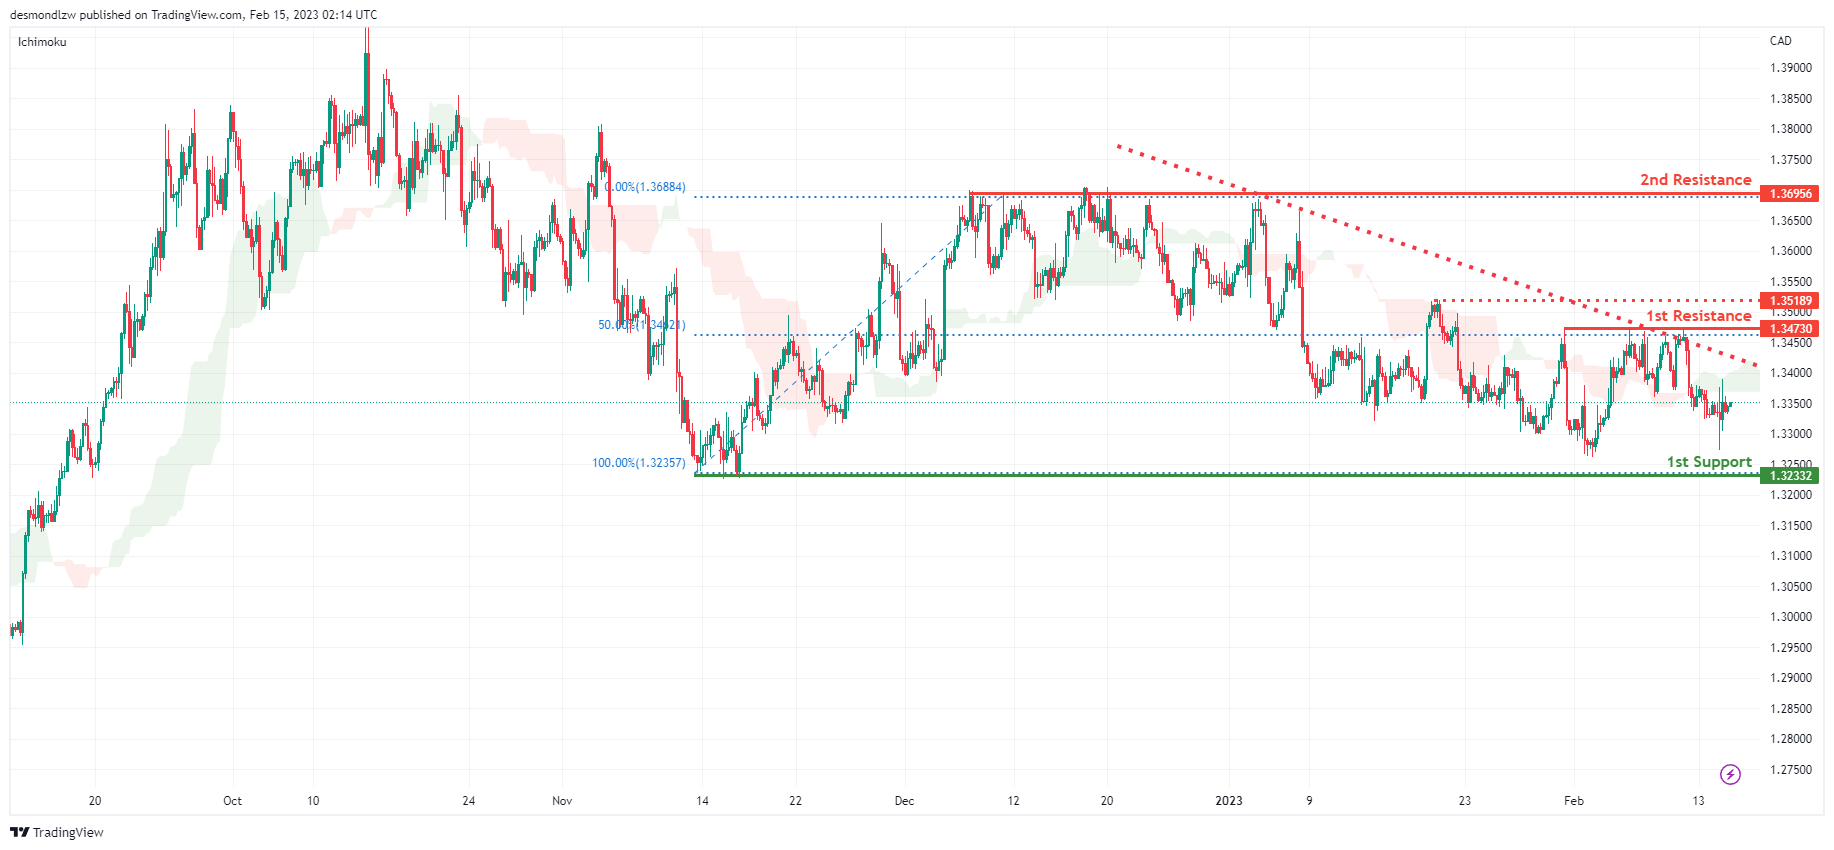
Looking at the H4 chart, my overall bias for USDCAD is bearish , as there is a descending trend line. Expecting the current price is head down towards the 1st support at 1.32332 which is the recent swing low and in line with 61.8% Fibonacci retracement.
In an alternative scenario, the price could possibly head up to the 1st resistance at 1.34730 which is the recent swing high and also in line with the 50% Fibonacci retracement. The 2nd resistance is at 1.36933 which is the previous swing high.
Areas of consideration:
- H4 time frame, 2nd resistance at 1.36933
- H4 time frame, 1st resistance at 1.34730
- H4 time frame, 1st support at 1.32332
OIL:
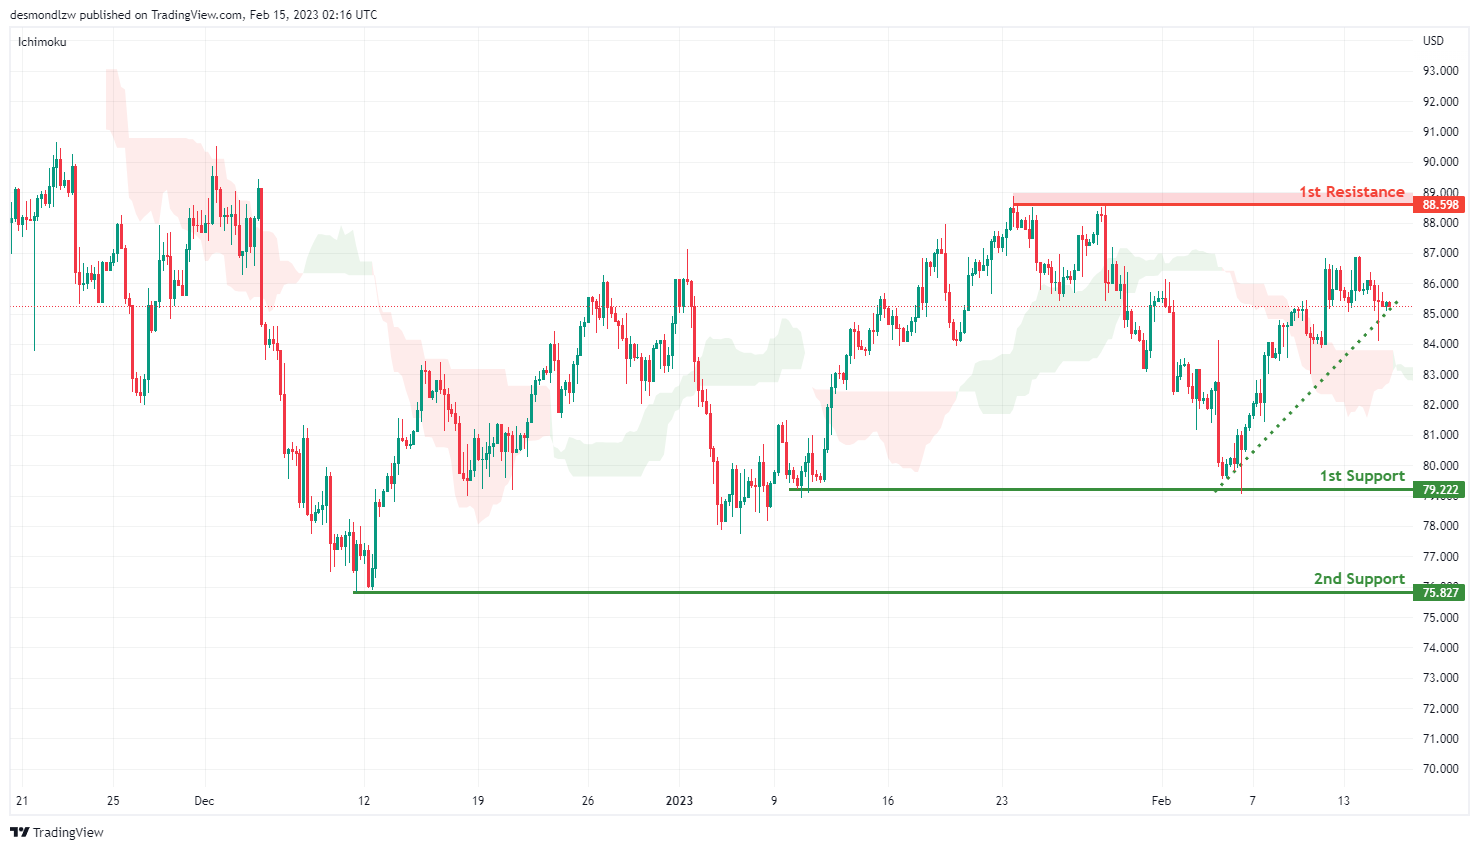
Looking at the H4 chart, my overall bias for BOC is bullish.as the there is an ascending trend line, Expecting the price head up towards the 1st resistance level at 88.598 which is the recent swing high.
In an alternate scenario, the price could possibly head down towards the 1st support level at 79.222 which is the recent overlap swing low, before the price drops to the 2nd support at 75.827.
Areas of consideration:
- H4 time frame, 1st resistance at 88.598
- H4 time frame,1st support at 79.587
- H4 time frame, 2nd support at 75.827
Dow Jones Industrial Average:
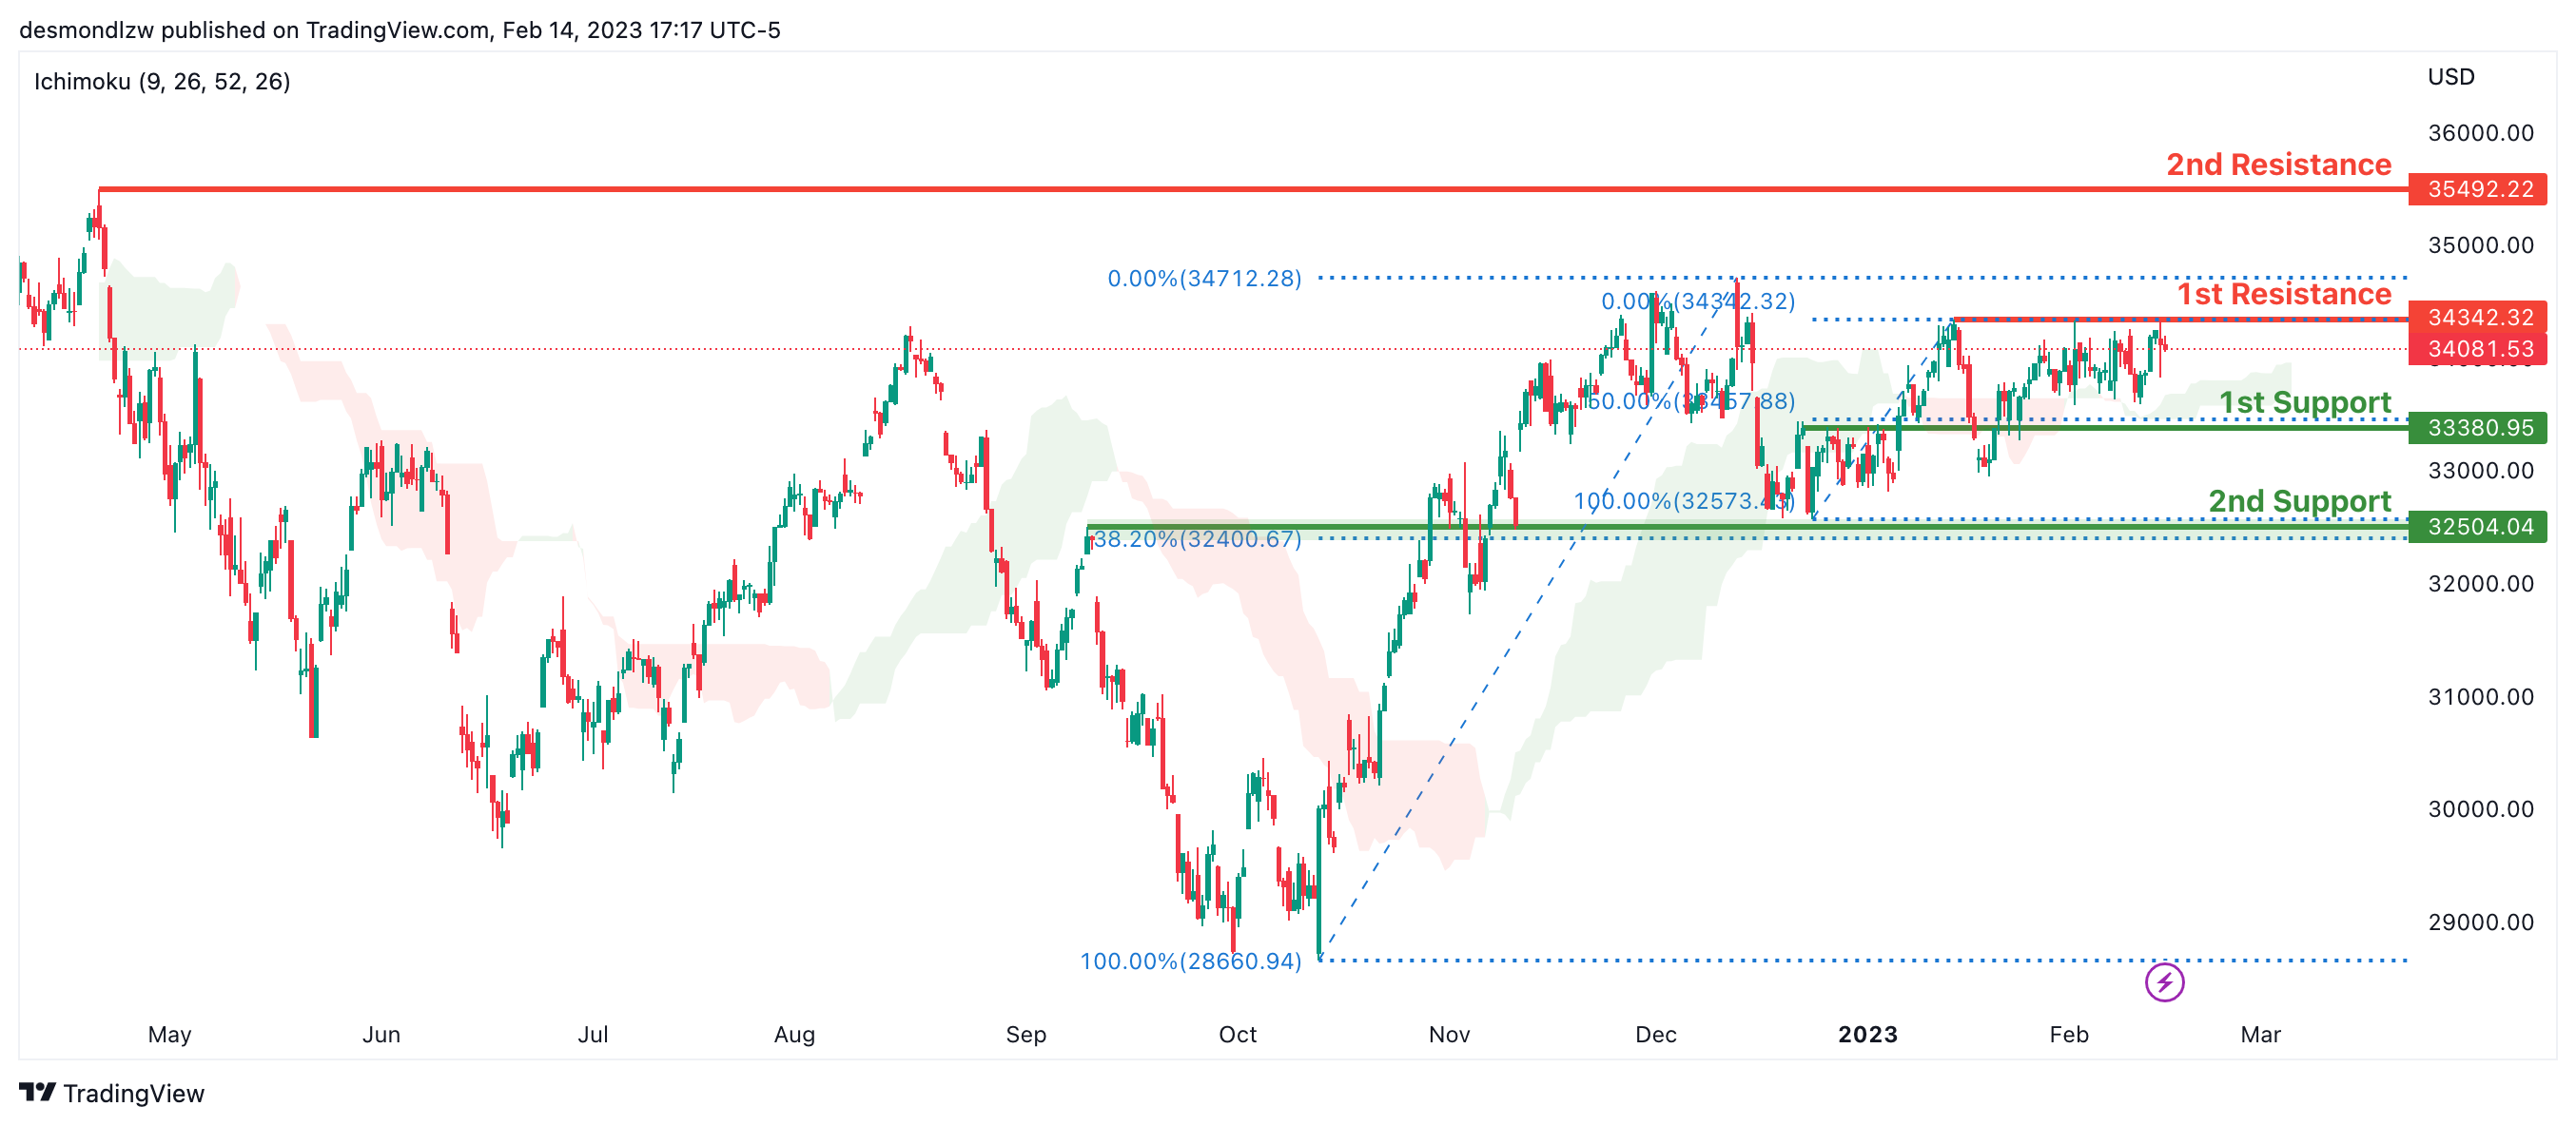
On the H4 chart, the overall bias for DJI is bullish. To add confluence to this, the price is crossing above the Ichimoku cloud which indicates a bullish market. If this bullish momentum continues, expect the price to possibly continue heading towards the 1st resistance line at 34342.32, where the recent swing high is. In an alternative scenario, price could possibly head back down towards the 1st support at 33380.95, where the 50% Fibonacci line is.
Areas of consideration:
- H4 time frame, 1st support at 33380.95
- H4 time frame, 1st Resistance at 34342.32
DAX:
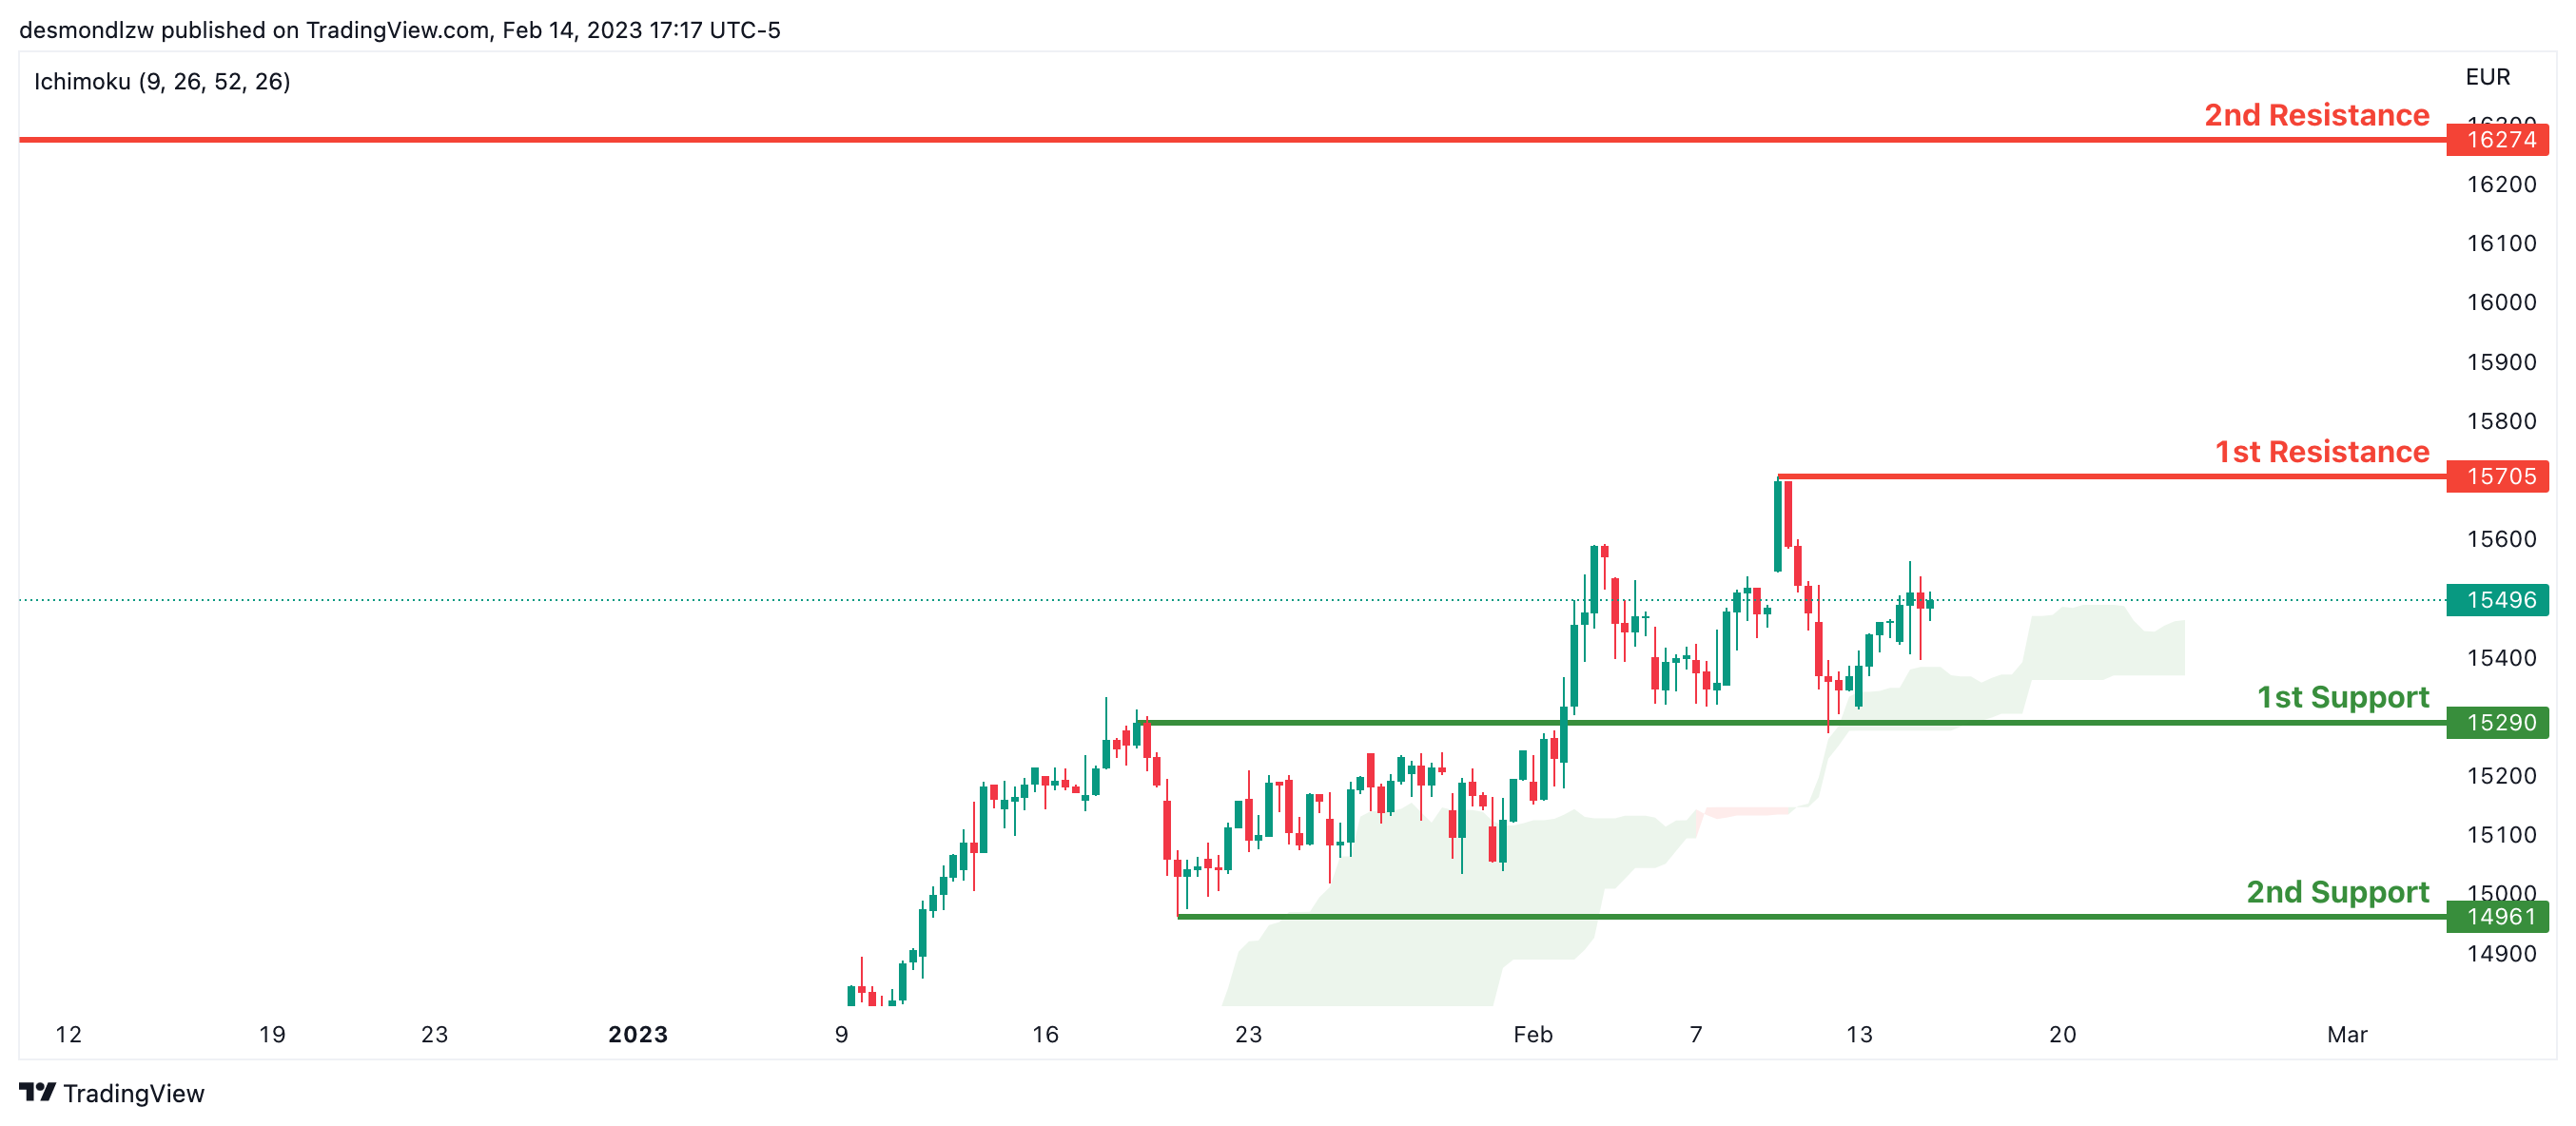
Looking at the H4 chart, my overall bias for DAX is bullish due to the current price crossing above the Ichimoku cloud, indicating a bullish market. If this bullish momentum continues, expect the price to possibly head towards the 1st resistance line at 15705, where the recent high is. In an alternative scenario, price could possibly head down to retest the 1st support at 15290, where the overlap support is.
Areas of consideration:
- H4 time frame, 1st resistance is at 15705
- H4 time frame, 1st support is at 15290
ETHUSD:
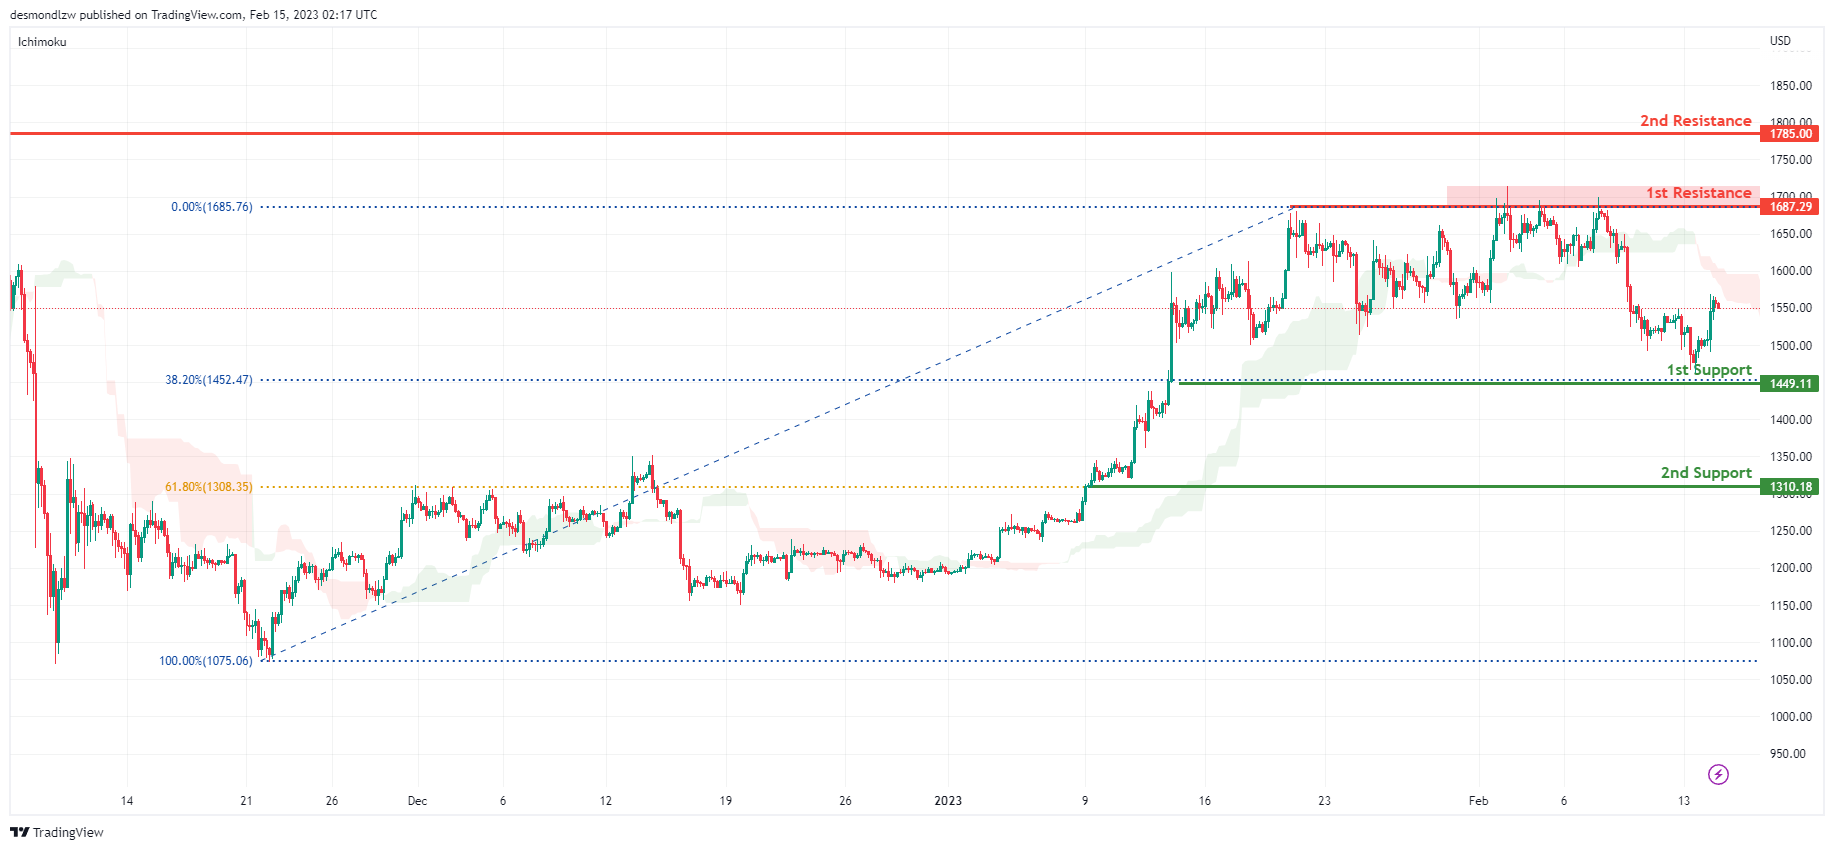
Looking at the H4 chart, my overall bias for ETHUSD is bearish, the strong ascending trend line has been broken. Expecting the price to go down to break the 1st support line at 1449.11 which is in line with 38.2% Fibonacci retracement, before it heads towards the 2nd support at 1310.18 which is in line with 61.8% Fibonacci retracement.
In an alternate scenario, the price may go up and break the 1st resistance line at 1685.76 before breaking the 2nd resistance line at 1785.00 which is the previous swing high.
Areas of consideration:
- H4 time frame, 2nd resistance of 1785.00
- H4 time frame, 1st resistance of 1685.76
- H4 time frame, 1st support at 1449.11
- H4 time frame, 2nd support at 1310.18
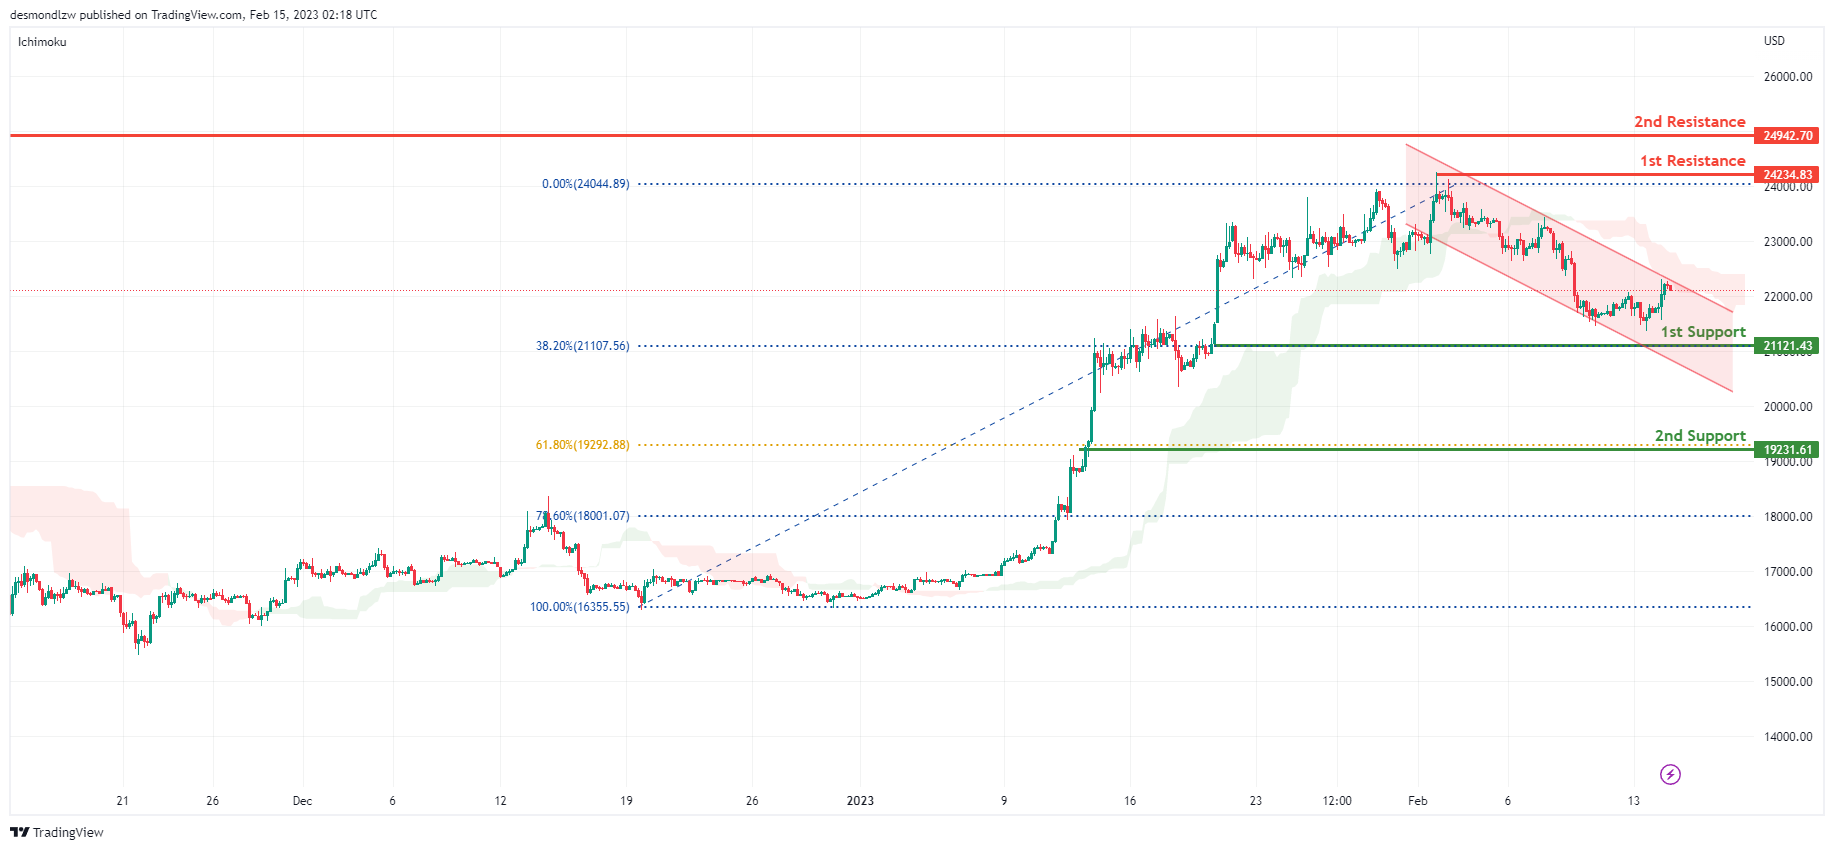
BTCUSD:
Looking at the H4 chart, my overall bias for BTCUSD is bearish. An ascending channel has broken, a descending channel was created, expecting the price to break the 1st support line at 21121.43 which is in line with 38.2% Fibonacci retracement, before heading down towards the 2nd support at 19231.61 which is in line with 61.8% Fibonacci retracement.
In an alternative scenario, the price could possibly head up to the 1st resistance at 24234.83 which is the recent swing high.
Areas of consideration:
- H4 time frame, 2nd resistance 24942.70
- H4 time frame, 1st resistance 24234.83
- H4 time frame, 1st support at 21121.43
- H4 time frame, 2nd support at 19231.61
S&P 500:
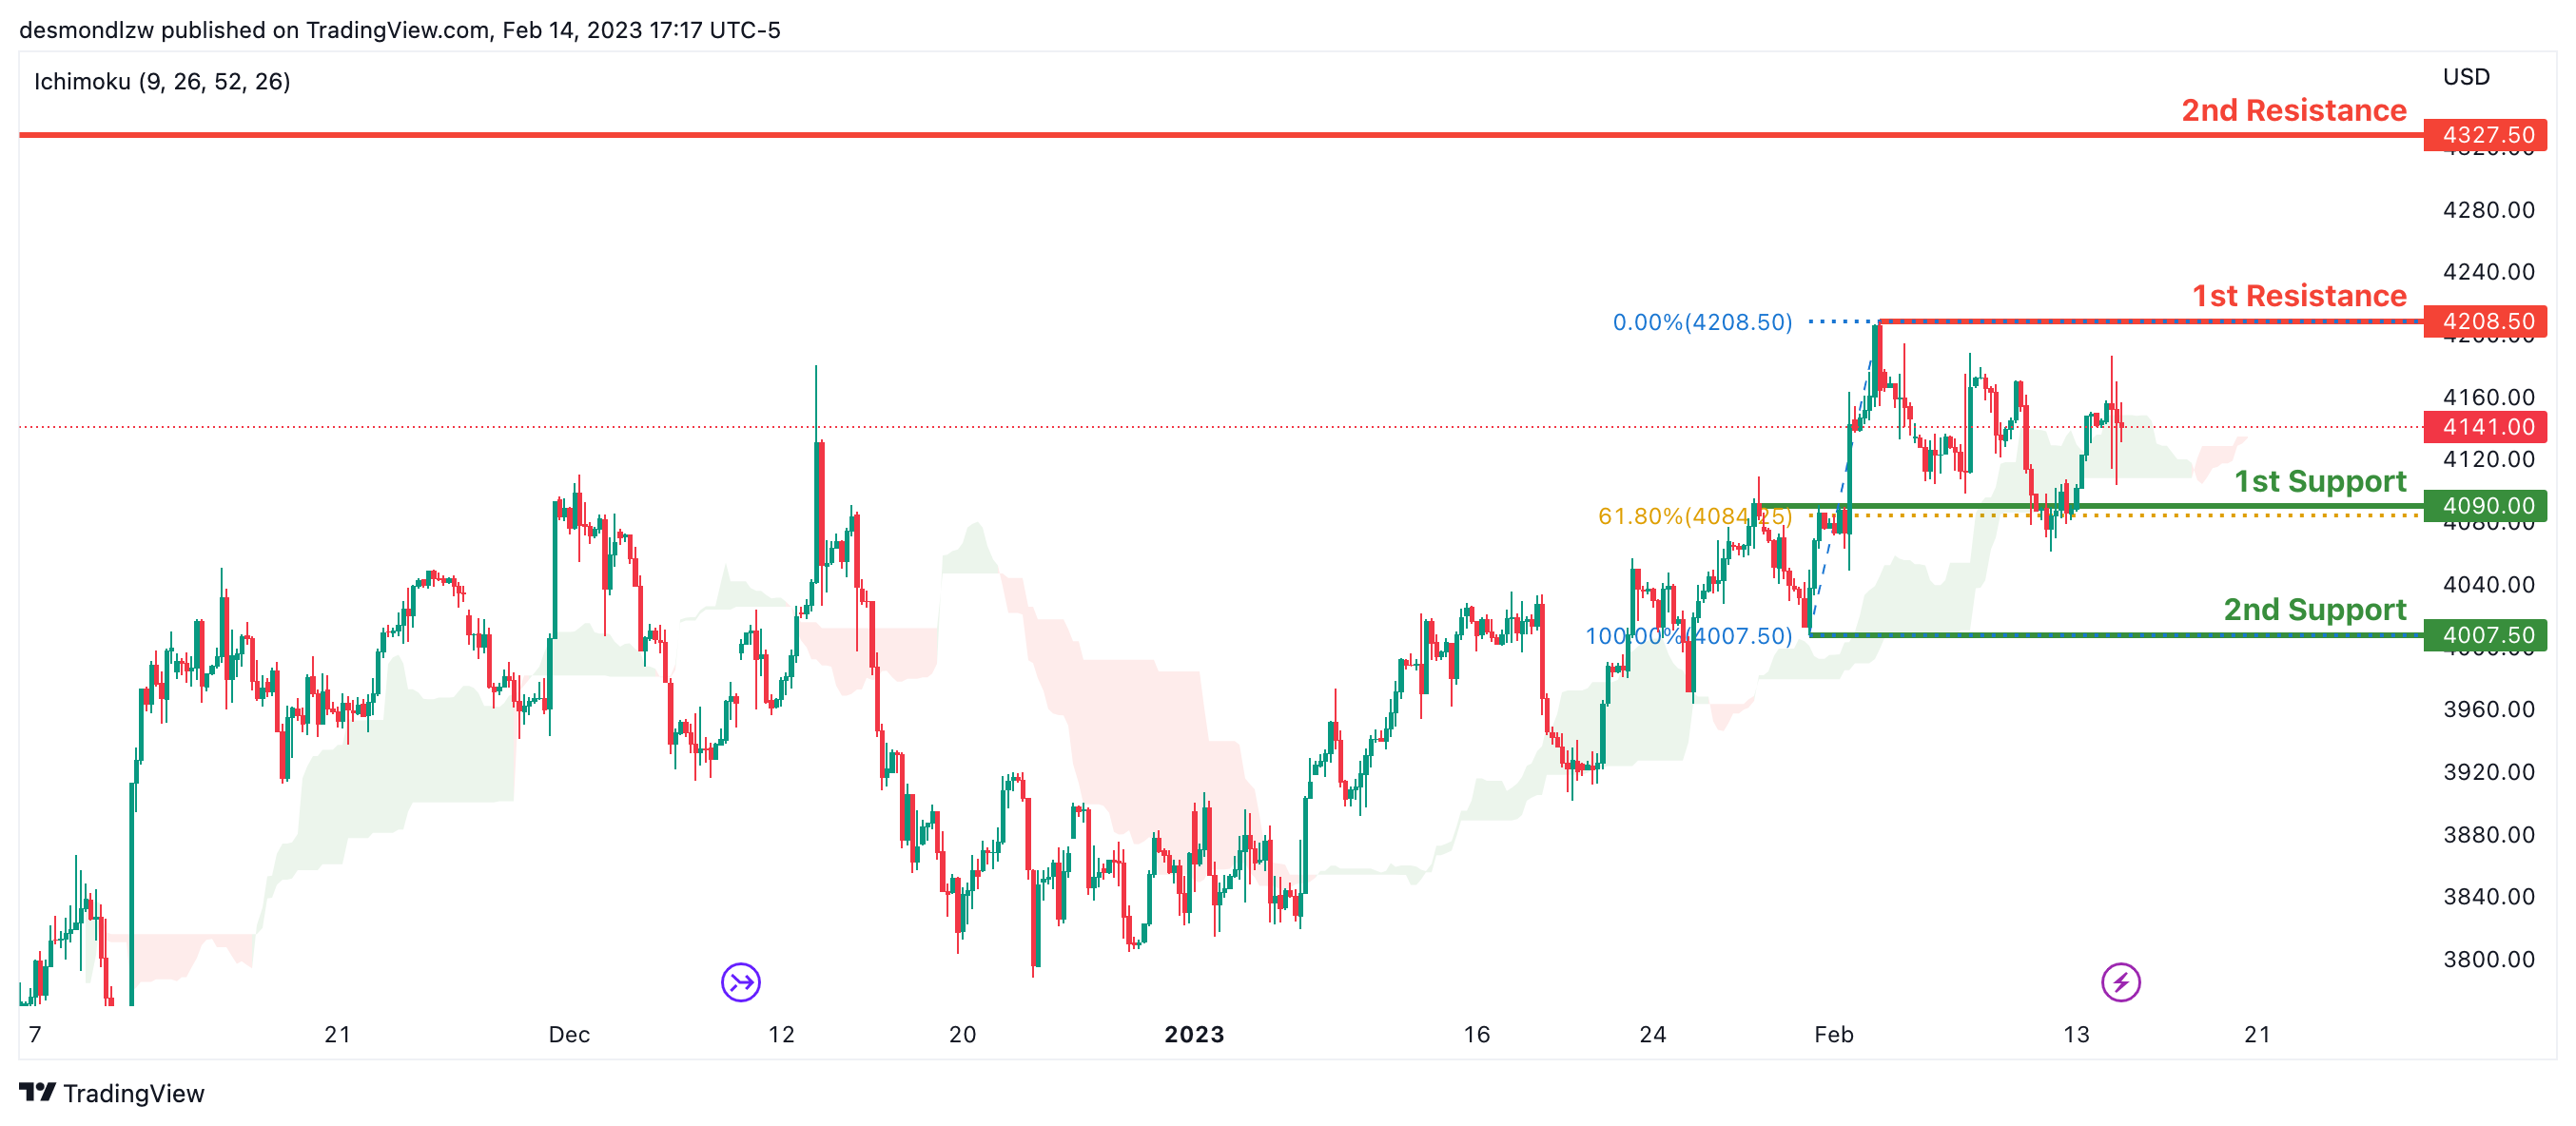
Looking at the H4 chart, my overall bias for S&P500 is bullish due to the current price being above the Ichimoku cloud, indicating a bullish market. If this bullish momentum continues, expect the price to possibly break the 1st resistance at 4208.50, where the recent swing high is., before heading towards the 2nd resistance at 4327.50 where the previous swing high is, In an alternative scenario, price could possibly head back down to retest the 1st support at 4090.00, where the 50% Fibonacci line is.
Areas of consideration:
- H4 time frame, 1st support at 4090.00
- H4 time frame, 1st resistance at 4208.50
- H4 time frame, 2nd resistance at 4327.50
RBA Lowe: I don’t think we’re at the peak of interest rate yet
RBA Governor Philip Lowe said in a Senate hearing, "I don't think we're at the peak (on interest rate) yet, but how far we have to go up I don't know." He noted that inflation, which is currently sitting at 7.8%, was still "wage too high". Unemployment would need to rise before there were any major changes to inflation.
"I understand why some people focus on the risks on the one side, but we've got to be attentive to the risk from higher inflation," Lowe warned. "It's corrosive for the economy. And all the evidence is if inflation stays high for too long, expectations adjust and that leads to higher interest rates and more unemployment.."
"The risks are two sided, and we're trying to navigate our way through a narrow path."
Fed Williams: We need all the gears turning at the right pace
New York Fed President John Williams said yesterday, "We will we stay the course until our job is done... We must restore balance to the economy and bring inflation down to 2 percent on a sustained basis."
"We need all the gears turning at the right pace to restore balance between demand and supply in the entire economy," said Williams. "We still have some way to go to achieve that goal."
He expects core inflation, as measured by core PCE reading at 4.4% in December, to fall to 3% this year and then 2% over the next few years. Growth will likely slow to just 1% this year, with unemployment rate to rise to between 4% and 5%.
Fed Harker: It’s going to be above 5%
Philadelphia Fed President Patrick Harker commented on yesterday's inflation report and said "it was good and it was moving down, but not quickly." He added that FOMC will have to "let the data dictate" tightening, and, "It's going to be above 5% in the Fed funds rate. How much above 5? It's going to depend a lot on what we're seeing."
"In my view, we are not done yet… but we are likely close," he said. "At some point this year, I expect that the policy rate will be restrictive enough that we will hold rates in place and let monetary policy do its work," he noted in a prepared speech".
"Rates are now at a level that allow us to slow down and proceed cautiously and, to my mind, the days of us raising 75 basis points at a time have surely passed," Harker said. "Just at the last meeting, I voted for a hike of 25 basis points — what some would call slow but actually is closer to cruising speed when it comes to tightening."