Sample Category Title
USD/CAD Daily Outlook
Daily Pivots: (S1) 1.3338; (P) 1.3389; (R1) 1.3445; More....
Intraday bias in USD/CAD remains neutral and outlook is unchanged. The choppy decline from 1.3704 might still extend lower, but strong support is expected to 1.3224 key support to bring rebound. On the upside, above 1.3474 resistance will confirm short term bottoming, and turn intraday bias back to the upside for retesting 1.3704 resistance. However, decisive break of 1.3224 would carry larger bearish implication.
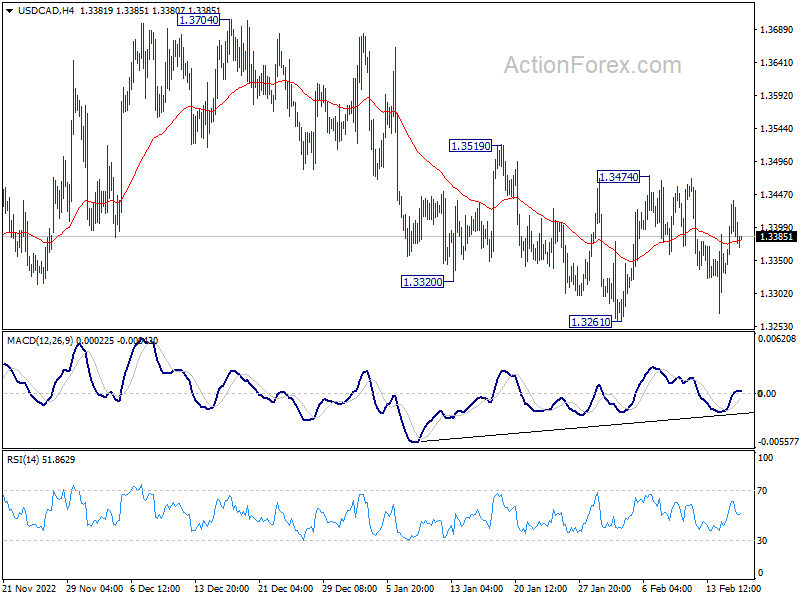
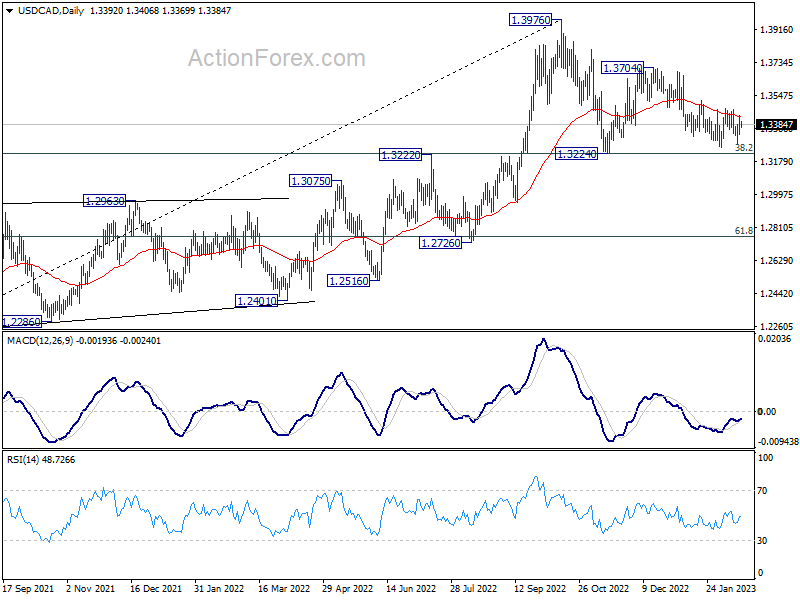
In the bigger picture, as long as 1.3222 cluster support (38.2% retracement of 1.2005 to 1.3976 at 1.3223) holds, larger up trend from 1.2005 (2021 low) is still expected to resume through 1.3976 high at a later stage. However, firm break of 1.3222/3 will indicate that the trend might have reversed. Deeper fall would be seen to next cluster support at 1.2726 (61.8% retracement at 1.2758).
AUD/USD Daily Report
Daily Pivots: (S1) 0.6849; (P) 0.6920; (R1) 0.6974; More...
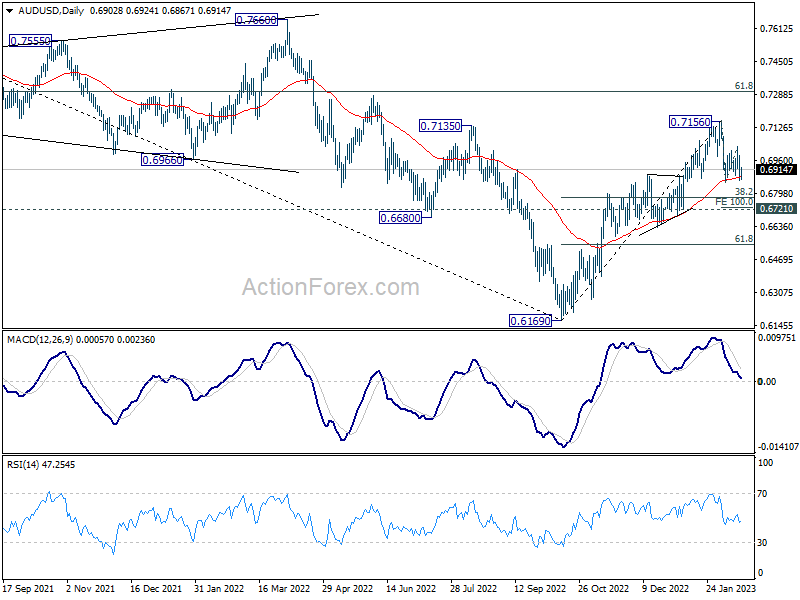
AUD/USD recovered ahead of 0.6854 support despite yesterday's dip. Intraday bias remains neutral for the moment. On the downside, break of 0.6854 will resume the corrective fall from 0.7156 to 100% projection of 0.6854 to 0.7028 from 0.6854 at 0.6736, which is close to 0.6721 key structural support. Strong support is expected there to bring rebound. On the upside, break of 0.7028 will turn bias back to the upside for retesting 0.7156 high.
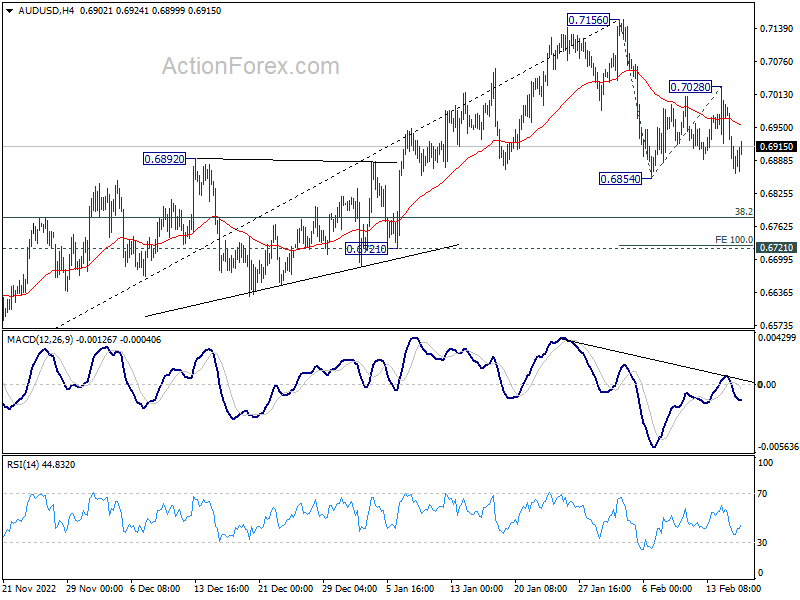
In the bigger picture, corrective decline from 0.8006 (2021 high) should have completed with three waves down to 0.6169 (2022 low). Further rally should be seen to 61.8% retracement of 0.8006 to 0.6169 at 0.7304. Sustained break there will pave the way to retest 0.8006. This will now remain the favored case as long as 0.6721 support holds.
Dollar Failed Breakout for Now, Yen Weak, Euro Resilient
Despite another rally attempt overnight, Dollar failed to break through near term range against others except versus Yen. The Japanese currency was licking wounds in Asian session but remains the worst performer for the week, following extended rebound in US and European benchmark yields. Canadian is the next weakest followed by Sterling. On the other hand, Euro is the currently strongest one, followed by Swiss Franc and then Aussie. The greenback is mixed for now.
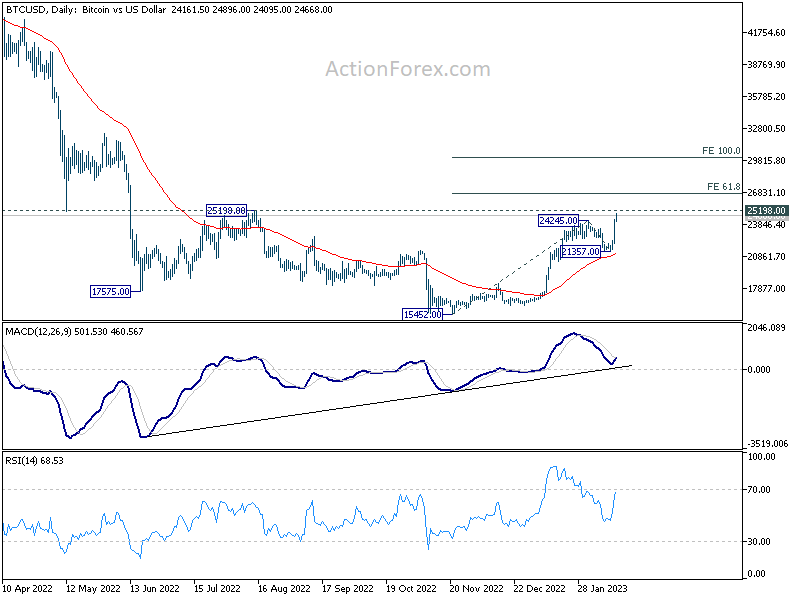
Technically, Bitcoin broke through 24245 resistance to resume the whole rebound from 15452. Notably support was seen above 55 day EMA during prior pull back, which is a bullish signal. Immediate focus is now on 25198 resistance. Firm break there will be another bullish sign and should pave the way to 61.8% projection of 15452 to 24256 from 21357 at 26791. The move could be followed by break of 12269 resistance in NASDAQ to resume the rise from 10069. Such risk-on sentiment could continue to cap Dollar's rally.
In Asia, at the time of writing, Nikkei is up 0.77%. Hong Kong HSI is up 2.29%. China Shanghai SSE is up 0.84%. Singapore Strait Times is up 1.20%. Japan 10-year JGB yield is down -0.0001 at 0.506. Overnight, Dow rose 0.11%. S&P 500 rose 0.28%. NASDAQ rose 0.92%. 10-year yield rose 0.048 to 3.809.
ECB Lagarde: We intend to hike by 50bps in March
In a speech to the European Parliament, ECB President Christine Lagarde reiterated that "we intend to raise interest rates by another 50 basis points at our next meeting in March", and the "evaluate the subsequent path". Future policy decisions will continue to be "data-dependent" and follow a "meeting-by-meeting approach".
While headline inflation moderated to 8.5% as shown in January flash estimate, "price pressures remain strong and underlying inflation is still high" with core inflation at 5.2%. "Even though most measures of longer-term inflation expectations currently stand at around 2%, these measures warrant continued monitoring."
Risks to growth outlook are "now more balanced" than they were in December. Russia's war against Ukraine continues to be a "significant downside risk". But "faster resolution of the energy shock would support growth". Risk to inflation outlook "have also become more balanced, especially in the near term."
Japan posts record monthly trade deficit as exports to China tumbled
Japan goods exports rose 3.5% yoy to JPY 6551B in January, better than expectation of 0.8% yoy, but much worse than prior month's 11.5% yoy. Exports to China fell -17.1% yoy on cars, car parts and chip-making equipment. Exports to the US were up 10.2% yoy. Exports to Europe ere up 9.5% yoy.
Imports rose 17.8% yoy to JPY 10048B, below expectation of 18.4% yoy and prior month's 20.7% yoy. Import growth was boosted by coal, liquefied natural gas and crude oil,
Trade deficit came in at JPY -3497B.The monthly deficit was the largest on record going back to 1979.
In seasonally adjusted term, exports dropped -6.3% mom to JPY 7788B. Imports dropped -5.1% mom to JPY 9609B. Trade deficit was largely unchanged at JPY -1821B.
Australian employment down -11.5k in Jan, unemployment rate rose to 3.7%
Australia employment contracted -11.5k or -0.1% mom in January, worse than expectation of 20k growth. Unemployment rate rose from 3.5% to 3.7%, above expectation of 3.5%. Participation rate dropped from 66.6% to 66.5%. Monthly hours worked dropped -2.1% mom.
ABS noted: Along with a larger-than-usual increase in unemployed people in January, there was also a similarly larger-than-usual rise in the number of unemployed people who had a job to go to in the future.
Bjorn Jarvis, ABS head of labour statistics said: "January is the most seasonal time of the year in the Australian labour market, with people leaving jobs but also getting ready to start new jobs or return from leave. This January, we saw more people than usual with a job indicating they were starting or returning to work later in the month."
AUD/USD Daily Report
Daily Pivots: (S1) 0.6849; (P) 0.6920; (R1) 0.6974; More...
AUD/USD recovered ahead of 0.6854 support despite yesterday's dip. Intraday bias remains neutral for the moment. On the downside, break of 0.6854 will resume the corrective fall from 0.7156 to 100% projection of 0.6854 to 0.7028 from 0.6854 at 0.6736, which is close to 0.6721 key structural support. Strong support is expected there to bring rebound. On the upside, break of 0.7028 will turn bias back to the upside for retesting 0.7156 high.
In the bigger picture, corrective decline from 0.8006 (2021 high) should have completed with three waves down to 0.6169 (2022 low). Further rally should be seen to 61.8% retracement of 0.8006 to 0.6169 at 0.7304. Sustained break there will pave the way to retest 0.8006. This will now remain the favored case as long as 0.6721 support holds.
Economic Indicators Update
| GMT | Ccy | Events | Actual | Forecast | Previous | Revised |
|---|---|---|---|---|---|---|
| 23:50 | JPY | Trade Balance (JPY) Jan | -1.82T | -2.47T | -1.72T | -1.82T |
| 23:50 | JPY | Machinery Orders M/M Dec | 1.60% | 2.70% | -8.30% | |
| 00:00 | AUD | Consumer Inflation Expectations Feb | 5.10% | 5.60% | ||
| 00:30 | AUD | Employment Change Jan | -11.5K | 20.0K | -14.6K | -20.0K |
| 00:30 | AUD | Unemployment Rate Jan | 3.70% | 3.50% | 3.50% | |
| 09:00 | EUR | ECB Economic Bulletin | ||||
| 13:30 | USD | Housing Starts Jan | 1.36M | 1.38M | ||
| 13:30 | USD | Building Permits Jan | 1.35M | 1.34M | ||
| 13:30 | USD | PPI M/M Jan | 0.40% | -0.50% | ||
| 13:30 | USD | PPI Y/Y Jan | 5.10% | 6.20% | ||
| 13:30 | USD | PPI Core M/M Jan | 0.30% | 0.10% | ||
| 13:30 | USD | PPI Core Y/Y Jan | 4.90% | 5.50% | ||
| 13:30 | USD | Initial Jobless Claims (Feb 10) | 200K | 196K | ||
| 13:30 | USD | Philadelphia Fed Manufacturing Survey Feb | -7.7 | -8.9 | ||
| 15:30 | USD | Natural Gas Storage | -97B | -217B |
Technical Outlook and Review
USD/JPY:
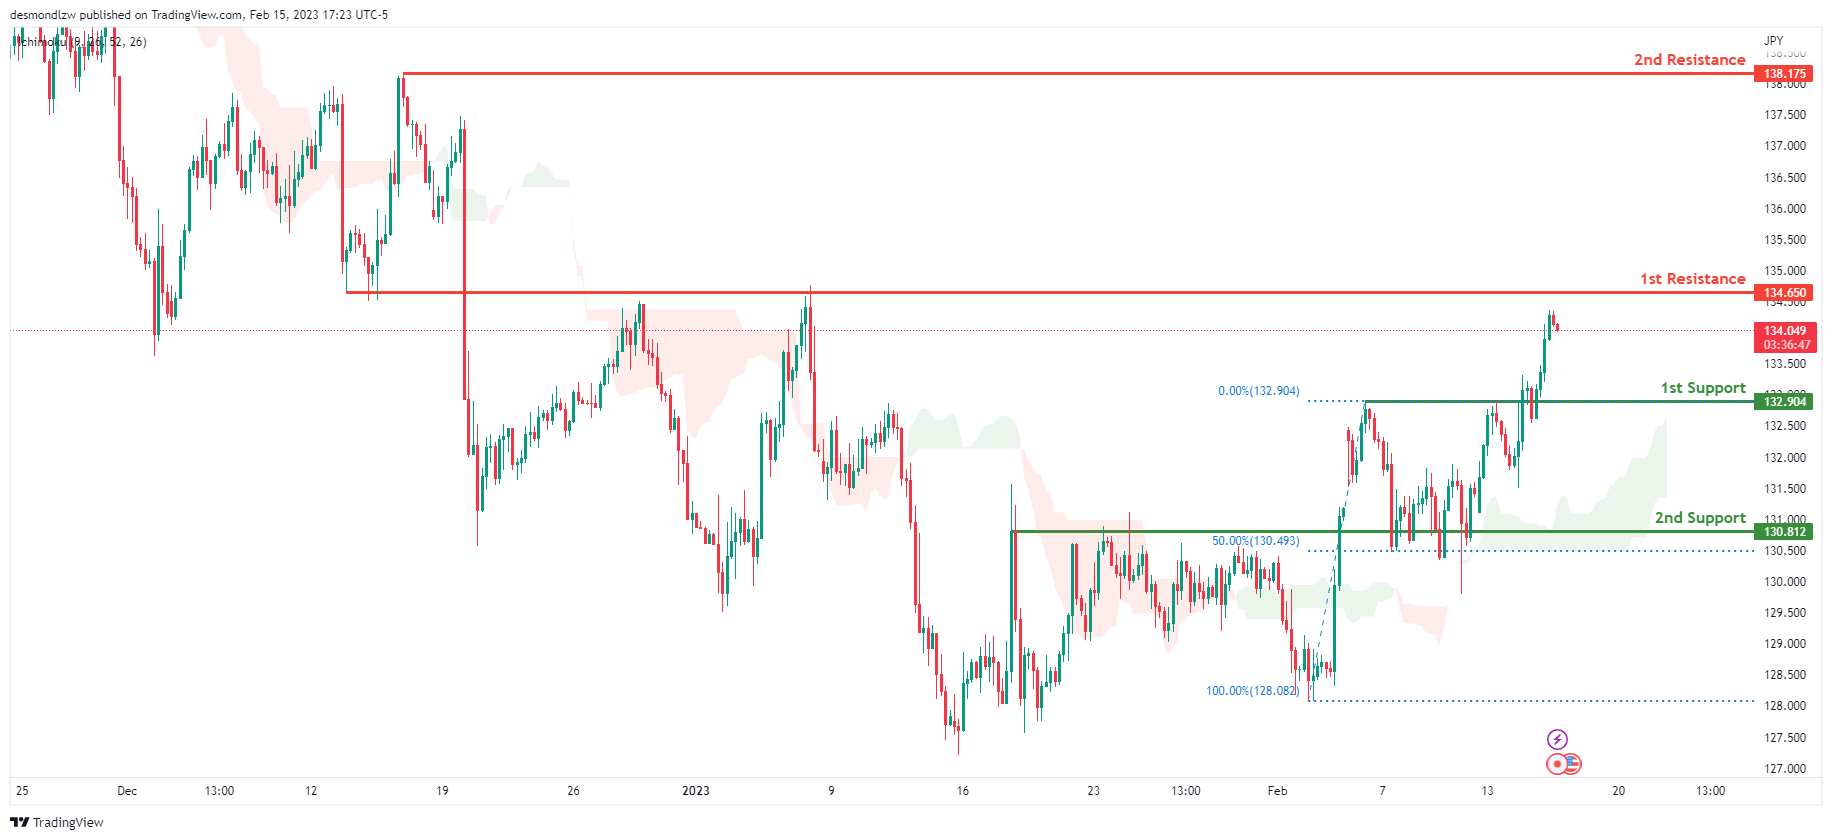
Looking at the H4 chart, my overall bias for USDJPY is bullish due to the current price crossing above the Ichimoku cloud, indicating a bullish market. If this bullish momentum continues, expect the price to possibly continue heading towards the 1st resistance at 134.650, where the overlap resistance is. In an alternate scenario, price could possibly head back down to retest the 1st support at 132.904, where the overlap support is.
Areas of consideration:
- H4 time frame, 1st resistance at 134.650
- H4 time frame, 1st support at 132.904
DXY:
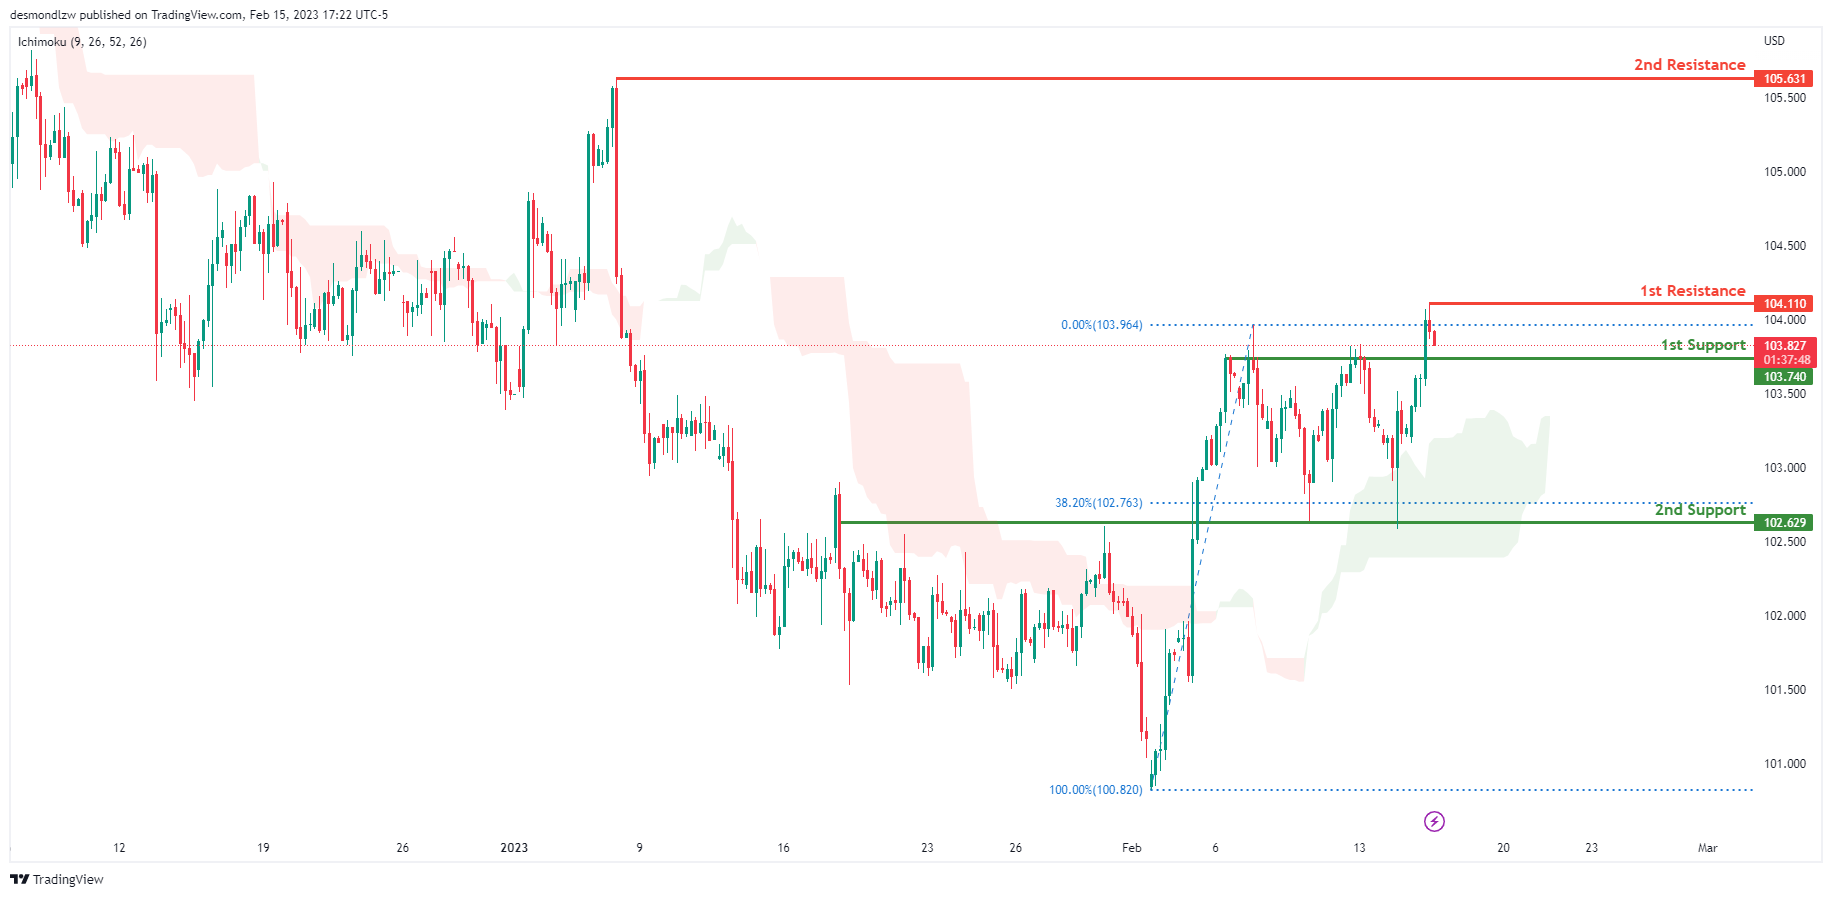
Looking at the H4 chart, my overall bias for DXY is bullish due to the current price crossing above the Ichimoku cloud, indicating a bullish market. If this bullish momentum continues, expect the price to possibly continue heading towards the 1st resistance at 104.110, where the recent high is. In an alternative scenario, price could head back down to retest the 1st support at 103.740, where the overlap support is.
Areas of consideration:
- H4 time frame, 1st resistance at 104.110
- H4 time frame, 1st support at 103.740
EUR/USD:
Looking at the H4 chart, my overall bias for EURUSD is bearish due to the current price crossing below the Ichimoku cloud, indicating a bearish market structure. If this bearish momentum continues, expect the price to possibly continue heading towards the 1st support at 1.05830, where the overlap support and 61.8% Fibonacci projection line is. In an alternate scenario, price could possibly head back up to retest the 1st resistance at 1.06952, where the overlap resistance is.
Areas of consideration :
- H4 1st resistance at 1.06952
- H4 1st support at 1.05830

GBP/USD:
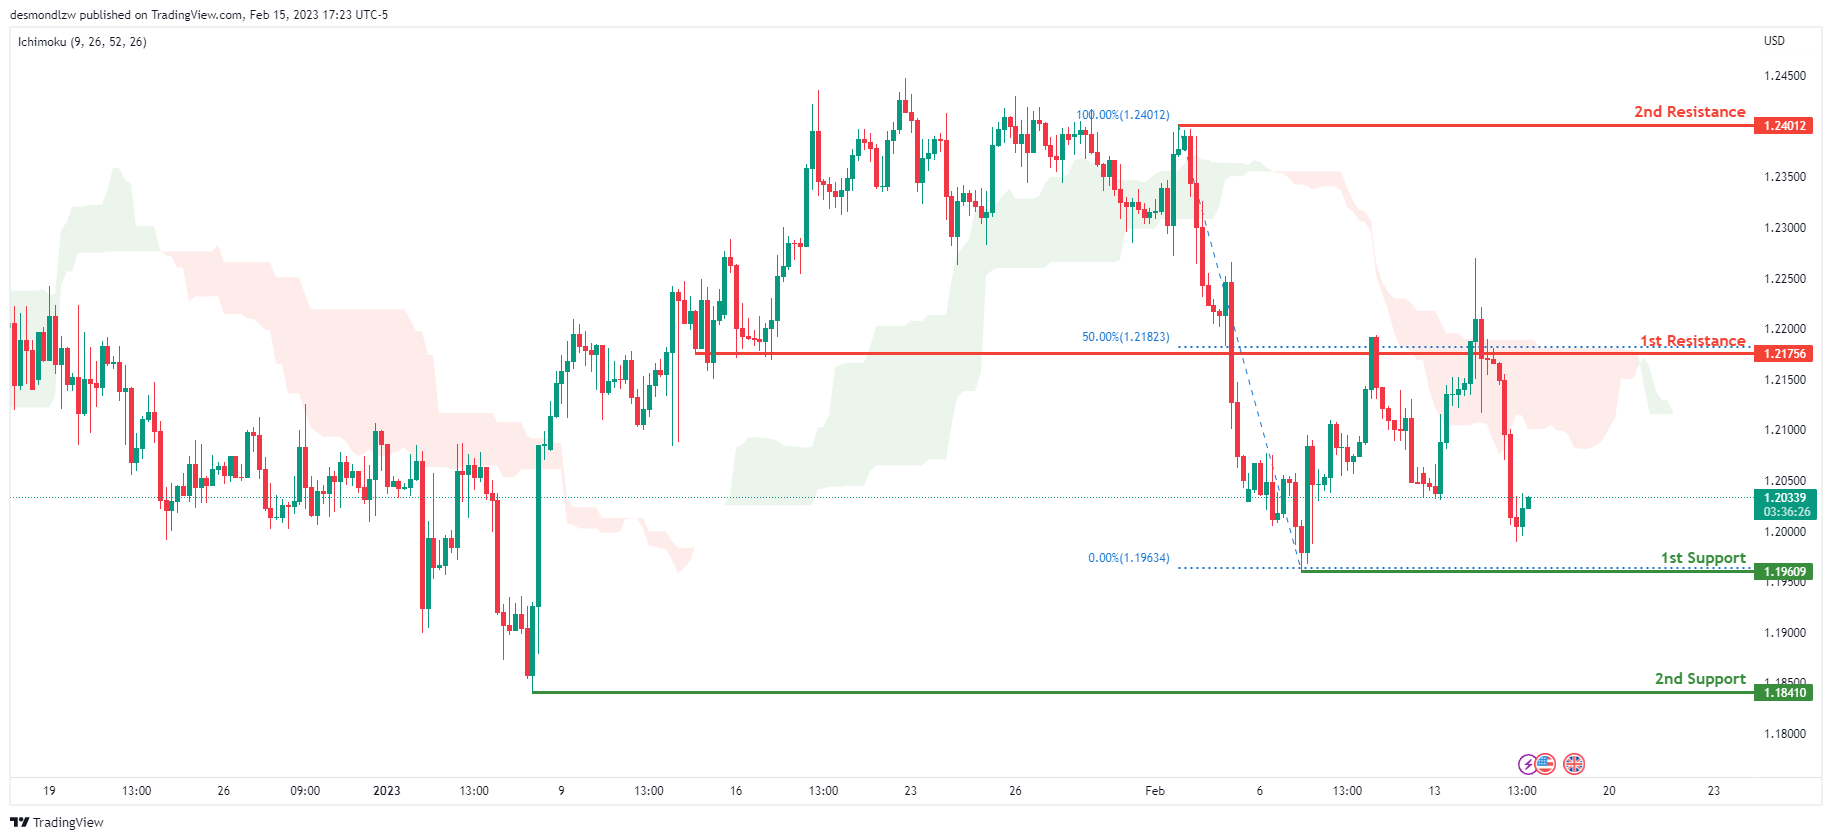
Looking at the H4 chart, my overall bias for GBPUSD is bearish due to the current price crossing below the Ichimoku cloud, indicating a bearish market. If this bearish momentum continues, expect the price to possibly continue to head towards the 1st support at 1.19609, where the recent swing low is. In an alternate scenario, price could head back up to retest the 1st resistance line at 1.21756 where the overlap resistance and 50% Fibonacci line is.
Areas of consideration:
- H4 1st resistance at 1.21756
- H4 1st support at 1.19609
USD/CHF:
Looking at the H4 chart, my overall bias for USDCHF is bullish due to the current price being above the Ichimoku cloud, indicating a bullish market. If the current bullish trend continues, expect the price to possibly break the 1st resistance at 0.92882, where the previous swing high is, before heading towards the 2nd resistance at 0.93609 where the intermediate high is. In an alternative scenario, price could possibly head back down to retest the 1st support at 0.90591, where the recent swing low and 50% Fibonacci line is.
Areas of consideration
- H4 1st support at 0.90591
- H4 1st resistance at 0.92882
- H4 2nd resistance at 0.93609

XAU/USD (GOLD):
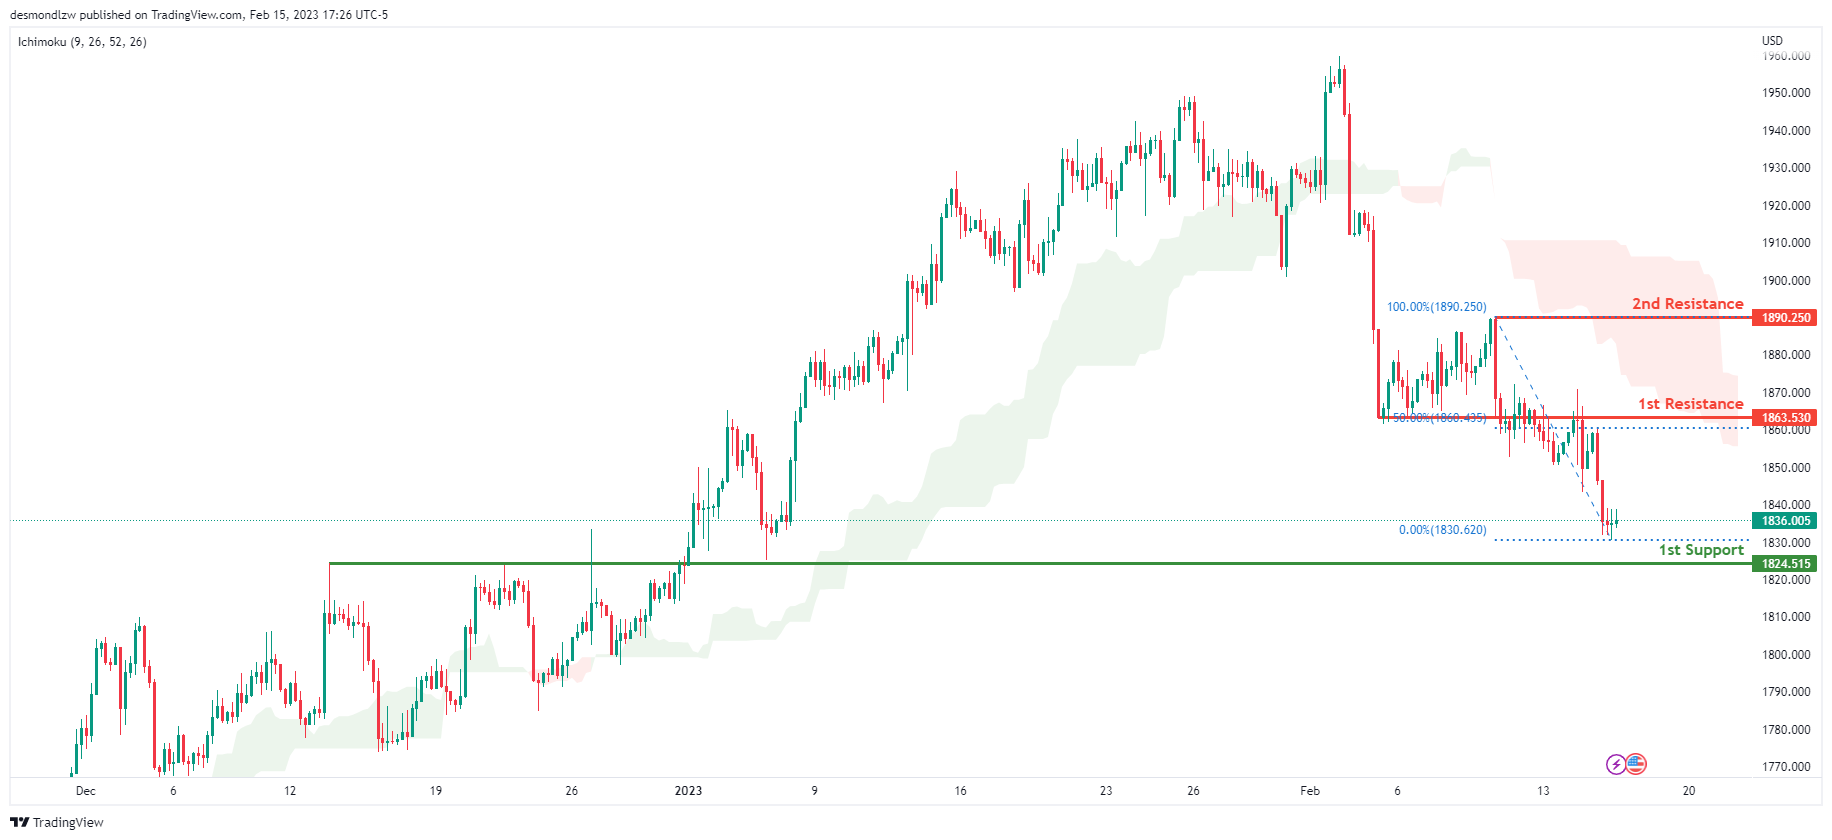
Looking at the H4 chart, my overall bias for XAUUSD is bearish due to the current price being below the Ichimoku cloud, indicating a bearish market. If this bearish momentum continues, expect the price to possibly continue heading towards the 1st support at 1824.515 where the overlap support and -61.8% Fibonacci expansion line is. In an alternative scenario, price could possibly head back up to retest the 1st resistance at 1863.530, where the previous swing low and 50% Fibonacci line is.
Areas of consideration:
- H4 time frame, 1st resistance at 1863.530
- H4 time frame, 1st support at 1824.515
AUD/USD:
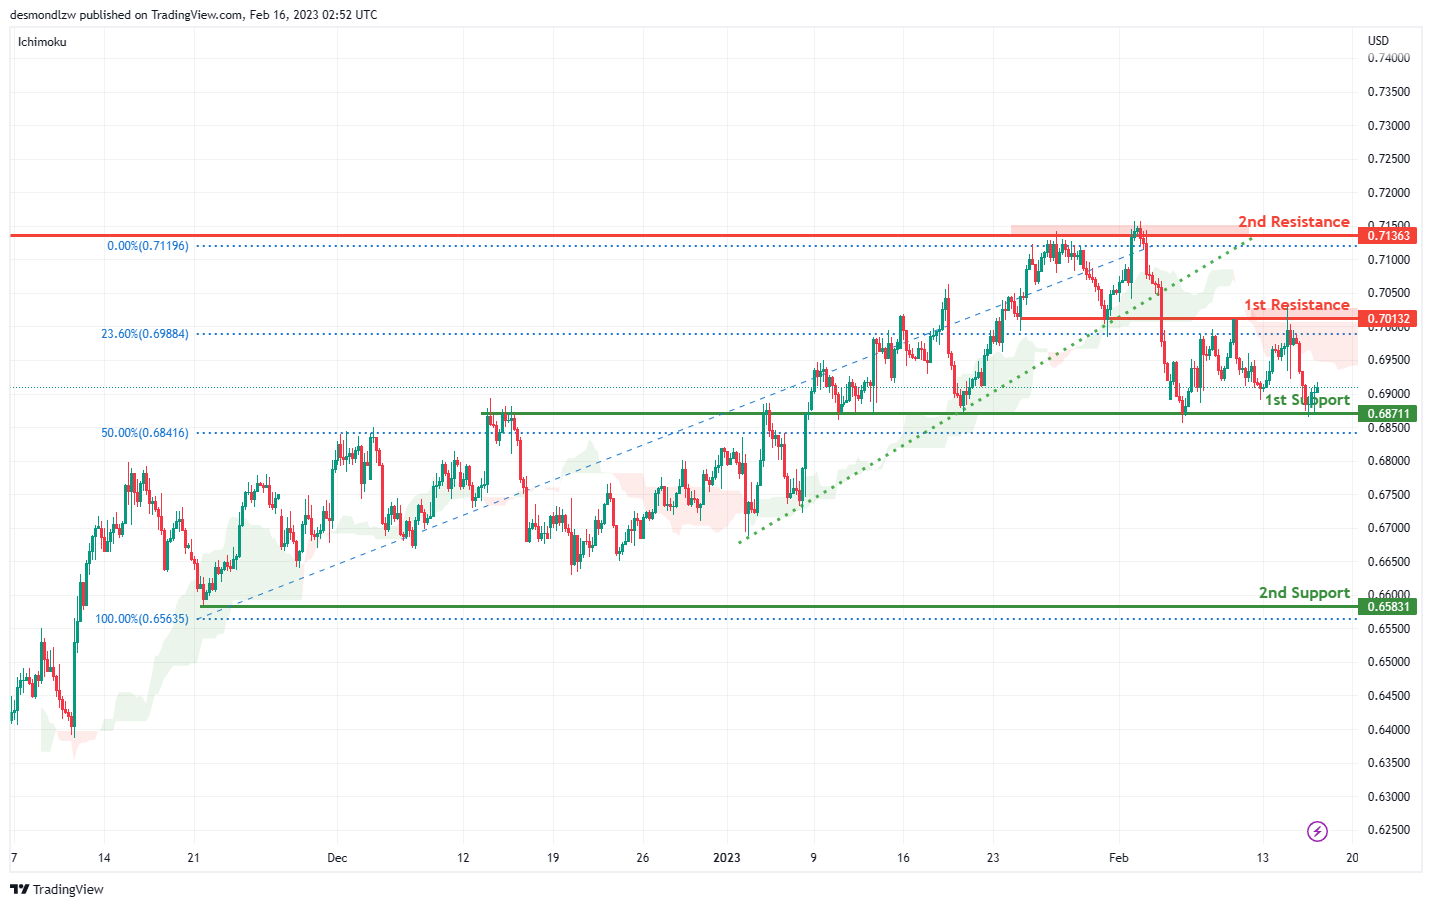
Looking at the H4 chart, my overall bias for AUDUSD is bearish due to the current price being below the Ichimoku cloud, and the ascending trend line has been broken, indicating a change of market structure.
The 1st support is at 0.68711 which is the overlap support and in line with the 50% Fibonacci retracement. The 2nd support is at 0.65831 which is the recent swing low.
In an alternate scenario, the price could possibly go back up towards the 1st resistance level at 0.70132 which is the recent swing high and in line with the 23.6% Fibonacci retracement. There is 2nd resistance at 0.71363 which is the previous swing high.
Areas of consideration
- H4. 2nd resistance at 0.71363
- H4. 1st resistance at 0.70132
- H4, 1st support at 0.68711
- H4, 2nd support at 0.65831
NZD/USD:
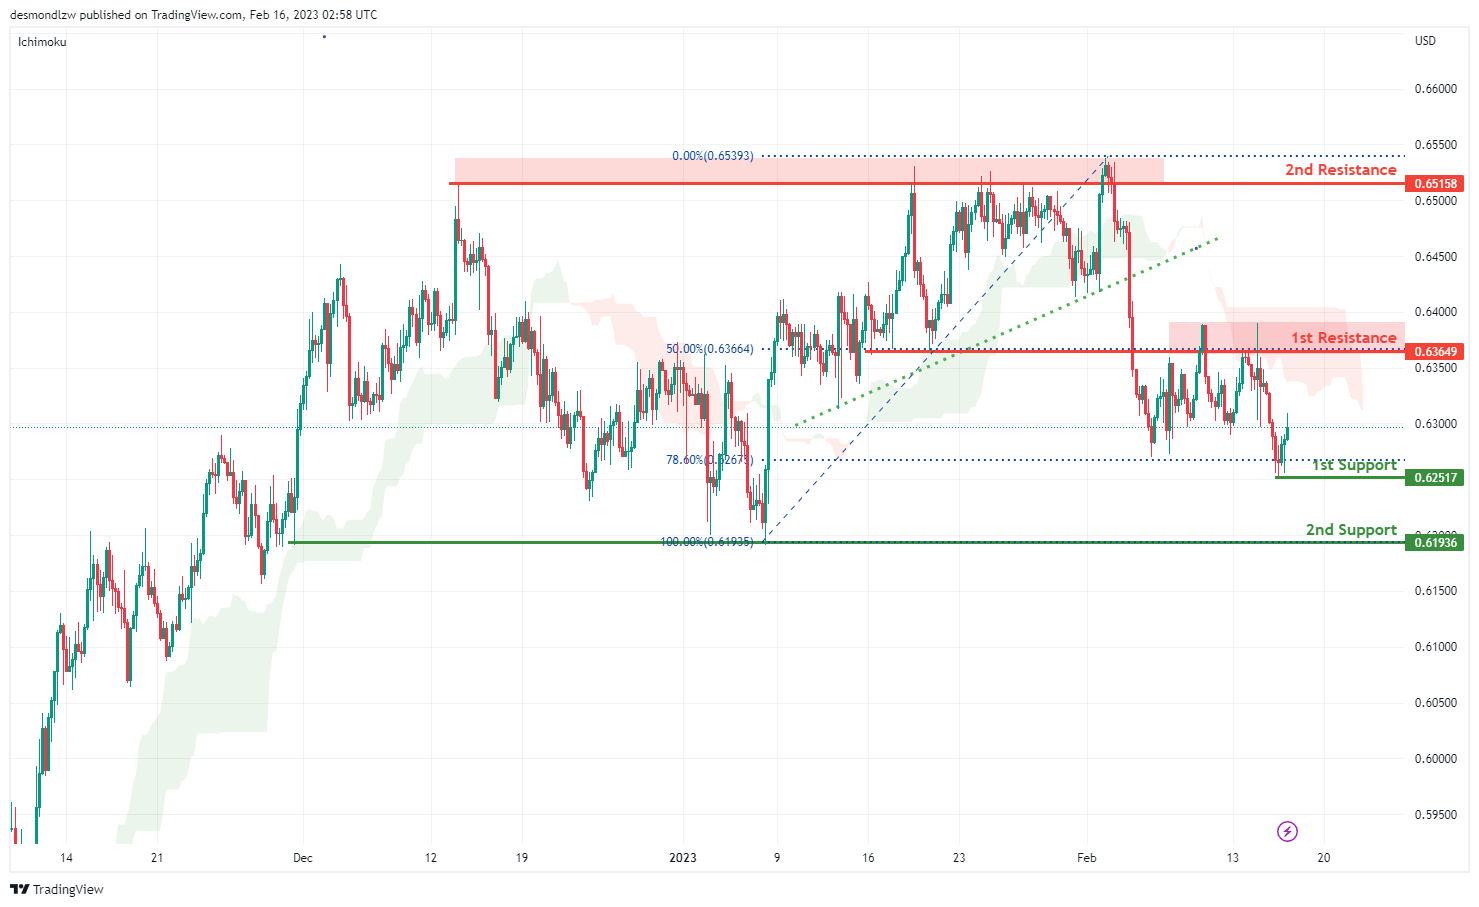
Looking at the H4 chart, my overall bias for NZDUSD is bearish, as the current price is below the Ichimoku Cloud, and the ascending trend line has been broken, indicating a change of market structure. Expecting the price to go down towards the 1st support at 0.62517 which is the recent overlap swing low. It is also inline with 78.6% Fibonacci retracement. The 2nd support is at 0.61936 which is the previous swing low.
In an alternate scenario, price could possibly go up towards the 1st resistance level at 0.63649 which is the recent overlap swing high andin line with 50% Fibonacci retracement. . There is a 2nd resistance at 0.65158.
Areas of consideration:
- H4 time frame, 2nd resistance at 0.65158
- H4 time frame, 1st resistance at 0.63649
- H4 time frame, 1st support at 0.62517
- H4 time frame, 2nd support at 0.61936
USD/CAD:
Looking at the H4 chart, my overall bias for USDCAD is bearish , as there is a descending trend line. Expecting the current price is head down towards the 1st support at 1.32332 which is the recent swing low and in line with 61.8% Fibonacci retracement.
In an alternative scenario, the price could possibly head up to the 1st resistance at 1.34730 which is the recent swing high and also in line with the 50% Fibonacci retracement. The 2nd resistance is at 1.36933 which is the previous swing high.
Areas of consideration:
- H4 time frame, 2nd resistance at 1.36933
- H4 time frame, 1st resistance at 1.34730
- H4 time frame, 1st support at 1.32332

OIL:
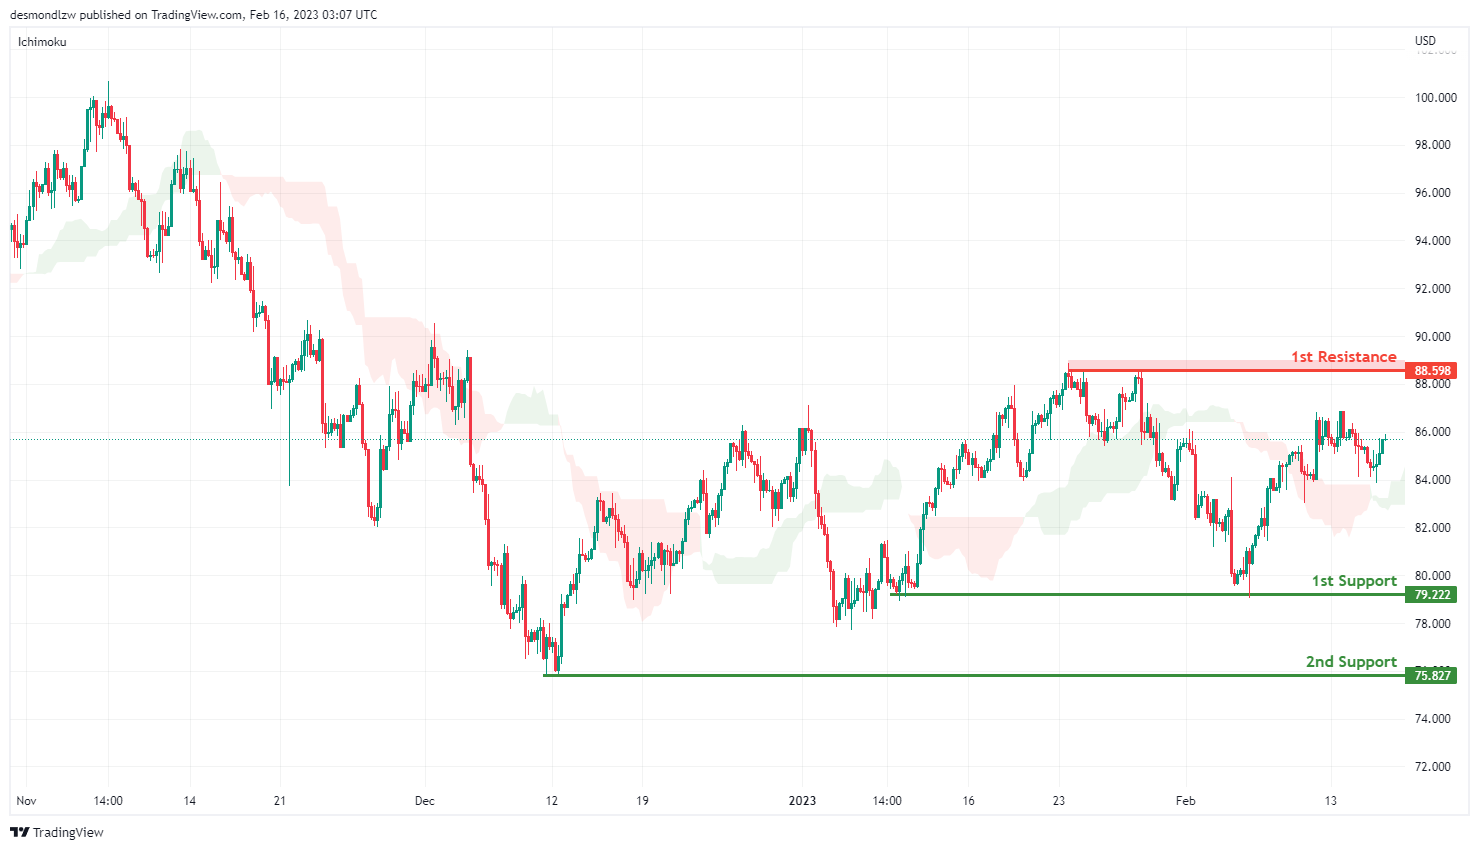
Looking at the H4 chart, my overall bias for BOC is bullish.as the current price is above the Ichimoku cloud, Expecting the price head up towards the 1st resistance level at 88.598 which is the recent swing high.
In an alternate scenario, the price could possibly head down towards the 1st support level at 79.222 which is the recent overlap swing low, before the price drops to the 2nd support at 75.827.
Areas of consideration:
- H4 time frame, 1st resistance at 88.598
- H4 time frame,1st support at 79.587
- H4 time frame, 2nd support at 75.827
Dow Jones Industrial Average:
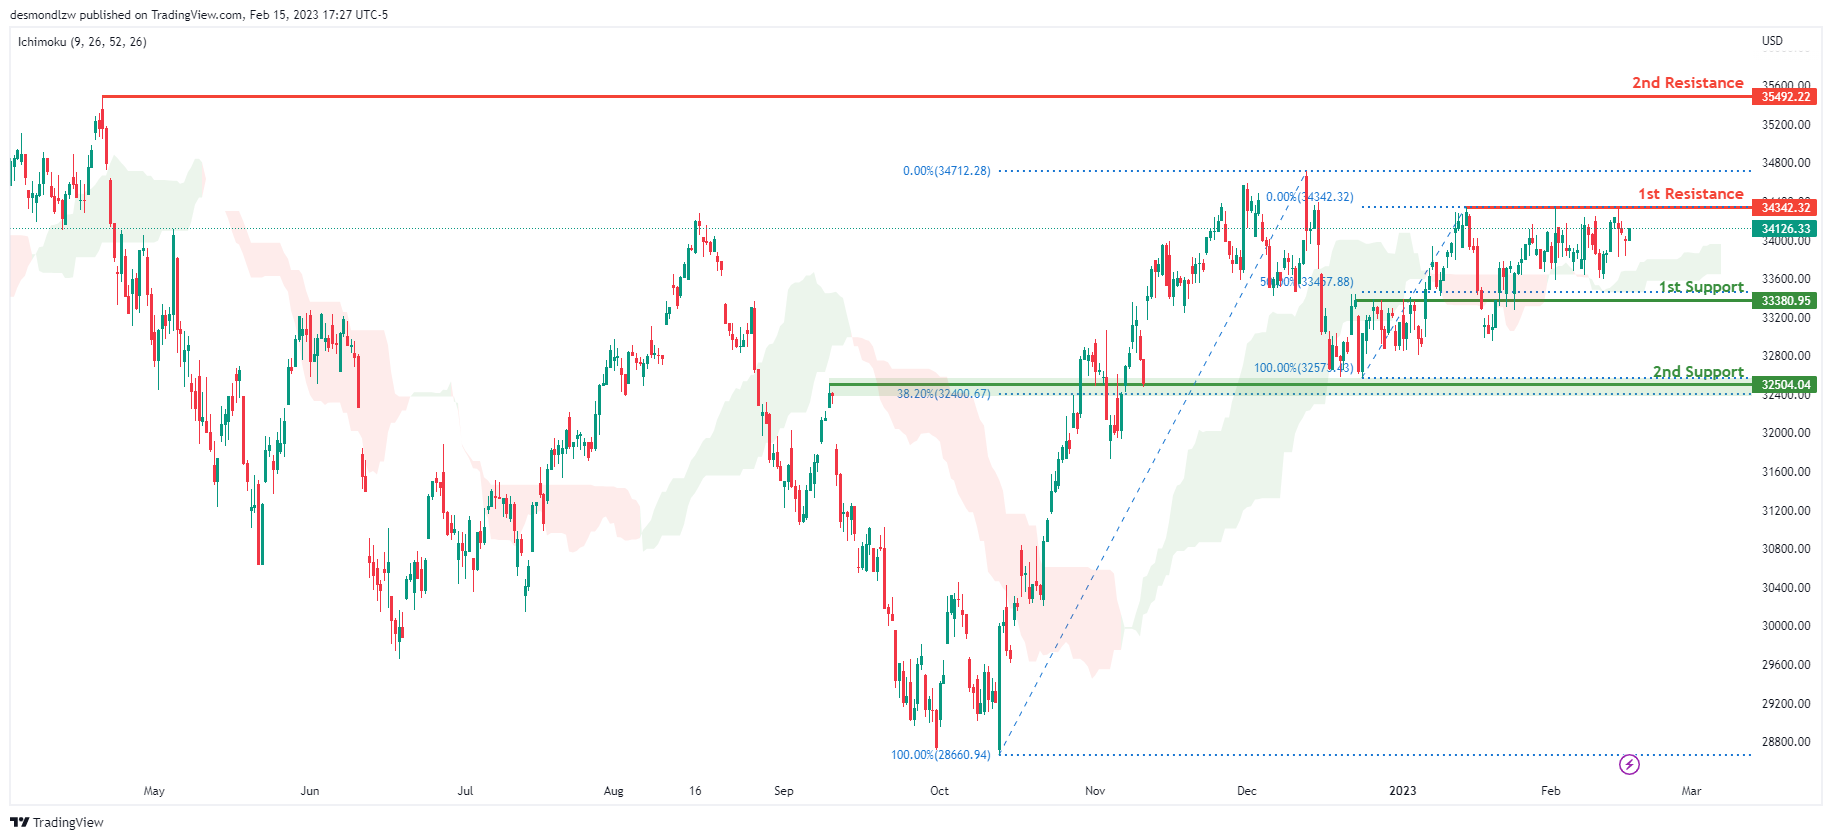
On the H4 chart, the overall bias for DJI is bullish. To add confluence to this, the price is crossing above the Ichimoku cloud which indicates a bullish market. If this bullish momentum continues, expect the price to possibly continue heading towards the 1st resistance line at 34342.32, where the recent swing high is. In an alternative scenario, price could possibly head back down towards the 1st support at 33380.95, where the 50% Fibonacci line is.
Areas of consideration:
- H4 time frame, 1st support at 33380.95
- H4 time frame, 1st Resistance at 34342.32
DAX:
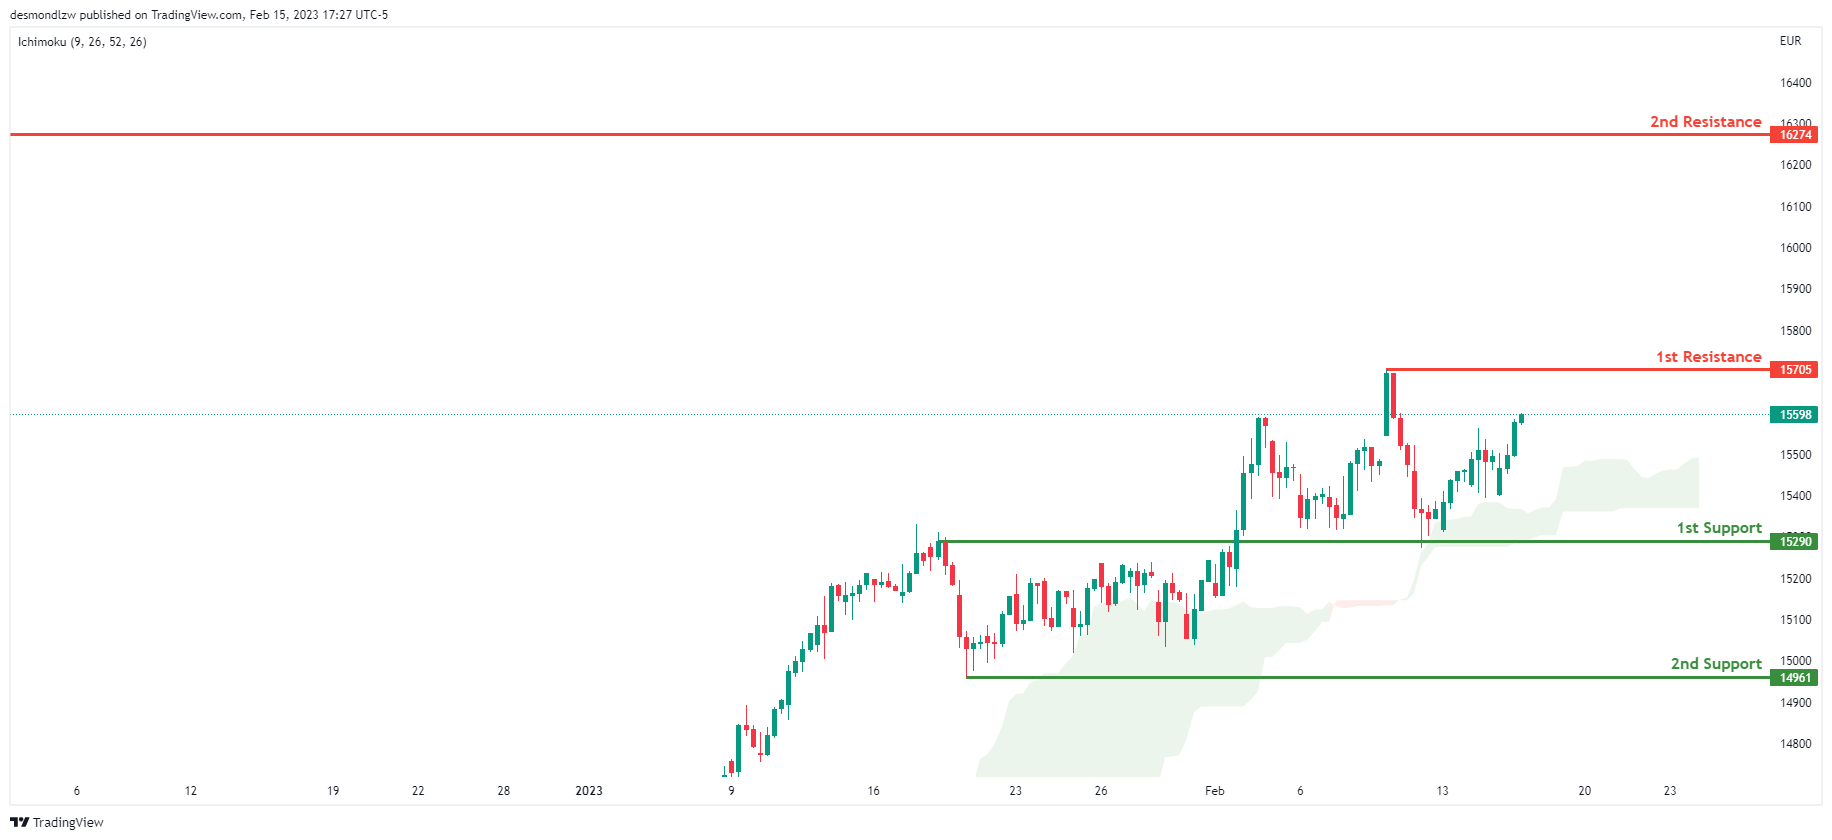
Looking at the H4 chart, my overall bias for DAX is bullish due to the current price crossing above the Ichimoku cloud, indicating a bullish market. If this bullish momentum continues, expect the price to possibly head towards the 1st resistance line at 15705, where the recent high is. In an alternative scenario, price could possibly head down to retest the 1st support at 15290, where the overlap support is.
Areas of consideration:
- H4 time frame, 1st resistance is at 15705
- H4 time frame, 1st support is at 15290
ETHUSD:
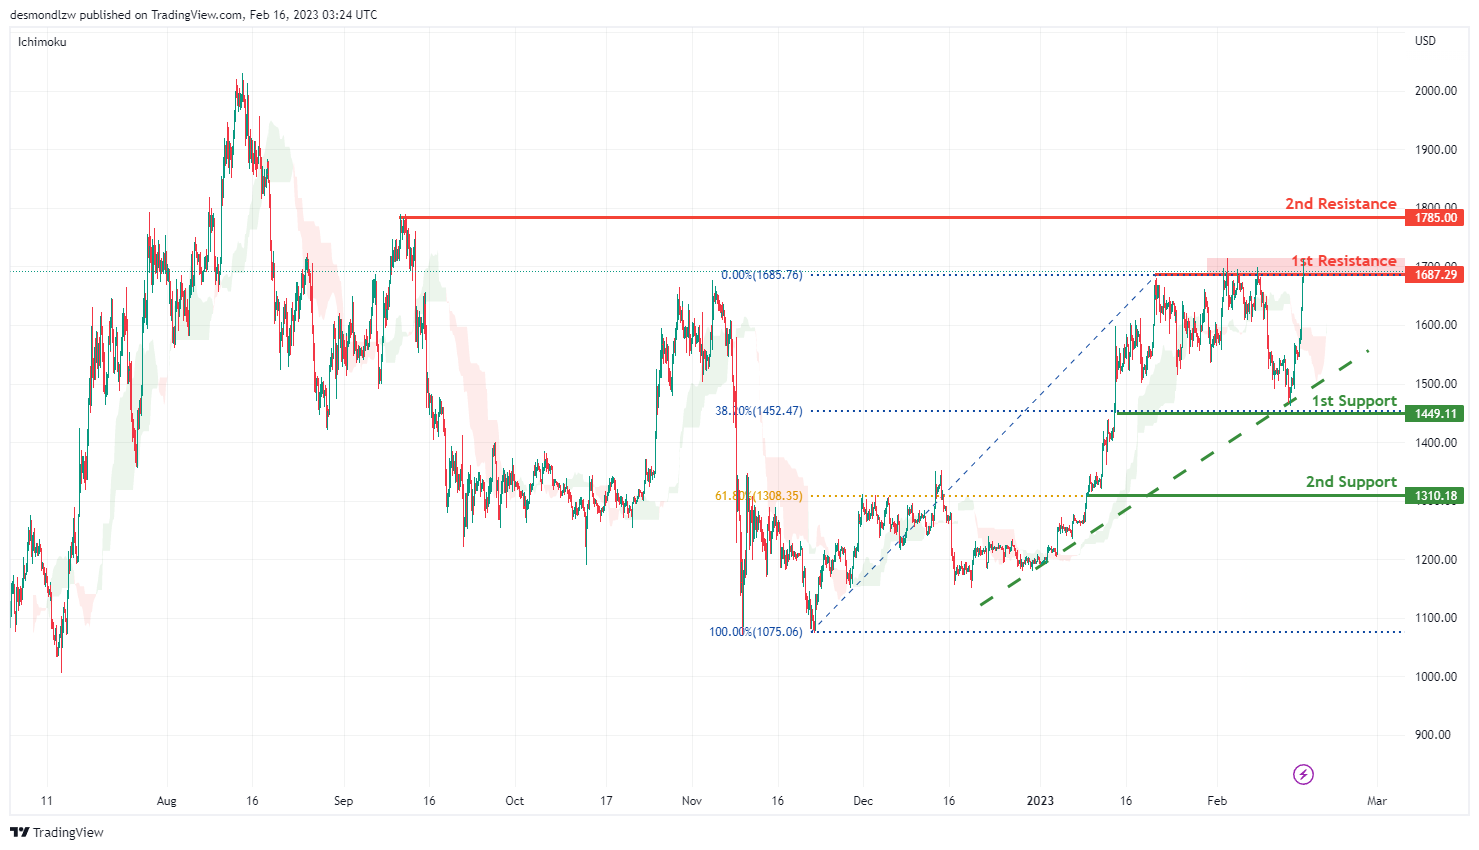
Looking at the H4 chart, my overall bias for ETHUSD is bullish, as there is a strong ascending trend line. The price may go up and break the 1st resistance line at 1685.76 before breaking the 2nd resistance line at 1785.00 which is the previous swing high.
In an alternate scenario, the price to go down to break the 1st support line at 1449.11 which is in line with 38.2% Fibonacci retracement, before it heads towards the 2nd support at 1310.18 which is in line with 61.8% Fibonacci retracement.
Areas of consideration:
- H4 time frame, 2nd resistance of 1785.00
- H4 time frame, 1st resistance of 1685.76
- H4 time frame, 1st support at 1449.11
- H4 time frame, 2nd support at 1310.18
BTCUSD:
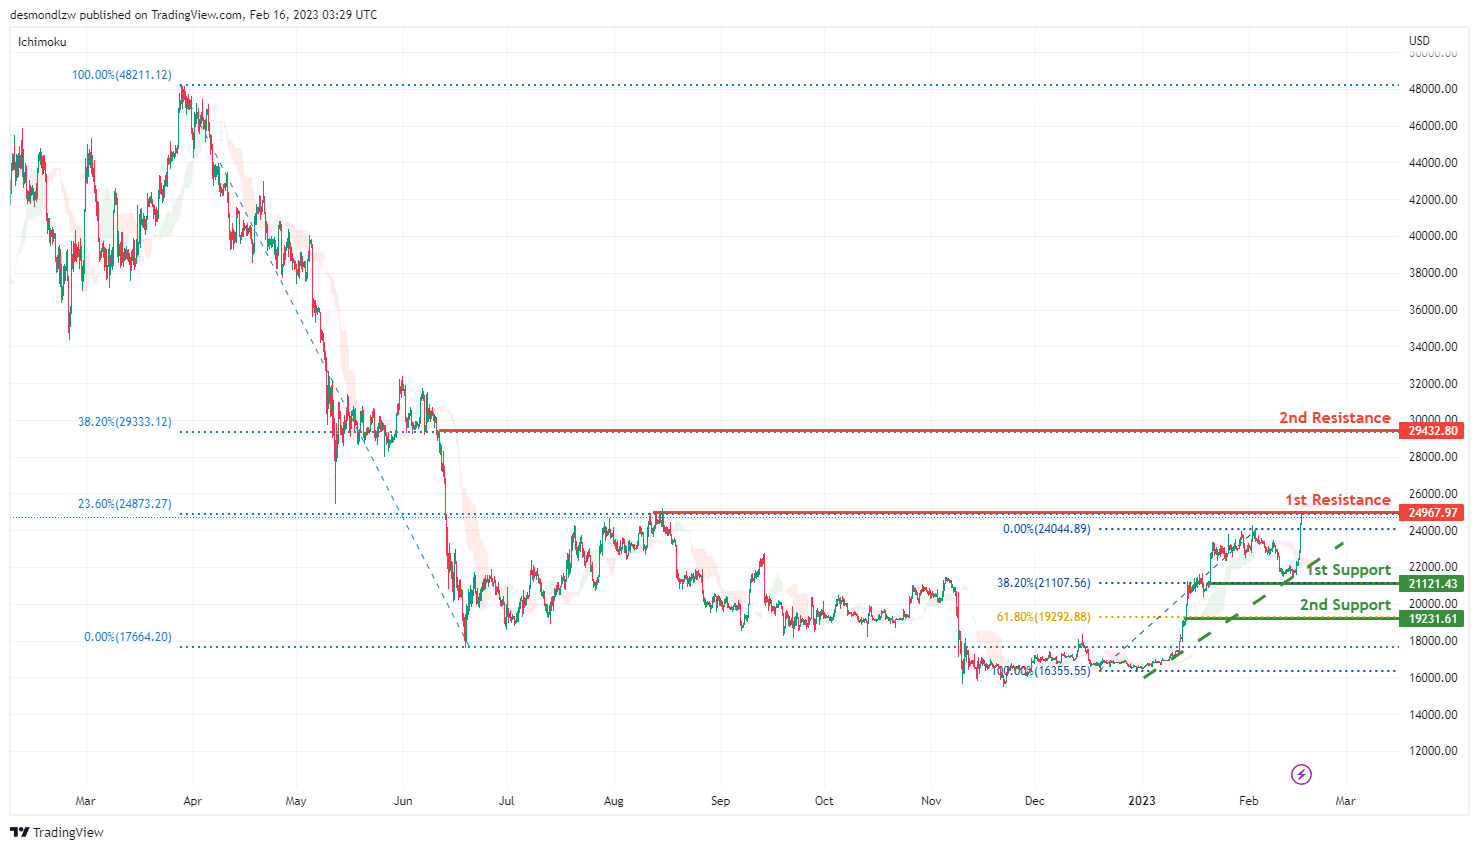
Looking at the H4 chart, my overall bias for BTCUSD is bearish. As there is an ascending trend line, expecting the price could possibly head up to the 1st resistance at 24234.83 which is the previous swing high, before it head up to the 2nd resistance 29432.80 where the 38.2% Fibonacci retracemnt is.
The 1st support line at 21121.43 which is in line with 38.2% Fibonacci retracement, before heading down towards the 2nd support at 19231.61 which is in line with 61.8% Fibonacci retracement.
Areas of consideration:
- H4 time frame, 2nd resistance 29432.80
- H4 time frame, 1st resistance 24234.83
- H4 time frame, 1st support at 21121.43
- H4 time frame, 2nd support at 19231.61
S&P 500:
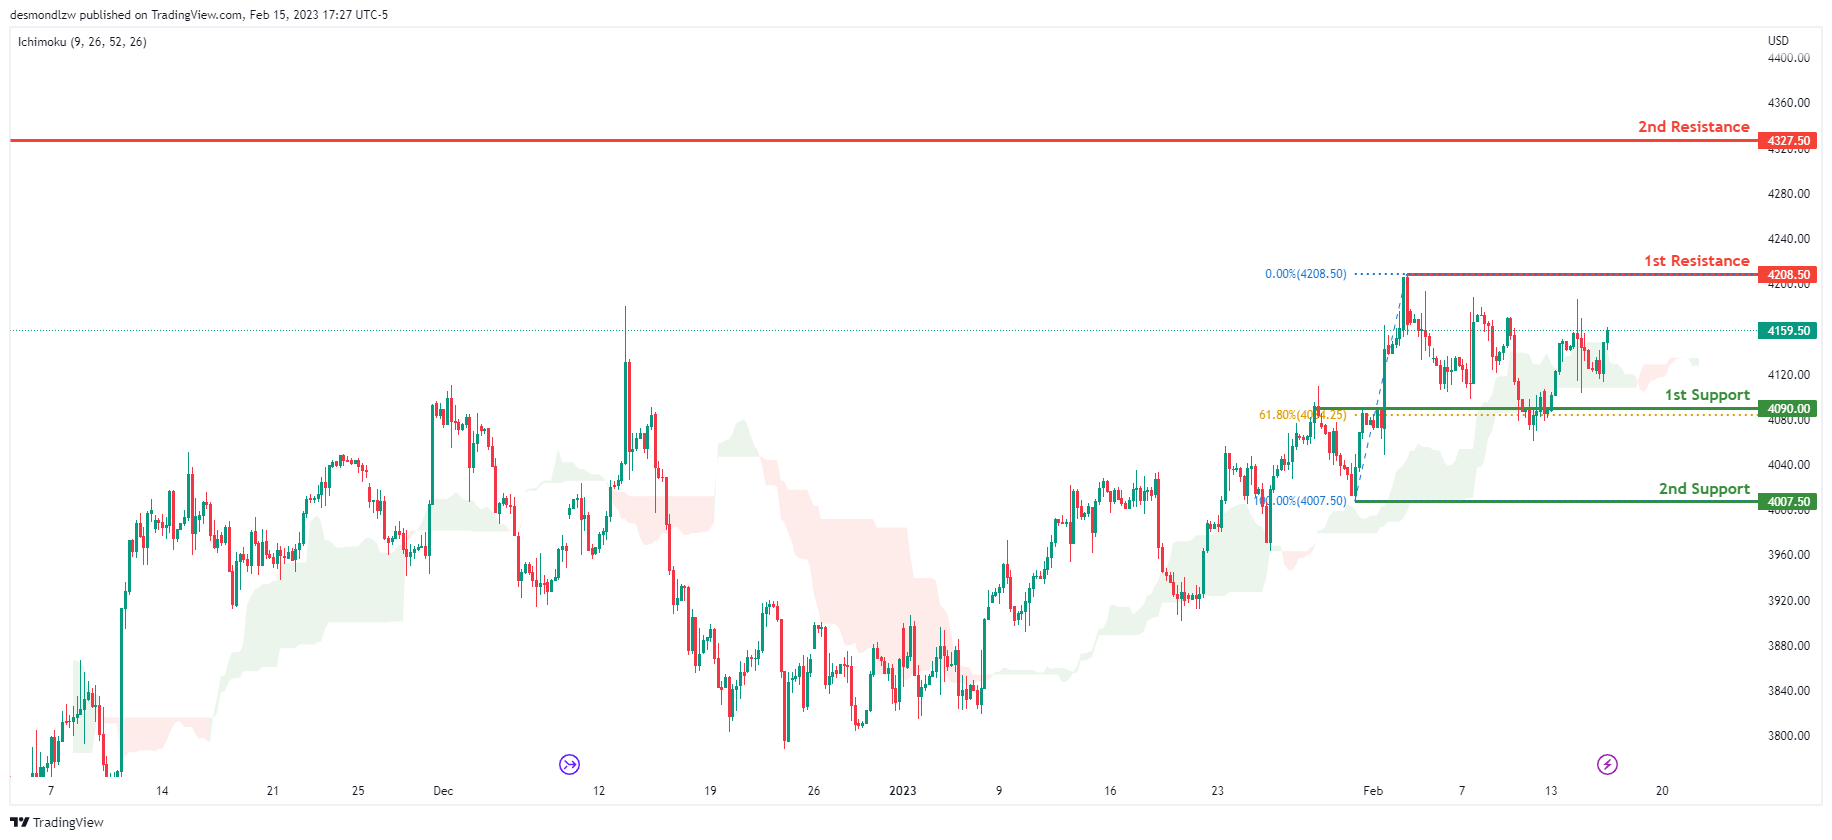
Looking at the H4 chart, my overall bias for S&P500 is bullish due to the current price being above the Ichimoku cloud, indicating a bullish market. If this bullish momentum continues, expect the price to possibly break the 1st resistance at 4208.50, where the recent swing high is., before heading towards the 2nd resistance at 4327.50 where the previous swing high is, In an alternative scenario, price could possibly head back down to retest the 1st support at 4090.00, where the 50% Fibonacci line is.
Areas of consideration:
- H4 time frame, 1st support at 4090.00
- H4 time frame, 1st resistance at 4208.50
- H4 time frame, 2nd resistance at 4327.50
Australia January Labour Force; As Illness Fades More Than Usual Go On Holidays
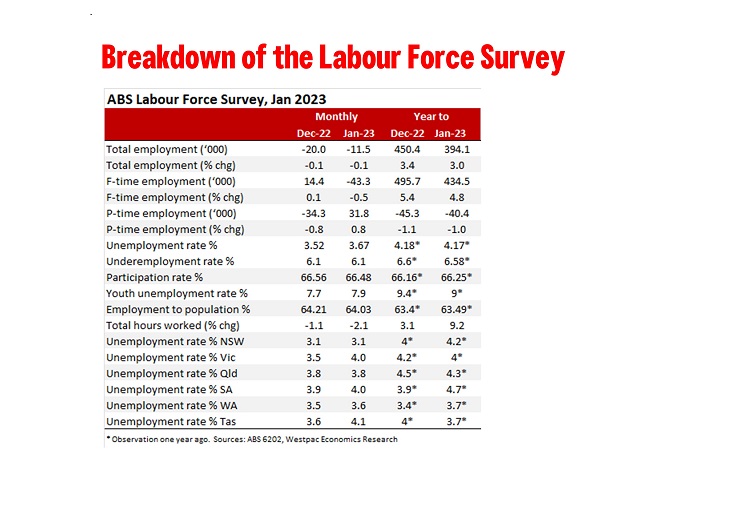
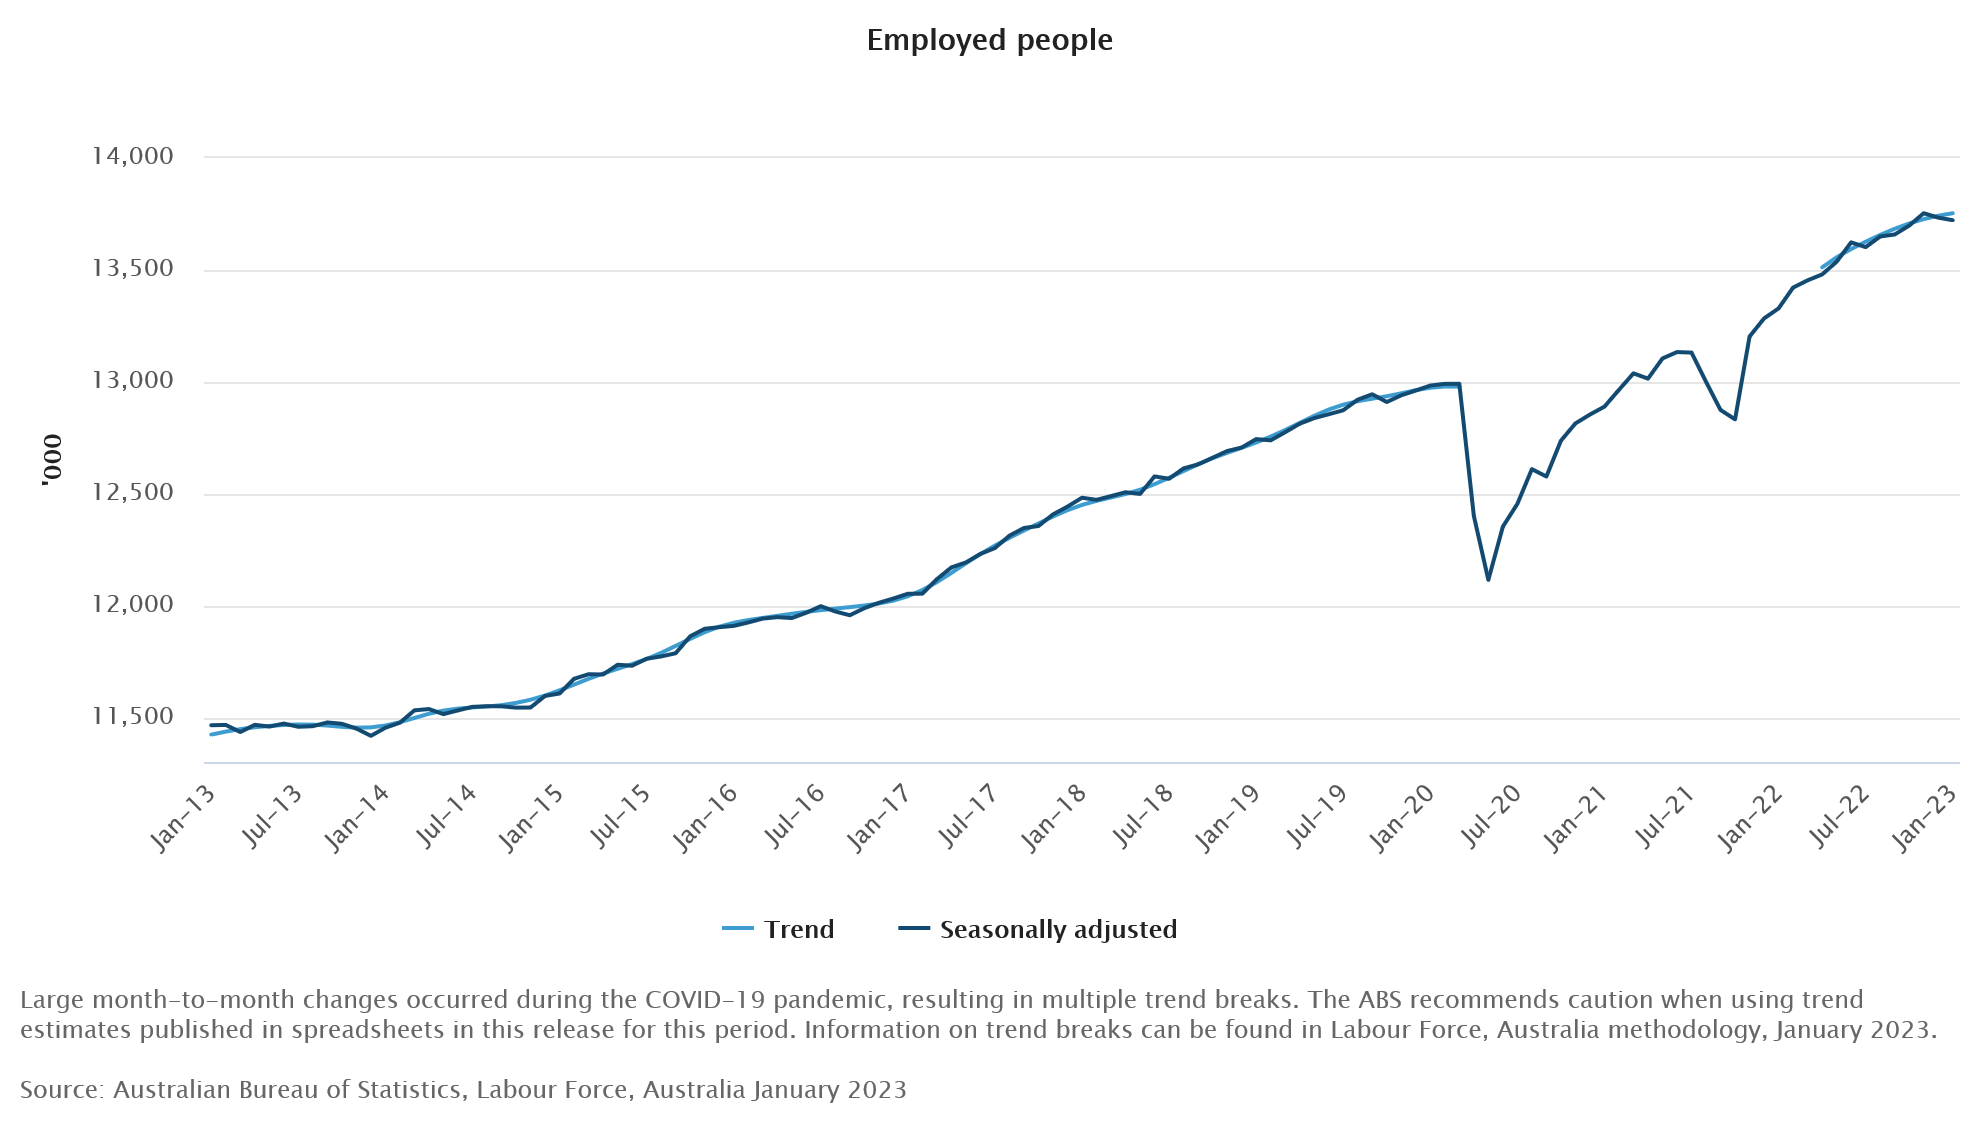
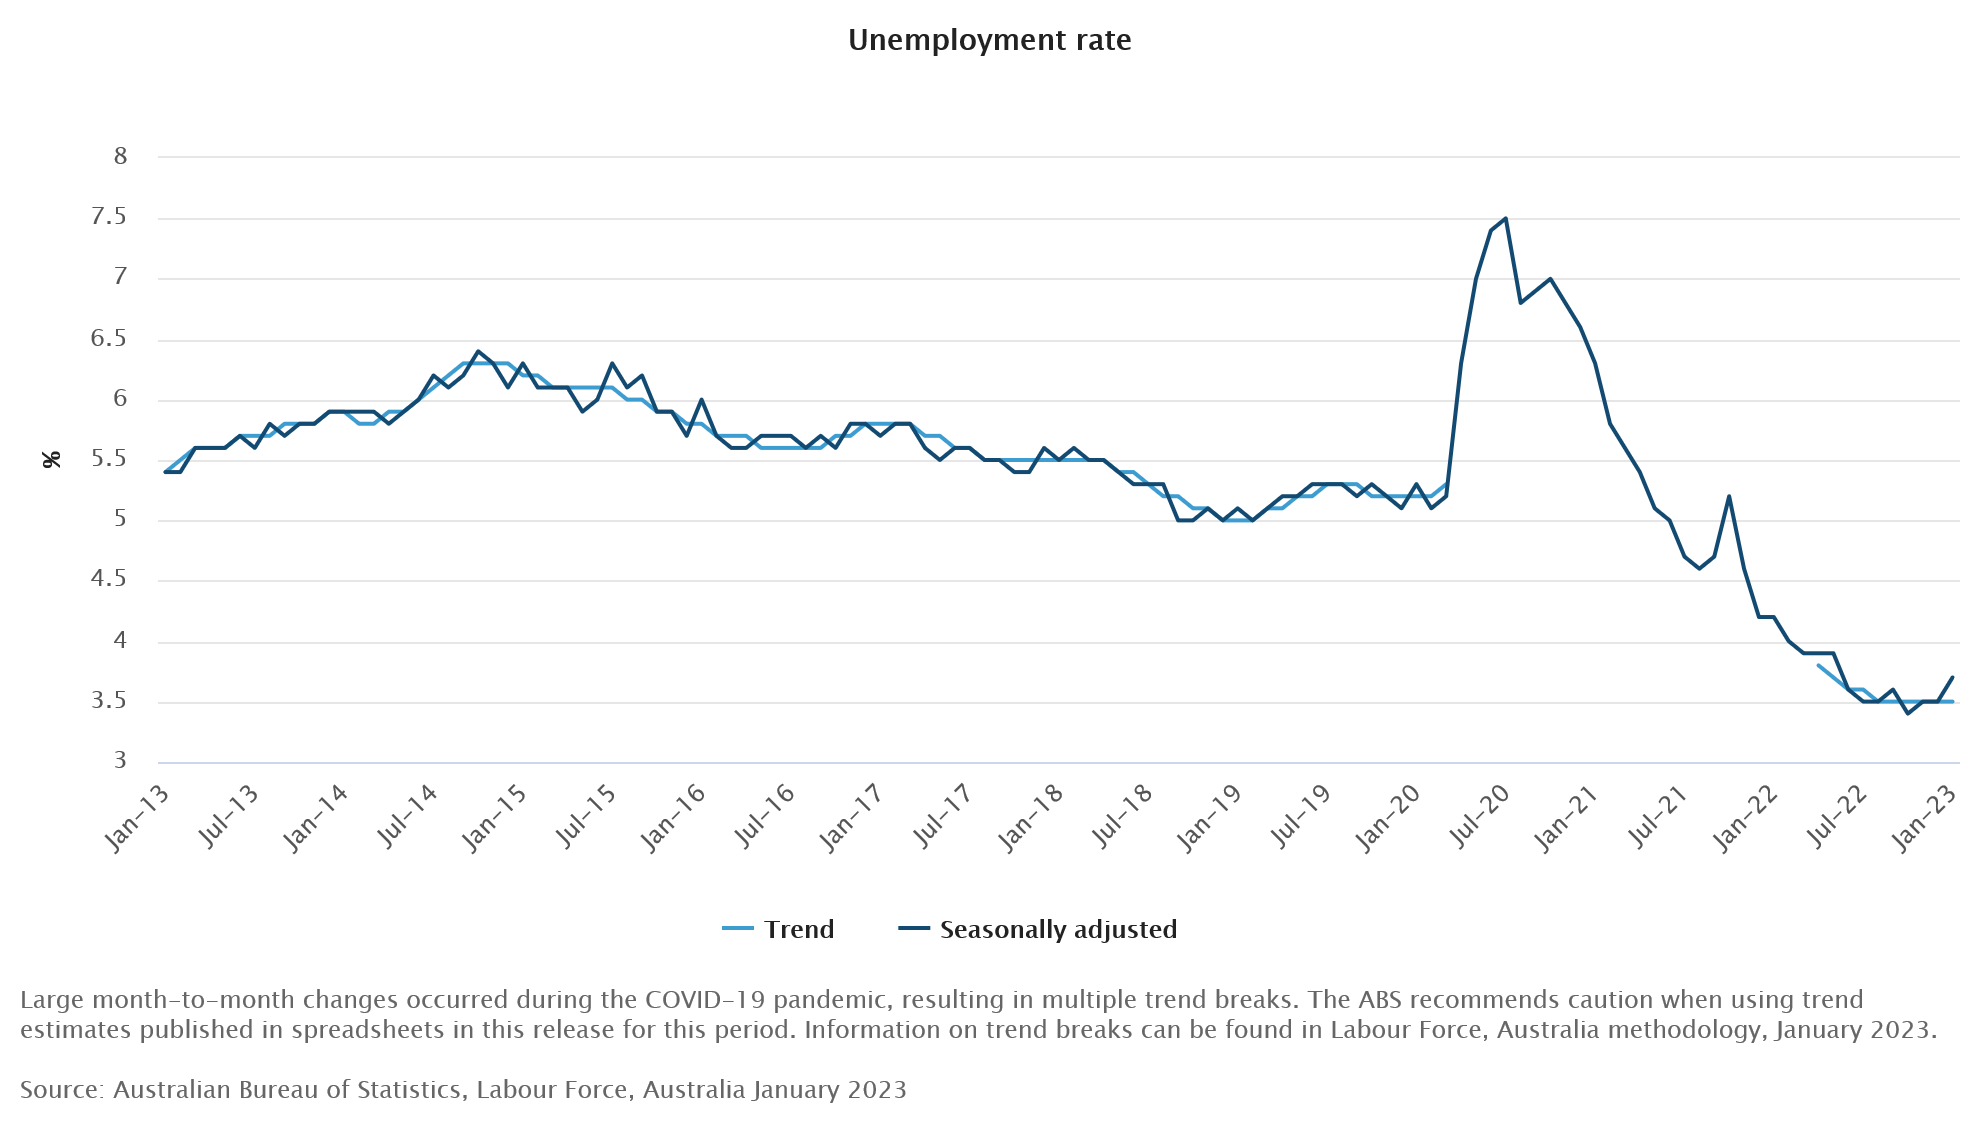
Total employment: -11.5k from -20k (revised from -14.6k); unemployment rate: 3.7% from 3.5% (unrevised 3.5%); participation rate: 66.5% from 66.6% (unrevised 66.6%). We had expected a softening in employment growth through 2023 and as the ABS suggests the recent softer than expected outcomes are due to one off factors associated with annual leave and illness we have not revised our forecast for unemployment be around 4¾% by end 2023.
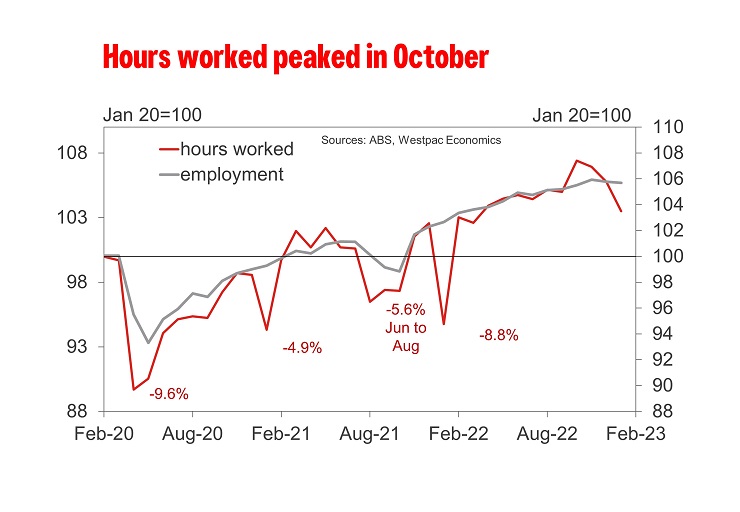
Total employment fell almost 12k in January following on from a 15k decline in December shifting the three-month average change in employment from 45k in November to 33k in December then down to 1k in January. Annual growth in employment has moderated from 6.8%yr in October to 3.4%yr in December then 3.0%yr in January highlighting a significant step down in the pace of employment growth.
The employment to population ratio fell 0.2ppt to 64.0% in January. While it is still 0.5ppt higher than January 2022 it is also consistent with the moderation in the annual pace in employment growth. The annual change in employment to population peaked at 2.9ppt in October moderating to 0.8ppt in December then down to 0.5ppt in January.
While we agree that there has been a clear step down in employment growth, something we expected to see as the surge out of the COVID recovery lost momentum, the big question for us is: should we take this significant shift in employment growth at the end of 2022 and in early 2023 as the start of new softer trend, or even a correction in employment, despite business and household surveys still pointing to robust labour demand?
We don’t think so, as the ABS noted some factors that would make you want to see more data before you accept the past few months being indicative of a new softer trend.
The ABS noted that along with a larger-than-usual increase in unemployment in January, there was also a similarly larger-than-usual rise in the number of unemployed people who had a job to go to in the future. January is the most seasonal month of the year (employment fell 343k in original terms) with people not just leaving jobs but also getting ready to start new jobs or return from leave. In January 2023 the ABS noted that more people than usual with a job, indicating they were starting or returning to work later in the month.
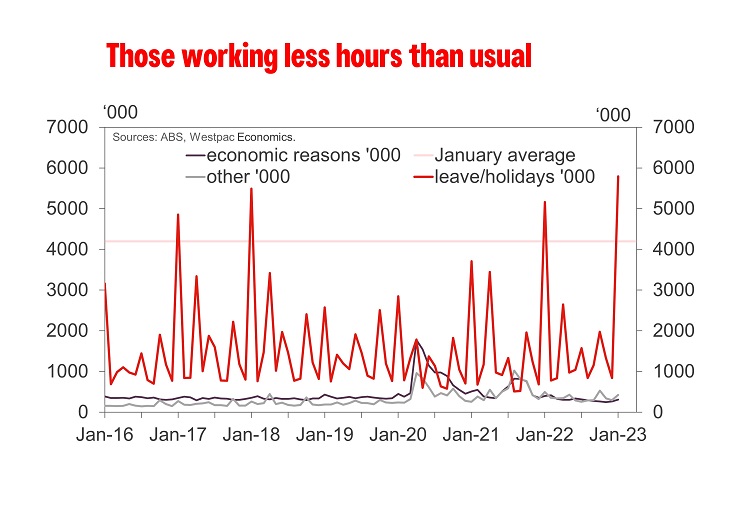
And as we suspected in our preview there was a greater than usual ‘holiday effect’ while the rate of illness improved from December. Seasonally adjusted monthly hours worked declined 2.1% which reflected a higher-than-usual number taking annual leave in January. Early January is the seasonal peak in people taking annual leave. As in 2021 and 2022, January 2023 again saw more than usual taking annual leave with around 43% of those employed working reduced or no hours because they were on leave, compared with around 41% of those employed over the same period before the pandemic.
In January 2023, the proportion of people away from work on sick leave was back around the average, pre-pandemic level, unlike January 2022, when more people than usual were away from work on sick leave.
By state, it is interesting that the unemployment rate lifted in all states expect for NSW and Qld. The unemployment rate was flat in NSW, well below the national average of 3.7%, but we should note that NSW employment contracted 5.1k in January on the back of a 17.2k contraction in December. Unemployment was also flat in Qld at 3.8%, higher than the national average, which is interesting given that employment lifted 17.6k in January in that state.
The unemployment rate lifted to 4.0% from 3.5% in Victoria, it rose from 3.9% to 4.0% in SA and from 3.5 to 3.6% in WA.
Bitcoin Extending Higher in Impulsive Elliott Wave Structure
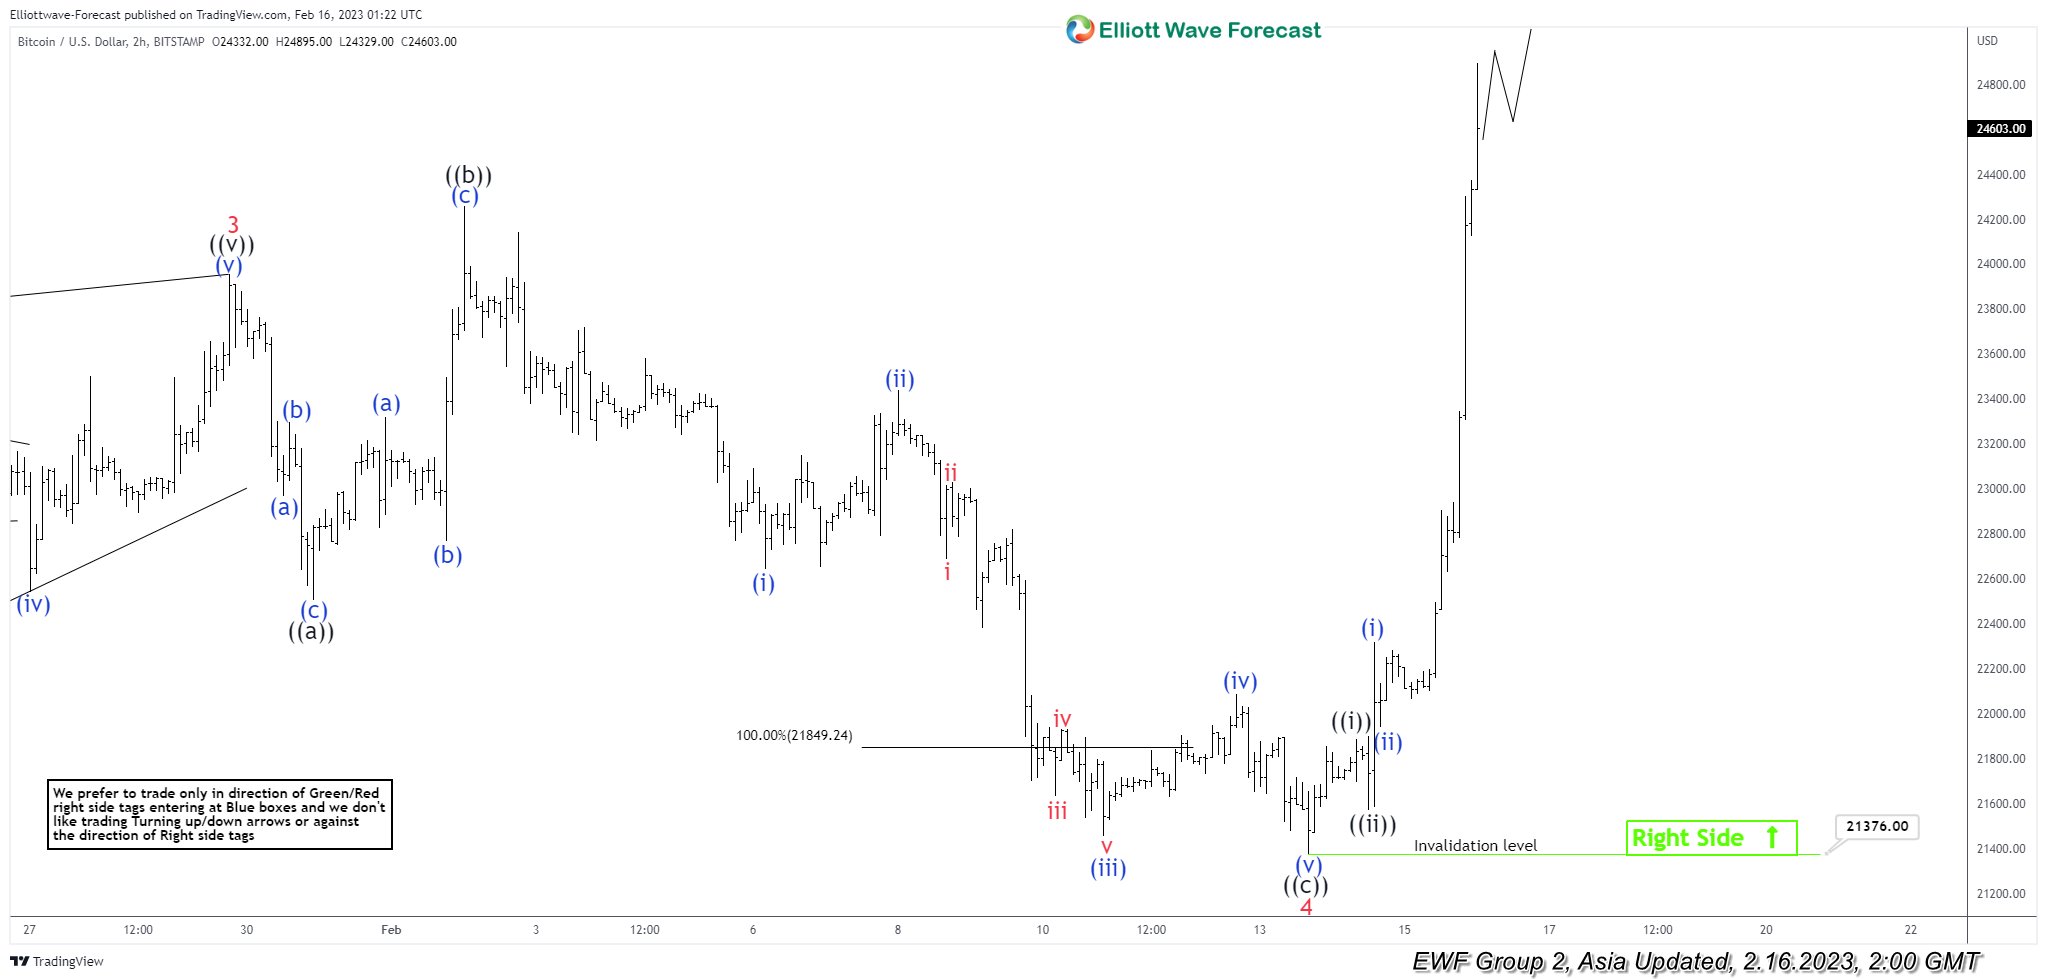
Cycle from 11.22.2022 low is in progress as a 5 waves impulse Elliott Wave Structure. Up from 11.22.2022 low, wave 1 ended at 18373 and pullback in wave 2 ended at 16293. The crypto-currency then extends higher in wave 3 towards 24258 and pullback in wave 4 ended at 21396.16. Internal subdivision of wave 4 unfolded as an expanded flat as the chart below shows.
Down from wave 3, wave ((a)) ended at 22504 in 3 swing. Rally in wave ((b)) ended at 24258 also in 3 swing. Wave ((c)) lower ended at 21396.16 in 5 waves. Down from wave ((b)), wave (i) ended at 22643 and wave (ii) ended at 23439. Wave (iii) ended at 21454, wave (iv) ended at 22086, and final leg lower wave (v) ended at 21396.16 which also completed wave ((c)) and 4 in higher degree. Bitcoin has since turned higher in wave 5. Up from wave 4, wave ((i)) ended at 21885 and pullback in wave ((ii)) ended at 21582. Expect dips to find support in 3, 7, or 11 swing and Bitcoin to extend higher as far as pivot at 21396.16 low stays intact
Bitcoin (BTCUSD) 2 Hour Elliott Wave Chart
Australian employment down -11.5k in Jan, unemployment rate rose to 3.7%
Australia employment contracted -11.5k or -0.1% mom in January, worse than expectation of 20k growth. Unemployment rate rose from 3.5% to 3.7%, above expectation of 3.5%. Participation rate dropped from 66.6% to 66.5%. Monthly hours worked dropped -2.1% mom.
ABS noted: Along with a larger-than-usual increase in unemployed people in January, there was also a similarly larger-than-usual rise in the number of unemployed people who had a job to go to in the future.
Bjorn Jarvis, ABS head of labour statistics said: "January is the most seasonal time of the year in the Australian labour market, with people leaving jobs but also getting ready to start new jobs or return from leave. This January, we saw more people than usual with a job indicating they were starting or returning to work later in the month."
Japan posts record monthly trade deficit as exports to China tumbled
Japan goods exports rose 3.5% yoy to JPY 6551B in January, better than expectation of 0.8% yoy, but much worse than prior month's 11.5% yoy. Exports to China fell -17.1% yoy on cars, car parts and chip-making equipment. Exports to the US were up 10.2% yoy. Exports to Europe ere up 9.5% yoy.
Imports rose 17.8% yoy to JPY 10048B, below expectation of 18.4% yoy and prior month's 20.7% yoy. Import growth was boosted by coal, liquefied natural gas and crude oil,
Trade deficit came in at JPY -3497B.The monthly deficit was the largest on record going back to 1979.
In seasonally adjusted term, exports dropped -6.3% mom to JPY 7788B. Imports dropped -5.1% mom to JPY 9609B. Trade deficit was largely unchanged at JPY -1821B.
ECB Lagarde: We intend to hike by 50bps in March
In a speech to the European Parliament, ECB President Christine Lagarde reiterated that "we intend to raise interest rates by another 50 basis points at our next meeting in March", and the "evaluate the subsequent path". Future policy decisions will continue to be "data-dependent" and follow a "meeting-by-meeting approach".
While headline inflation moderated to 8.5% as shown in January flash estimate, "price pressures remain strong and underlying inflation is still high" with core inflation at 5.2%. "Even though most measures of longer-term inflation expectations currently stand at around 2%, these measures warrant continued monitoring."
Risks to growth outlook are "now more balanced" than they were in December. Russia's war against Ukraine continues to be a "significant downside risk". But "faster resolution of the energy shock would support growth". Risk to inflation outlook "have also become more balanced, especially in the near term."
What Does the Current Yield Curve Inversion Tell Us About Future Asset Performance?
Economists and market participants enjoy identifying indicators that, according to their analysis, reveal the future economic performance. Among the plethora of such indicators, the inverted 2-year/10-year (2s10s) US yield curve holds a special place in their hearts as it has predicted the most recent recessions. At the moment, the 2s10s US curve trades at an extremely inverted level that has been seen only twice in the past 40 years. What were the economic conditions that led up to this inversion in these two occasions, and what was the market performance after this inversion?
Curve inversion at extreme levels
Before delving into our findings, we have to acknowledge the fact that the period since December 2008, when the first Fed QE programme was implemented, has not been beneficial to the price discovery mechanism. Interventions by the key central banks globally have clearly distorted market pricings. Having said that, the US 2s10s curve is currently trading below -75 bps. This level of inversion was recorded in just two instances the past 40 years, in 1982 and the 2000. These periods are quite dissimilar when examining the economic conditions leading up to the curve inversion.
First instance: February 17, 1982
This period resembles a lot what the world has been going through for the past 1.5 years. Following the 1979 events in the Middle East, oil prices skyrocketed, pushing headline and core inflation rates to record highs. The then Fed Chairman Volcker tried to squeeze inflation by hiking rates, but two recessions took place during the January 1980-November 1982 period. The key difference with today's situation is that in 1982 Fed officials were facing double-digit unemployment rates, the highest since 1941. Currently, unemployment rates are close to record low levels in most countries.
Second instance: May 4, 2000
The dotcom bubble burst in March 2000, which wiped out $5 trillion from stock markets’ capitalization, was one of the key culprits for the curve inversion. The aggressive hikes and the September 11, 2001 events pushed the US to a recession. It was relatively short-lived, from March 2001 to November 2001, and the economic impact in both inflation and unemployment was limited, a completely different situation to the one experienced now globally.
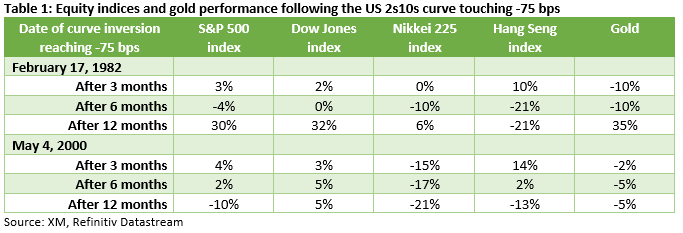
Performance three, six and 12 months after the curve inversion hit the -75 bps level
We have selected the specific level in order to identify the true points of severe curve inversion, and have analysed the performance of key assets in both the 1982 and 2000 periods. Table 1 above shows our findings for four stock indices and gold in an attempt to uncover common trends. The Dow Jones index appears to have positive performance in both periods and across the timeframes examined. Zooming in to specific timeframes, we can see a tendency by both the Nikkei 225 index and gold to underperform three and six months after this severe market inversion take places. Finally, the Hang Seng index appears to rally in the first three months post the curve inversion, but it underperforms significantly at the 12-month timeframe in both 1982 and 2000 periods.
FX and yield performance: common themes arising
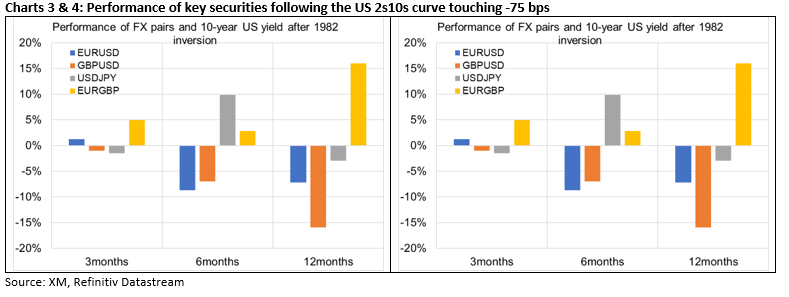
The 10-year US treasury yield is seen dropping in both periods and across the timeframes examined. The drop was more significant in 1982, but the 10-year yield was trading closer to 14.5% back then. Interestingly, the picture is much clearer in the FX world. Both the dollar and euro are seen outperforming sterling across the three, six and 12 months examined and in both the 1982 and 2000 periods, reflecting a lack of confidence for the UK in crisis times. Overall, our findings clearly point to dollar outperformance, which is not unexpected considering the safe-haven flows taking place in such periods.
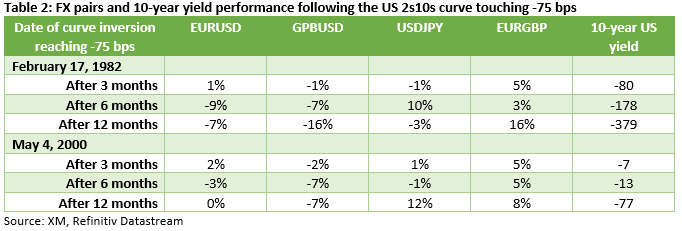
To sum up, the US 2s10s yield curve is trading at extreme inverted levels only seen twice in recent history, in 1982 and 2000. In both periods a recession ensued, justifying the perceived predictive ability of the curve inversion. We had a look at the performance of key securities in the main asset classes post this severe curve inversion and four themes have emerged: 1) the dollar tends to outperform against the remaining major currencies, 2) the euro records gains against sterling, partly confirming its status as the second reserve currency, 3) the 10-year US yield appears to drop aggressively after the acute inversion is recorded, and 4) Dow Jones appears to have positive performance in both periods and across the timeframes examined.