

Sample Category Title
USD/JPY Dips as Tokyo Core CPI Rises
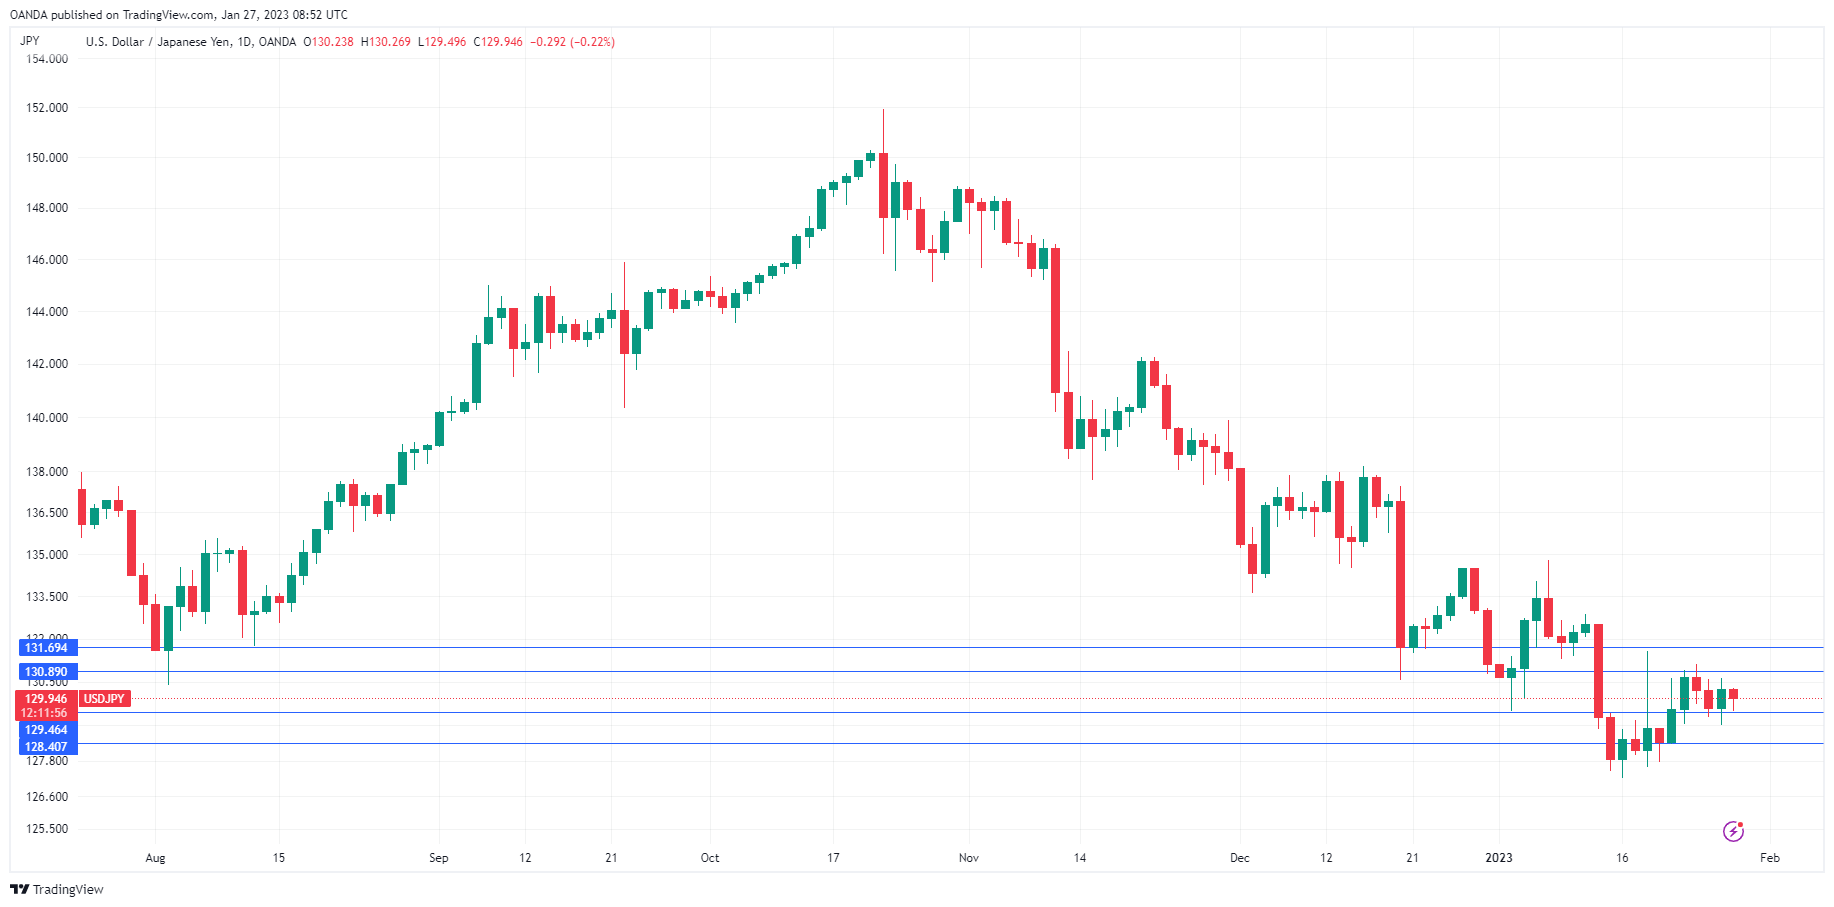
The Japanese yen is in positive territory on Friday. In the European session, USD/JPY is trading at 129.76, down 0.33%.
Tokyo CPI hits 4.3%
Inflation indicators in Japan continue to head northwards. Tokyo Core CPI rose to 4.3% y/y in January, up from 3.9% in December and ahead of the consensus of 4.2%. This is the highest level in 42 years, but what is more worrying for the Bank of Japan is that the indicator has exceeded the central bank’s target of 2% for the eighth straight month. The increase was broad-based, with food and fuel prices the main contributors to the increase.
The Tokyo Core CPI reading follows other inflation indicators which have hit decades-high levels, adding pressure on the BoJ to exit its stimulus programme. The BoJ insists that inflation will peak at 3% in March. but this view seems over-optimistic, given the trend we’re seeing from inflation data. BOJ Governor Kuroda has said he will maintain the Bank’s ultra-loose policy until wages increase, which would indicate that inflation is driven by domestic demand rather than cost-push factors. Kuroda winds up his term in April, and the new Governor could decide to tighten policy, which would boost the yen.
US GDP climbed 2.9% y/y in Q4, down from 3.2% in Q3 but still a respectable clip. Will the US be able to avoid a recession? The answer isn’t clear, as the economic data shows a mixed picture. The employment market remains robust and overall growth has been positive. Manufacturing and Services PMIs continue to show that these sectors are contracting and housing has been especially weak, as it lowered Q4 GDP by about 1.3%. Much will depend on the strength of consumer spending, which accounts for some 68% of GDP. Consumer spending rose 2.1% in Q4, down slightly from 2.3% in the third quarter. However, the December release is worrying, as consumer spending declined by 1.1%. If this trend continues, it seems likely that the US economy will tip into a recession.
USD/JPY Technical
- 129.46 is a weak support level. The next support line is 128.40
- There is resistance at 130.89 and 131.69
GBPJPY Consolidates as Latest Rebound Falters
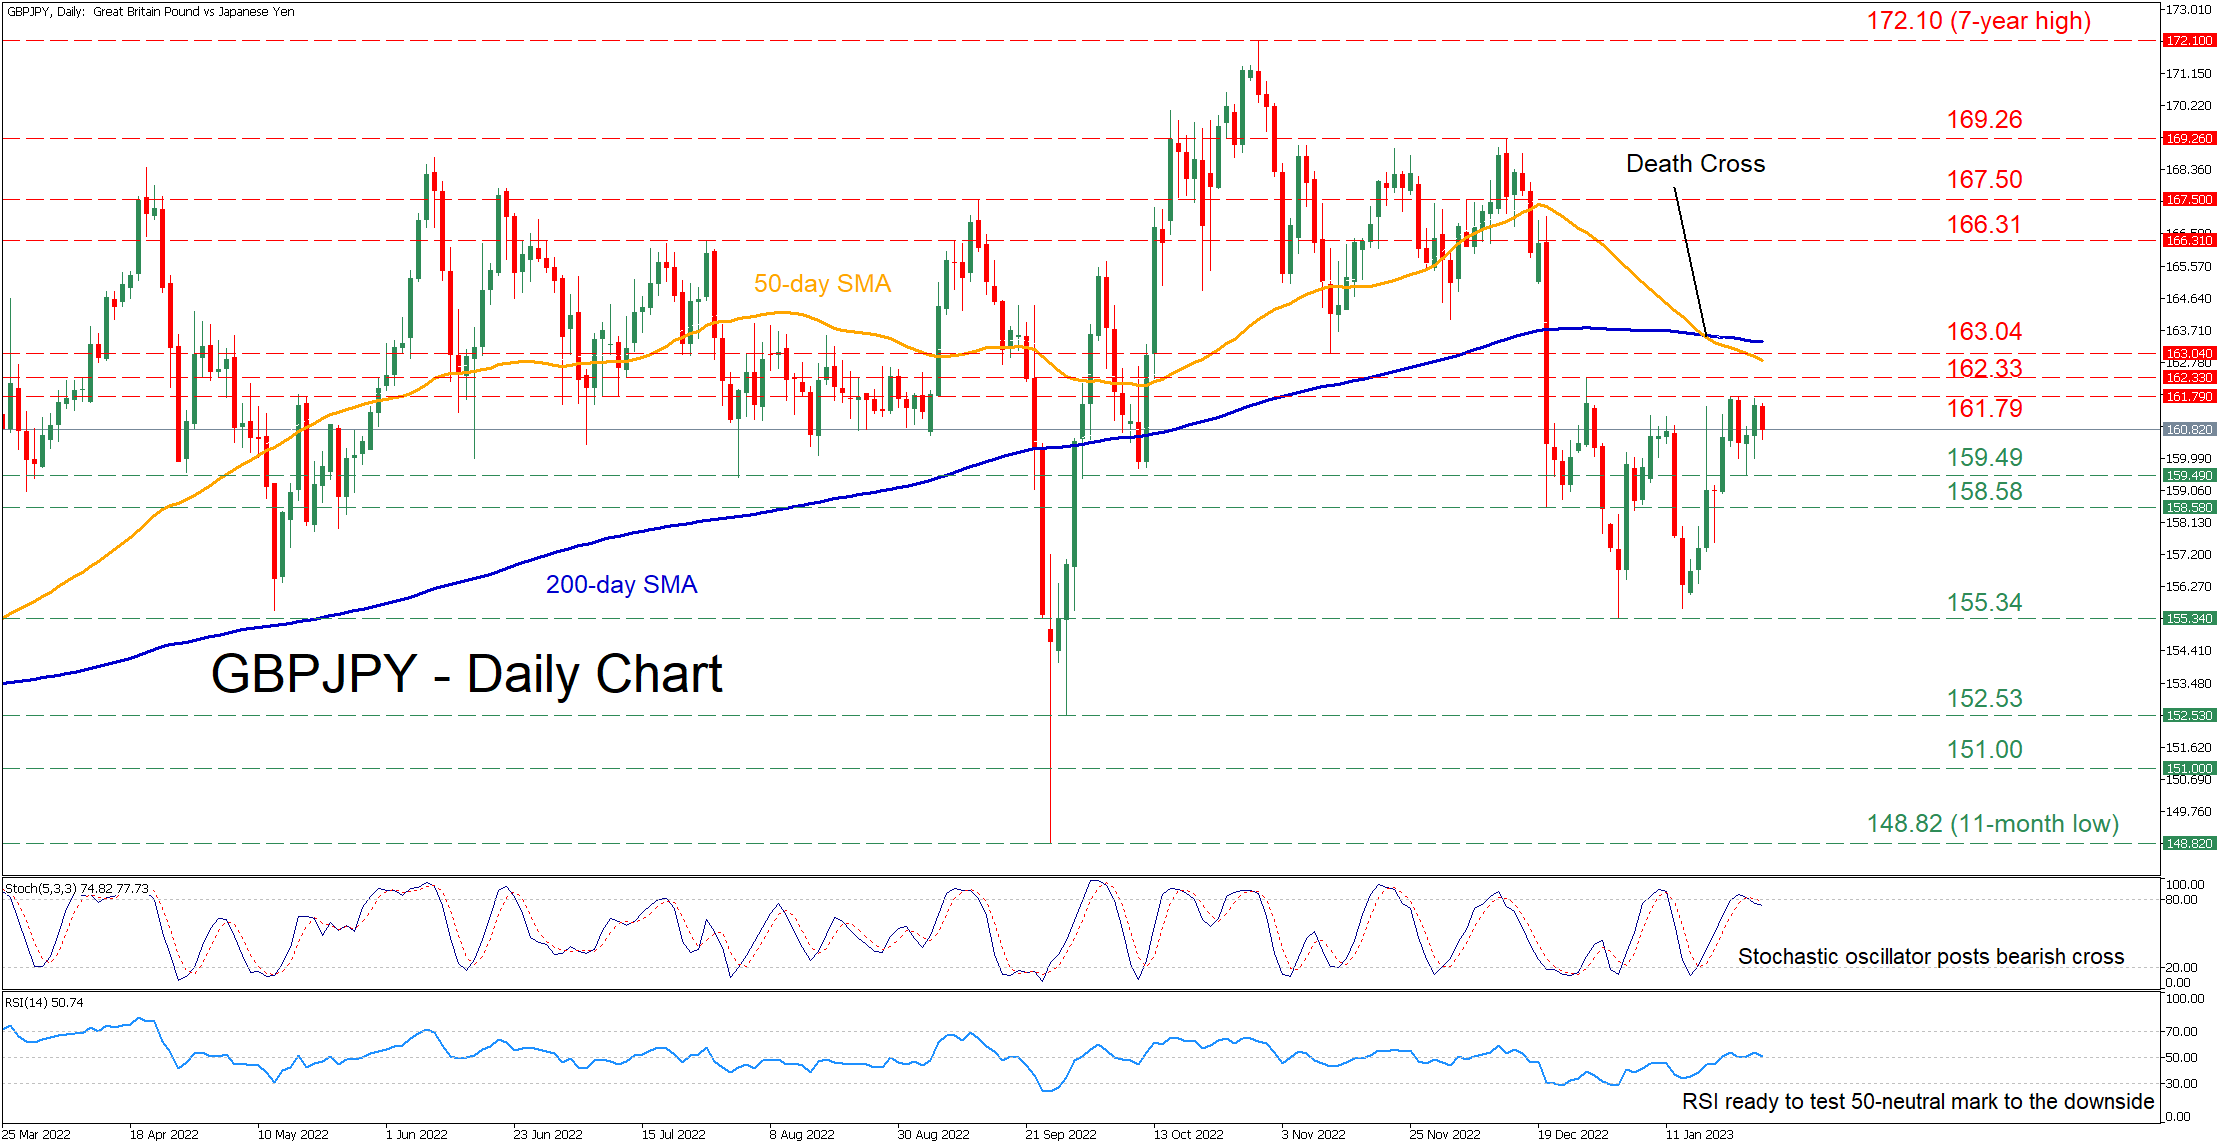
GBPJPY has been trending downwards after recording a fresh seven-year high of 172.10 in early November. In the short-term, the pair is trading without a clear direction, with its latest attempt for recovery being repeatedly held down by the 161.79 ceiling.
The momentum indicators currently suggest that bullish forces are waning. Specifically, the stochastic oscillator is descending after posting a bearish cross near the overbought zone, while the RSI appears ready to exit the 50-neutral territory to the downside.
Should the negative momentum strengthen, the pair could descend to test its recent support of 159.49. If that floor collapses, the spotlight could shift to the 158.58 barrier before the 2023 bottom of 155.34 curbs further declines. A break below the latter could pave the way for the March low of 151.00.
To the upside, bullish actions might initially propel the price above the recent resistance of 161.67. Surpassing that zone, the pair could challenge the 162.33 hurdle before the inside swing low of 163.04 comes under examination. Failing to halt there, the July resistance of 166.31 may prove to be the next obstacle for the bulls to overcome.
In brief, GBPJPY has been moving sideways in the past few daily sessions, appearing unable to adopt a clear directional impetus. Nevertheless, a profound break above or below its recent range could trigger a decisive move towards the same direction.
AUDUSD Boosts Monthly Gains; August’s Top in Focus
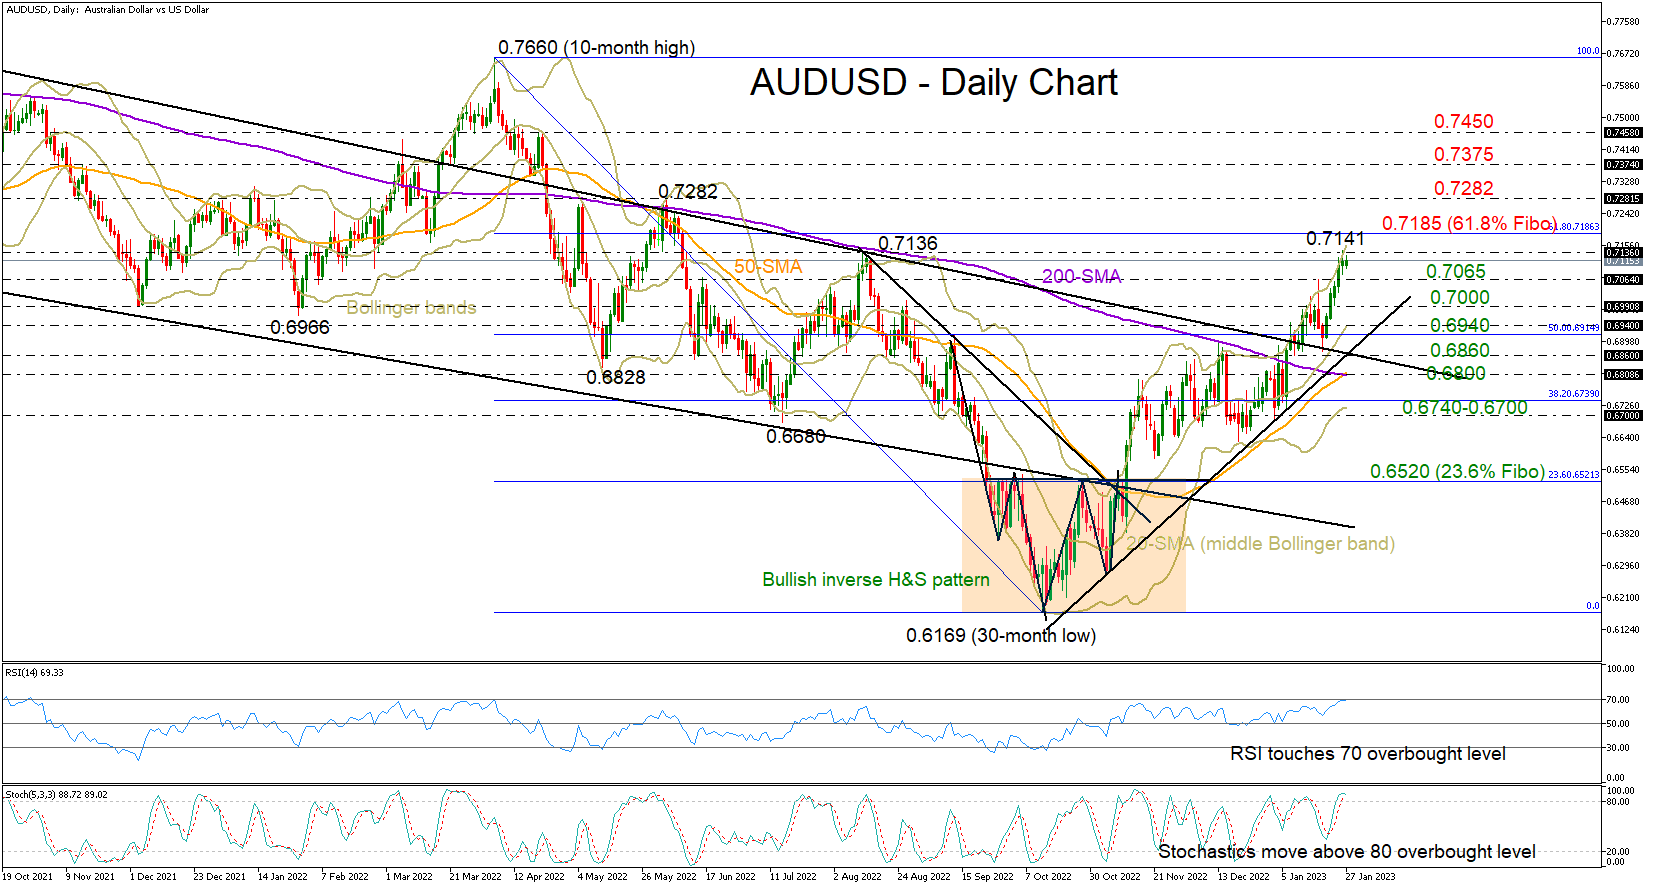
AUDUSD is set for its third monthly gain, having been trading bullish almost every single week since the slump to a 30-month low of 0.6169 in mid-October,.
The pair is currently flirting with August’s high of 0.7136, while the 61.8% Fibonacci retracement of the 0.7660-0.6169 downtrend might be another warning zone at 0.7185 as the RSI and the Stochastics flag overbought conditions. Note that the price keeps fluctuating around the upper Bollinger band area, increasing the odds of a downside correction as well.
Nevertheless, the positive trend in the short-term picture looks healthy and the progressing golden cross between the 50- and 200-day simple moving averages (SMA) is suggesting that any downside move might be temporary and part of the bullish course.
If the pair slides below 0.7065, it may seek support near the 0.7000 psychological mark before confronting the 0.6940-0.6860 zone, which encapsulates the 50% Fibonacci level, the 20-day SMA, and two key constraining trendlines. A break lower and beneath the 0.6800 number would downgrade the short-term outlook to neutral, bringing the 0.6740-0.6700 region next on the radar. A steeper decline could tackle the 0.6600 level.
Should the bulls clear the 0.7136-0.7185 resistance territory, they may next head for June’s bar of 0.7282. Another success there may open the door for the 0.7375 barrier, while higher, the uptrend may stretch up to 0.7450.
Summing up, AUDUSD is preserving a bullish bias in the short-term picture, aiming for new higher highs. Yet some consolidation could be possible as the pair seems to have reached overbought levels.
GBP/USD: Bulls Face Strong Headwinds But Remain in Play, US Inflation Data in Focus
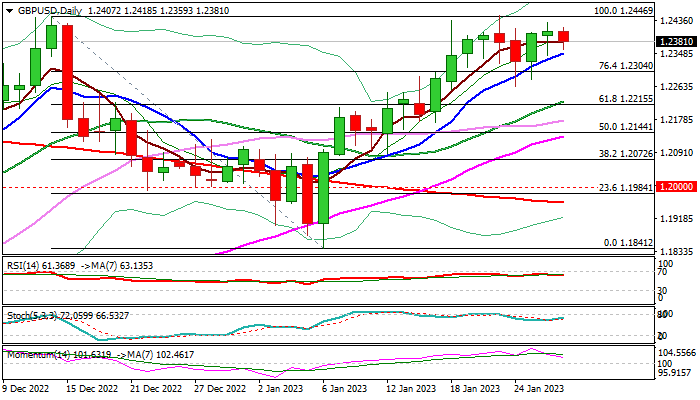
Cable edges lower in early Friday’s trading as bulls continue to face headwinds and repeatedly failing to sustain gains above 1.24 mark, keeping the price action in sideways mode for one week.
Strong barrier at 1.2446 (base of falling weekly cloud/Dec 14 top) continues limit recovery leg from 1.1841 (Jan 6 low), though near-term action is expected to keep bullish bias while holding above 1.2263 (Jan 24 higher low).
Daily techs are weakening on fading bullish momentum and south-heading RSI, but MA’s remain in bullish setup, with 10DMA offering initial support at 1.2349 ahead of 1.2263 pivot. Thick daily cloud also underpins (cloud top lays at 1.2166).
Limited advance was seen on Thursday, following stronger than expected US Q4 GDP, while traders turn focus to US PCE data, the Fed’s preferred inflation measure, to get more clues about the central bank’s next steps.
Res: 1.2446; 1.2500; 1.2527; 1.2589.
Sup: 1.2349; 1.2304; 1.2263; 1.2216.
Technical Outlook and Review
USD/JPY:
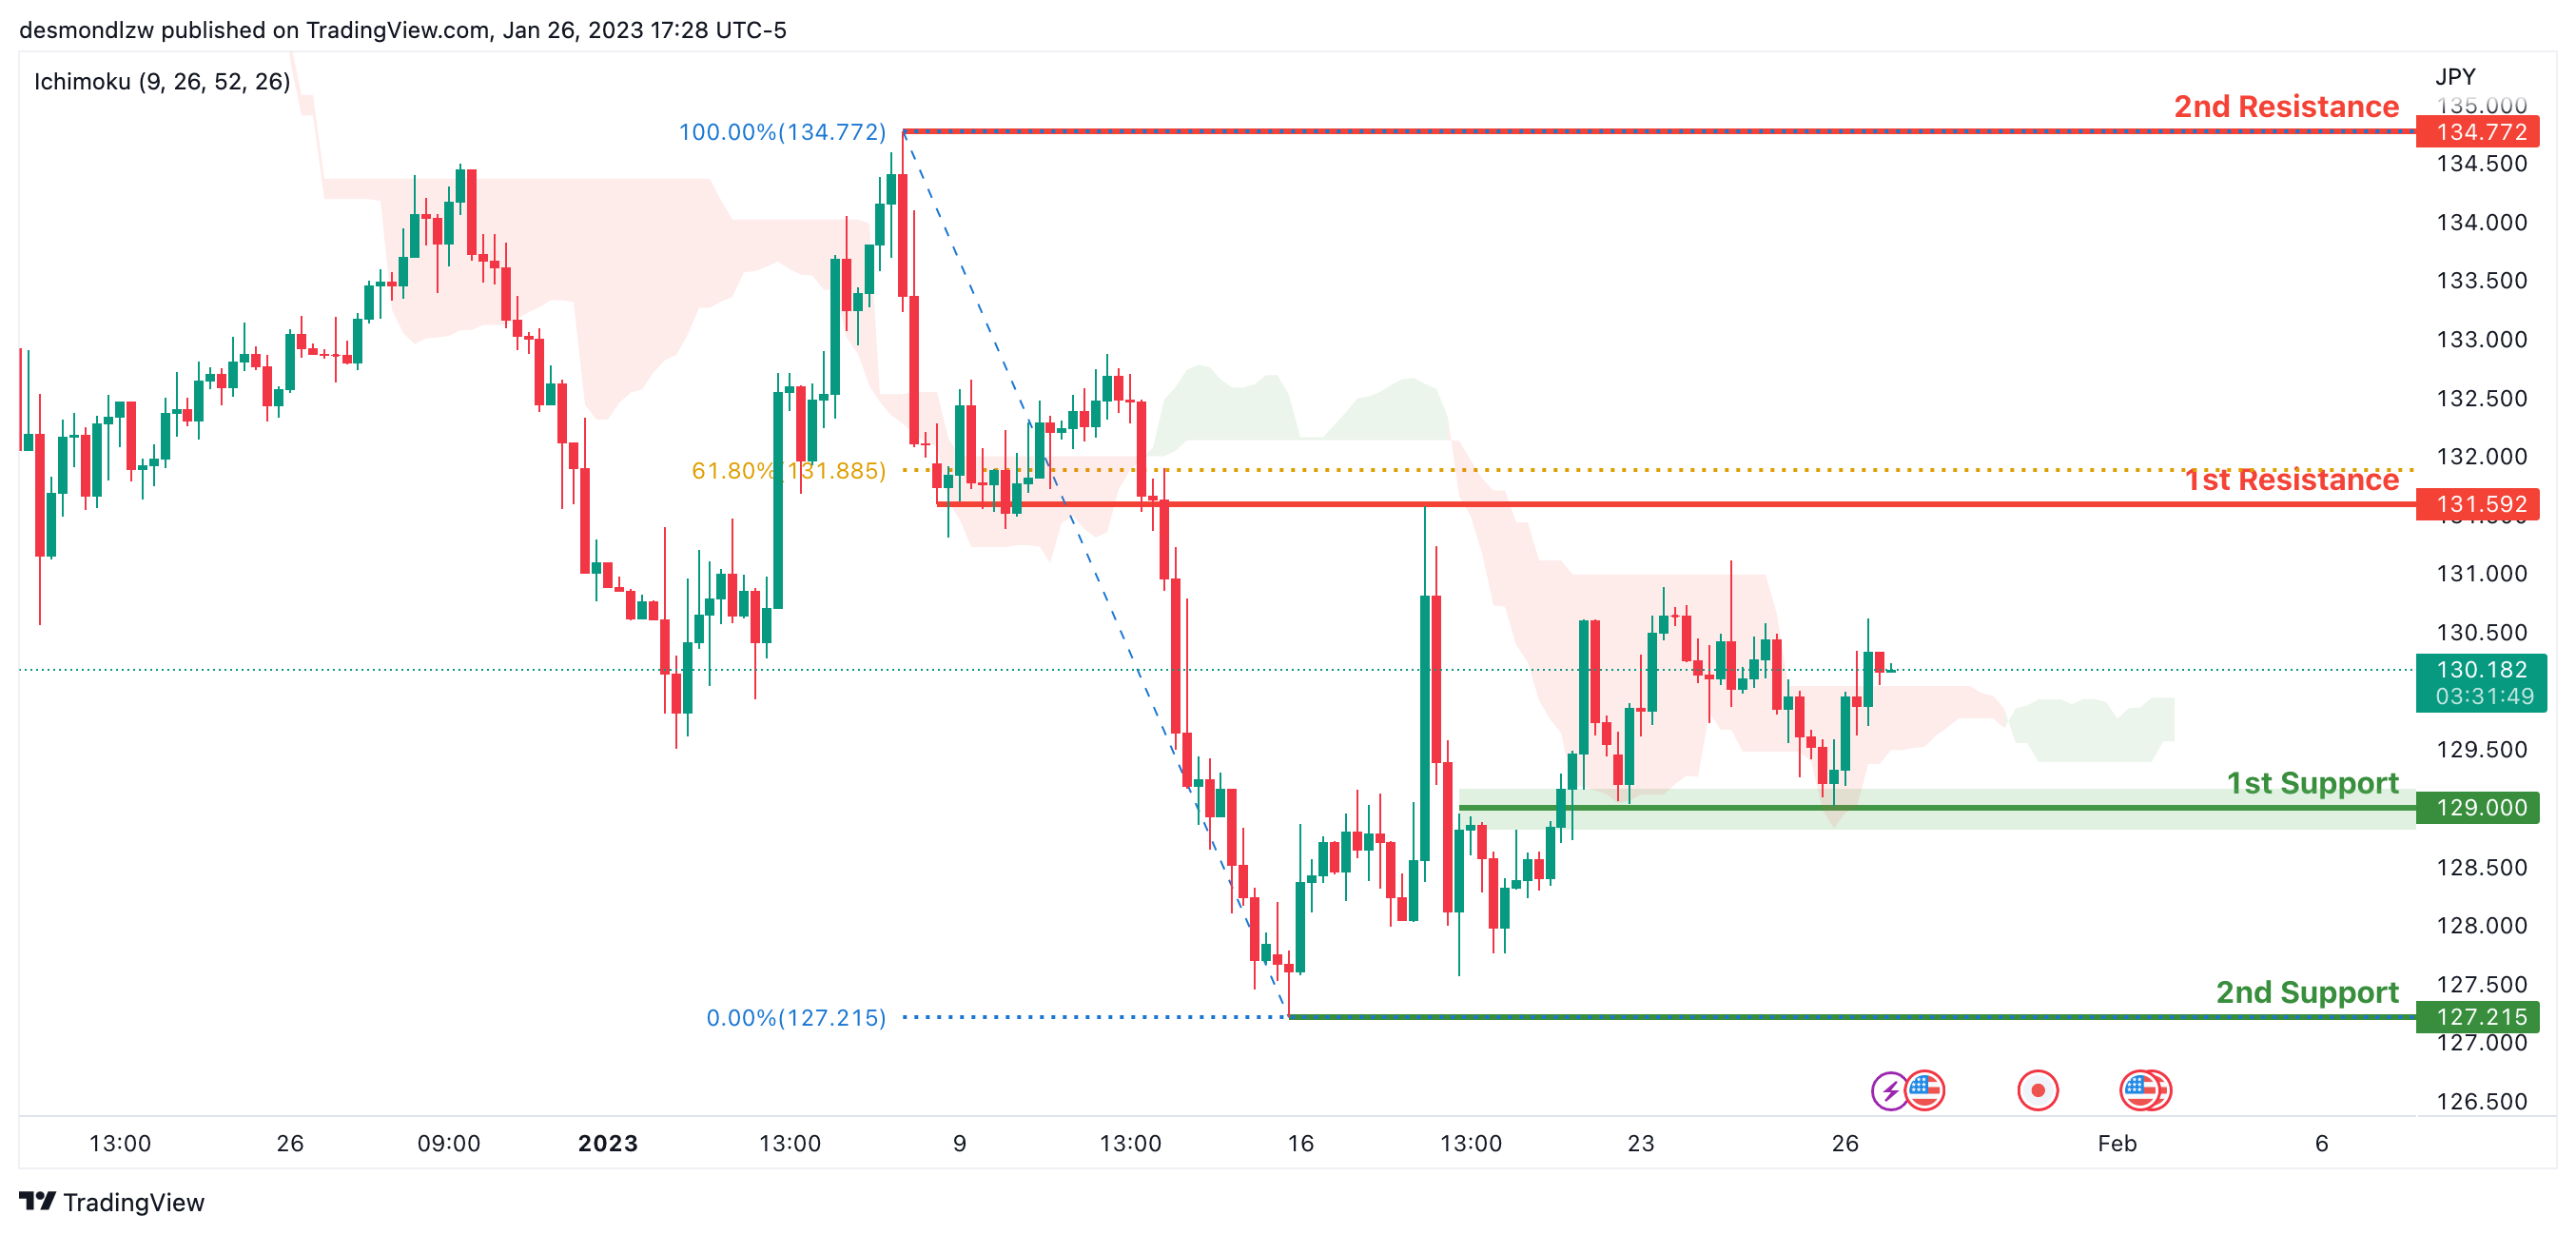
Looking at the H4 chart, my overall bias for USDJPY is bullish due to the current price crossing above the Ichimoku cloud, indicating a bullish market. If this bullish momentum continues, expect the price to possibly continue heading towards the 1st resistance level at 131.592, where the 61.8% Fibonacci line is. In an alternate scenario, price could possibly head back down to retest the 1st support at 129.000, where the overlap support is.
Areas of consideration:
- H4 time frame, 1st resistance at 131.592
- H4 time frame, 1st support at 129.000
DXY:
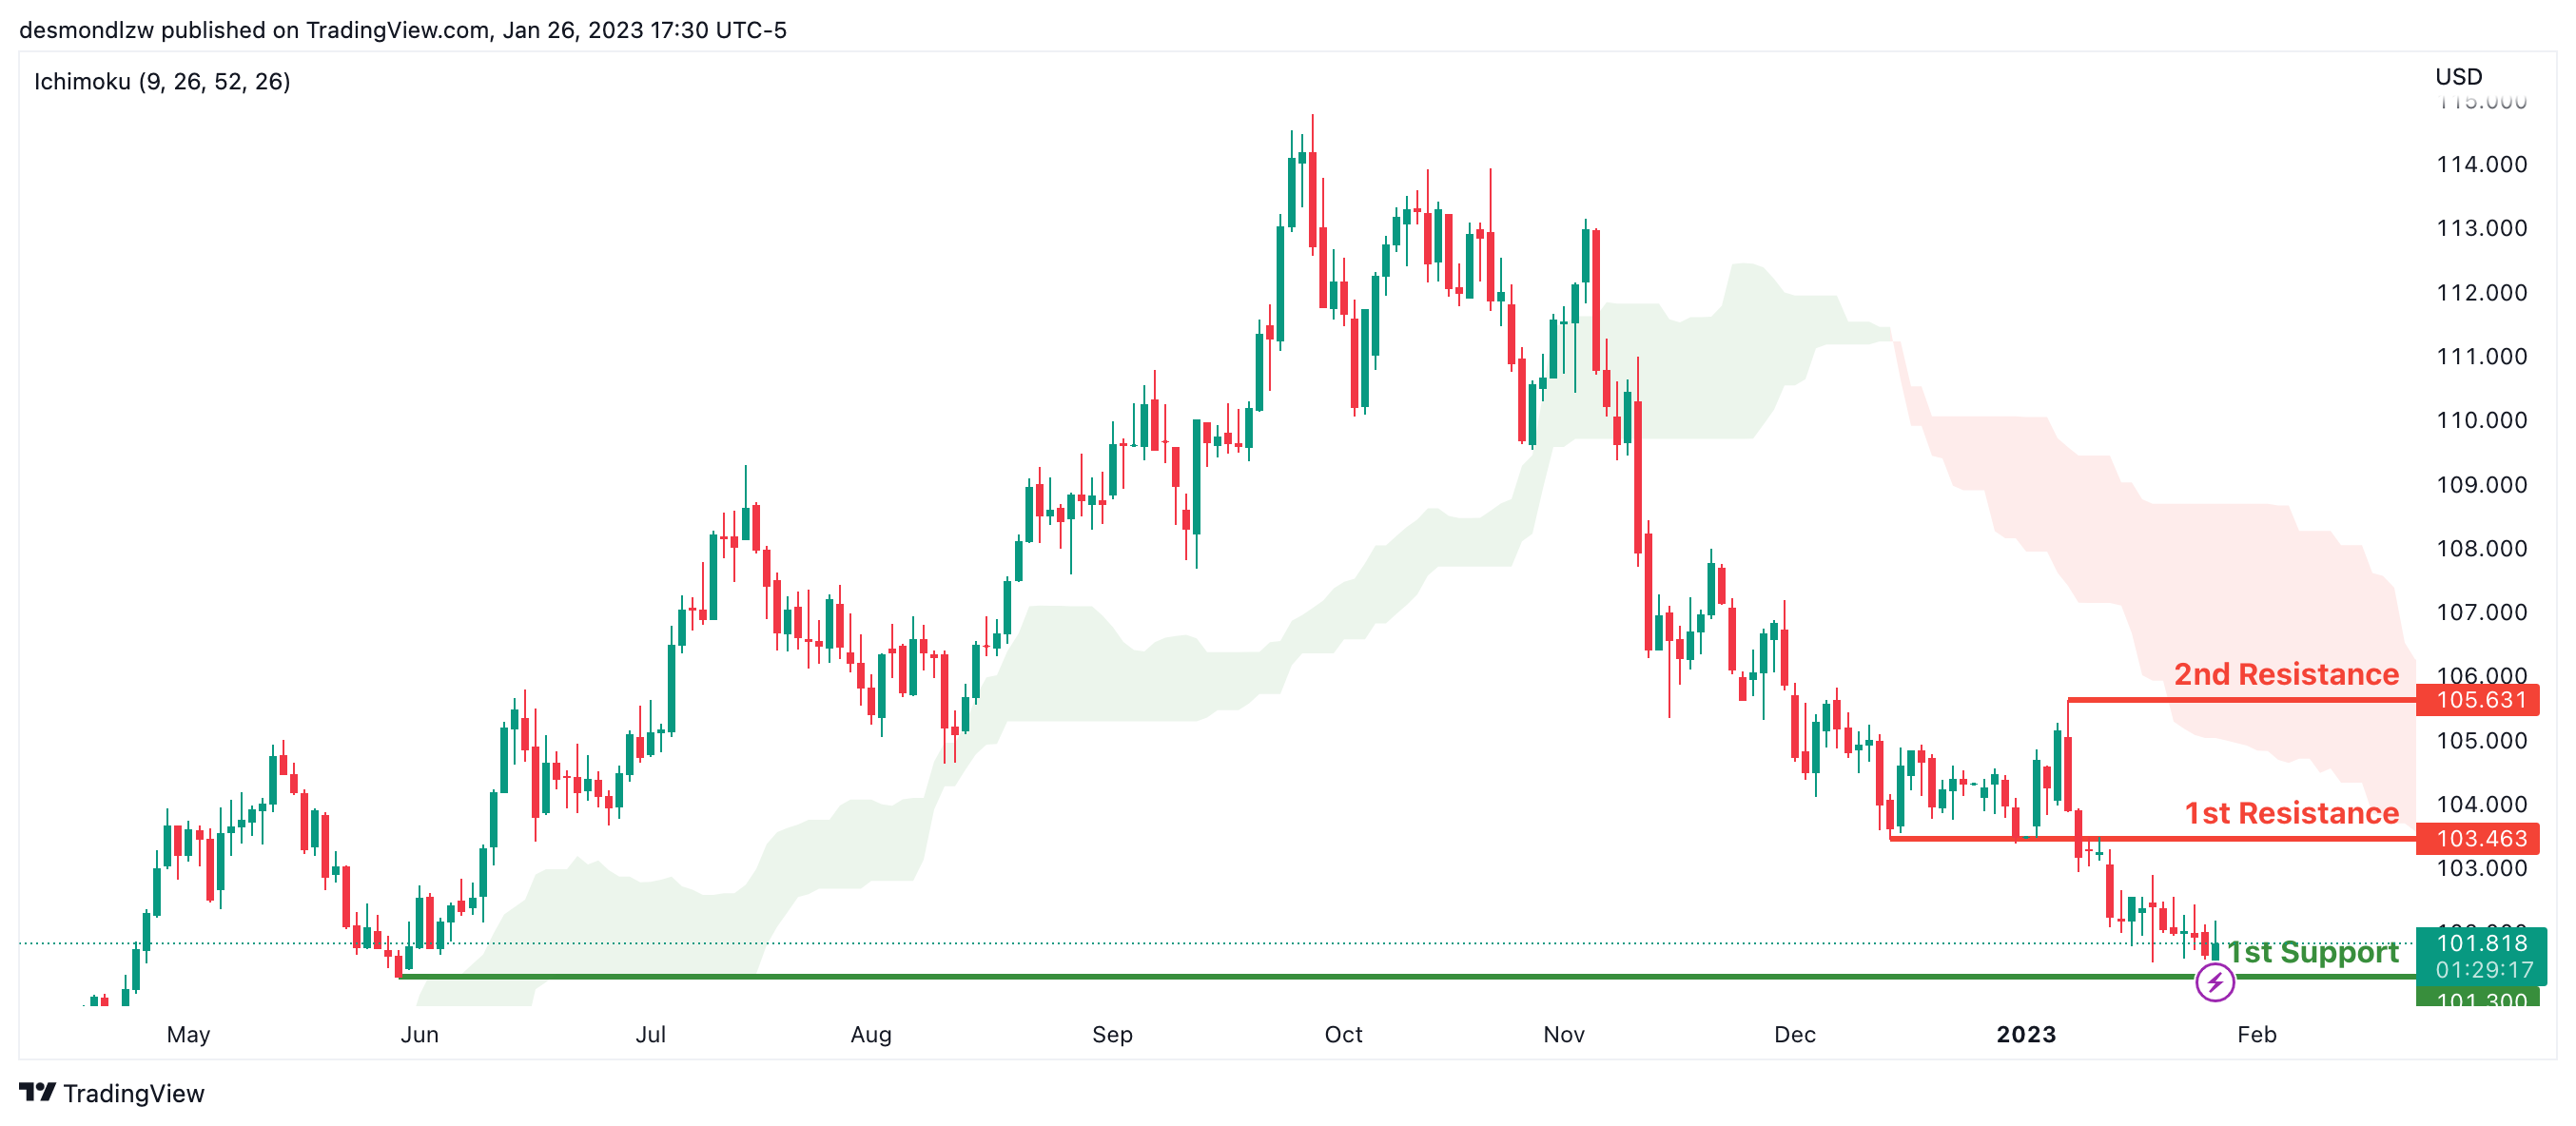
Looking at the Daily chart, my overall bias for DXY is bearish due to the current price being below the Ichimoku cloud, indicating a bearish market. If this bearish momentum continues, expect the price to possibly continue heading towards the 1st support at 101.300, where the previous low is. In an alternative scenario, price could head back up to retest the 1st resistance at 103.463, where the overlap resistance is.
Areas of consideration:
- H4 time frame, 1st resistance at 103.463
- H4 time frame, 1st support at 101.300
EUR/USD:
Looking at the Daily chart, my overall bias for EURUSD is bullish due to the current price being above the Ichimoku cloud, indicating a bullish market structure. To add confluence to this bias, price is also within an ascending channel. If this bullish momentum continues, expect the price to possibly continue heading towards the 1st resistance at 1.09445, where the 50% Fibonacci line is. In an alternate scenario, price could possibly head back down to retest the 1st support level at 1.07120, where the 50% Fibonacci line is.
Areas of consideration :
- H4 1st resistance at 1.09445
- H4 1st support at 1.07120
GBP/USD:
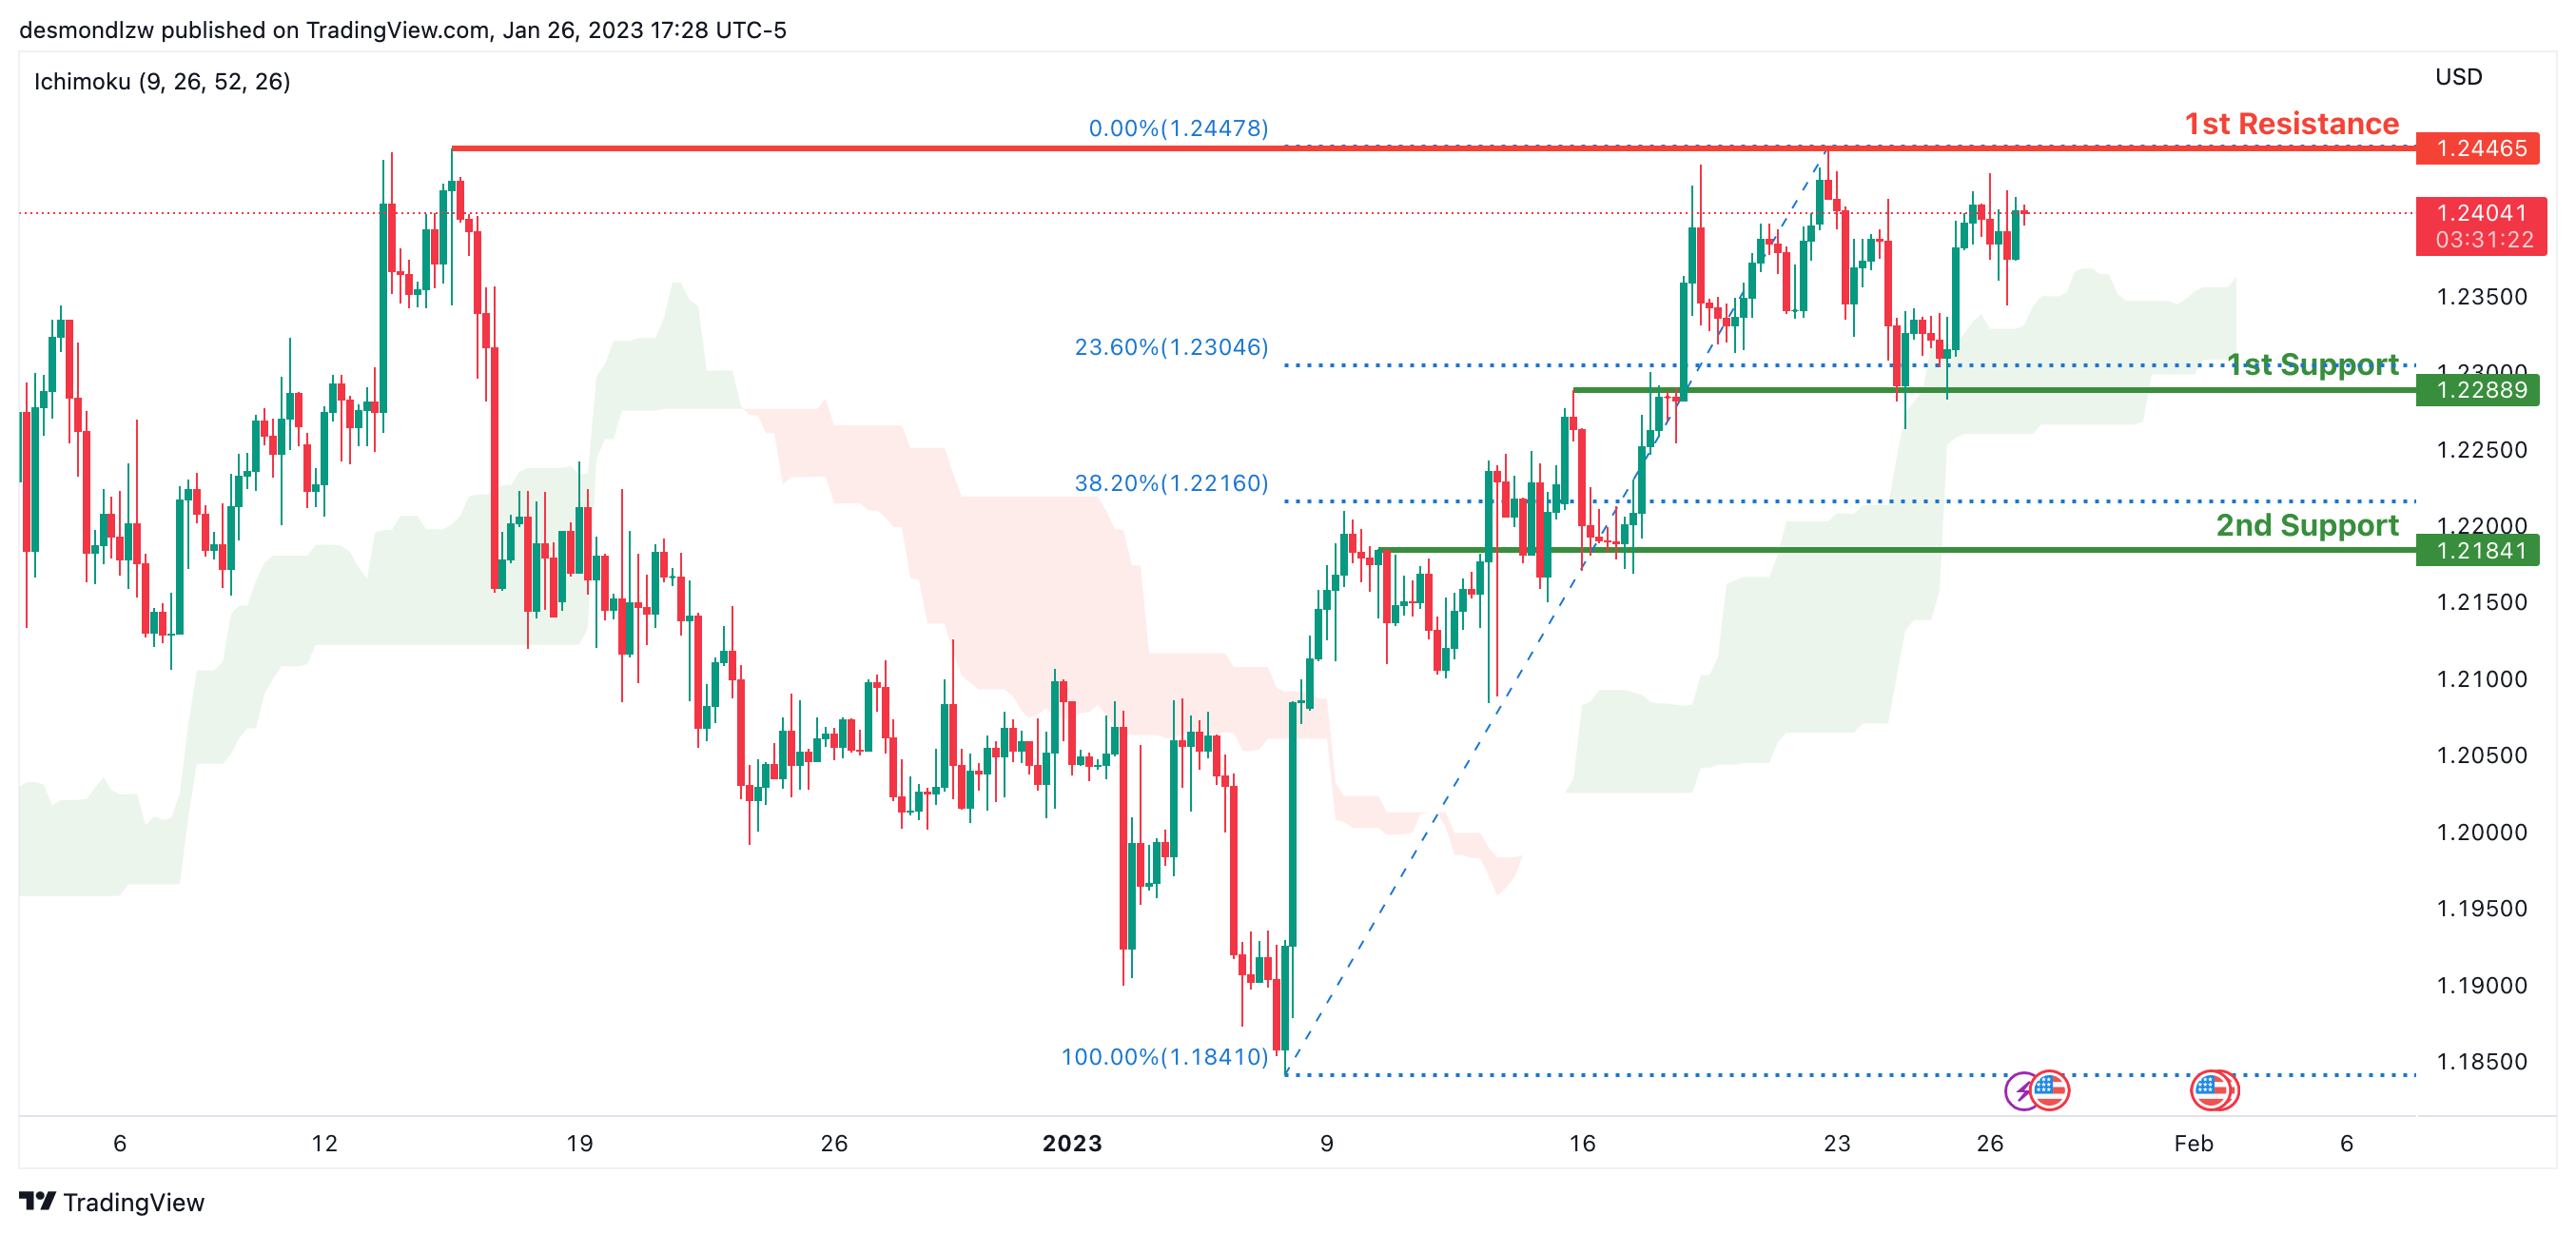
Looking at the H4 chart, my overall bias for GBPUSD is bullish due to the current price being above the Ichimoku cloud, indicating a bullish market. If this bullish momentum continues, expect price to possibly continue heading towards the 1st resistance line at 1.24465, where the previous swing high is. In an alternate scenario, price could possibly head back down and retest the 1st support at 1.22889, where the 23.6% Fibonacci line is.
Areas of consideration:
- H4 1st resistance at 1.24465
- H4 1st support at 1.22889
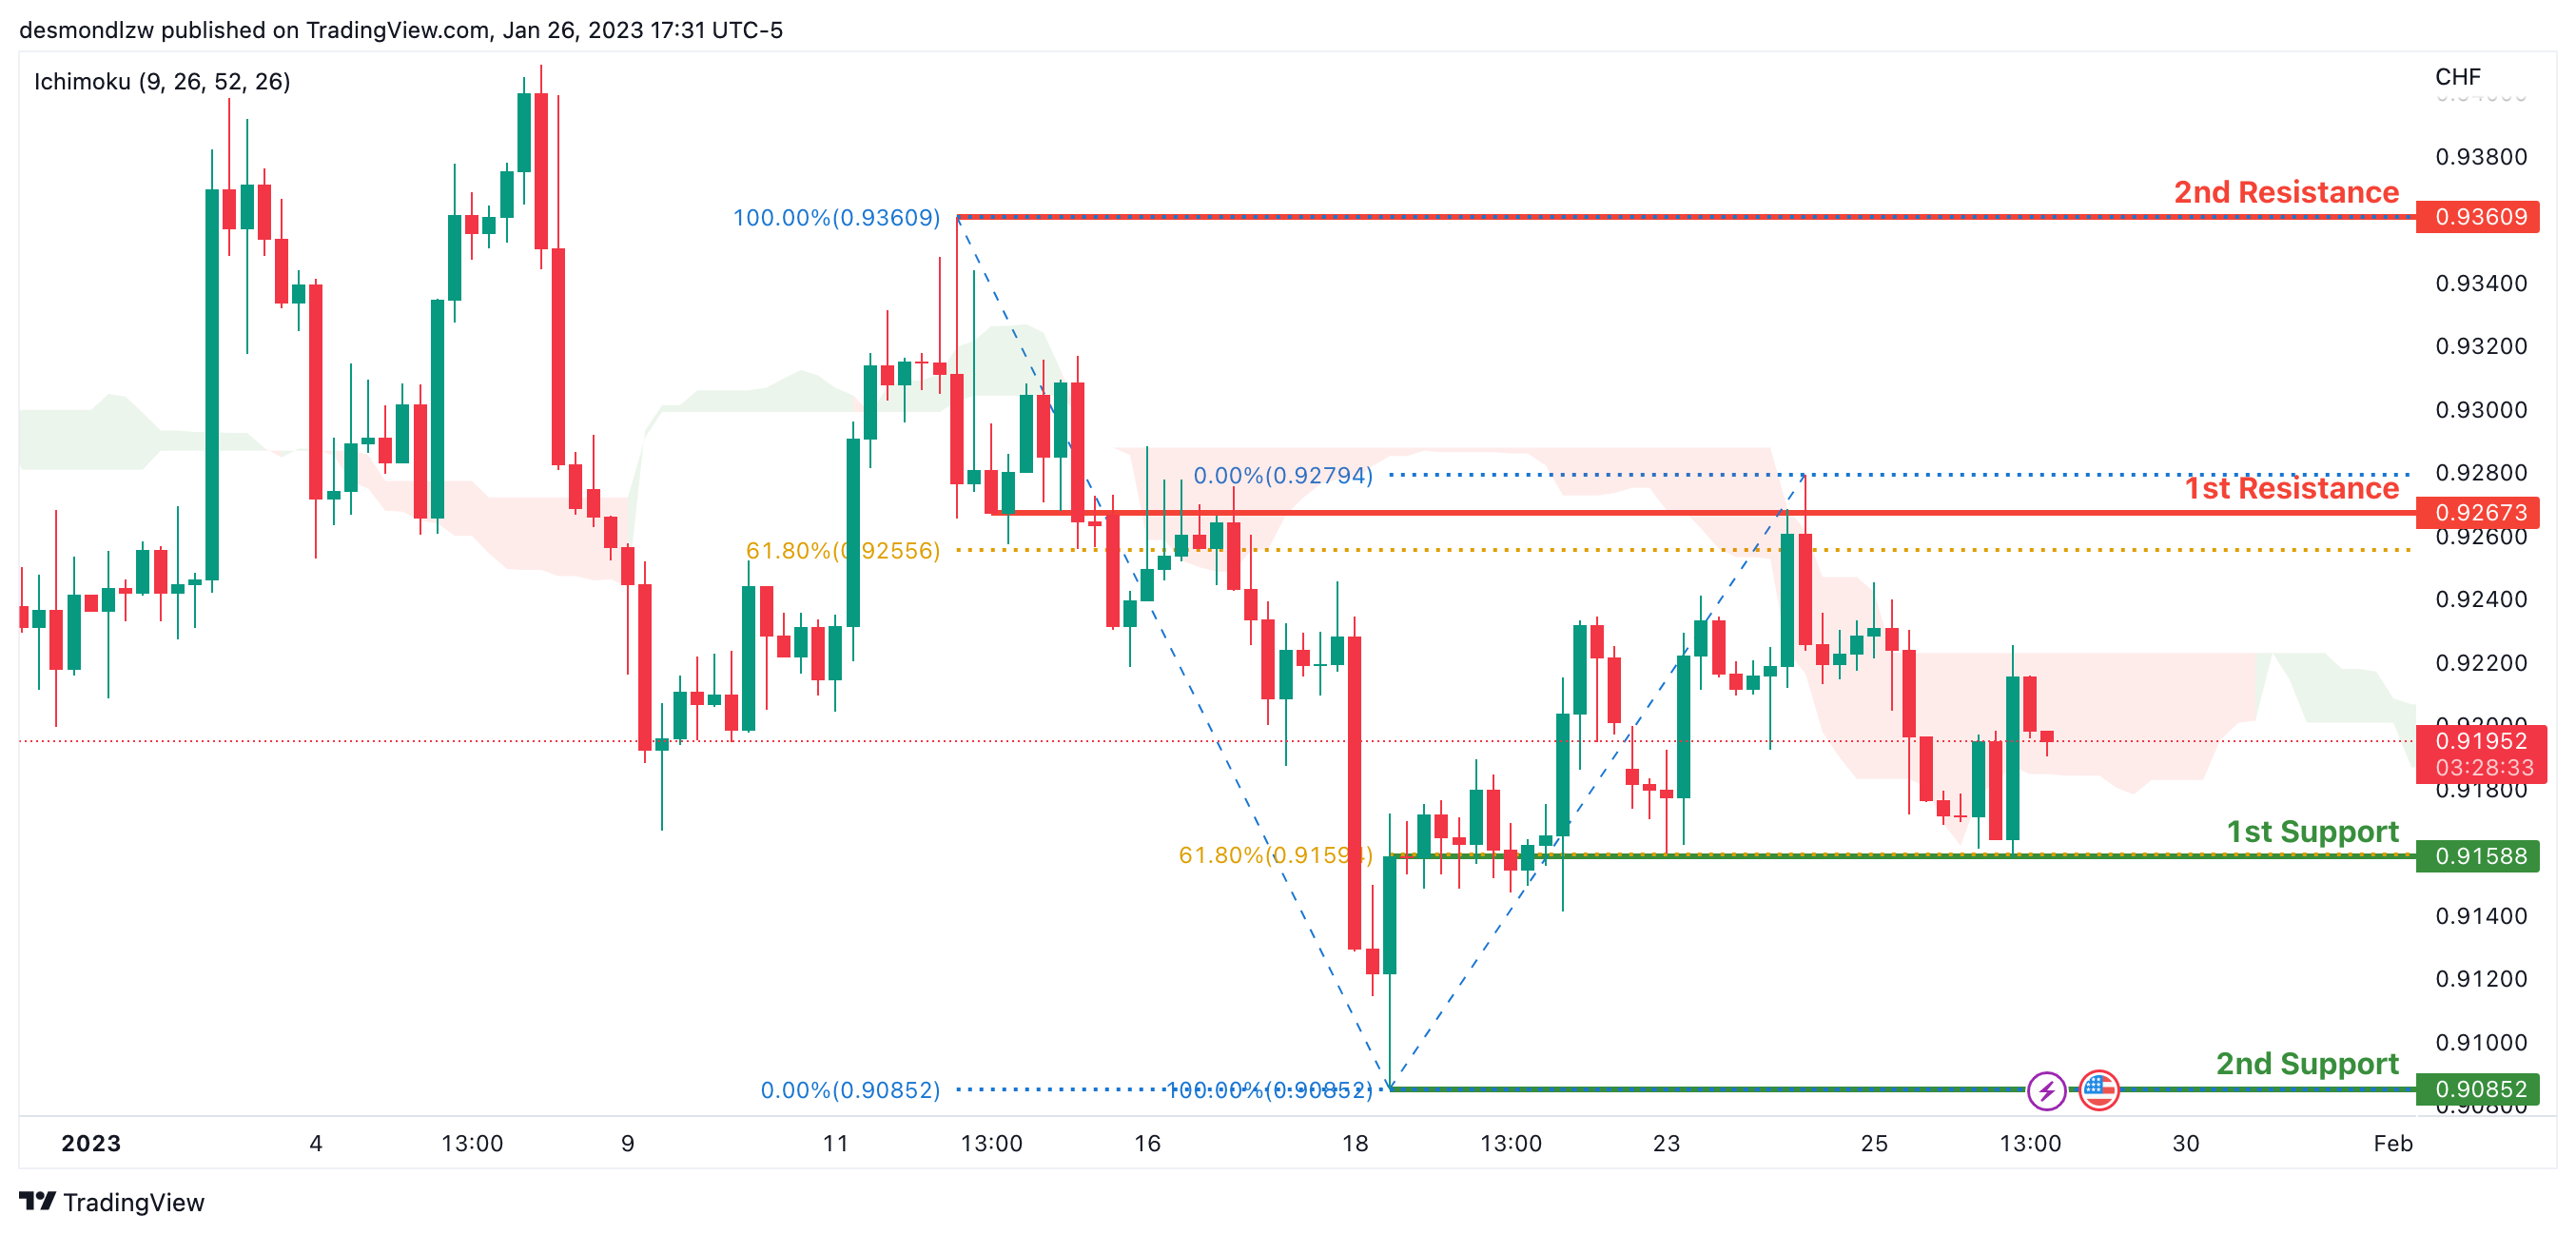
USD/CHF:
Looking at the H4 chart, my overall bias for USDCHF is bearish due to the current price crossing below the Ichimoku cloud, indicating a bearish market. If the current bearish trend continues, expect the price to possibly continue to head towards the 1st support at 0.91588, where the 61.8% Fibonacci line is. In an alternative scenario, price could possibly head back up to retest the 1st resistance at 0.92673, where the 61.8% Fibonacci line is.
Areas of consideration
- H4 1st support at 0.91588
- H4 1st resistance at 0.92673
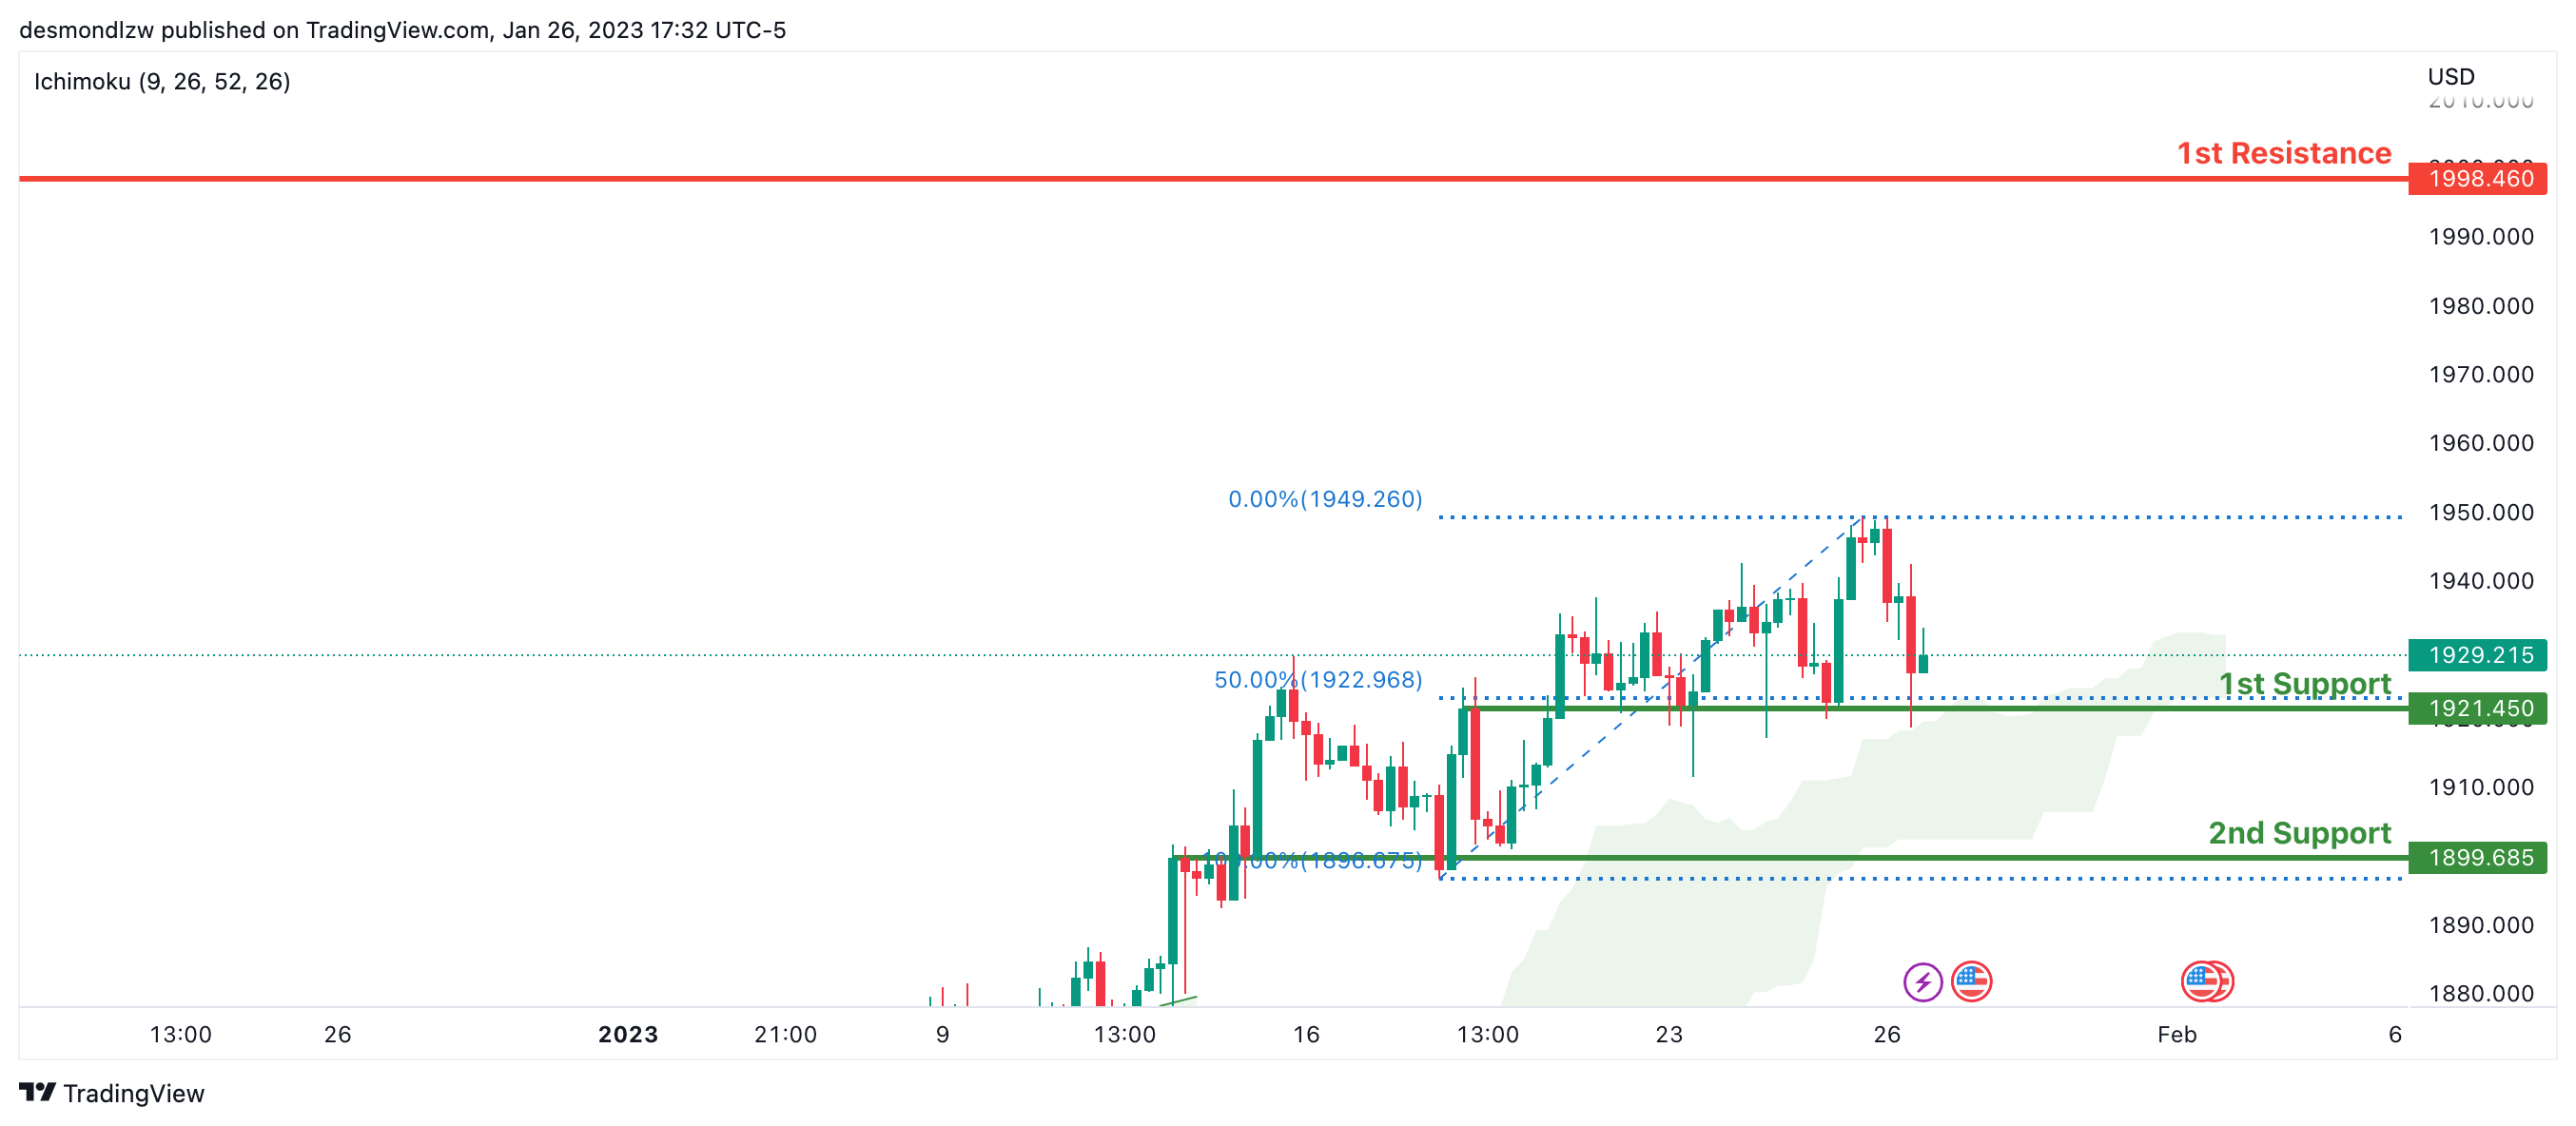
XAU/USD (GOLD):
Looking at the H4 chart, my overall bias for XAUUSD is bullish due to the current price being above the Ichimoku cloud, indicating a bullish market. If this bullish momentum continues, expect the price to possibly continue heading towards the 1st resistance at 1998.460, where the intermediary high is. In an alternative scenario, price could possibly head back down to retest the 1st support at 1921.450 where the 50% Fibonacci line is.
Areas of consideration:
- H4 time frame, 1st resistance at 1998.460
- H4 time frame, 1st support at 1921.450
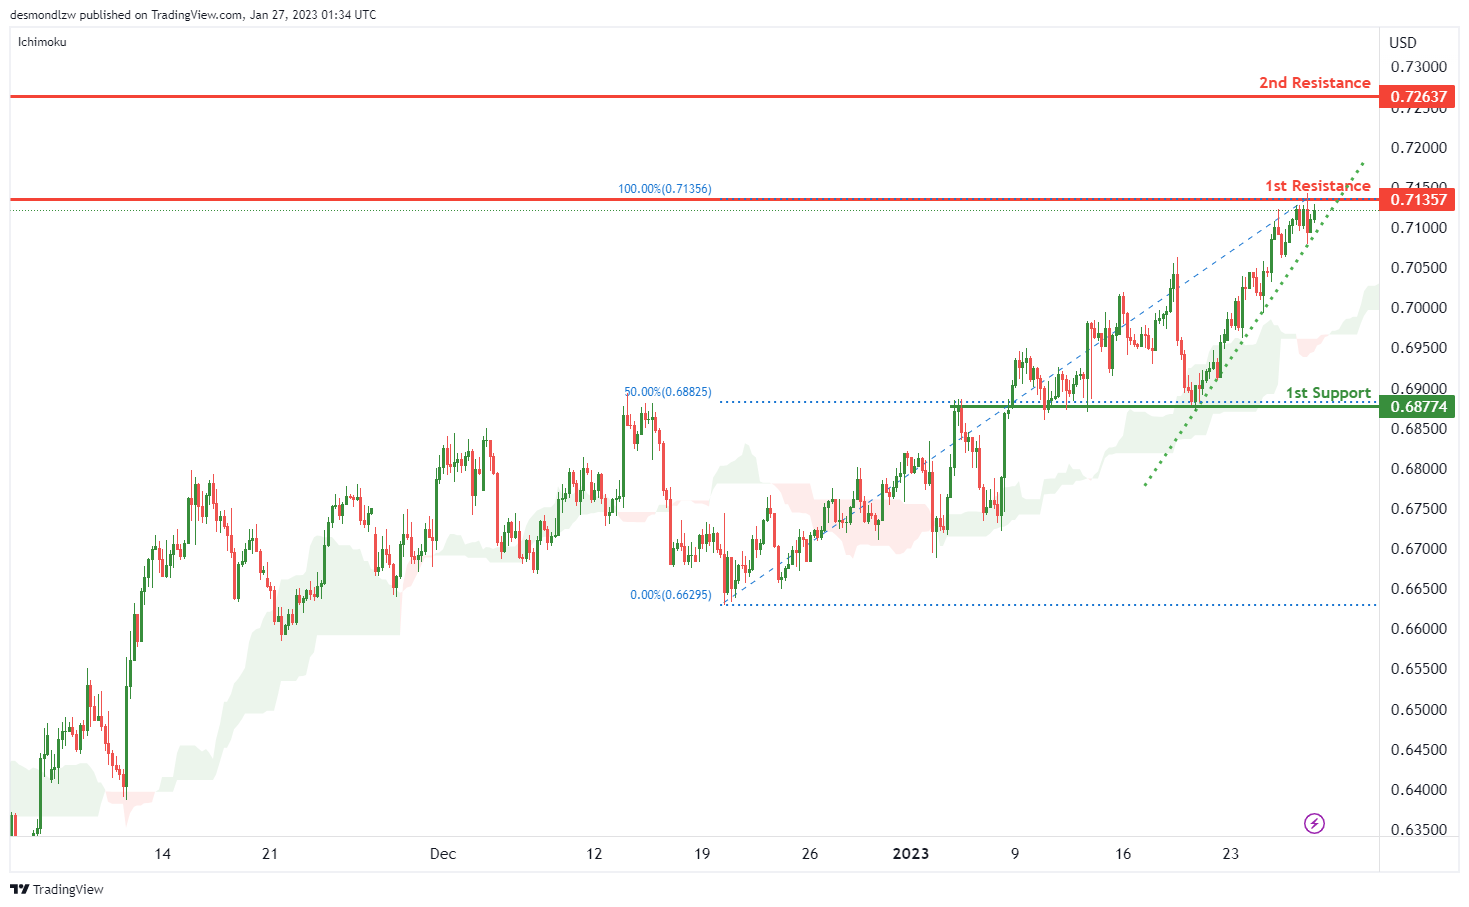
AUD/USD:
Looking at the H4 chart, my overall bias for AUDUSD is bullish due to the current price being above the Ichimoku cloud, indicating a bullish market. To add confluence to this bias, there is an ascending trend line. If this bullish momentum continues, expect price to possibly break through the 1st resistance at 0.71357 and head towards 2nd resistance is at 0.72637.
In an alternate scenario, price could possibly head back down towards the 1st support level at 0.68774, where the 50% Fibonacci line is located.
Areas of consideration
- H4 , 2nd resistance at 0.72637.
- H4. 1st resistance at 0.71357
- H4, 1st support at 0.68774
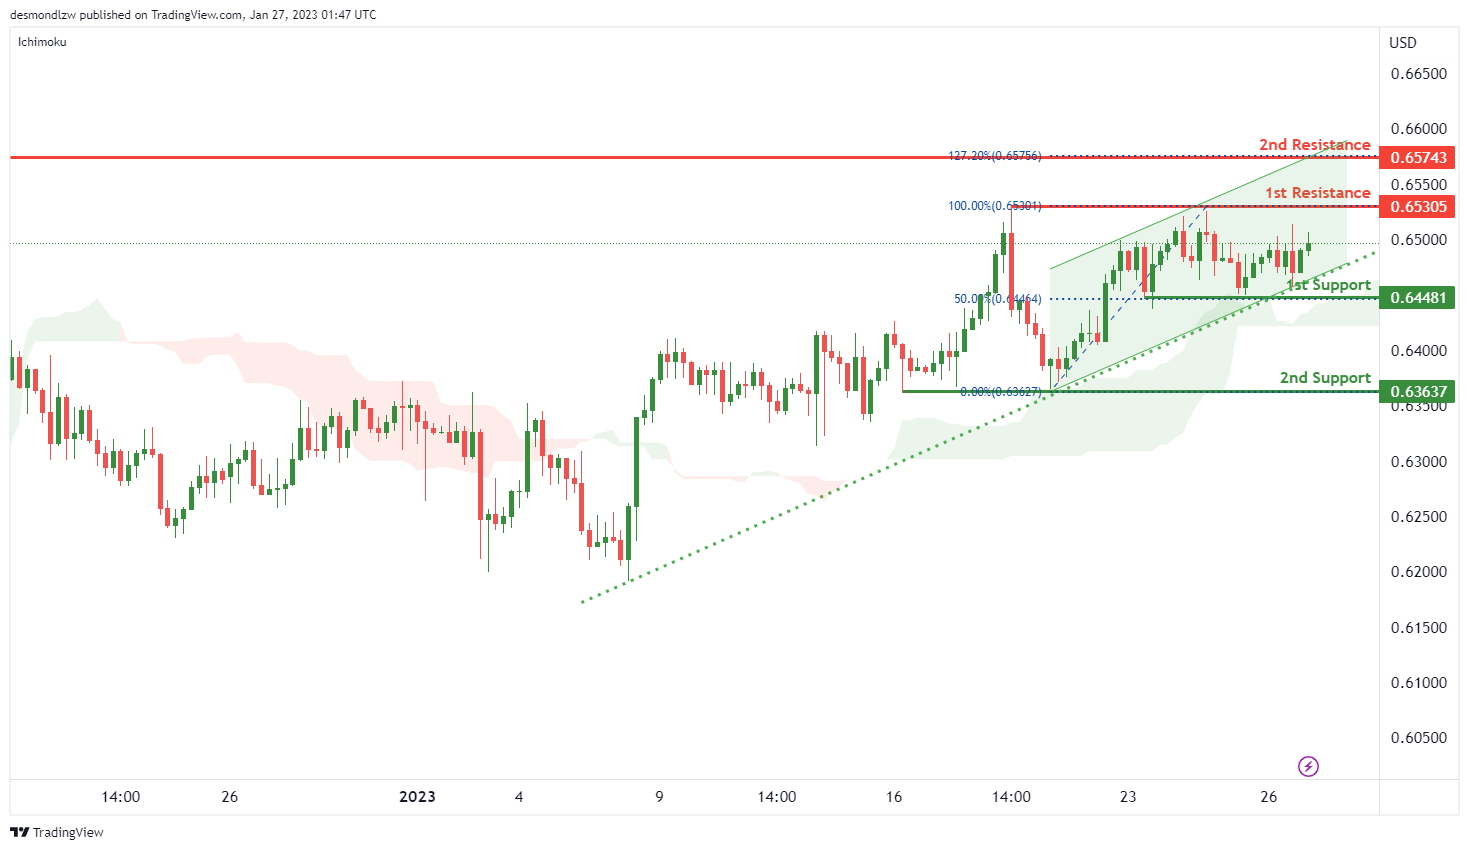
NZD/USD:
Looking at the H4 chart, my overall bias forNZDUSD is bullish due to the current price being above the Ichimoku cloud, indicating a bullish market. To add confluence to this bias, there is an ascending channel. If this bullish momentum continues, expect price to possibly head towards the 1st resistance at 0.65305, and 2nd resistance is at 0.65743, where the 127% Fibonacci line is located.
In an alternate scenario, price could possibly head back down towards the 1st support level at 0.64481, where the 50% Fibonacci line is located. 2nd support is at 0.63637 which is the recent swing low/
Areas of consideration:
- H4 time frame, 2nd resistance at 0.65743
- H4 time frame, 1st resistance at 0.65305
- H4 time frame, 1st support at 0.64481
- H4 time frame, 2nd support at 0.63637
USD/CAD:
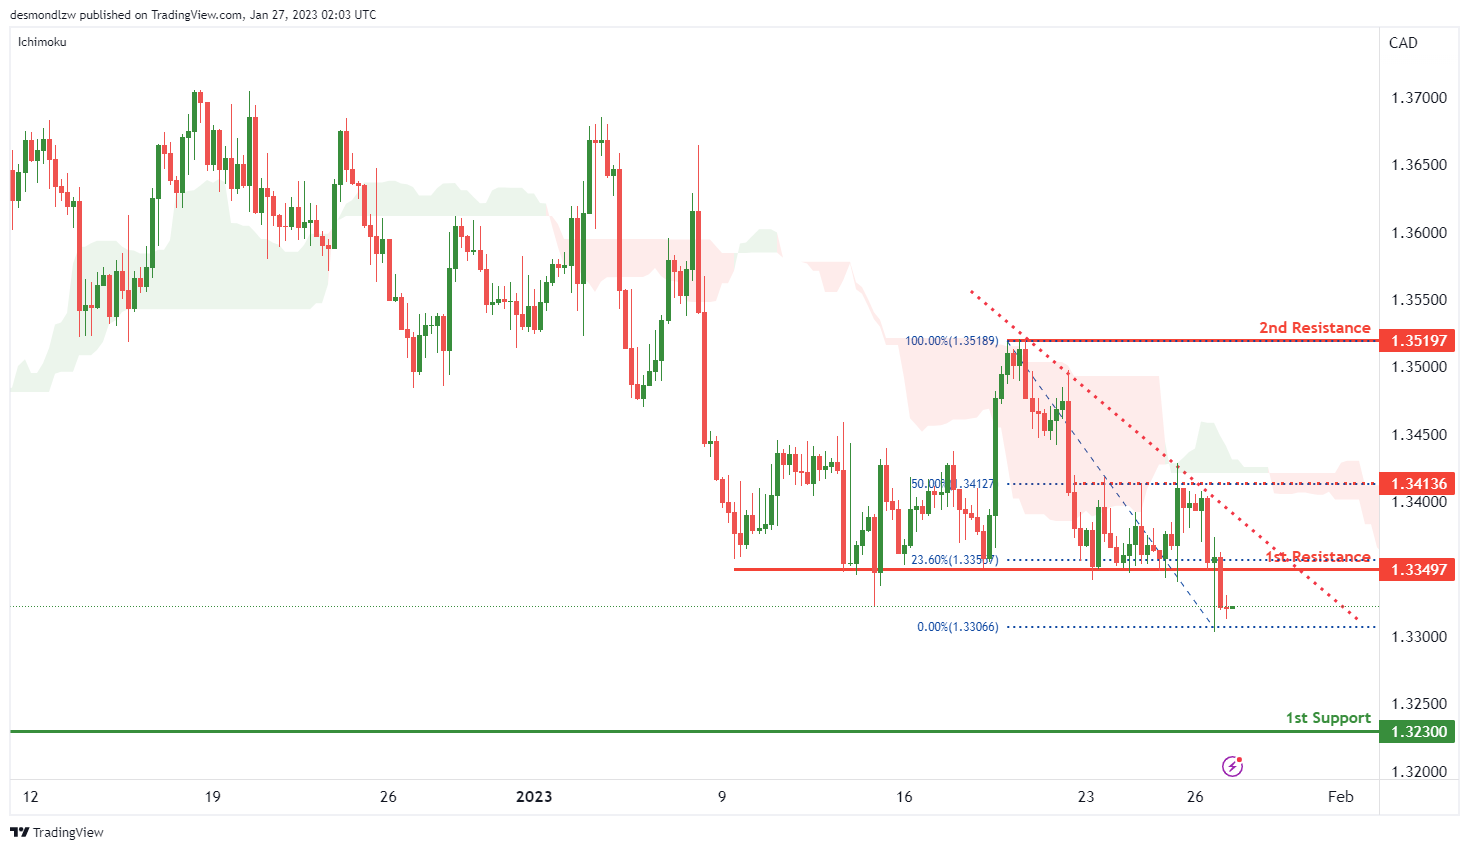
Looking at the H4 chart, my overall bias for USDCAD is bearish, due to the current price below the Ichimoku cloud, and there is a descending trend line add confluence to my bias. If this bearish momentum continues, expect the price to possibly continue heading towards the 1st support at 1.32263 which is recent swing low.
In an alternative scenario, price could possibly head up to the 1st resistance at 1.33497 which is in line with 23,6% Fibonacci line. The 2nd resistance is at 1.34802. There is an intermediate resistance at 1.34136 which is inl ine with 50% Fibonacci line.
Areas of consideration:
- H4 time frame, 2nd resistance at 1.34802
- H4 time frame, intermediate resistance at 1.34136
- H4 time frame, 1st resistance at 1.33497
- H4 time frame, 1st support at 1.32263
- H4 time frame, 2nd support at 1.33138
OIL:
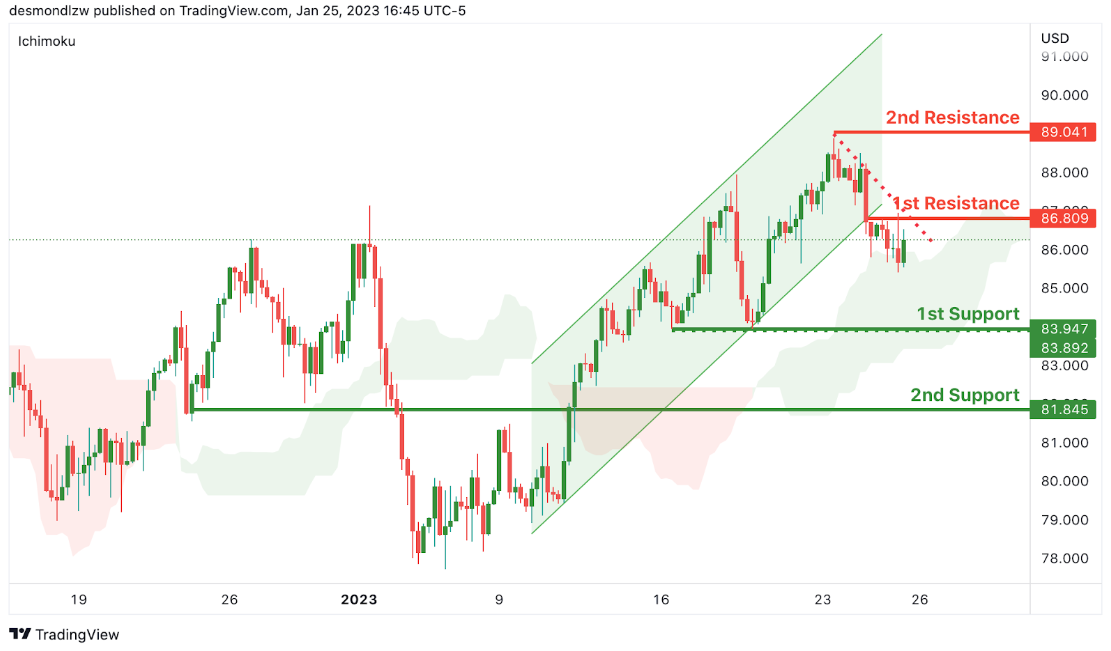
Looking at the H4 chart, my overall bias for BOC is bullish due to the current price being above the Ichimoku cloud, indicating a bullish market. To add confluence to this bias, there is an ascending trend line. If this bullish momentum continues, expect price to possibly head towards the 1st resistance at 88.885, where is the recent swing high. 2nd resistance is at 89.727.
In an alternate scenario, price could possibly head back down towards the 1st support level at 83.936, where the 50% Fibonacci line is located.
Areas of consideration:
- H4 time frame, 2nd resistance at 89.727.
- H4 time frame, 1st resistance at 88.885
- H4 time frame,1st support at 83.936,
Dow Jones Industrial Average:
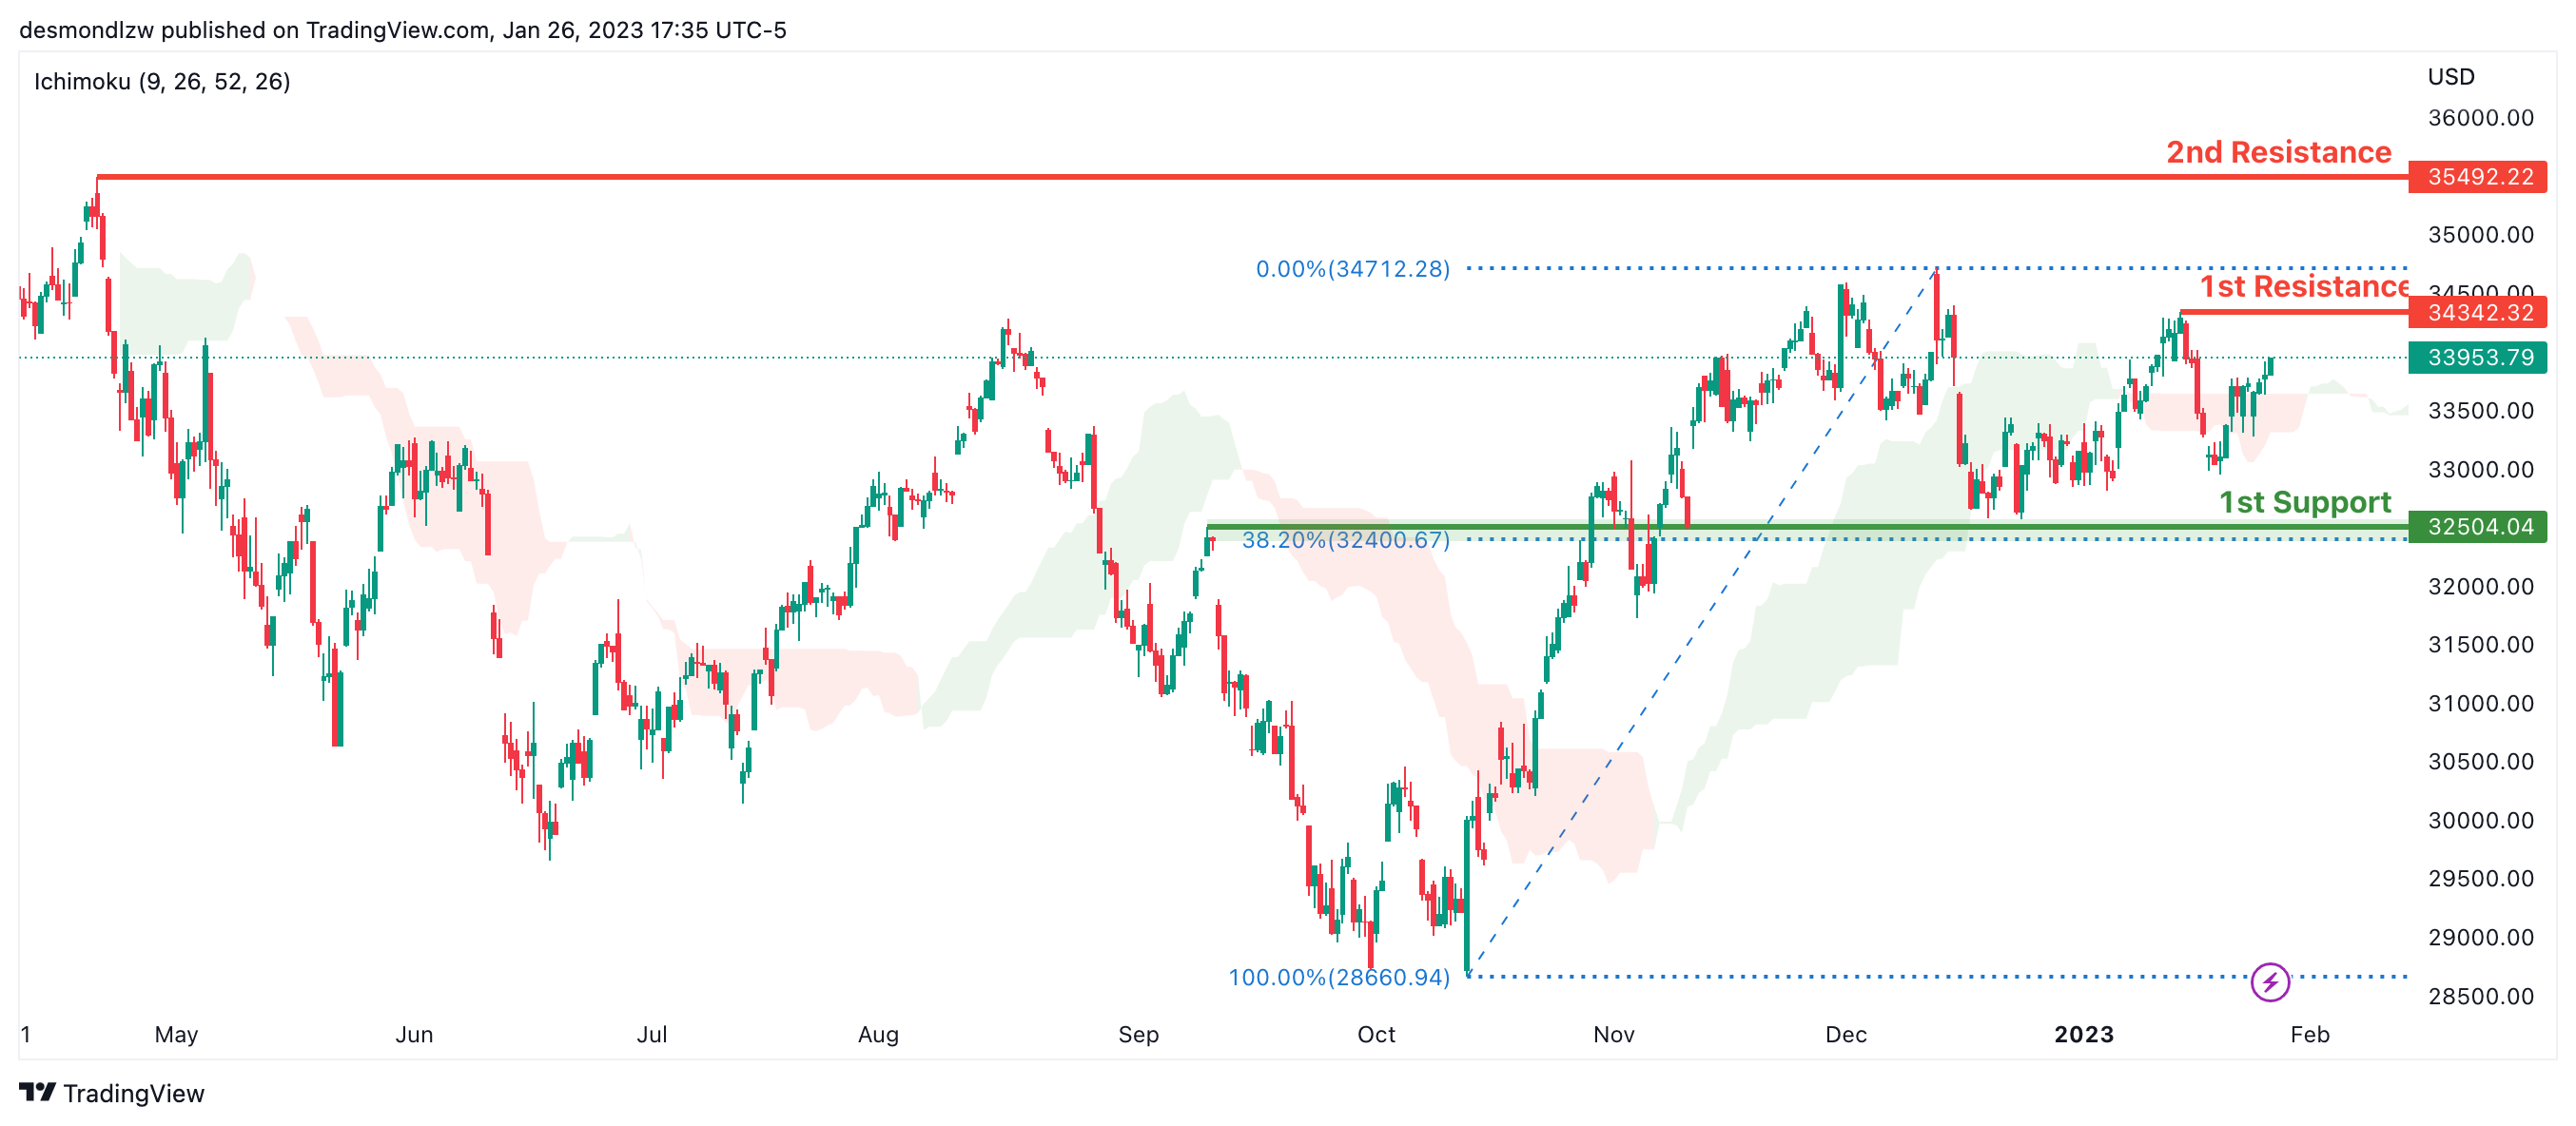
On the H4 chart, the overall bias for DJI is bullish. To add confluence to this, the price is crossing above the Ichimoku cloud which indicates a bullish market. If this bullish momentum continues, expect the price to possibly continue heading towards the 1st resistance line at 34342.32, where the recent swing high is. In an alternative scenario, price could possibly head back down towards the 1st support at 32581.97, slightly above where the 38.2% Fibonacci line is.
Areas of consideration:
- H4 time frame, 1st support at 32581.97
- H4 time frame, 1st Resistance at 34342.32
DAX:
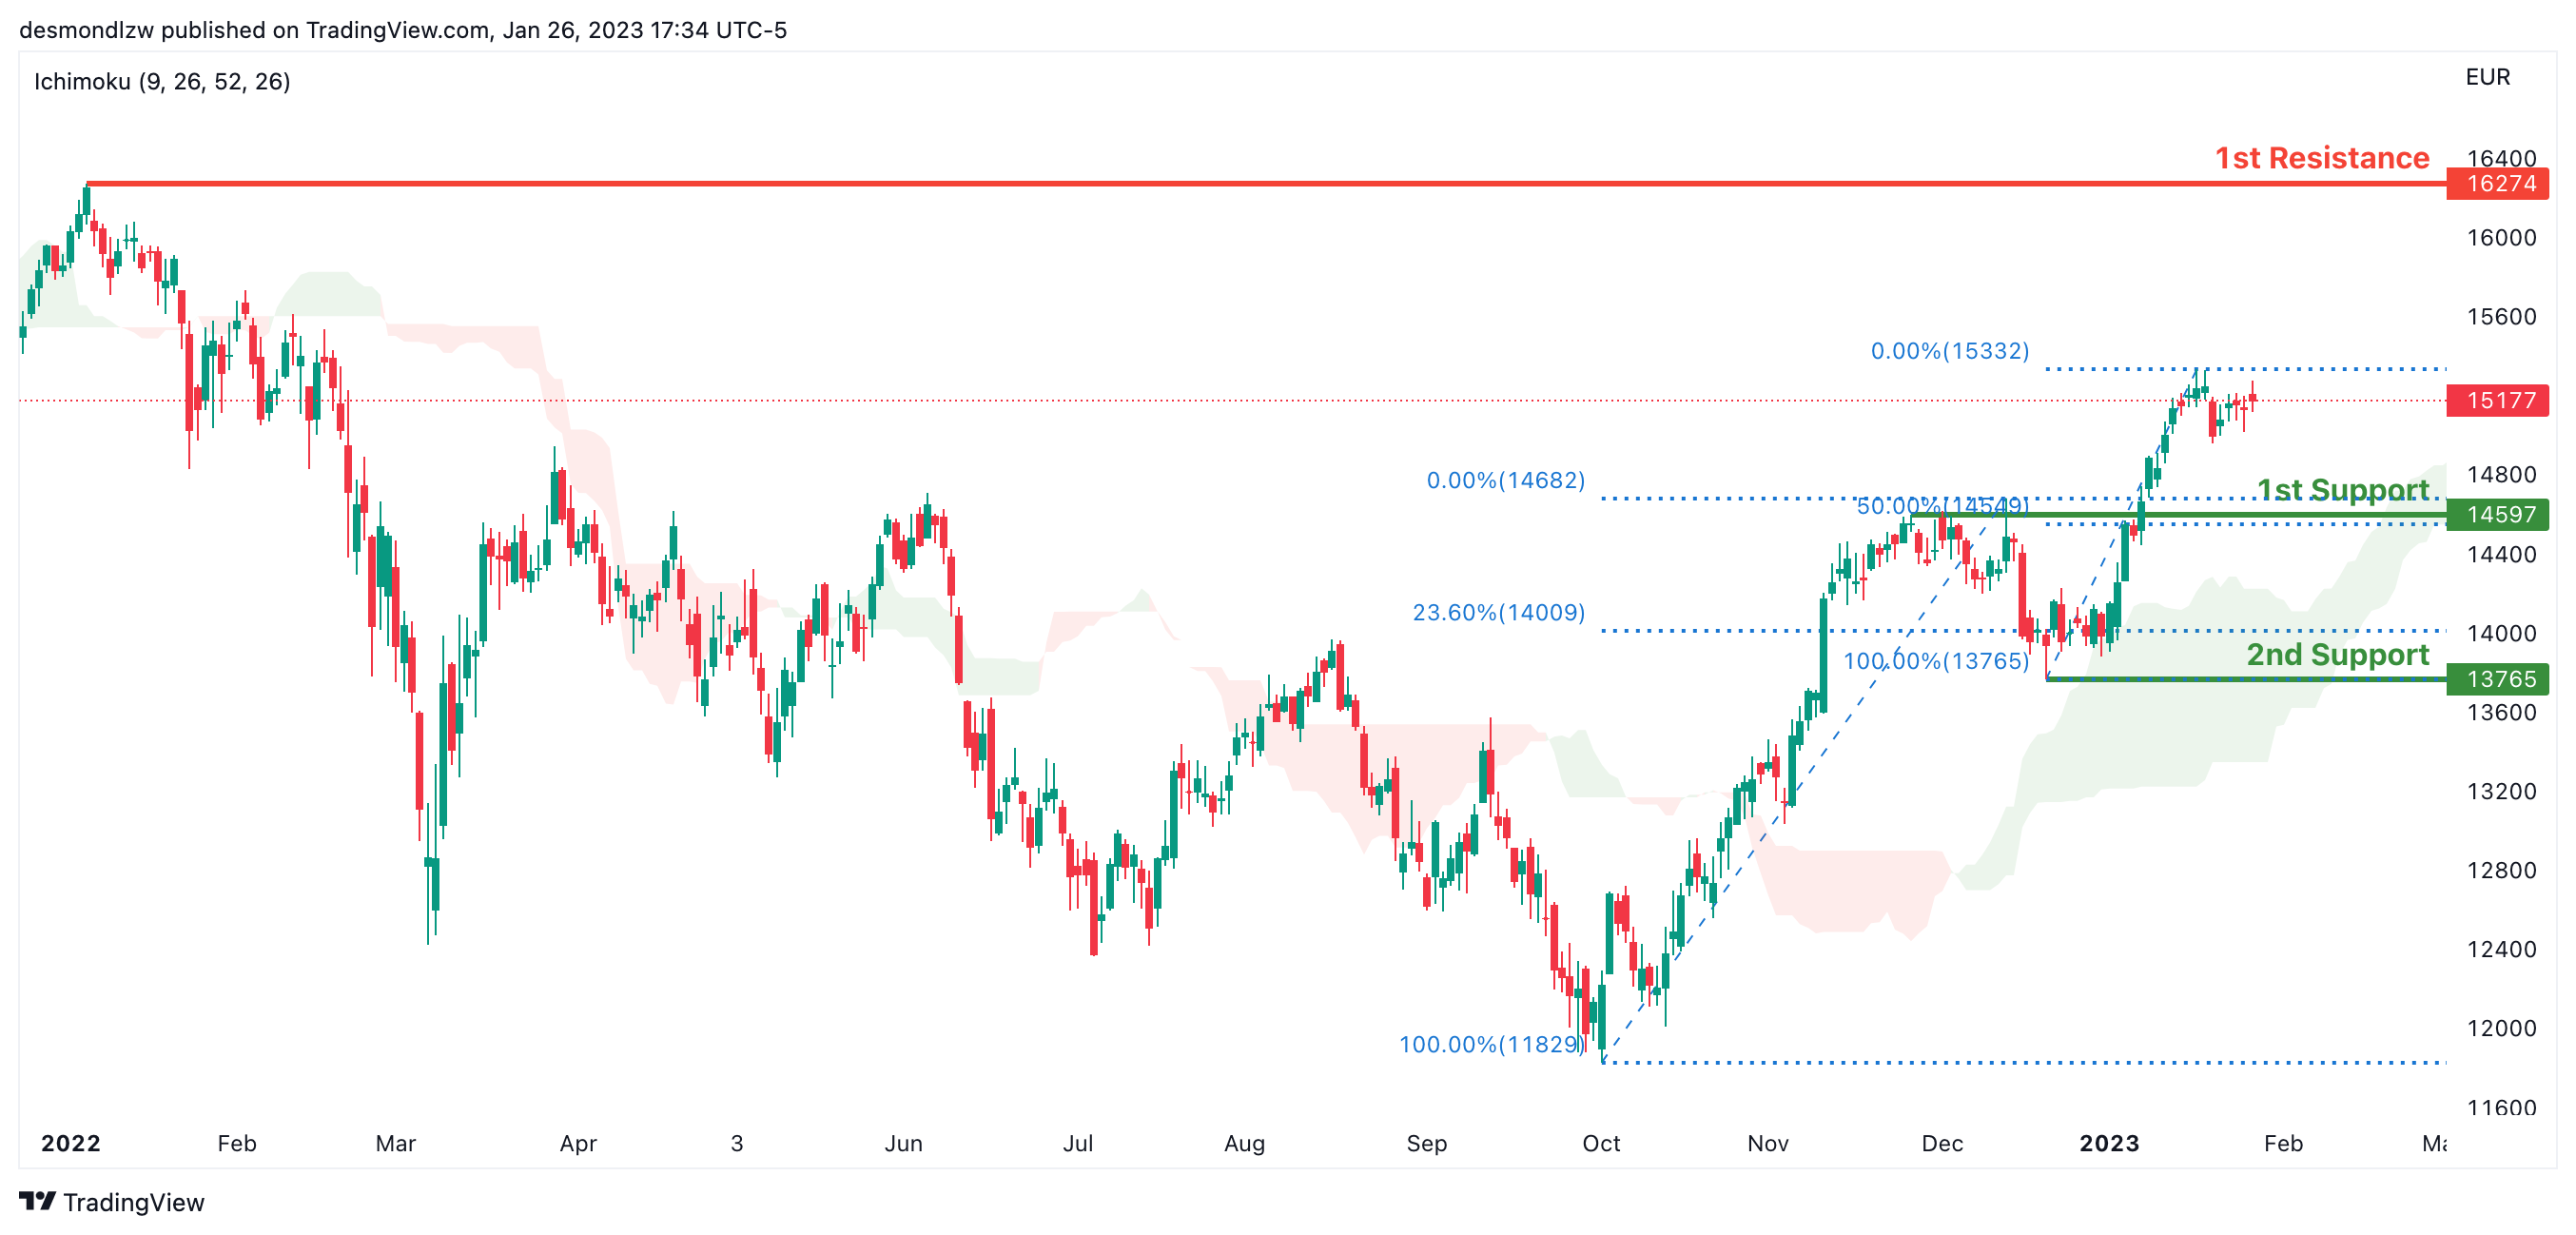
Looking at the Daily chart, my overall bias for DAX is bullish due to the current price crossing above the Ichimoku cloud, indicating a bullish market. If this bullish momentum continues, expect the price to possibly head towards the 1st resistance line at 16274, where the previous swing high is. In an alternative scenario, price could possibly head down to retest the 1st support at 14597, where the 50% Fibonacci line is.
Areas of consideration:
- H4 time frame, 1st resistance is at 16274
- H4 time frame, 1st support is at 14597
ETHUSD:
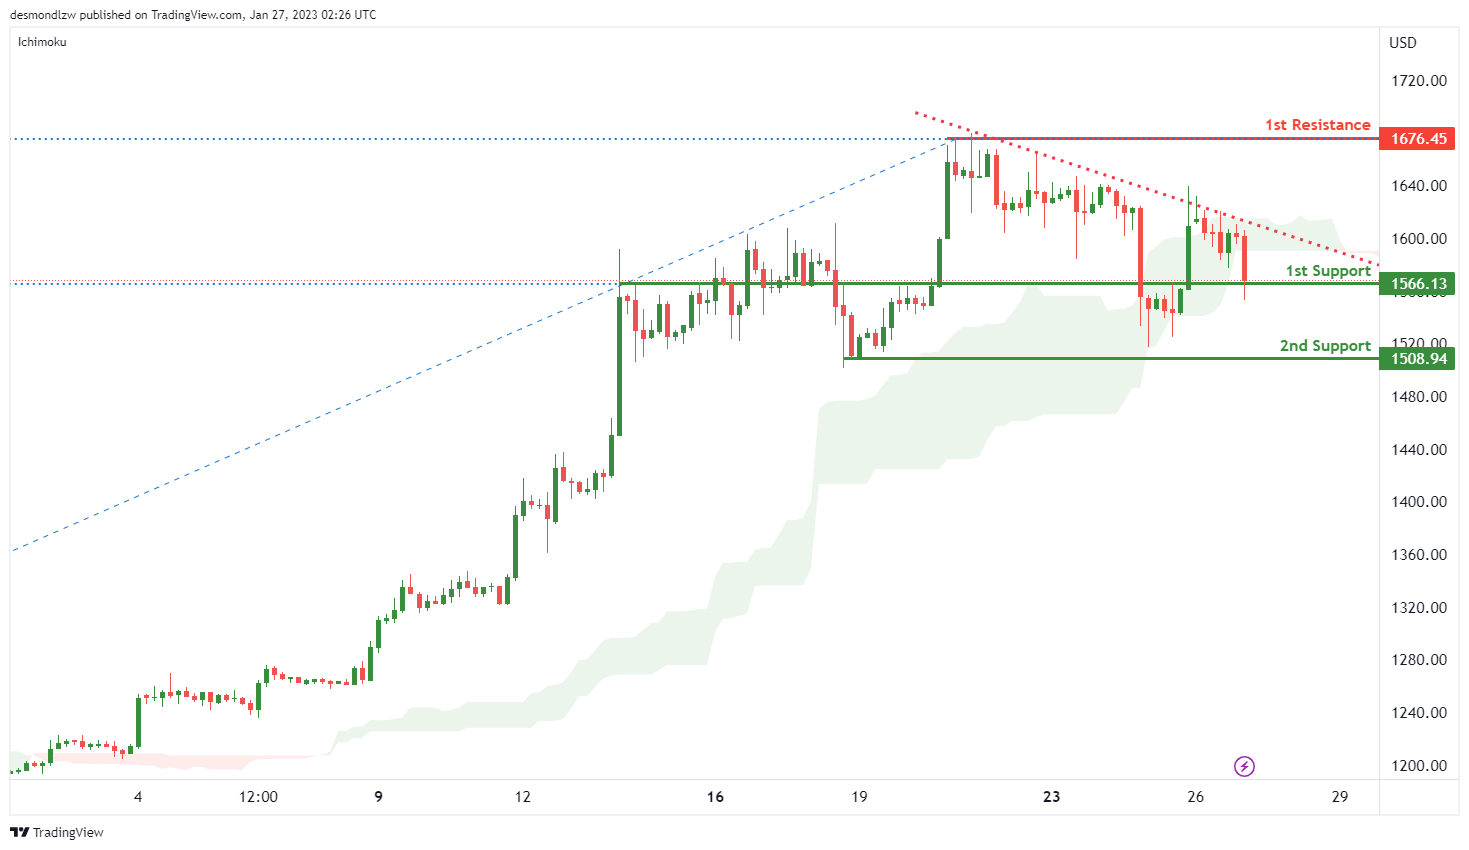
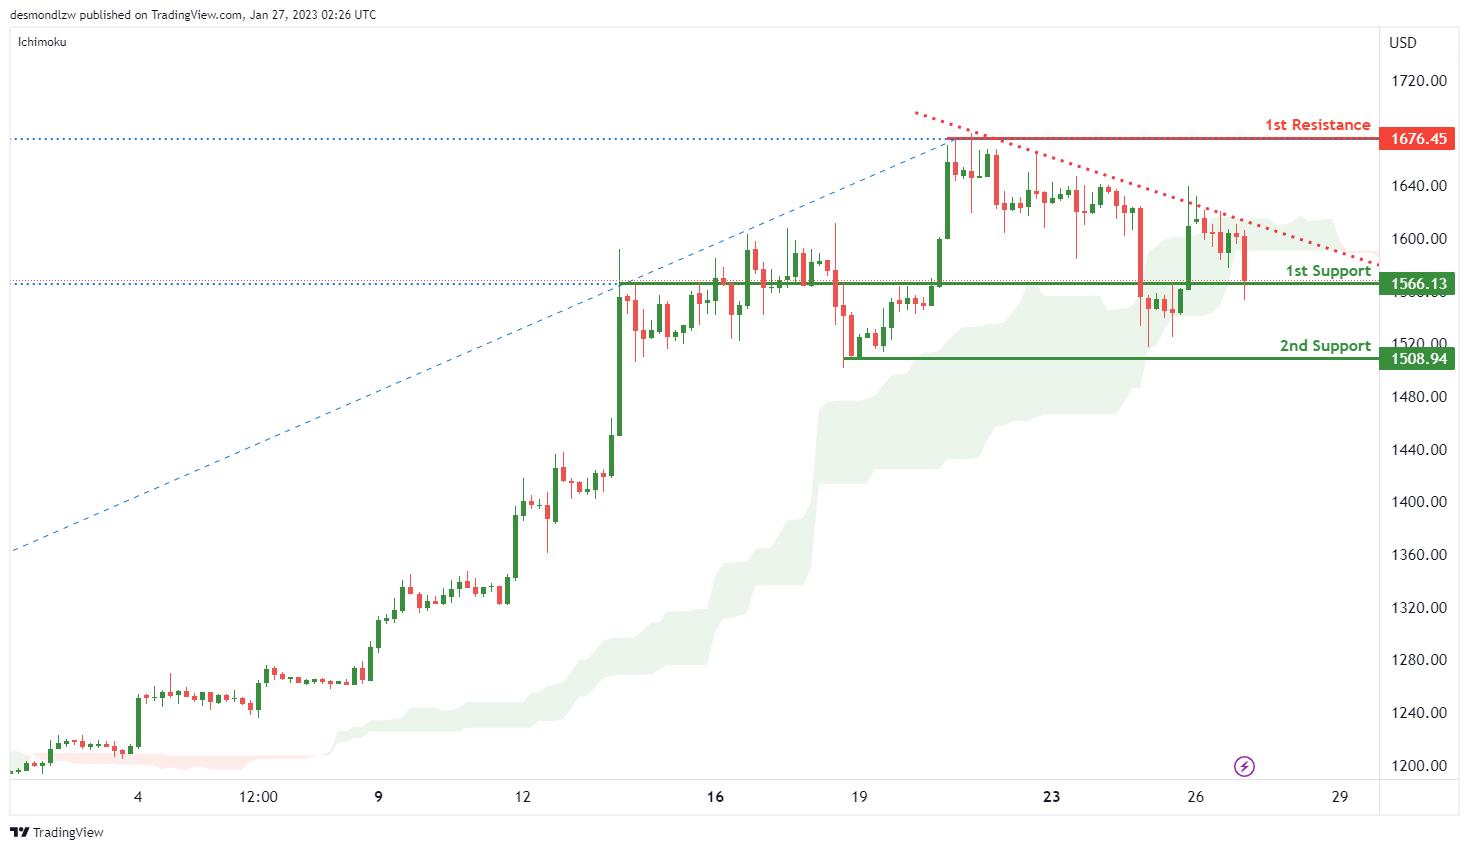
Looking at the H4 chart, my overall bias for ETHUSD is bearish, as the current price is below the Ichimoku cloud and a descending trend line add confluence to my bias. The price may break the 1st support at 1566.13 and head towards the 2nd support at 1508.94 which is the recent swing low.
In an alternative scenario, the price may up to the 1st resistance at 1676.45 which is the recent swing high .
Areas of consideration:
- H4 time frame, 1st resistance of 1676.45
- H4 time frame, 1st support at 1566.13
- H4 time frame, 2nd support at 1508.94
BTCUSD:
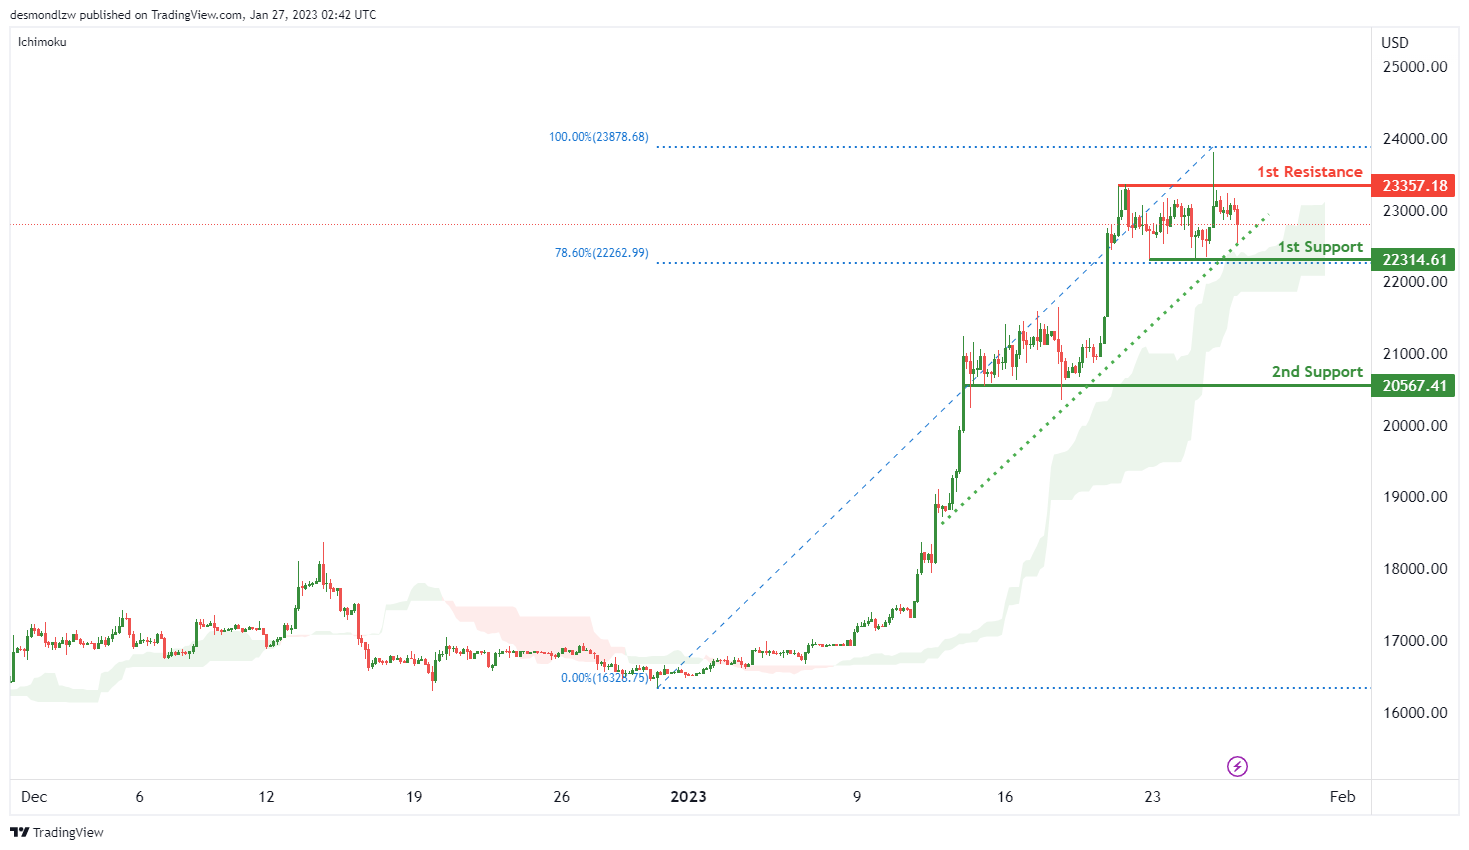
Looking at the H4 chart, my overall bias for BTCUSD is bullish due to the current price being above the Ichimoku cloud, and there is an ascending channel, indicating a bullish market. If this bullish momentum continues, expect the price to possibly rise to the 1st resistance at 23357.18 which is the overlap resistance.
In an alternative scenario, the price could possibly head back down to retest at the 1st support at 22314.61 which is in line with 78.6% Fibonacci line. . 2nd support is at 20567.41 which is the recent swing low.
Areas of consideration:
- H4 time frame, 1st resistance 23357.18
- H4 time frame, 1st support at 22314.61
- H4 time frame, 2nd support a 20567.41
S&P 500:
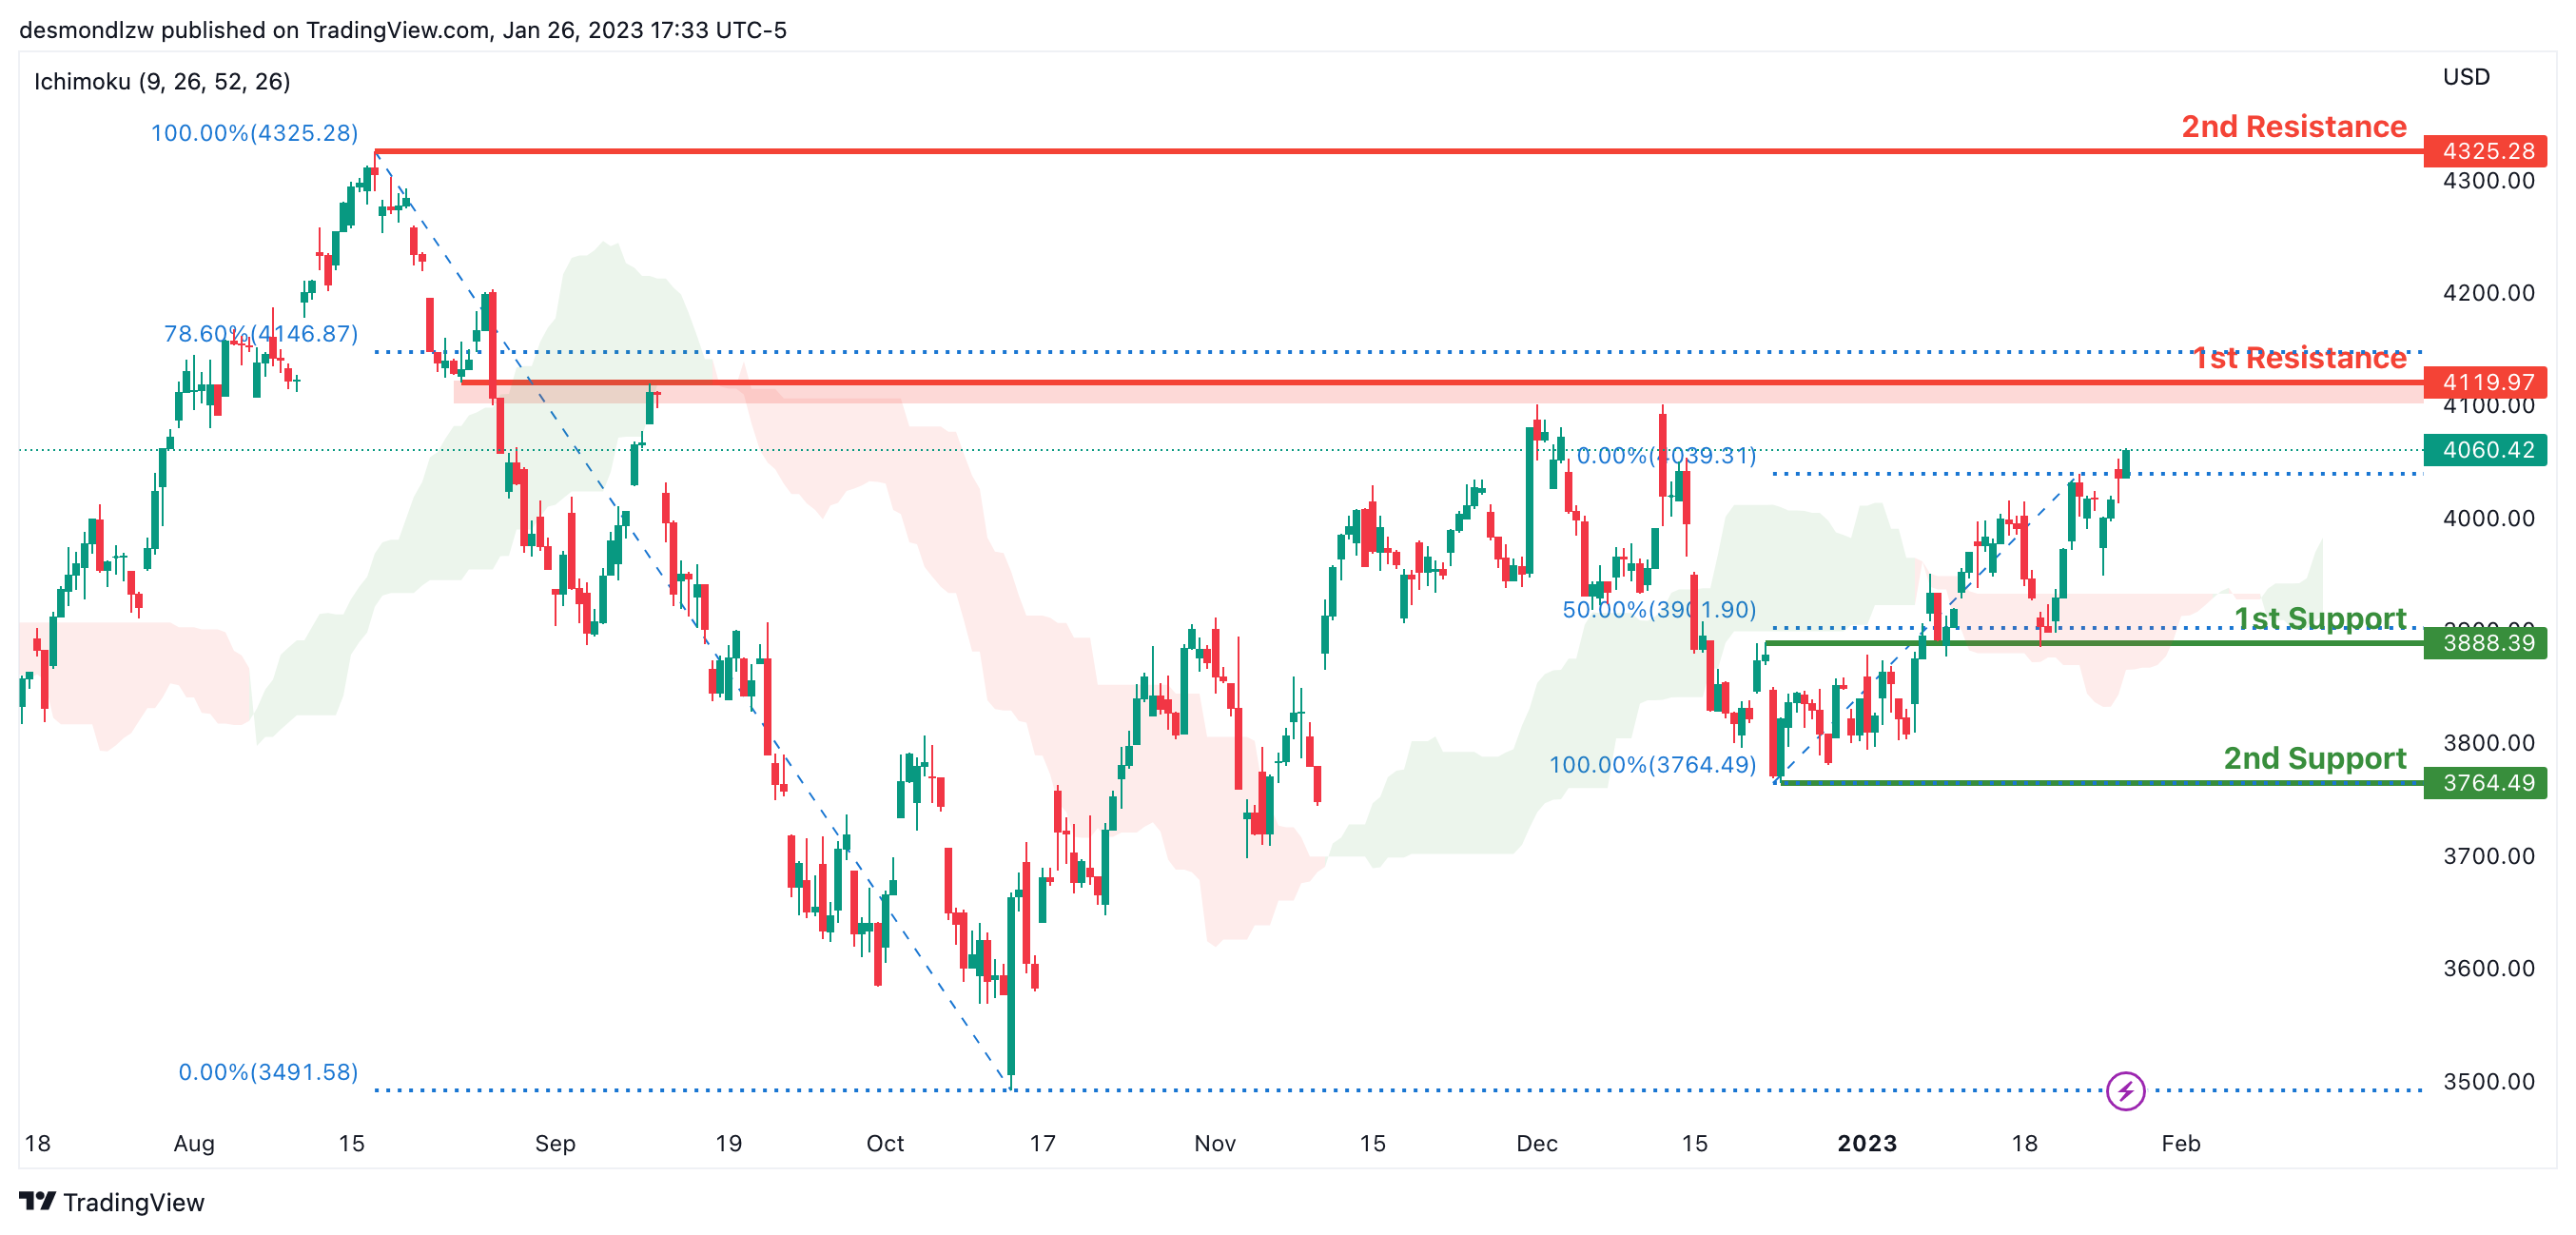
Looking at the H4 chart, my overall bias for S&P500 is bullish due to the current price being above the Ichimoku cloud, indicating a bullish market. If this bullish momentum continues, expect the price to continue heading towards the 1st resistance at 4119.97, where the 78.6% Fibonacci line is. In an alternative scenario, price could possibly head back down to break the 1st support at 3888.39, where the 50% Fibonacci line is, before heading towards the 2nd support at 3764.49, where the recent swing low is.
Areas of consideration:
- H4 time frame, 1st support at 3888.39
- H4 time frame, 2nd support at 3764.49
- H4 time frame, 1st resistance at 4119.97
S&P 500 Breaks Resistance
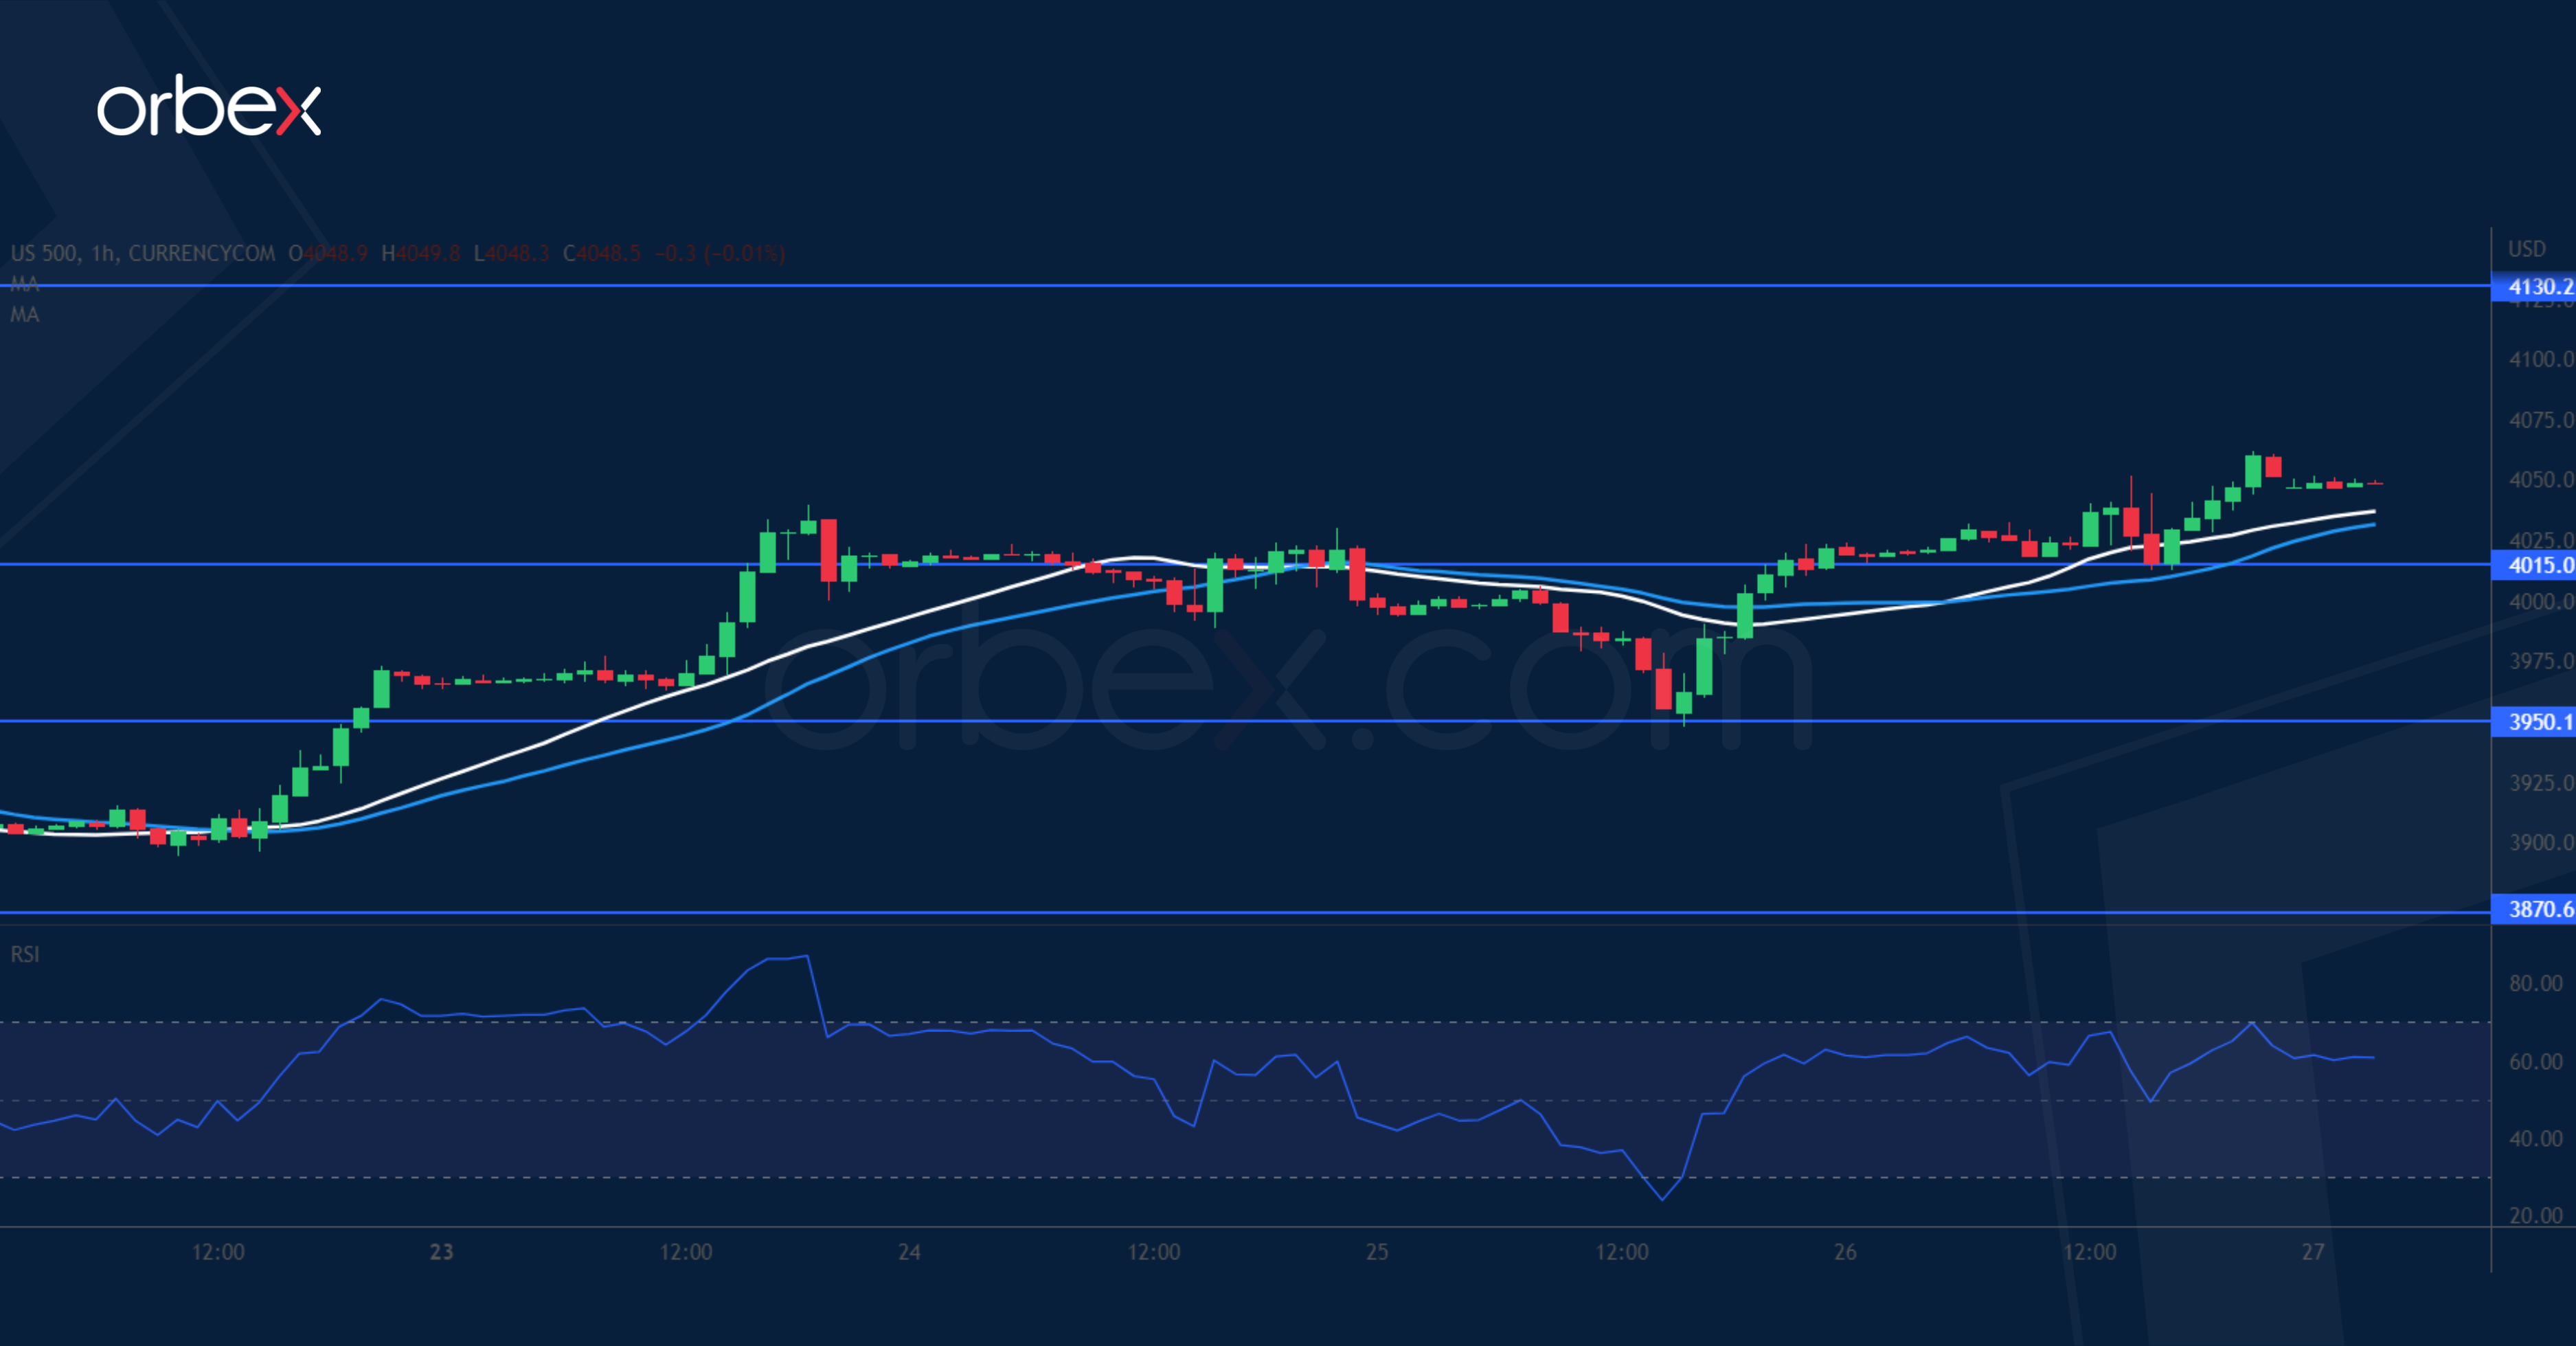
The S&P 500 rallies as upbeat US GDP eases fears of an economic downturn. On the daily chart, a close above the psychological level of 4000 and a bullish MA cross suggest that sentiment could be turning around. A break above 4050 from the start of the mid-December liquidation indicates solid buying pressure. Its breach would carry the index to the recent spike at 4130, leaving 4015 as a fresh support. Further down, the confluence of the swing low 3950 and the 20-day moving average is a key level to maintain the recovery.
EUR/JPY Looks to Breakout
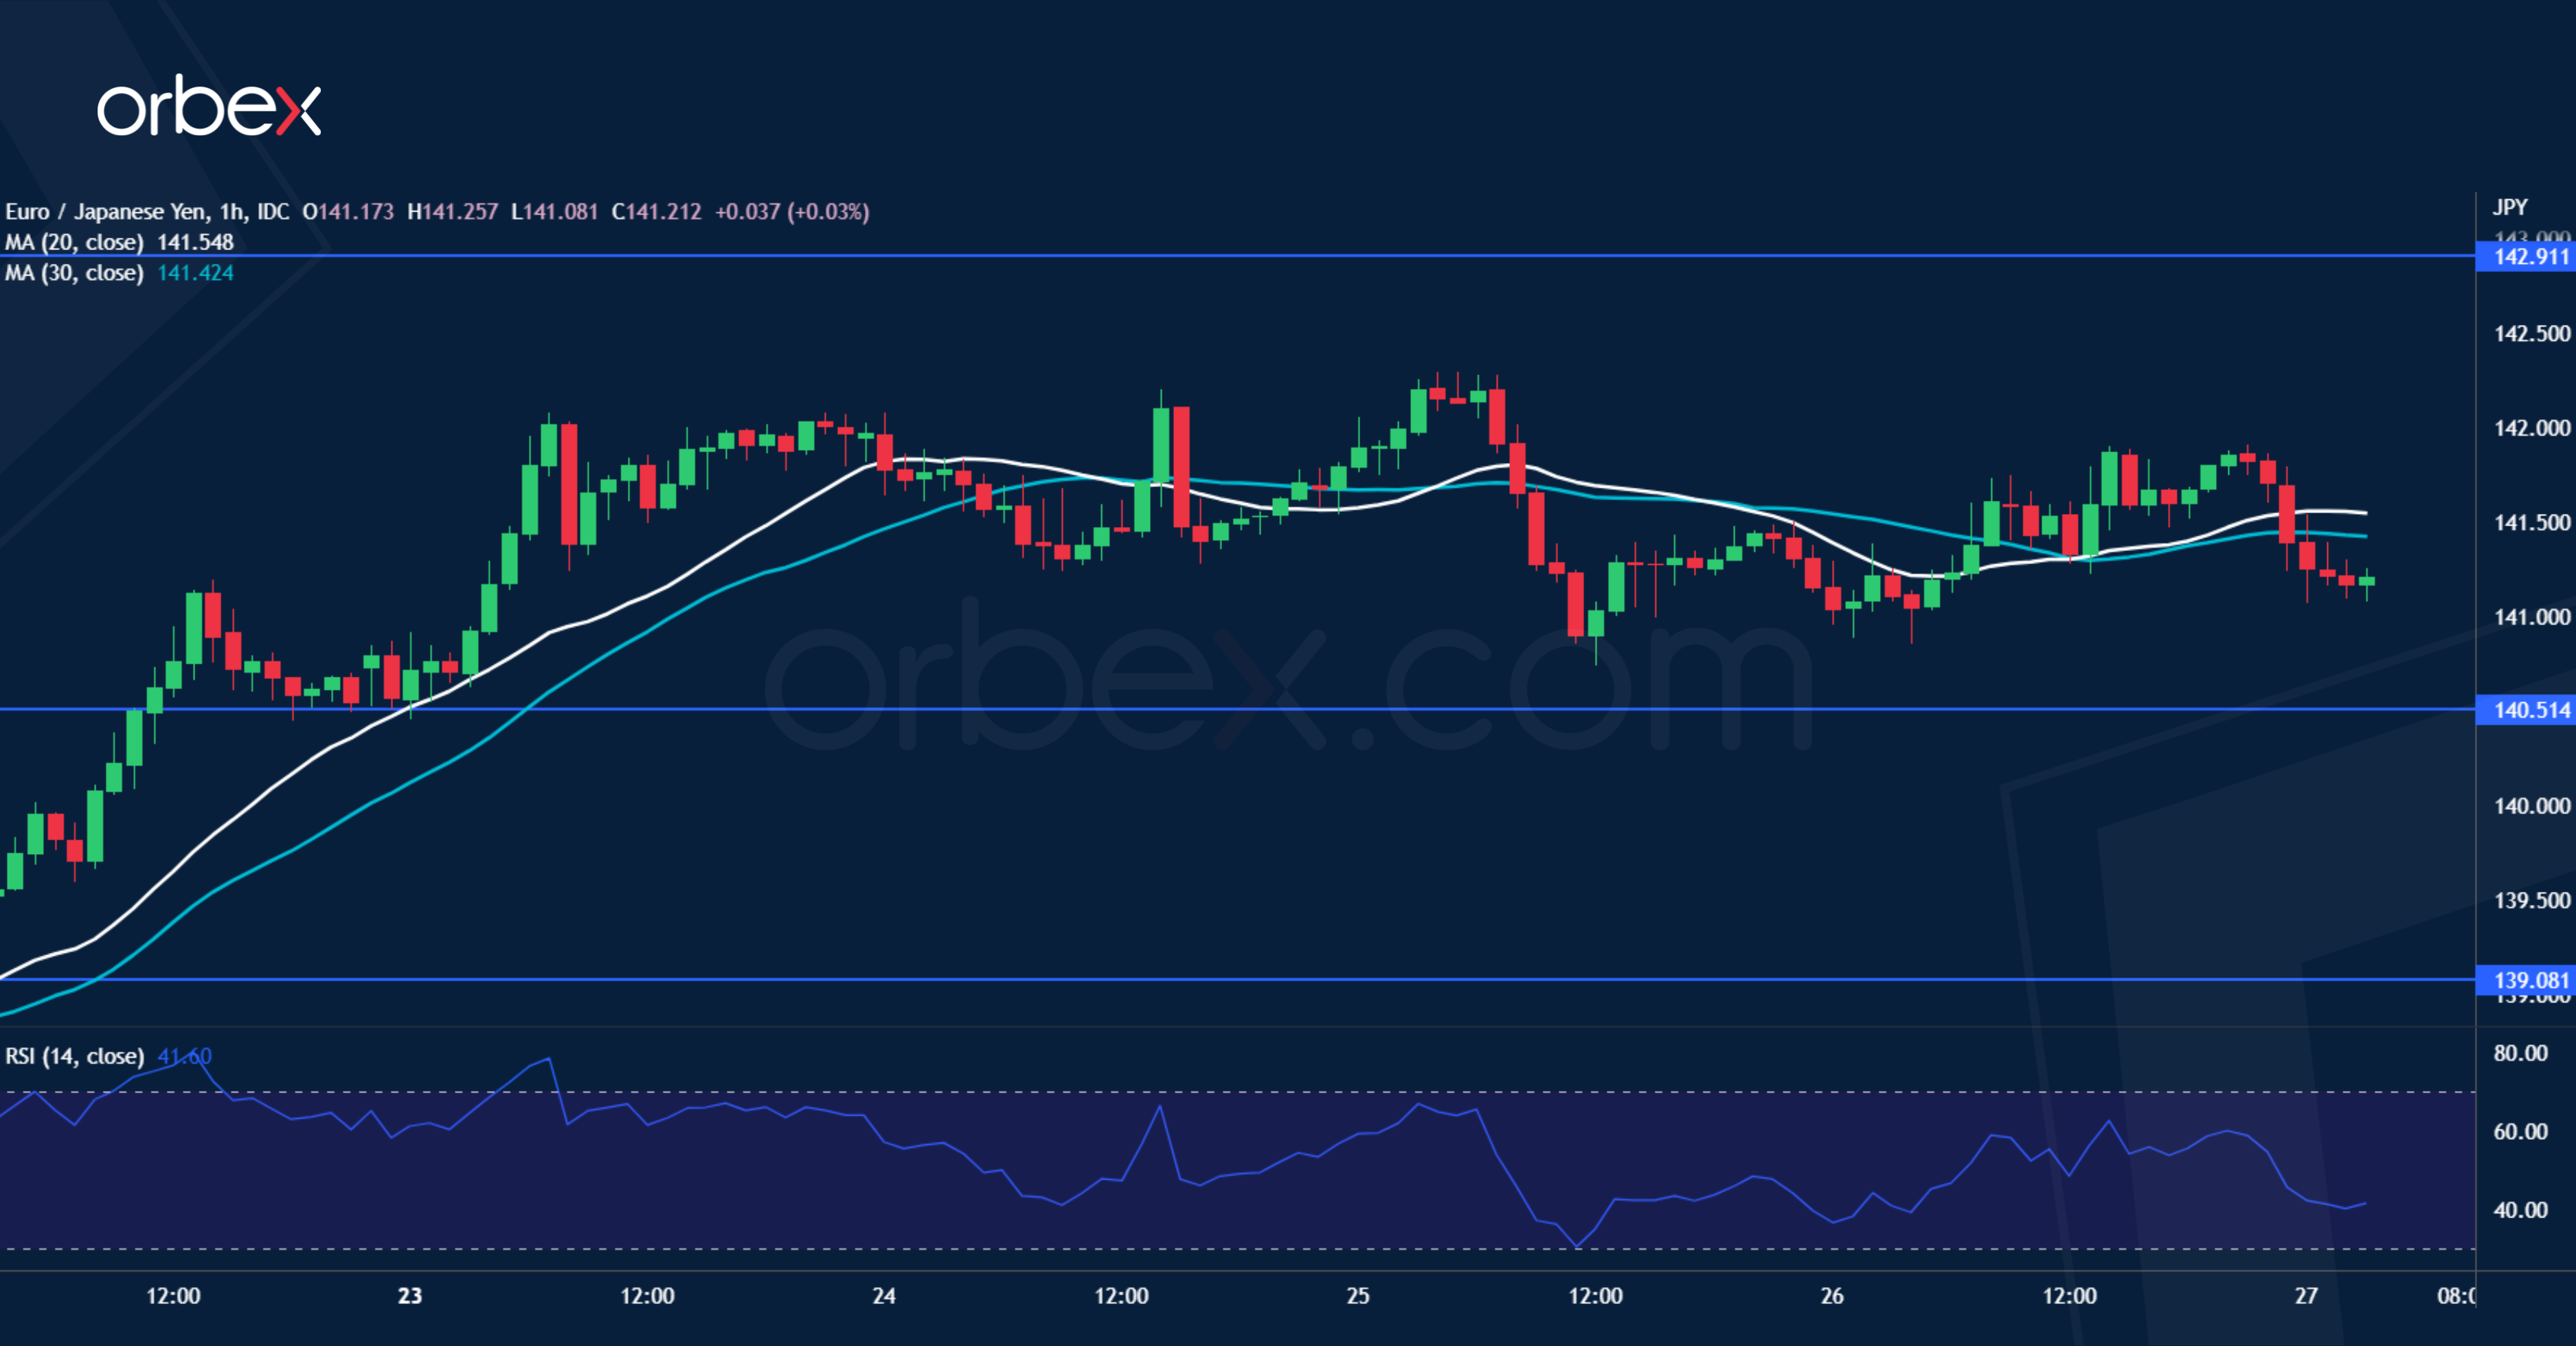
The Japanese yen strengthened after Tokyo CPI beat expectations. On the daily chart, the pair is in a horizontal range between 137.60 and 142.90 as it tries to keep the uptrend intact in the medium-term. Recent jitters have found support above 140.50, which is essential to keep intraday buyers committed. A break above the upper band at 142.90 would flush the remaining sellers out and propel the pair above 144.00, putting the euro on a bullish extension. A bearish breakout would send the pair to 139.00.
USD/CHF Grinds Support
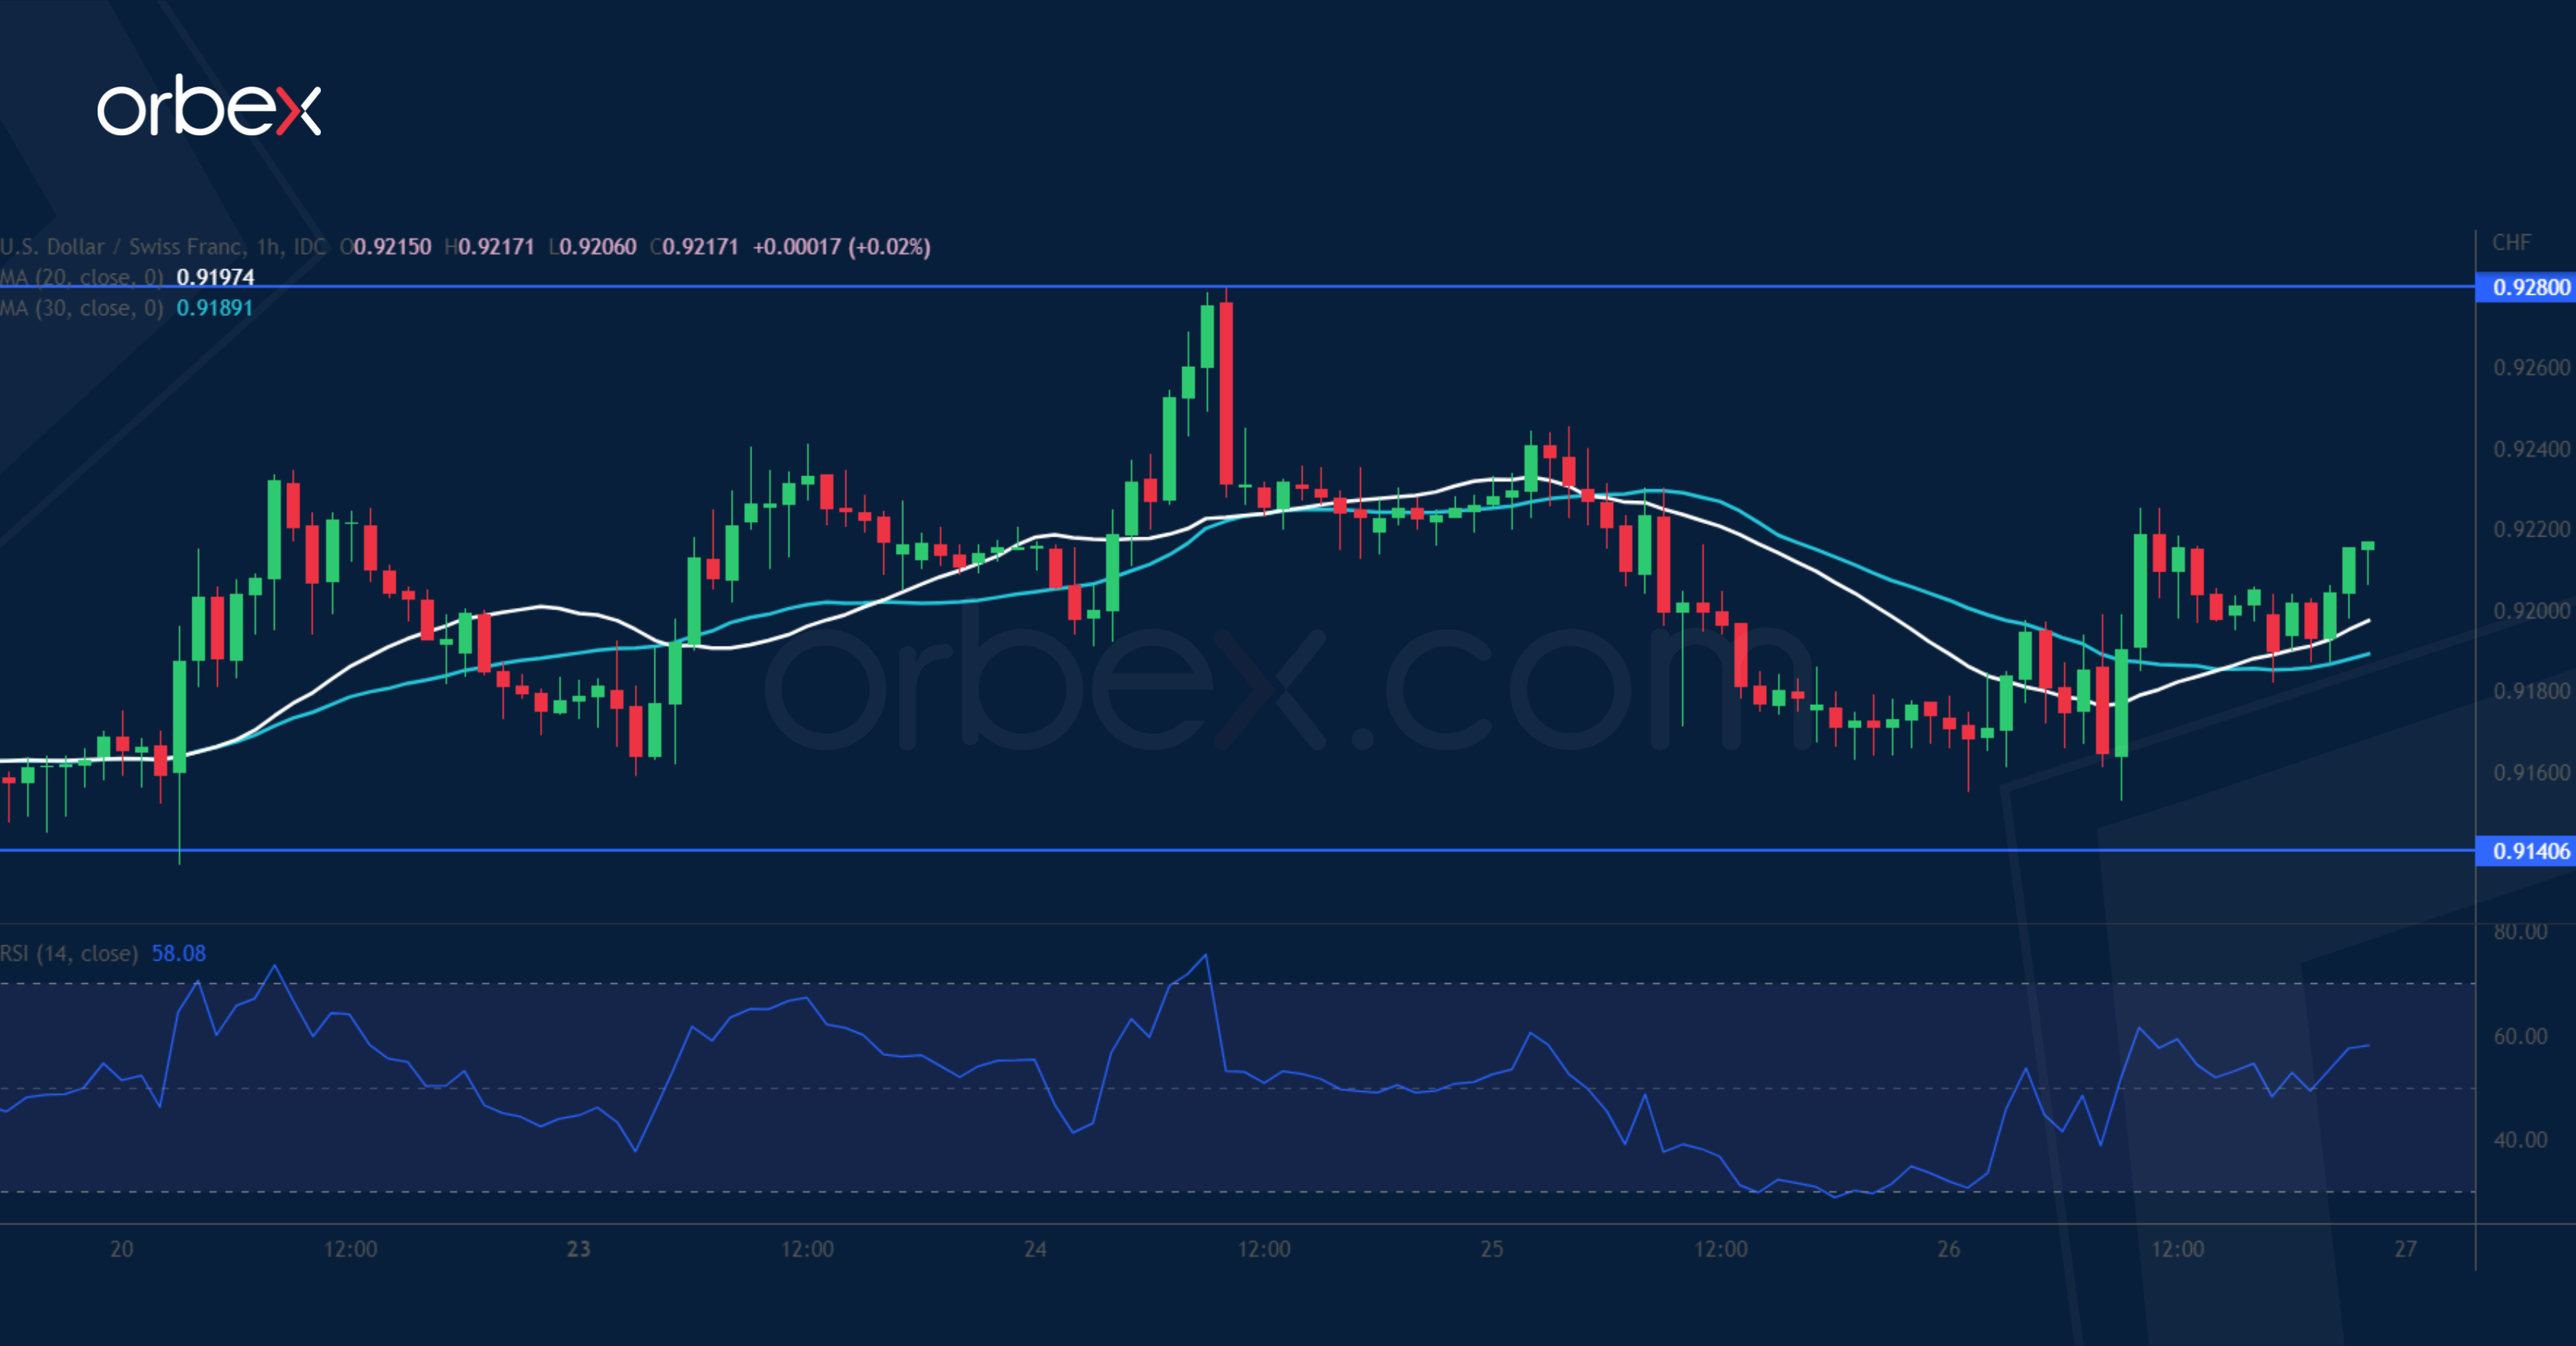
The US dollar builds a base ahead of the Fed rate decision next week. An initial pop above 0.9240 has prompted short-term sellers to cover some of their bets. Though 0.9280 along the 30-day moving average has proven to be a tough level to crack for the time being. 0.9140 at the base of the recent momentum is a key support to keep the rebound intact. Its breach could trigger a new round of sell-off and push the greenback below January 2022’s low (0.9100), confirming a bearish continuation in the process.
Order Driven/Technical Trade Going into the Weekend
Markets
US and European yields yesterday continued the bottoming out process that started earlier this week as investors are counting down to next week’s Fed and ECB policy meetings. The US Q4 GDP report was somewhat of a mixed bag. Headline growth decelerated less than expected printing at 2.9% Q/Qa from 3.2%. However with moderate consumption growth (2.1%) and a big contribution to growth from inventories, the overall picture was softer than the headline suggests. The core PCE deflator eased from 4.7% to 3.9% as expected. After all, the report can be seen as going in the direction of the soft landing the Fed is aiming for. US (headline) durable goods were strong (5.6%) due to aircraft orders. Another sub 200k figure for the weekly jobless claims confirmed a tight labour market. At least for now, data suggest that activity can cope rather well with interest rate normalization. In this respect, yesterday’s data mix translated into a modest further rise in yields with at the same time a solid equity performance. German yields gained between 5.4 bps (30-y) and 6.2 bps (5-y). US yields added between 5.75 bps (2-y) and 4.6 bps (30-y). The intraday uptrend in US yields was briefly interrupted by a stellar US $35 bln 7-y Treasury auction, awarded at a yield of more than 2 bps below the WI price and a record low primary dealer award. However, the uptrend soon resumed. Higher yields this time did go hand-in-hand with solid equity gains (S&P 500+ 1.1%; Nasdaq +1.76%). Europe underperformed (Eurostoxx50 +0.62%). The combination of higher yields and equities finally also played out in favour of the dollar. EUR/USD closed below 1.09 (1.0892). No test of the key 1.0942 resistance for now. USD/JPY closed north of the 130 barrier (130.22). Sterling again outperformed the euro with EUR/GBP closing at 0.877 despite soft CBI retail data.
This morning, Asian equities mostly trade with modest gains, with India the exception to the rule. US yields are rising another 1/3 bps. The dollar gains modestly (DXY 101.9, EUR/USD 1.0875). The yen slightly outperforms (USD/JPY 129.9) after higher than expected January Tokyo inflation (see infra).
Today, there are few data in EMU. In the US, December personal income and spending data, annex price deflators will be published. However, the report won’t bring much of a surprise anymore after yesterday’s Q4 GDP release. So, we expect order driven/technical trade going into the weekend. Yields apparently found a ST bottom. Maybe there is some room for interest rate markets to narrow the gap between market pricing and much more hawkish CB guidance going into next week’s Fed and ECB meetings. The dollar decline is also losing momentum. In case of a further correction, EUR/USD 1.0767 is a first ST support on the charts.
News and views
Inflation in Tokyo, a precursor for the nationwide figure due less than a month later, hit a fresh four-decade high in January. Headline inflation accelerated from 3.9% to 4.4%. Core price growth also quickened, from 3.9% to 4.3% (ex. fresh food) and from 2.7% to 3% (ex. fresh food and energy). Just yesterday, the IMF warned the Bank of Japan if significant upside inflation risks were to materialize, it may bring back intense market pressures on the central bank and its YCC programme. But today’s market reaction to the numbers is extremely muted. The 10y yield if anything eases a bit. The Japanese government’s January subsidies to lower gas and electricity cost burdens could play a role. This will affect inflation from next month on with some estimating core CPI 0.7 ppts lower this quarter. It may however boost demand pull inflation further out. The yen appreciates marginally. USD/JPY struggles not to lose 130.
Hungary’s economy minister Nagy yesterday said the central bank’s (MNB) hesitation to lower borrowing costs is unwarranted since it is priced in by markets anyway. The MNB has a shadow policy rate of 18% to dampen high inflation and intends to keep it there until there is a “trend-like improvement in risk perceptions”. The MNB doesn’t want a third repeat of signaling the end of the tightening cycle and risk another rout in the forint. But according to Nagy, a former MNB deputy-governor, this would not be the case this time around since the central bank would simply follow the market. He projected price growth to peak a little over 25% in January and he sees annual GDP growth of 1.5% this year. The forint underperformed regional peers yesterday with EUR/HUF rebounding from an 8-month low at 386.3 to 387.95.
The Good, the Bad and the Ugly
US equities rallied on Thursday, boosted by a decent rally in Tesla and Chevron stocks, and a better-than-expected GDP read in the US.
The latest US GDP update was a strong beat. The US economy grew 2.9% in Q4, down from 3.2% printed a month earlier, but significantly better than the 2.6% penciled in by analysts.
But be careful! The US growth number was good, but not necessarily for good reasons.
Inventory adjustments and government spending were the main boosters of the GDP in the latest quarter, while domestic purchases increased just around 0.2%, down from 2% printed in Q1.
Plus, the housing sector took a massive 27% hit on annual basis, business inventories grew around 0.6% versus 6% printed a quarter earlier, and trade with other countries was good, but not because Americans exported more, but because they imported less.
In summary, the latest GDP data was boosted by government spending and inventory adjustments, but the growth engines, which are consumption and investment - that hint at the health of the future economy did quite poorly.
So what do you make of the data?
In one hand, slowing demand is great news for the Fed because their aggressive tightening policy hammers demand, and that should further ease inflation and further soften the Fed’s policy. And all that, with the weekly jobless claims headed further down as a sign that the jobs market is still not feeling the pinch of the higher rates and the slower demand – although IBM announced it will cut 3900 jobs, and SAP 3000 this week. But oops, IBM is down 4.5% after the news. Too bad.
On the other hand, weaker demand is not great news, as it means that your favorite companies will be selling less stuff and will be making less money.
But there is always this hope that the Chinese could fill in the gap this year, thanks to the pandemic savings that will be flowing into the stuff that Chinese like to buy the most in the coming months. In this sense, Burberry and Swatch shares look nothing less exciting than the tech stocks during the pandemic. And that despite the war and a global cost-of-living crisis.
Focus on US PCE
The US will reveal another gauge of inflation, the PCE data, that is closely watched by the Federal Reserve (Fed). A slower than expected core PCE would be a cherry on top for closing a week where the S&P500 rallied past its 2022 bearish trend top, and which could soon confirm a cup and handle pattern above the 4100 mark.
But beware, Intel slumped 10% in the afterhours trading after revealing a worse-than-expected quarterly loss due to a steeper than expected fall in PC chip sales, and giving a weaker-than-expected forecast for the current quarter.
Aussie shines
The US dollar is better bid on the back of a strong GDP report, while gold is down from the $1950 resistance.
The EURUSD is again below the 1.09 mark, while Cable consolidates below 1.24, with a clear resistance forming into the 1.2450 mark.
The AUDUSD on the other hand extends gains above 71 cents level as the heated inflation report this week boosted the Reserve Bank of Australia (RBA) hawks. The 50-DMA crossed above the 200-DMA, confirming a golden cross formation on the daily chart, while the market remains strongly short the Aussie, meaning that if the Aussie gains further momentum to the upside, we could see a short covering that could further emphasize the bullish trend.