Sample Category Title
GBP/USD Started a Downward Move
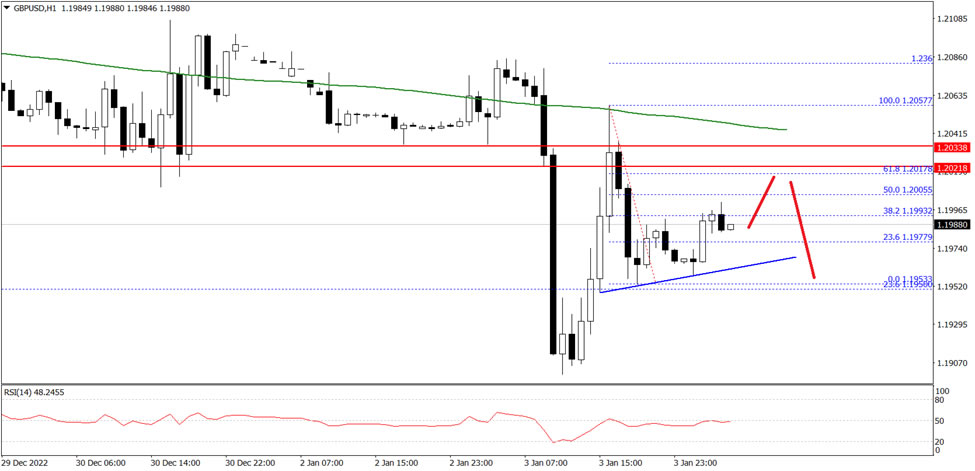
The British Pound started a downward move from the 1.2100 zone against the US Dollar. The GBP/USD pair declined below 1.2020 to move into a short-term bearish zone.
The pair even settled below the 1.2000 level and the 50 hourly simple moving average. It is now consolidating near the 1.1990 level on FXOpen, with an immediate resistance at 1.2020.
The first major resistance is near the 1.2040 level and the 50 hourly simple moving average. If there is a clear upside break above the 1.2040 resistance, the pair could rise steadily towards the 1.2080 level in the near term. The next major resistance sits near the 1.2120 level.
On the downside, the first major support is near the 1.1980 level. The main support is forming near the 1.1955 level. A break below the 1.1955 support could push the pair towards the 1.1900 support.
What Could Bring Negative Stock-Bond Correlation Back?
European investors got an energy boost from lower inflation reads, and the falling nat gas futures, but US investors didn’t follow up on the cheery market mood.
However, US sovereign bonds gained yesterday as an indication that the latest market moves were backed by recession fears, rather than hawkish Federal Reserve (Fed) expectations… And that could be a gamechanger for the stock-bond correlation this year.
Softer inflation won’t change ECB’s stance
If European stocks were cheery yesterday, it was certainly due to an unexpected drop in German inflation below the 10% mark, a softer Spanish inflation, and a further slide in nat gas futures due to an abnormally mild winter – which also boosted the idea that inflation could further ease if energy prices – which are mostly responsible for the sky-high European inflation eased.
And if inflation starts falling at this speed in Europe, the European Central Bank (ECB) won’t need to worry about fighting it so aggressively.
As such, the softer ECB expectations were mostly responsible for yesterday’s rally in the European stocks. The DAX gained 0.80%, while EuroStoxx50 jumped 1%.
The problem with all this is, a single data point won’t change the ECB’s policy stance.
More importantly, yesterday’s German CPI data was because the government paid some energy bills, and the headline figure obscured the increase in food costs across the country, along with tighter than expected job conditions, which could also make inflation stickier than ideal.
And finally, if we think that the euro appreciation helped the European stocks gain weight since October, the slowing appreciation may pull the rug from under their feet.
Could negative stock-bond correlation come back?
The US indices didn’t follow up on their European peers’ gains… at all. And the pain for the US risk assets started in the European session.
Combined to the dovish ECB bets, the EURUSD was trading 1.50% down at some point yesterday, Cable slipped below the 1.20 and tested the 50-DMA to the downside, while the Japanese yen couldn’t extend strength below the 130 against the US dollar.
What’s interesting in all this is that the US yields were lower, meaning that investors bought treasuries while selling stocks, and the US dollar didn’t really react to softer yields.
If the first trading day of the year is any indication, could we see the holy negative correlation between stocks and bonds come back in 2023? This is what many investors think will happen. The risk-off investors will likely continue exiting stocks on profit recession – and not on hawkish Fed expectations, and they could go back to bonds instead.
In summary, if the major market catalyzer becomes recession, rather than hawkish Fed, we could see the negative correlation between stocks and bonds come back.
And, if the falling yields couldn’t boost sentiment in the US stocks yesterday, they certainly boosted appetite in the non-interest-bearing gold, which saw the opportunity cost of holding the yellow metal fall. The price of an ounce rallied to $1823, and could well benefit from a further fall in US yields – in which case we would also see gold become an effective hedge against fresh market routs.
Data watch
But let’s not cry victory so fast, because the US economic data will say the last word on whether the Fed expectations will remain on the back seat. Due today, the ISM manufacturing index will reveal if and how fast US manufacturing contracted last month. If yesterday’s PMI is any hint, we could see a fastening contraction in ISM manufacturing, which would then boost recession worries, hit the stocks, but not necessarily the bonds and gold.
Also, JOLTS data will show if, and by how much the US job openings fell in November.
But regardless of the ISM data, and the US job openings, the FOMC minutes will likely confirm that the Fed remains serious about further tightening policy, even if it slows the pace of interest rate hikes. Remember, if the Fed decided to go slower on its rate hikes, it’s to be able to go higher! And the more resilient the US economy and the US jobs market, the more eager the Fed will be to continue its journey north.
Focus on the FOMC Minutes Tonight and ISM Numbers This Afternoon
Market movers today
The markets' focus today will be on US data releases. The ISM Manufacturing index for December is expected to fall further into recessionary territory to 48.5 from 49.0 in November. Also, consensus expects the job openings for November to reflect a gradual cooling off in the US labour market. Consensus looks for the weakest reading since June 2021.
In Europe, following yesterday's inflation data from Germany, today brings similar data for France ahead of the much expected euro area release on Friday.
Towards the evening, focus turns to the FOMC minutes from the December meeting which should shed more light on how the policymakers are weighing early signals of slowing inflation pressures against the persistently strong labour market data.
Overnight, we will also get the December Caixin Services PMI from China. Yesterday, we updated our outlook for the Chinese economy and in the context of reopening we now expect weaker GDP performance in the short term but a faster rebound starting already in February-March. Economic recovery in China will provide a positive tailwind for global growth but it could also fuel inflation. Read more on China Outlook: Earlier reopening to drive faster rebound.
The 60 second overview
German inflation: German CPI inflation fell back to 8.6% in December (from 10.0% in November). However, a government-backed discount to energy bills was an important driver for the deceleration in energy inflation (24.4% from 38.7% in Nov), and core inflation pressures continued to build. For ECB the figures hence give little respite on the inflation fighting front: the drop in energy inflation will likely revert in January/February, until the gas/electricity price brake takes effect, while a tight labour market continues to pose upside risks to wages.
China: Yesterday's Caixin PMI manufacturing for December out of December not as bad as the release from NBS yesterday. Interestingly Taiwan PMI rebounded in December from 41.6 to 44.6. It tends to lead global PMI by a few months so indicates a bottom in late Q1. Is similar to signals from German ifo expectations, which is also a good indicator for the global cycle leading by some months. The level is still low, though, and points to manufacturing recession.
Europe is set to unify its approach towards China and the covid outbreak, which may include mandatory testing.
Credit: The credit market saw decent performance yesterday with spreads as measured by iTraxx Main tightening by 2bp to 89bp, while Xover was tighter by 12bp to 474bp compared to Friday's close. With UK and US investors back from holiday, issuers seemed keen to make early progress on their funding plans and primary market activity picked up noticeably. In financial senior space alone more than EUR10bn was printed and the AT1 segment also saw issuance. Despite the flurry of deals coming to the market, supply was overall well absorbed by investors.
FI: European rates extended its performance from Monday into yesterday. Supported by lower than expected headline inflation from Germany, rates ended some 6bp lower on the day, with the bulk of the rally recorded in the morning session as it became visible that the German government subsidies dragged the headline lower. That said, there was no relief for the core inflation which mostly ticked up across the regional states which means ECB will continue to strike a hawks tone. Intra euro area spreads were mostly unchanged on the day.
FX: Broad-based dollar recovery which sent EUR/USD 1.5 big figure lower and the cross rounded off the US session well below 1.06. EUR/SEK relatively stable within 10.11-10.16, whereas USD/SEK climbed above 10.50 and thus traded at its highest level in more than a month. NOK sold off more broadly with EUR/NOK breaching 10.60.
GBP/JPY Daily Outlook
Daily Pivots: (S1) 155.30; (P) 156.85; (R1) 158.33; More...
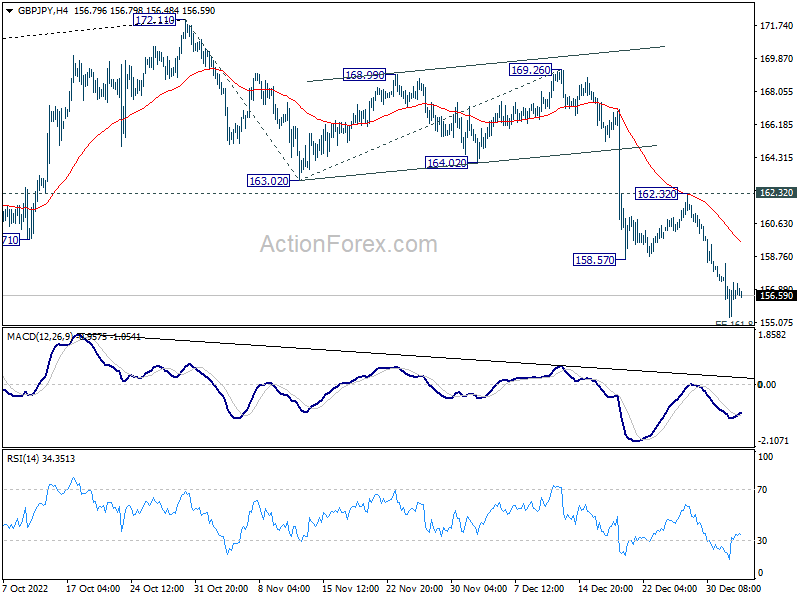
Intraday bias in GBP/JPY stays mildly on the downside for 161.8% projection of 172.11 to 163.02 from 169.26 at 154.55, and then 153.70 fibonacci level. On the upside, above 158.57 support turned resistance. will turn intraday bias neutral first. But near term outlook will stay bearish as long as 162.32 resistance holds, in case of recovery.
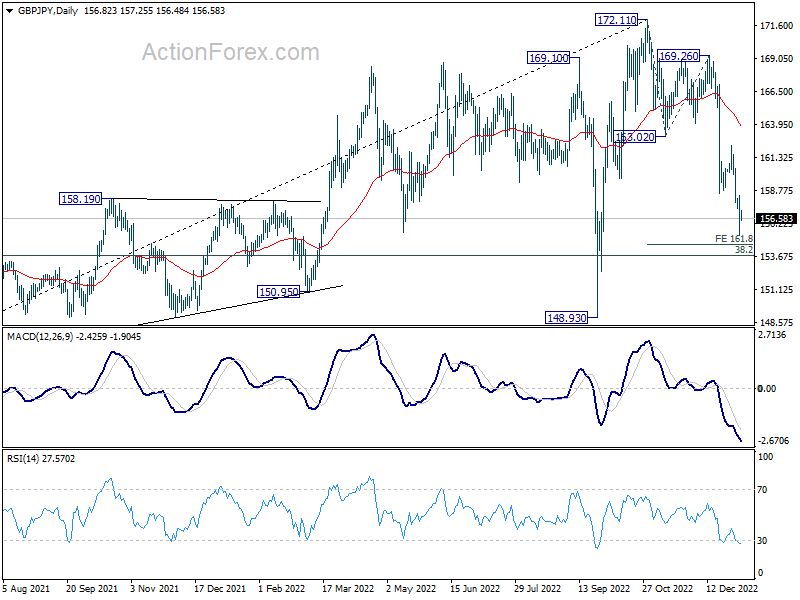
In the bigger picture, a medium term top was in place at 172.11 on on bearish divergence condition in weekly MACD. Decline from there should target 38.2% retracement of 123.94 to 172.11 at 153.70. Sustained break there will raise the change of trend reversal and target 61.8% retracement at 142.34. Nevertheless, break of 153.02 support turned resistance will argue that the decline has completed, and retain medium term bullishness.
EUR/JPY Daily Outlook
Daily Pivots: (S1) 137.05; (P) 138.54; (R1) 139.68; More....
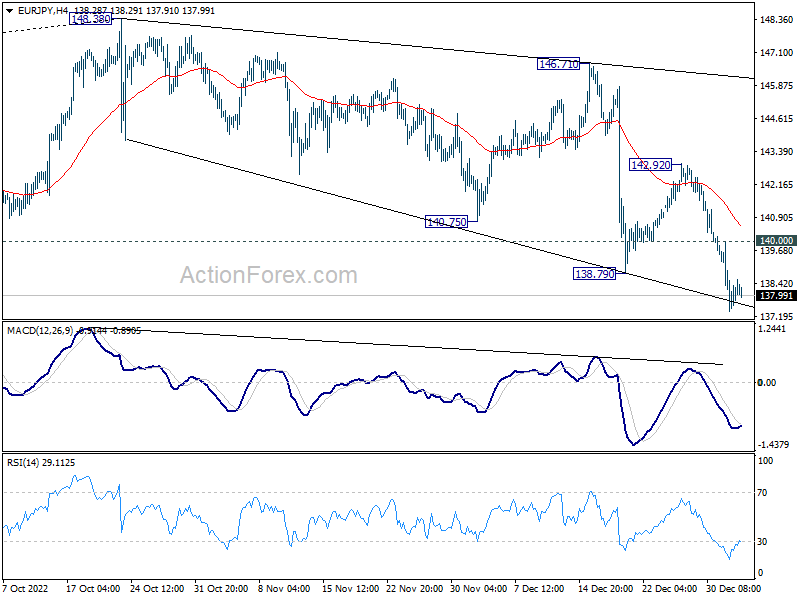
Intraday bias in EUR/JPY remains on the downside at this point. Current fall from 148.38 should target 135.40 fibonacci level. On the upside, above 140.00 minor resistance will turn intraday bias neutral first. But further decline will be expected as long as 142.92 resistance holds, in case of recovery.
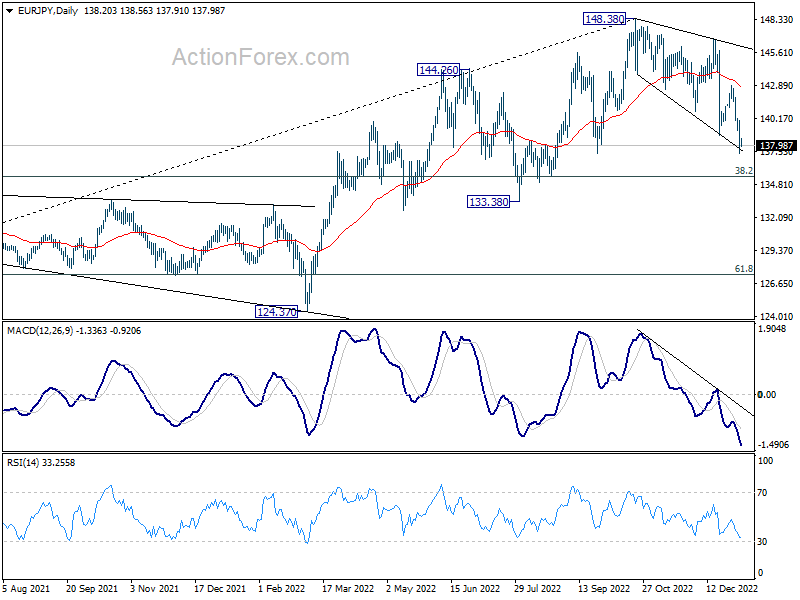
In the bigger picture, as long as 55 week EMA (now at 138.54) holds, larger up trend from 114.42 (2020 low) is still in progress for 149.76 long term resistance. However, firm break of 55 week EMA will bring deeper fall to 38.2% retracement of 114.42 to 148.38 at 135.40. Sustained break there will raise the chance of trend reversal, and target 61.8% retracement at 127.39.
EUR/GBP Daily Outlook
Daily Pivots: (S1) 0.8777; (P) 0.8820; (R1) 0.8857; More...
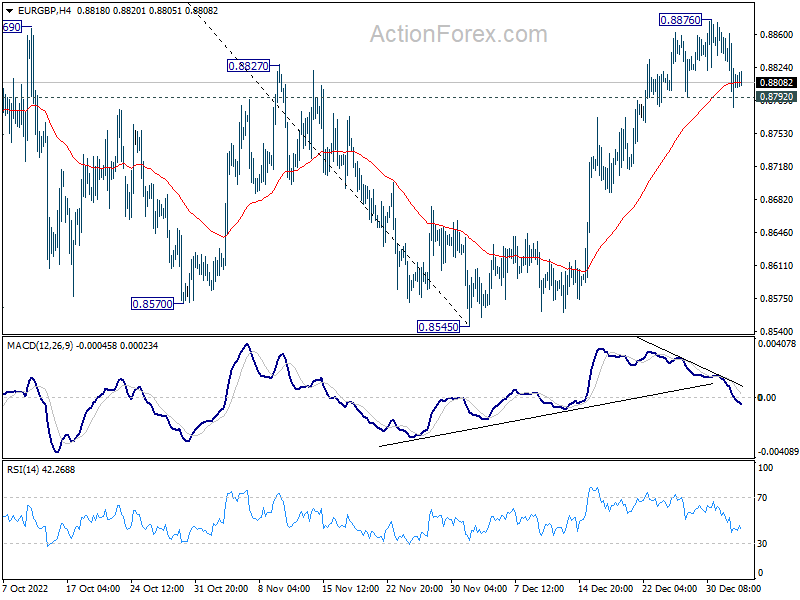
A short term top should be in place at 0.8876. Intraday bias is back on the downside for deeper retreat. Nevertheless, as long as 55 day EMA (now at 0.8711) holds, rise from 0.8545 is still in favor to continue. Above 0.8876 will resume the rally and target 61.8% retracement of 0.9276 to 0.8545 at 0.8997 and possibly above.
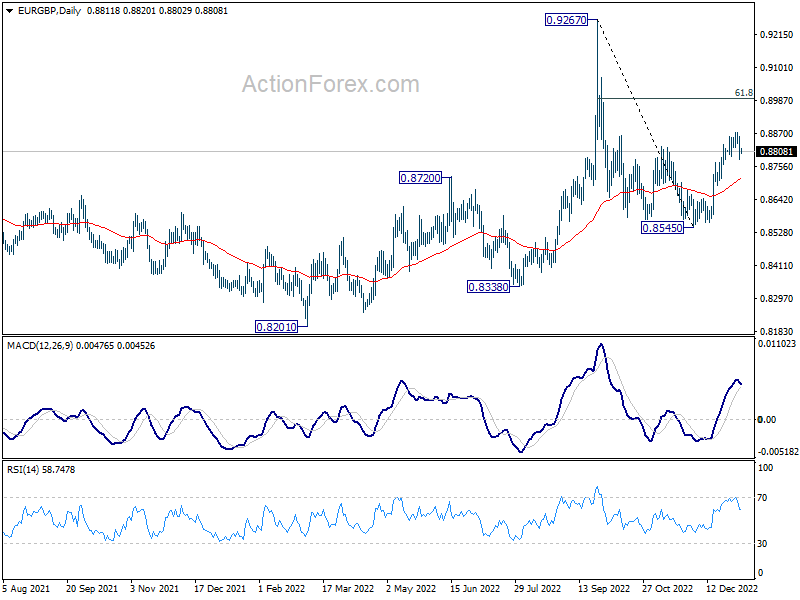
In the bigger picture, fall from 0.9267 is seen as a down leg inside long term range pattern. Deeper fall could be seen towards 0.8201/8338 support zone. But strong support should be seen there to bring reversal. Nevertheless, firm break of 0.8827 resistance will turn favor to the case that such decline is merely a correction in the up trend from 0.8201. That is, further rally would be seen at a later stage through 0.9267.
EUR/AUD Daily Outlook
Daily Pivots: (S1) 1.5617; (P) 1.5680; (R1) 1.5740; More...
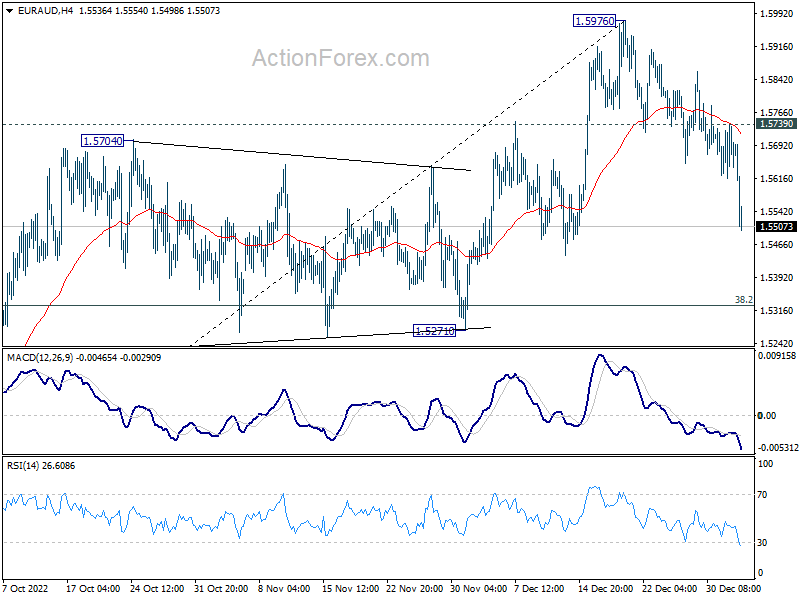
EUR/AUD's break of 55 day EMA suggests that a short term top was formed at 1.5976. Intraday bias is now on the downside for correction to 38.2% retracement of 1.4281 to 1.5976 at 1.5329. On the upside, above 1.5739 minor resistance will suggest that the pull back has finished, and bring retest of 1.5976 high.
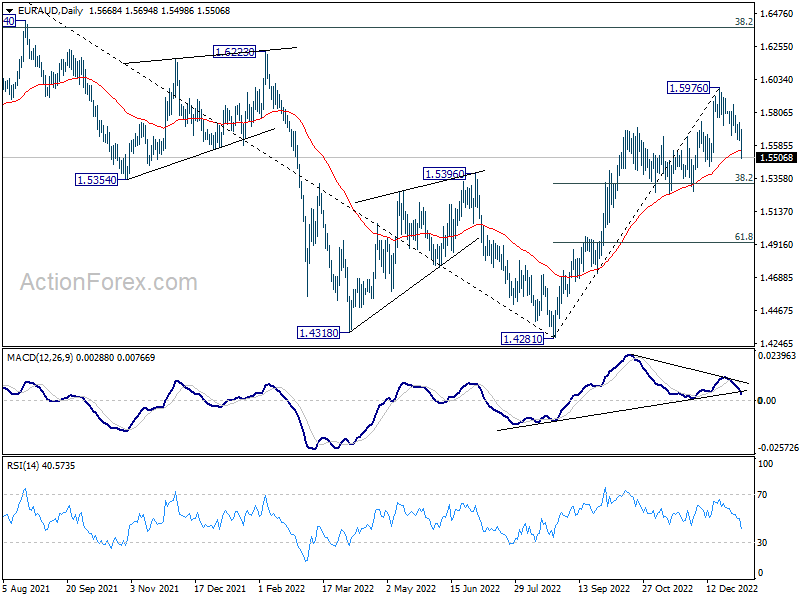
In the bigger picture, strong support from 55 week EMA affirms underlying bullishness. As long as 1.5271 support holds, rise from 1.4281 medium term bottom is expected to continue to 1.6434 key resistance next. Decisive break there should confirm medium term bullish trend reversal.
EUR/CHF Daily Outlook
Daily Pivots: (S1) 0.9841; (P) 0.9873; (R1) 0.9905; More....
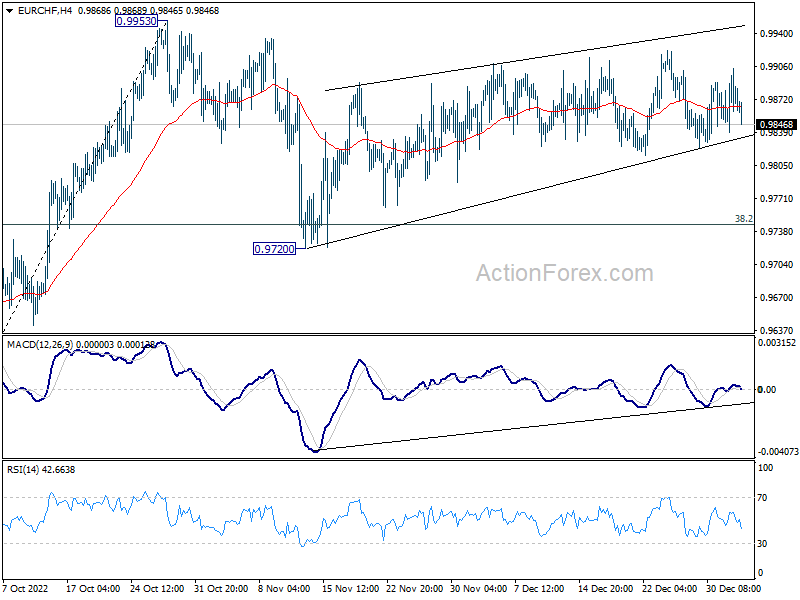
No change in EUR/CHF's outlook as it's still bounded in range below 0.9953. Intraday bias stays neutral for the moment. On the upside, firm break of 0.9953 resistance will resume larger rally from 0.9407 to 1.0072 fibonacci level. However, break of 0.9720 will extend the decline from 0.9953 to 61.8% retracement of 0.8407 to 0.9953 at 0.9616.
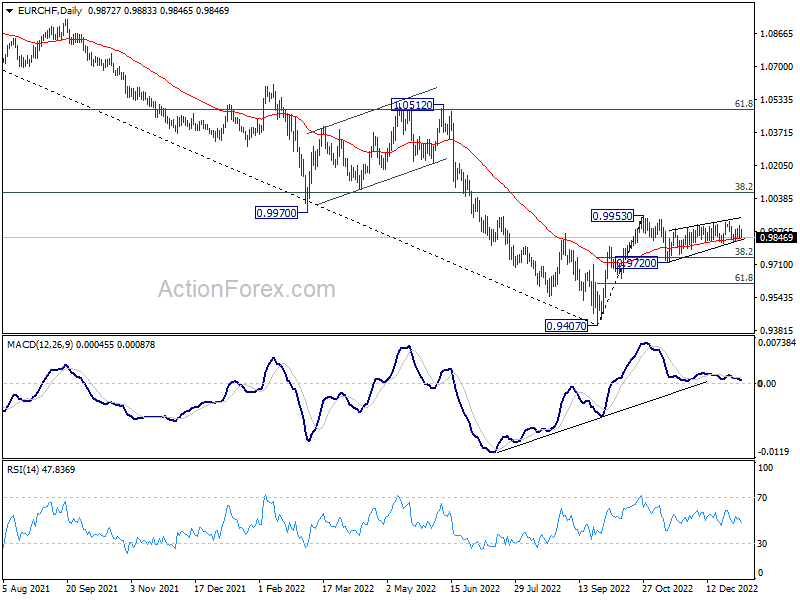
In the bigger picture, as long as 38.2% retracement of 1.1149 to 0.9407 at 1.0072 holds, price actions from 0.9407 medium term bottom will be treated as a corrective pattern. That is, long term down trend would resume through this low at a later stage. Nevertheless, firm break of 1.0072 will also have 55 week EMA (now at 1.0053) taken out. That would be an initial sign of long term bullish reversal.
EUR/USD Daily Outlook
Daily Pivots: (S1) 1.0485; (P) 1.0584; (R1) 1.0648; More...
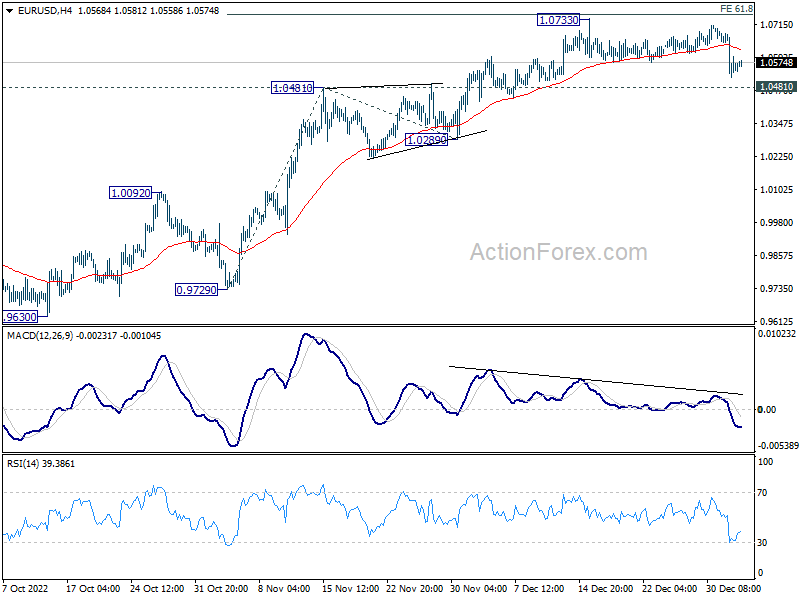
EUR/USD is still bounded in range of 1.0481/0733 and intraday bias remains neutral for the moment. On the downside, break of 1.0481 will confirm short term topping, on bearish divergence condition in 4 hour MACD. Deeper fall would be seen back to 1.0289 support and below. On the upside, however, firm break of 61.8% projection of 0.9729 to 1.0481 from 1.0289 at 1.0754 will pave the way to 100% projection at 1.1041.
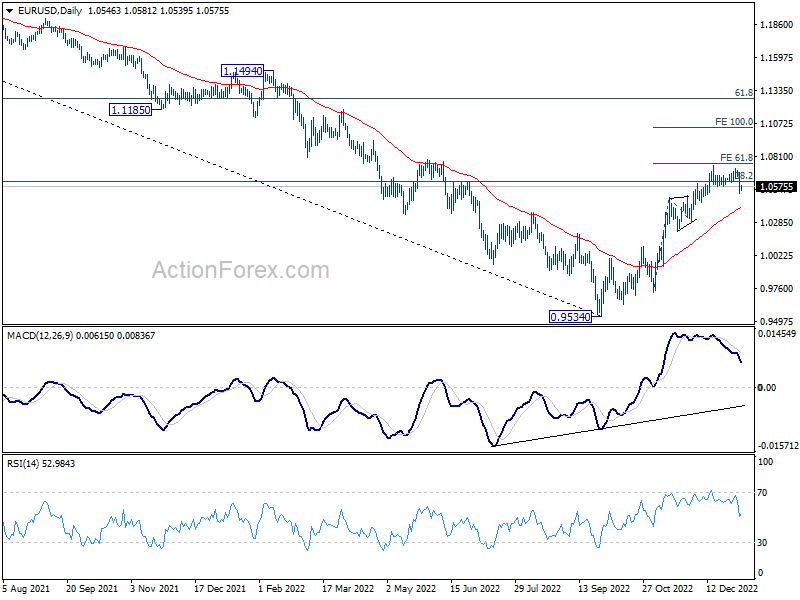
In the bigger picture, focus stays on 38.2% retracement of 1.2348 (2021 high) to 0.9534 at 1.0609. Rejection by 1.0609 will suggest that price actions from 0.9534 medium term bottom are developing into a corrective pattern. Thus, medium bearishness is retained for another fall through 0.9534 at a later stage. However, sustained break of 1.0609 will raise the chance of trend reversal and target 61.8% retracement at 1.1273.
GBP/USD Daily Outlook
Daily Pivots: (S1) 1.1885; (P) 1.1985; (R1) 1.2069; More...
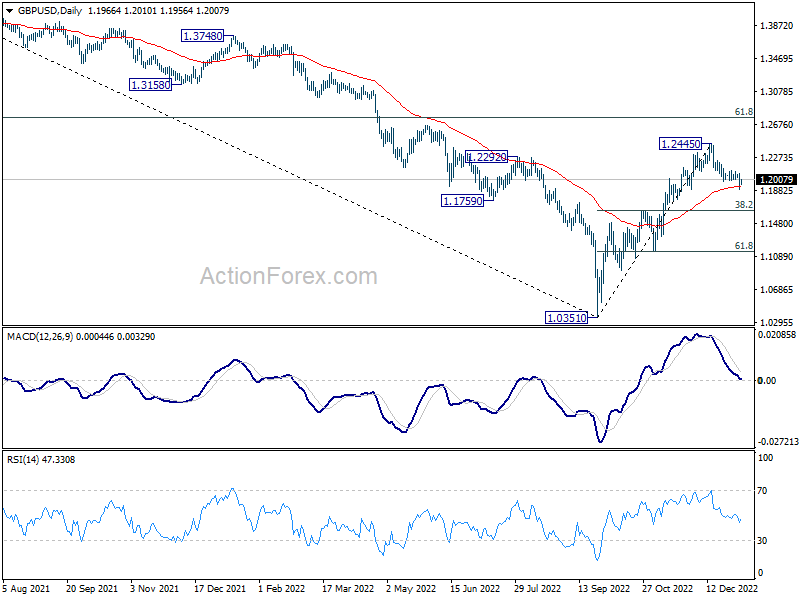
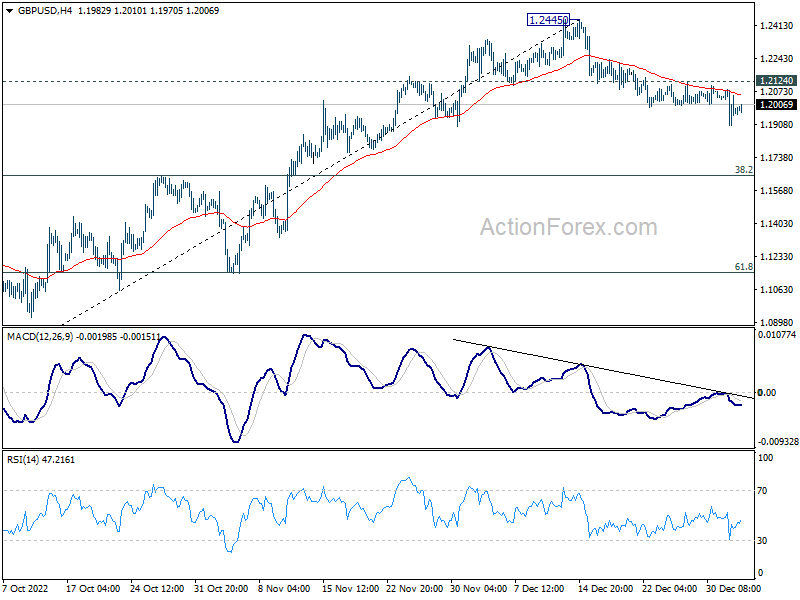
Intraday bias in GBP/USD remains on the downside as fall from 1.2445 is in progress. Firm break of 55 day EMA (now at 1.1925 will target 38.2% retracement of 1.0351 to 1.2445 at 1.1645 next. However, strong rebound from 55 day EMA, followed by break of 1.2124 resistance, will argue that the pull back from 1.2445 has completed, and turn bias back to the upside for retesting this high.
In the bigger picture, rise from 1.0351 medium term bottom is at least correcting whole down trend from 1.4248 (2021 high). Further rise is expected as long as 1.1644 resistance turned support holds. Next target is 61.8% retracement of 1.4248 to 1.0351 at 1.2759. Sustained break there will pave the way back to 1.4248. This will remain the favored case as long as 55 day EMA (now at 1.1916) holds.