Sample Category Title
USD/CHF Mid-Day Outlook
Daily Pivots: (S1) 0.9213; (P) 0.9238; (R1) 0.9272; More...
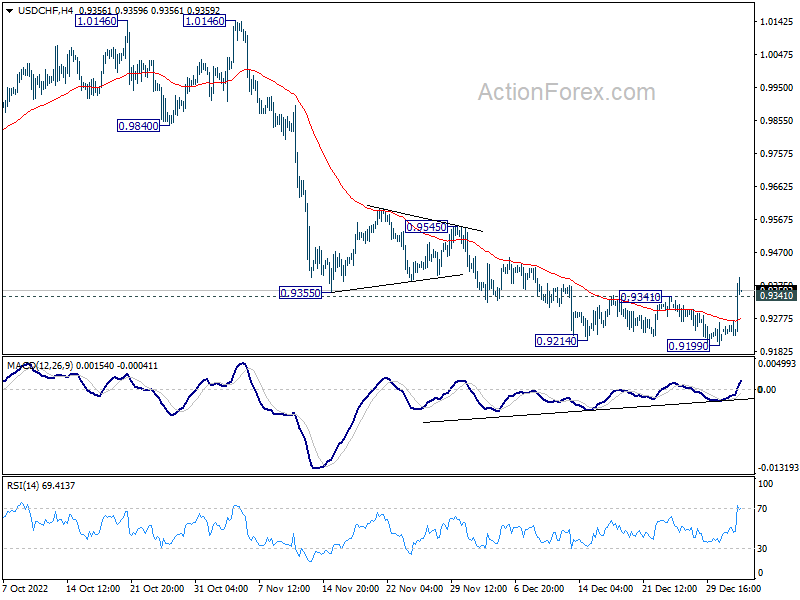
USD/CHF rebounds notably today and break of 0.9341 resistance suggests short term bottoming at 0.9199, on bullish convergence condition in 4 hour MACD. Intraday bias is back on the upside for 55 day EMA (now at 0.9473). For now, rise will stay mildly on the upside as long as 0.9199 support holds, in case of retreat.
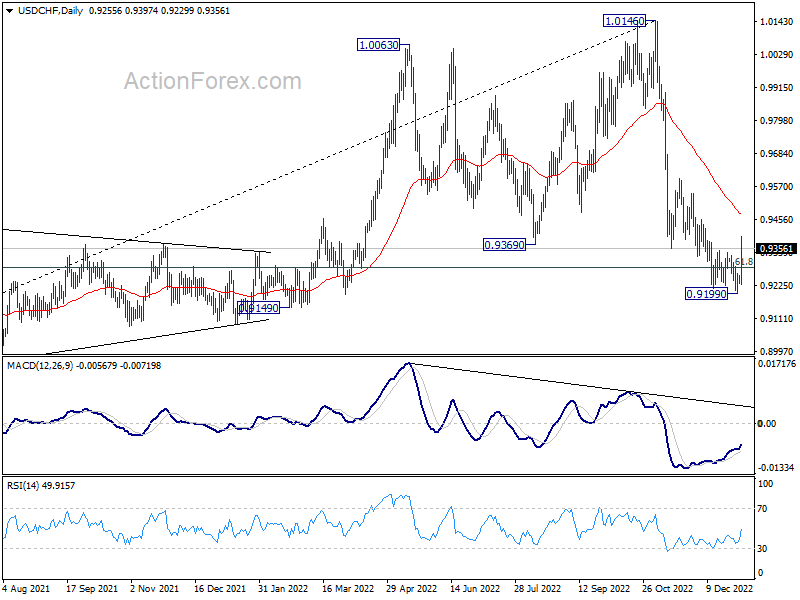
In the bigger picture, rise from 0.8756 (2021 low) has completed at 1.0146, well ahead of 1.0342 long term resistance (2016 high). Based on current downside momentum, fall from 1.0146 might be a medium term down trend itself. Sustained break of 61.8% retracement of 0.8756 to 1.0146 at 0.9287 will pave the way to 0.8756. In any case, risk will stay on the downside as long as 0.9545 resistance holds.
USD/JPY Mid-Day Outlook
Daily Pivots: (S1) 130.50; (P) 130.79; (R1) 130.96; More...
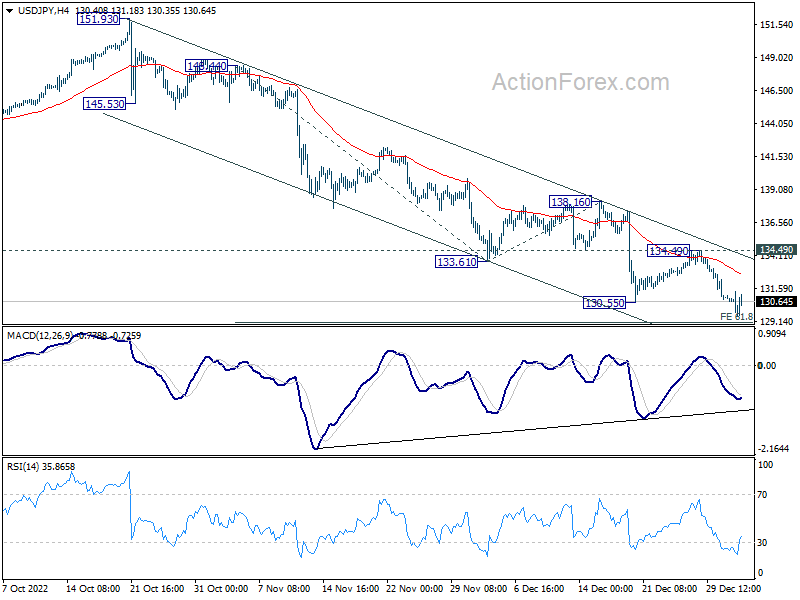
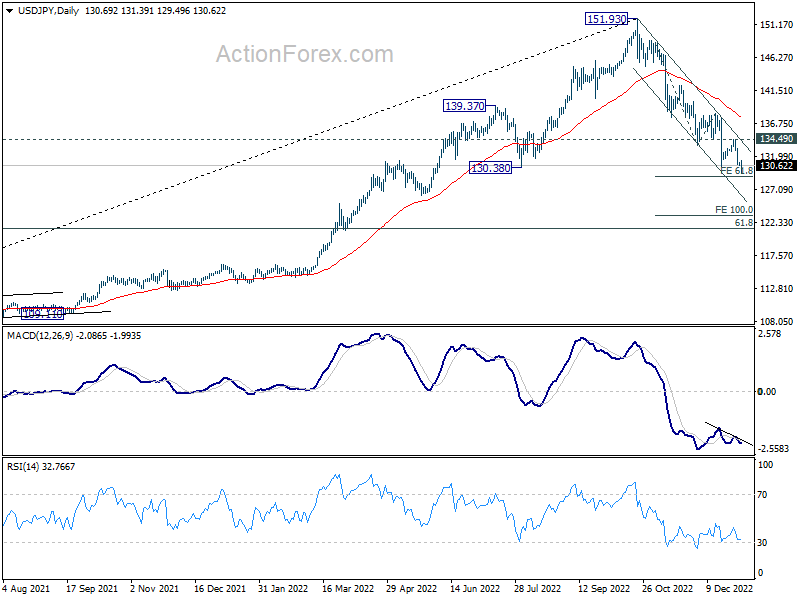
Intraday bias in USD/JPY remains on the downside for the moment. Current decline from 151.93 is in progress. Firm break of 61.8% projection of 148.44 to 133.61 from 138.16 at 128.99 could trigger downside acceleration to 100% projection at 123.33. For now, outlook will remain bearish as long as 134.49 support holds, in case of recovery.
In the bigger picture, a medium term top was in place at 151.93. Sustained trading below 55 week EMA (now at 131.65) would raise the chance of bearish trend reversal. Deeper fall would be seen to 61.8% retracement of 102.58 to 151.93 at 121.43. This will now remain the favored case as long as 55 day EMA (now at 137.54) holds.
GBP/USD Mid-Day Outlook
Daily Pivots: (S1) 1.2016; (P) 1.2065; (R1) 1.2096; More...
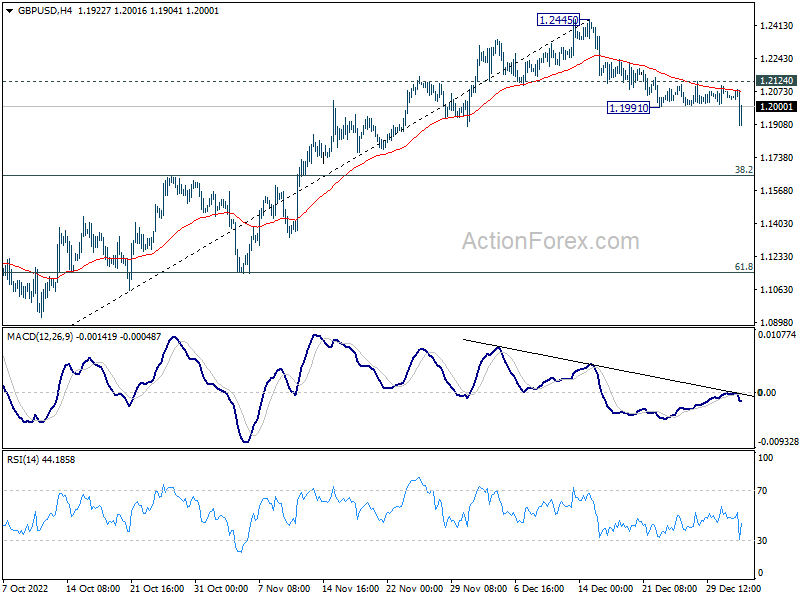
GBP/USD's decline from 1.2445 resumed today by breaking through 1.1991. Intraday bias is back on the downside. Firm break of 55 day EMA (now at 1.1925 will target 38.2% retracement of 1.0351 to 1.2445 at 1.1645 next. However, strong rebound from 55 day EMA, followed by break of 1.2124 resistance, will argue that the pull back from 1.2445 has completed, and turn bias back to the upside for retesting this high.
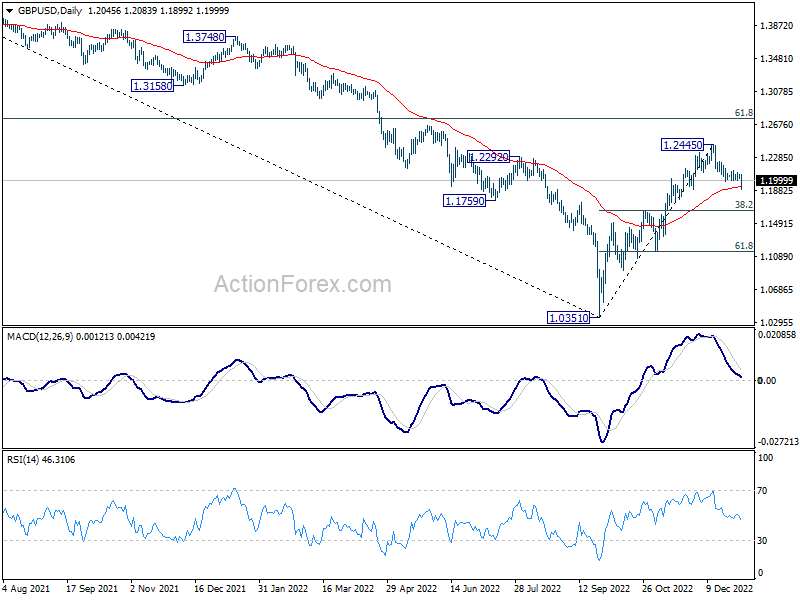
In the bigger picture, rise from 1.0351 medium term bottom is at least correcting whole down trend from 1.4248 (2021 high). Further rise is expected as long as 1.1644 resistance turned support holds. Next target is 61.8% retracement of 1.4248 to 1.0351 at 1.2759. Sustained break there will pave the way back to 1.4248. This will remain the favored case as long as 55 day EMA (now at 1.1916) holds.
Dollar Rises Broadly, But Sustainability in Question
Dollar rises broadly in the early part of European session for now apparent reason. Risk sentiment is so far positive with rallies in major European indexes and US futures. US benchmark yield is actually falling. There is also no follow through buying in the greenback after lower than expected Germany inflation reading. Sustainability of Dollar's rise should be closely monitored. For now, Yen is the second strongest, followed by Sterling. Kiwi is the worst followed by Aussie. Euro and Canadian are mixed.
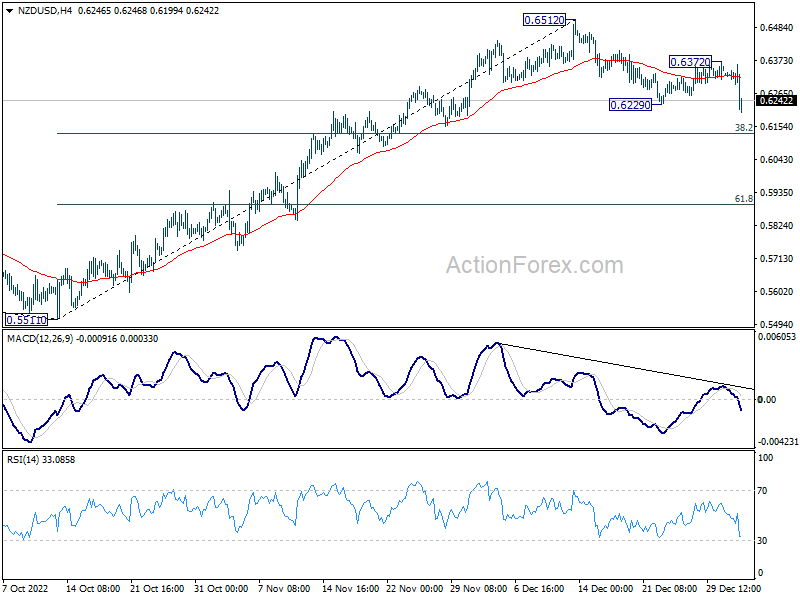
Technically, NZD/USD's fall from 0.6512 resume by breaking through 0.6229 support. Deeper decline is now expected as long as 0.6372 resistance holds, to 38.2% retracement of 0.5511 to 0.6512 at 0.6130. At the same time, some attention would on whether AUD/USD would follow through 0.6628 support.
In Europe, at the time of writing, FTSE is up 1.21%. DAX is up 0.71%. CAC is up 0.45%. Germany 10-year yield is down -0.066 at 2.386. Earlier in Asia, Hong Kong HSI rose 1.84%. China Shanghai SSE rose 0.88%. Singapore Strait Times dropped -0.17%. Japan was still on holiday.
UK PMI manufacturing finalized at 45.3 in Dec, took a further turn for the worse
UK PMI Manufacturing was finalized at 45.3 in December, down from 46.5 in November, a 31-month low. S&P Global noted that production and new orders fell at faster rates, leading to accelerated job losses. Selling price and input cost inflation eased.
Rob Dobson, Director at S&P Global Market Intelligence, said: "The UK manufacturing downturn took a further turn for the worse at the end of the year. Output contracted at one of the quickest rates during the past 14 years, as new order inflows weakened and supply chain issues continued to bite. The decline in new business was worryingly steep, as weak domestic demand was accompanied by a further marked drop in new orders from overseas.
China Caixin PMI manufacturing fell to 49.0, infections expected to explode in short term
China Caixin PMI Manufacturing fell from 49.4 to 49.0 in December, below expectation of 49.3. Caixin added that production declined further albeit at a slower rate. Steeper fall was seen in new orders. But business confidence improved to 10-month high.
Wang Zhe, Senior Economist at Caixin Insight Group said: "Covid outbreaks rapidly spread across China in November, causing a number of macroeconomic indicators to fall sharply and adding to pressure on the economy. On Dec. 7, China announced 10 new measures to further optimize Covid containment. In the short term, infections are expected to explode, which will severely interfere with production and everyday life. How to effectively coordinate Covid controls with economic and social development has once again become a crucial question."
GBP/USD Mid-Day Outlook
Daily Pivots: (S1) 1.2016; (P) 1.2065; (R1) 1.2096; More...
GBP/USD's decline from 1.2445 resumed today by breaking through 1.1991. Intraday bias is back on the downside. Firm break of 55 day EMA (now at 1.1925 will target 38.2% retracement of 1.0351 to 1.2445 at 1.1645 next. However, strong rebound from 55 day EMA, followed by break of 1.2124 resistance, will argue that the pull back from 1.2445 has completed, and turn bias back to the upside for retesting this high.
In the bigger picture, rise from 1.0351 medium term bottom is at least correcting whole down trend from 1.4248 (2021 high). Further rise is expected as long as 1.1644 resistance turned support holds. Next target is 61.8% retracement of 1.4248 to 1.0351 at 1.2759. Sustained break there will pave the way back to 1.4248. This will remain the favored case as long as 55 day EMA (now at 1.1916) holds.
Economic Indicators Update
| GMT | Ccy | Events | Actual | Forecast | Previous | Revised |
|---|---|---|---|---|---|---|
| 01:45 | CNY | Caixin Manufacturing PMI Dec | 49 | 49.3 | 49.4 | |
| 08:30 | CHF | SVME PMI Dec | 54.1 | 53 | 53.9 | |
| 08:55 | EUR | Germany Unemployment Change Dec | -13K | 15K | 17K | |
| 08:55 | EUR | Germany Unemployment Rate Dec | 5.50% | 5.50% | 5.60% | |
| 09:30 | GBP | Manufacturing PMI Dec F | 45.3 | 44.7 | 44.7 | |
| 13:00 | EUR | Germany CPI M/M Dec P | -0.80% | -0.70% | -0.50% | |
| 13:00 | EUR | Germany CPI Y/Y Dec P | 8.60% | 9.00% | 10.00% | |
| 14:30 | CAD | Manufacturing PMI Dec | 49.9 | 49.6 | ||
| 14:45 | USD | Manufacturing PMI Dec F | 46.2 | 46.2 | ||
| 15:00 | USD | Construction Spending M/M Nov | -0.40% | -0.30% |
Natural Gas Wave Analysis
- Natural gas under the bearish pressure
- Likely to fall to support level 3.630
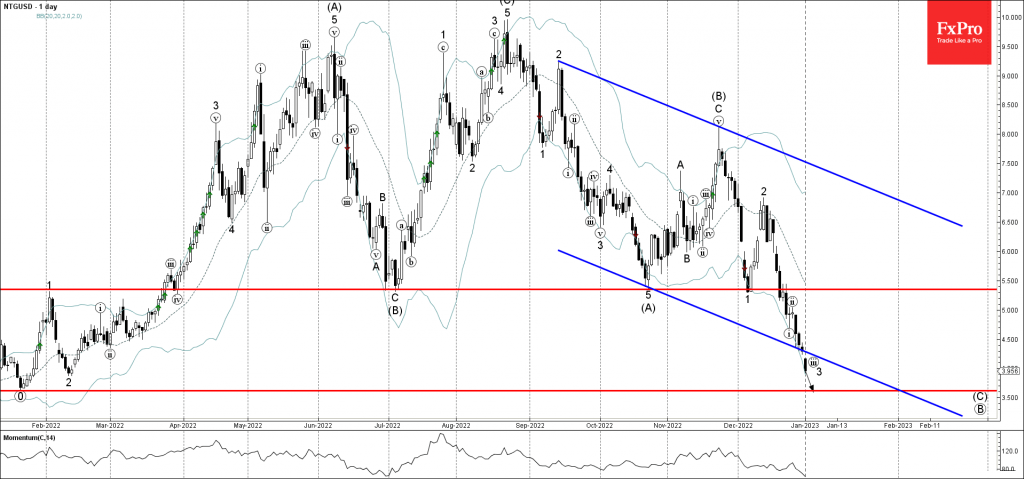
Natural gas under the bearish pressure after the earlier breakout of the support trendline of the wide down channel from the middle of September.
The breakout of this down channel accelerated the impulse wave 3 of the higher order intermediate impulse wave (C) from the end of November.
Given the clear daily downtrend, Natural gas can be expected to fall further toward the next support level 3.630 (previous strong support from December of 2021 and January of 2022).
CHFJPY Wave Analysis
- CHFJPY broke support level 141.00
- Likely to fall to support level 138.00
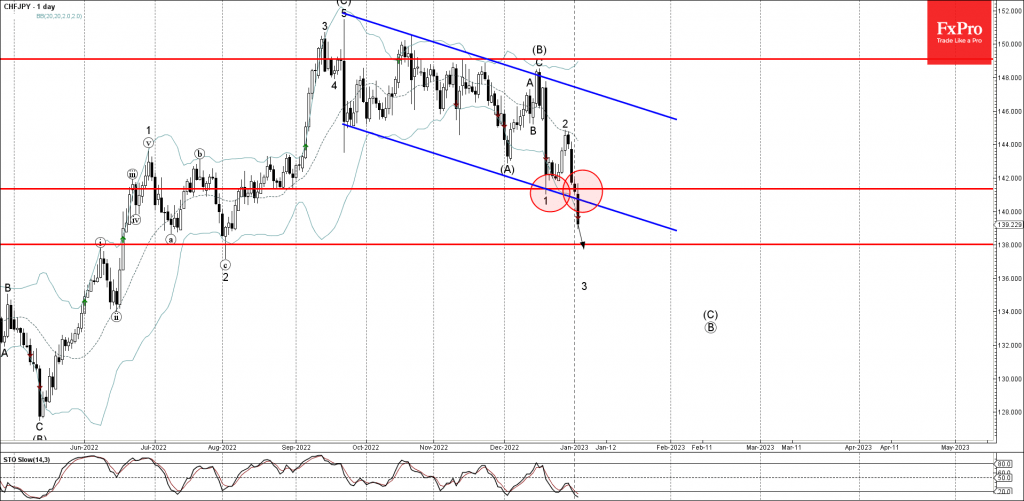
CHFJPY continues to fall after the earlier breakout of the key support level 141.00 (which stopped the previous sharp impulse wave 1 in December).
The breakout of the support level 141.00 coincided with the breakout of the daily down channel from the middle of September.
CHFJPY can be expected to fall further toward the next support level 138.00 (former support from the start of August).
EUR/USD Slides to Three-Week Low
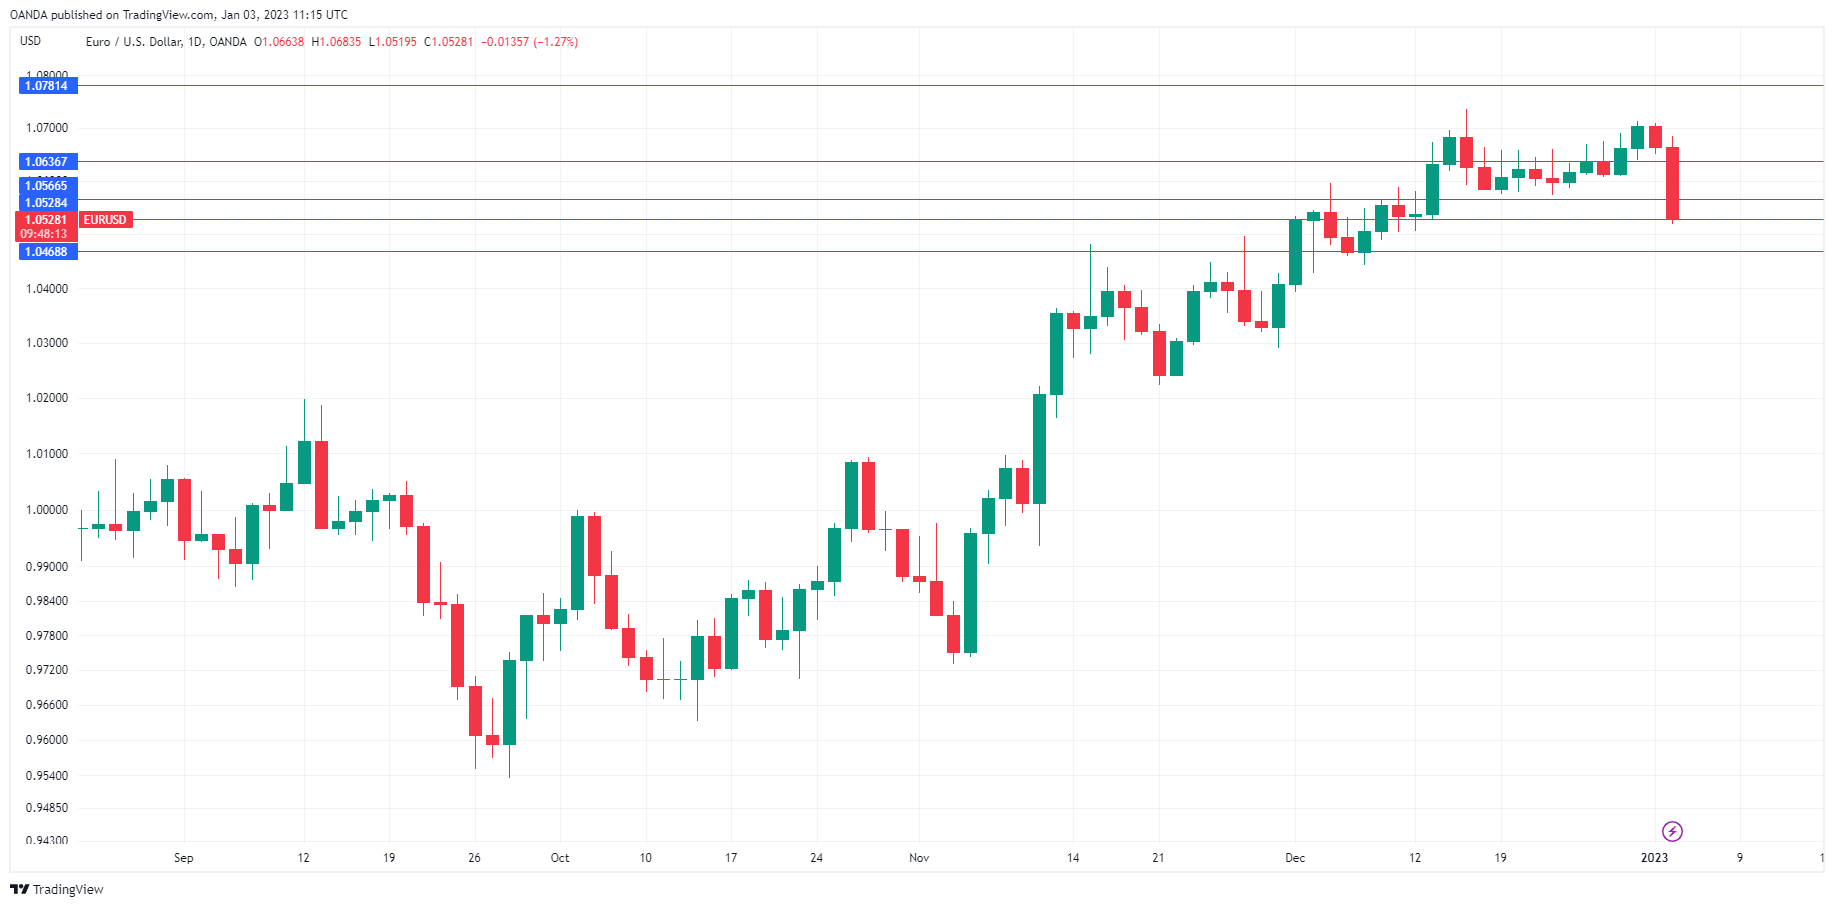
The US dollar is showing strong gains against the majors on Tuesday, with the exception of the Japanese yen. EUR/USD has tumbled by 1.27% and is trading at 1.0528 in Europe.
Investors eye German CPI
EUR/USD is sharply lower today, despite a very light economic calendar. The only release of note is German CPI, which will be released later today. Despite the lack of fundamentals, the US dollar is taking advantage of risk aversion in the markets. There are headwinds everywhere you look. The war in Ukraine, the threat of recession in the US and the eurozone and China’s slowdown all make for a gloomy outlook as we start the new year.
Germany’s inflation has been falling, and the downtrend is expected to continue. The consensus for December CPI is 9.0%, compared to 10.0% in November. If the consensus proves accurate, it could put further pressure on the euro, as the ECB may have to reconsider its hawkish stance on rate policy.
The International Monetary Fund didn’t bring any festive cheer with its pessimistic message on Monday. The IMF warned that 2023 would be tougher than 2022, as the US, EU and China would all see a decline in growth. Adding to the gloom, the IMF said that it expected one-third of the global economy to be in recession this year. In October, the IMF cut its growth outlook from 2.9% to 2.7%, due to the war in Ukraine as well as central banks around the world raising interest rates.
After the Christmas and New Year’s holidays, the markets are easing back in, as the data calendar gets busier as of Wednesday. We’ll get a look at the Fed minutes from the December meeting, which was a hawkish affair that surprised investors and gave the US dollar a boost. On Friday, the US releases the employment report, which always plays an important factor in the Federal Reserve’s rate policy.
EUR/USD Technical
- EUR/USD is testing support at 1.0528. Below, there is support at 1.0469
- There is resistance at 1.0566 and 1.0636
China Outlook: Earlier Reopening to Drive Faster Rebound
The Chinese reopening happened faster than we expected, leading us to revise the growth profile for China. We now expect GDP to take a bigger hit in Q4 and Q1 but that the recovery starts already in February/March, 3-4 months earlier than we previously expected. The weak start of the year pulls down the average of 2023 taking our annual growth forecast down to 4.6% (previously 4.9%) whereas a stronger starting point in 2024 pushes up the growth forecast to 6.0% (previously 5.3%).
As seen in other countries, reopening of the economy is set to unleash pent-up demand (see charts on p2). In China, both services and goods consumption has been depressed over the past year due to the cloud of uncertainty from the zero-covid policy and we look for a rebound in both types of spending. Travel bookings have already picked up. High savings over the past two years leaves plenty of cash in households for consumption when sentiment improves. At the Economic Work Conference in December the Chinese government also signalled that growth is a top priority in 2023 with lifting domestic demand a key focus, see Research China - Renewed focus on growth and the private sector, 20 December 2022. ,
The zero-covid policy also worsened the property crisis as it has pushed down home sales through all of 2022. We expect the reopening to improve home buyer sentiment, which in combination with more forceful easing measures towards the property sector is likely to lead to a turnaround here as well.
We also look for improving business confidence to drive a turn higher in private investments. The government has vowed to support the private sector in 2023, which could entail more positive measures and signals to underpin private investments, not least in the tech sector and manufacturing.
A Chinese recovery will have a positive spill-over to the global economy but also be an inflationary force through its' effect on commodity prices. This could challenge central banks' fight against inflation and points to a risk of more hikes and/or fewer cuts in 2023/24 than the markets are pricing.
US 500 Index Remains in Tight Range Below Short-term SMAs
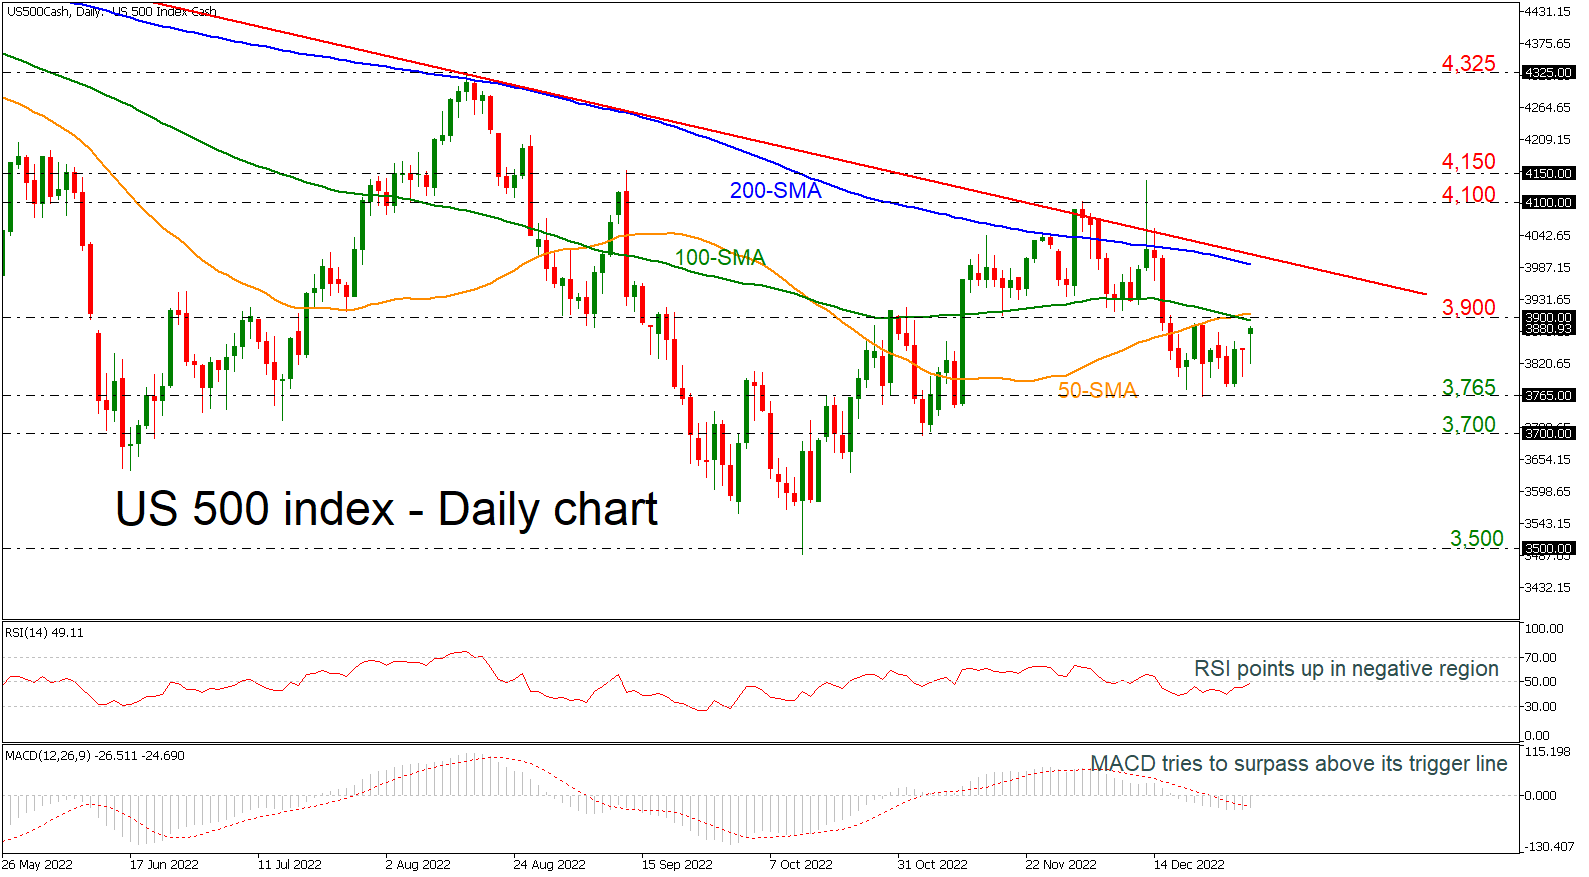
The US 500 cash index is looking more neutral as prices are consolidating within the 3,765 support and the 3,900 resistance. However, the upside momentum appears to be stronger as prices are attempting to climb above the 50- and the 100-day simple moving averages (SMAs) near the 3,900 barrier.
The upside bias is also supported by the RSI, which has been hovering near the 50-neutral level, while the MACD is surpassing its trigger line.
Should the pair manage to strengthen its positive momentum, the next resistance could come around the 200-day SMA at 3,990 ahead of the long-term descending trend line at 4,000. Above this level, the next target could be the 4,100-4,150 region.
On the flip side, if prices are unable to break higher, the risk would shift back to the downside, with the lower boundary of the neutral area at 3,765 coming into focus as well as the 3,700 support. The next key level to watch lower down is 3,500.
Summarizing, the US 500 index is bearish in the long-term timeframe but in the very short-term the index needs some boost to break the SMAs to the upside.
US 100 Index Shows Encouraging Signs
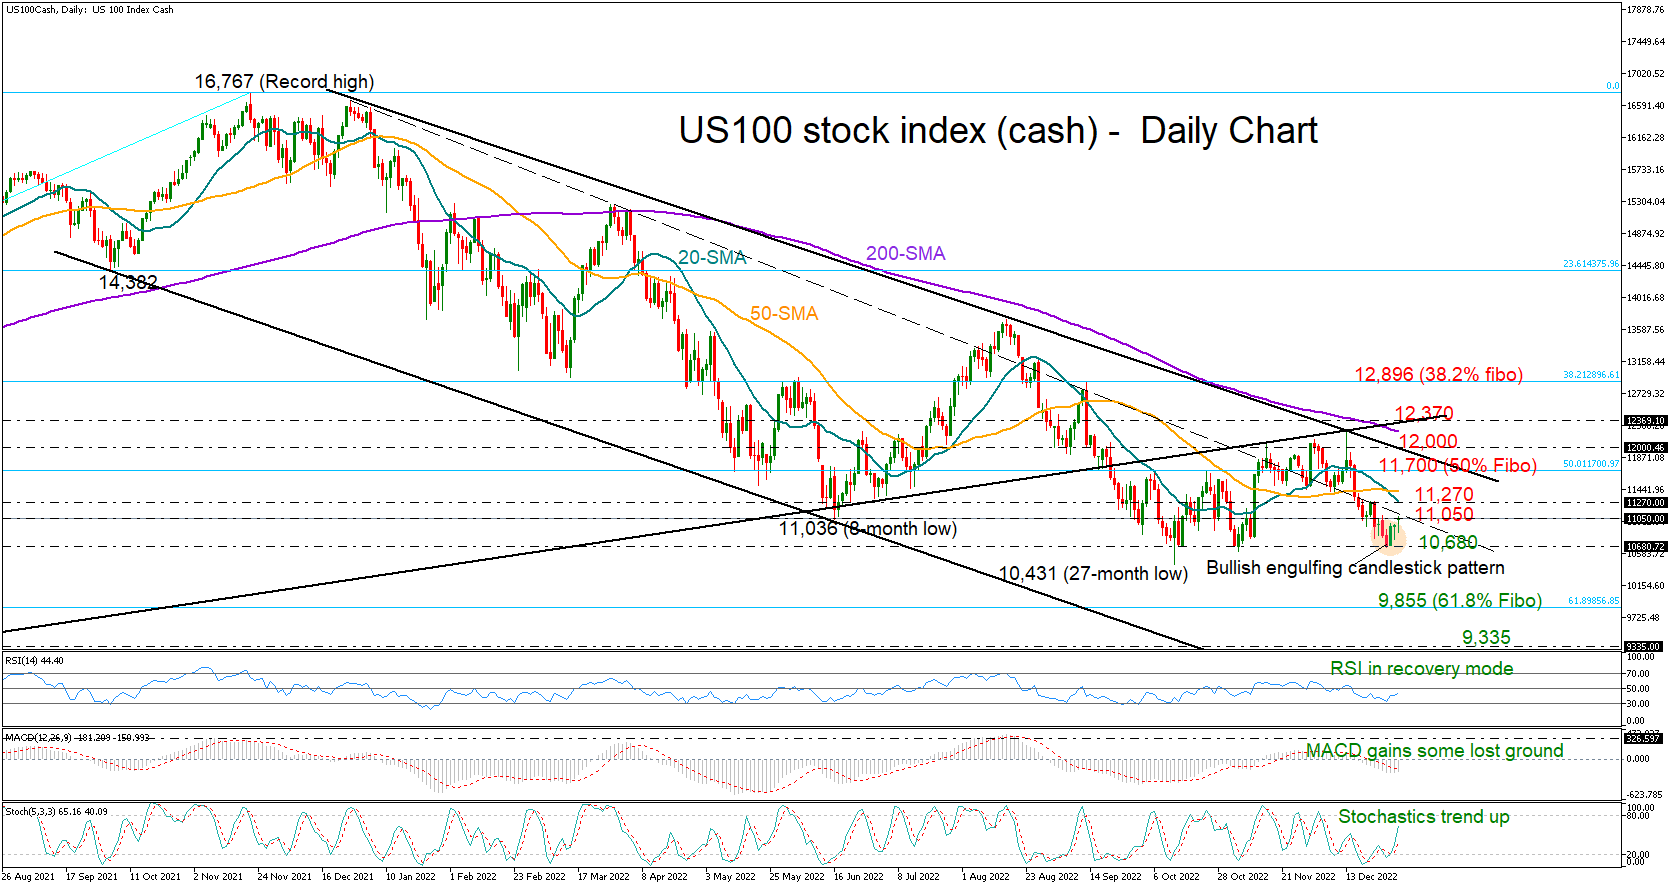
The US 100 stock index (cash) opened the new year with a gap higher at 11,050, with the bulls aiming to cross the 2022 crucial dashed trendline that resumed its resistance role last week.
The technical picture is showing signs of improvement. First of all, a triple bottom pattern seems to be in progress around 10,680, flagging a potential bullish trend reversal. In short-term signals, the positive slope in the RSI and the stochastic oscillator is an encouraging sign that upside pressures may persist during the next days, while the bullish engulfing candlestick pattern that was created last week is adding to this optimism.
There are a couple of obstacles however, which could still halt a recovery in the market. Above the dashed trendline, the 20- and 50-day simple moving averages (SMAs) could block the way towards the 50% Fibonacci retracement of the 6,634–16,767 upleg at 11,700. Slightly higher, the tough resistance trendline seen at 12,000 and the 200-day SMA will be closely watched ahead of the constraining line that ruined bullish attempts in December and November. If buyers successfully drive the market through those boundaries, the next stop could be around the 38.2% Fibonacci level of 12,896.
On the downside, a close below 10,680 could cause a brutal slide towards the 61.8% Fibonacci barrier of 9,855. If the selling interest grows further from here, some consolidation may emerge around the 9,335 barrier before the door opens for the 78.6% Fibo zone of 8,800.
In brief, the US 100 index seems to be preparing the ground for its next bullish phase, though only a decisive rally above 12,370 would confirm a positive trend reversal.