Sample Category Title
Bitcoin Gets Ready to Move
Market picture
Bitcoin has declined slightly over the past 24 hours – the bulls have still not decided to go on the offensive. Perhaps it is because of an overhang of selling orders from struggling miners.
The first cryptocurrency is trading near $16.7K to start the day on Tuesday, having retreated from its 50-day moving average but maintaining a positive bias towards the upside within the trend of several trading days. US exchanges return to action today to increase liquidity, including in cryptocurrencies.
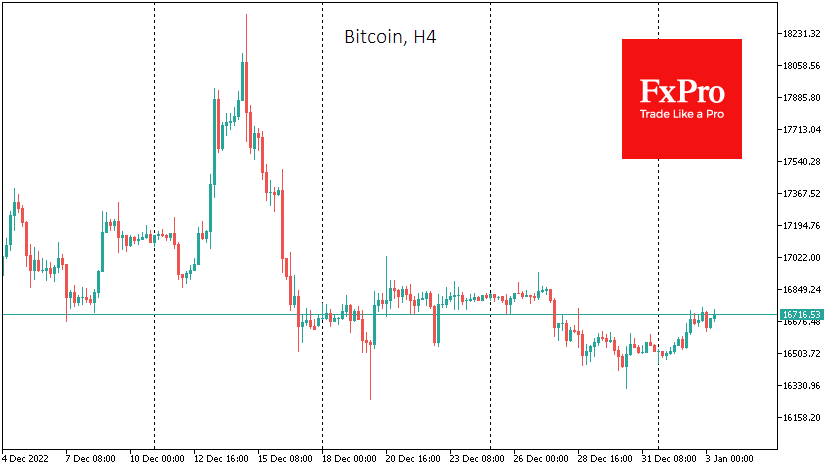
Traders should be prepared that there may be attempts to form new market trends from the new year. And it could be a decisive move upward or another sell-off after a lull.
Regarding seasonality, January is considered a neutral month for BTC. Over the past 12 years, Bitcoin has ended with growth on six occasions. The average growth over the last 12 years has been 22%, while the average decline has been 17%.
In the first case, BTC could end January at around $20,100. Second, it could finish at about $13,700, updating November’s lows. Meanwhile, in the last eight years, bitcoin has declined in January on six occasions, giving buyers of the first cryptocurrency little chance.
News background
The popular YouTube blogger Coin Bureau believes that bitcoin still needs to bottom out. In his opinion, we should expect BTC to drop to $10,000 during the first three months of 2023.
Negative sentiment in the crypto market will dominate until spring 2023, said the crypto fund QCP Capital. The Italian parliament passed a bill to tax cryptocurrency traders. Traders will now pay 26% on profits made from digital trading assets. On the other side of the coin, Britain is introducing tax breaks for foreigners trading through local brokers to make London a crypto trading hub, as it is now with currencies and metals.
Japanese Yen Breaks Below 130
The Japanese yen has posted winning sessions for three straight days and is in positive territory on Tuesday. Japanese markets are closed today for a holiday, so any strong movement from the yen is unlikely today. It’s a very light day on the economic calendar. There are no Japanese events, while the US releases Final Manufacturing PMI.
Yen keeps rolling
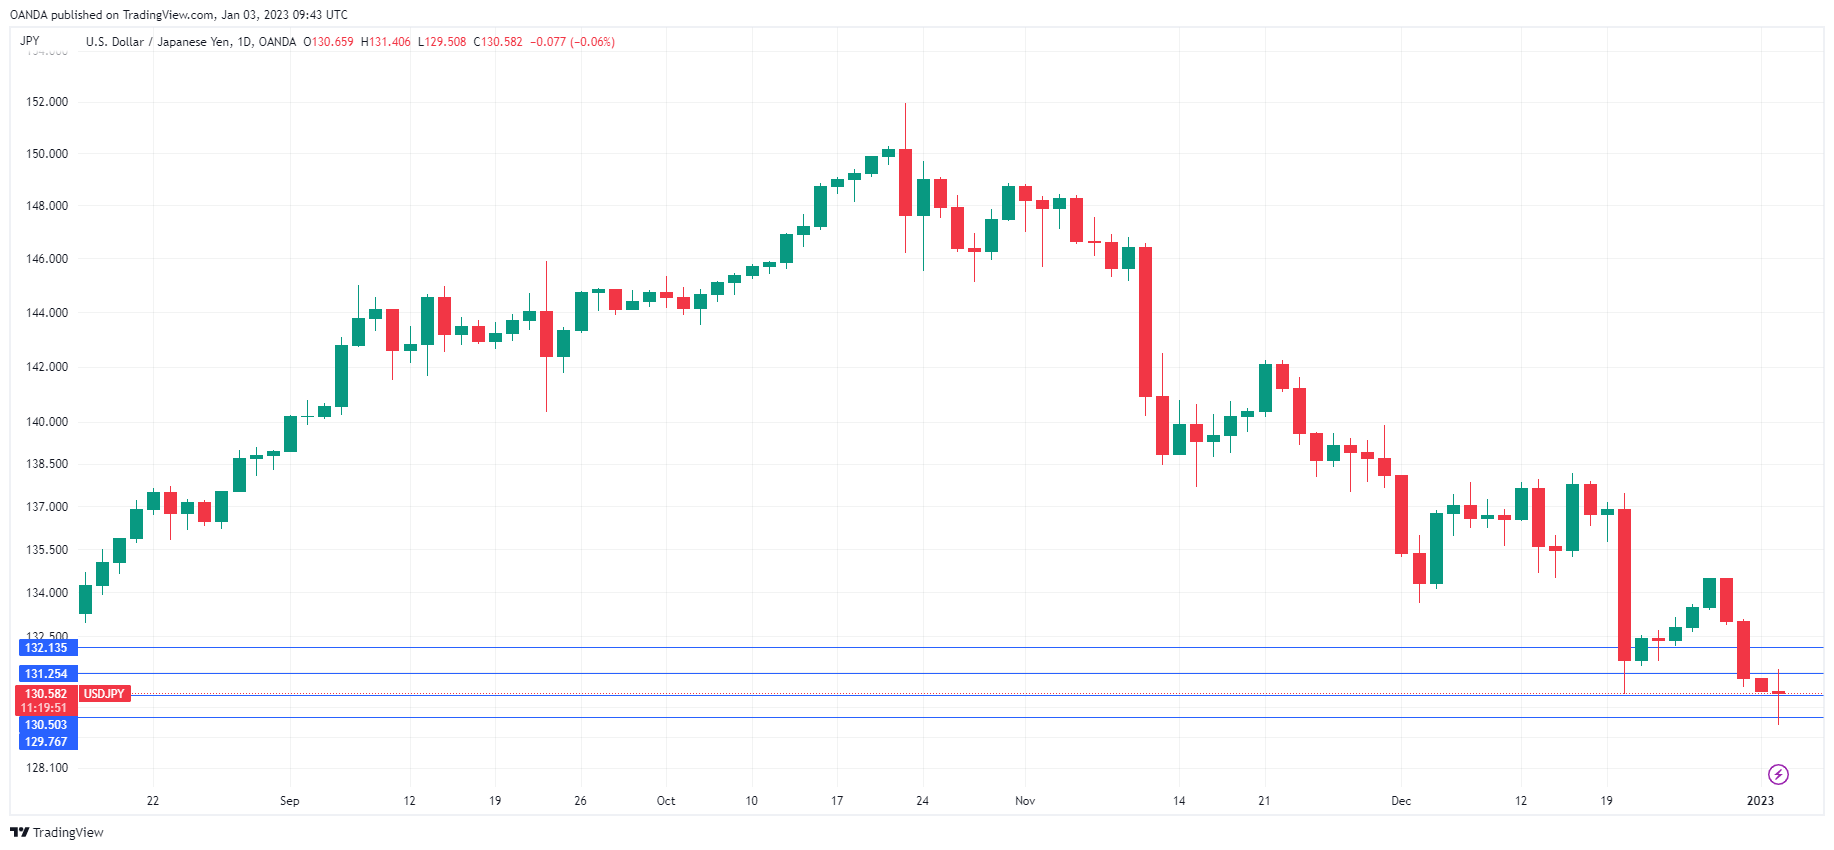
Japanese markets remain closed for an extended holiday but the good times continue for the yen. Since falling to 151 in October, the currency has rebounded and earlier today broke below the symbolic 130 level, for the first time since May. If USD/JPY closes the day below 130, that will give support for the downtrend to continue. The next target for a downside push is the 125 line, which has held since April.
Investors would love to know what the Bank of Japan has planned in the coming months. The BoJ tweaked its yield curve band in December, a move that blindsided the markets and sent the yen flying higher. With Governor Kuroda winding up his 10-year term in April, there were no expectations that Kuroda would make any significant policy changes, and the focus was on his potential successor. Kuroda has insisted that the tweak was not a prelude to the Bank exiting its massive stimulus program, but the markets aren’t so sure. What is clear is that inflation continues to rise in Japan, which is putting pressure on the BoJ to tighten policy. This could take the form of further widening the yield curve band or eliminating the 0% target for 10-year yields.
The BoJ next meets on January 18th and investors will be all ears. BoJ policy meetings used to be sleepy affairs, where board members dutifully announced they were maintaining current policy. This is clearly no longer the case, with the BoJ widening the yield curve band at the December meeting and board members discussing the impact that an exit from stimulus would have on the markets.
USD/JPY Technical
- USD/JPY is testing support at 130.50. The next support level is 129.76, which has held since June
- There is resistance at 131.25 and 132.13
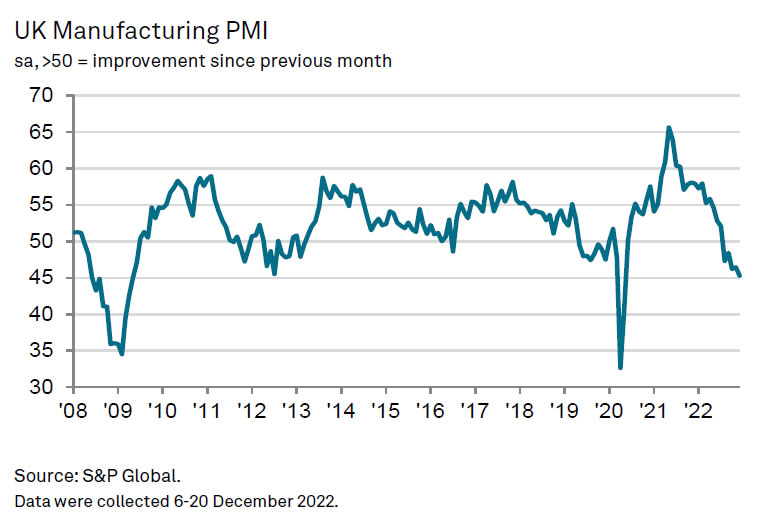
UK PMI manufacturing finalized at 45.3 in Dec, took a further turn for the worse
UK PMI Manufacturing was finalized at 45.3 in December, down from 46.5 in November, a 31-month low. S&P Global noted that production and new orders fell at faster rates, leading to accelerated job losses. Selling price and input cost inflation eased.
Rob Dobson, Director at S&P Global Market Intelligence, said: "The UK manufacturing downturn took a further turn for the worse at the end of the year. Output contracted at one of the quickest rates during the past 14 years, as new order inflows weakened and supply chain issues continued to bite. The decline in new business was worryingly steep, as weak domestic demand was accompanied by a further marked drop in new orders from overseas.
Could FOMC Minutes Shift Fed Tone?
The Fed has raised rates 7 times in a row, and the consensus among analysts is that it will do so again at the end of the month. At the moment, the majority of economics expect a 25bps hike, which would continue the "leveling off" trend from the Fed.
But, after the last meeting, Fed Chair Powell was adamant that rates would keep going up, and that the market was misreading the Fed's attention. This hawkish tone didn't have as much impact on the markets after the Fed raised at a slower pace. And it's a scenario we've seen play out before, with Powell and the minutes of the meeting not exactly being in line. Which is why there could be some riling up in the markets tomorrow with the release of the minutes. Some analysts are wondering if there will be a repeat.
What could happen again…
Back in November, there was quite a bit of discussion about when the Fed would pivot. There was expectation that following that month's FOMC meeting, Powell would drop some hints that the next meeting would have a smaller rate hike. Instead, he came out quite adamant that rates would keep going up.
But, two weeks later, the FOMC minutes came out, and were decidedly more dovish. And the Fed did ultimately make a smaller raise at the next meeting in December. Given the hawkish tone out of Powell following the last meeting, and the general market expecting the Fed to level off rates now, there is speculation that the minutes this time around could be more dovish.
Market reaction and surprises
The minutes could have an even bigger impact this time around, because FOMC members have been largely silent since the meeting. Of course, the last couple of weeks have been the year-end holidays, so it's expected that there wouldn't be much Fed commentary. Now, traders are looking to set up for the coming year, and the minutes are the first explanation of what the Fed is thinking about the current inflation trends.
The thing is, Powell wasn't the only hawkish sign from the last meeting. We also got the quarterly update with the dot-plot matrix, which shows where members see policy rates in the coming months. And there, the median rate expectation was boosted from 4.5% to 5.0%, meaning that the consensus among Fed members is more hawkish than it was at the end of the third quarter.
Figuring out where things are going
The market is currently pricing in a terminal rate of under 5.0%, while the Fed is insisting that the terminal rate will be over 5.0%. Who turns out to be right will likely depend on the data, but it doesn't take much for the Fed to prove the market wrong. With rates at 4.5% at the moment, all the Fed would have to do is raise rates by 50bps at the next meeting, repeating what they did in December, and the market would have to adjust. Almost a third of economists are forecasting that, as a matter of fact.
The takeaway from the minutes, therefore, is likely to be around how confident the members sound in their projection that rate hikes will keep coming. If they emphasize being more data dependent than anchoring expectations, then the market might believe them to be more dovish than Powell communicated most recently.
GBPUSD Pinned Down Near 200-day SMA
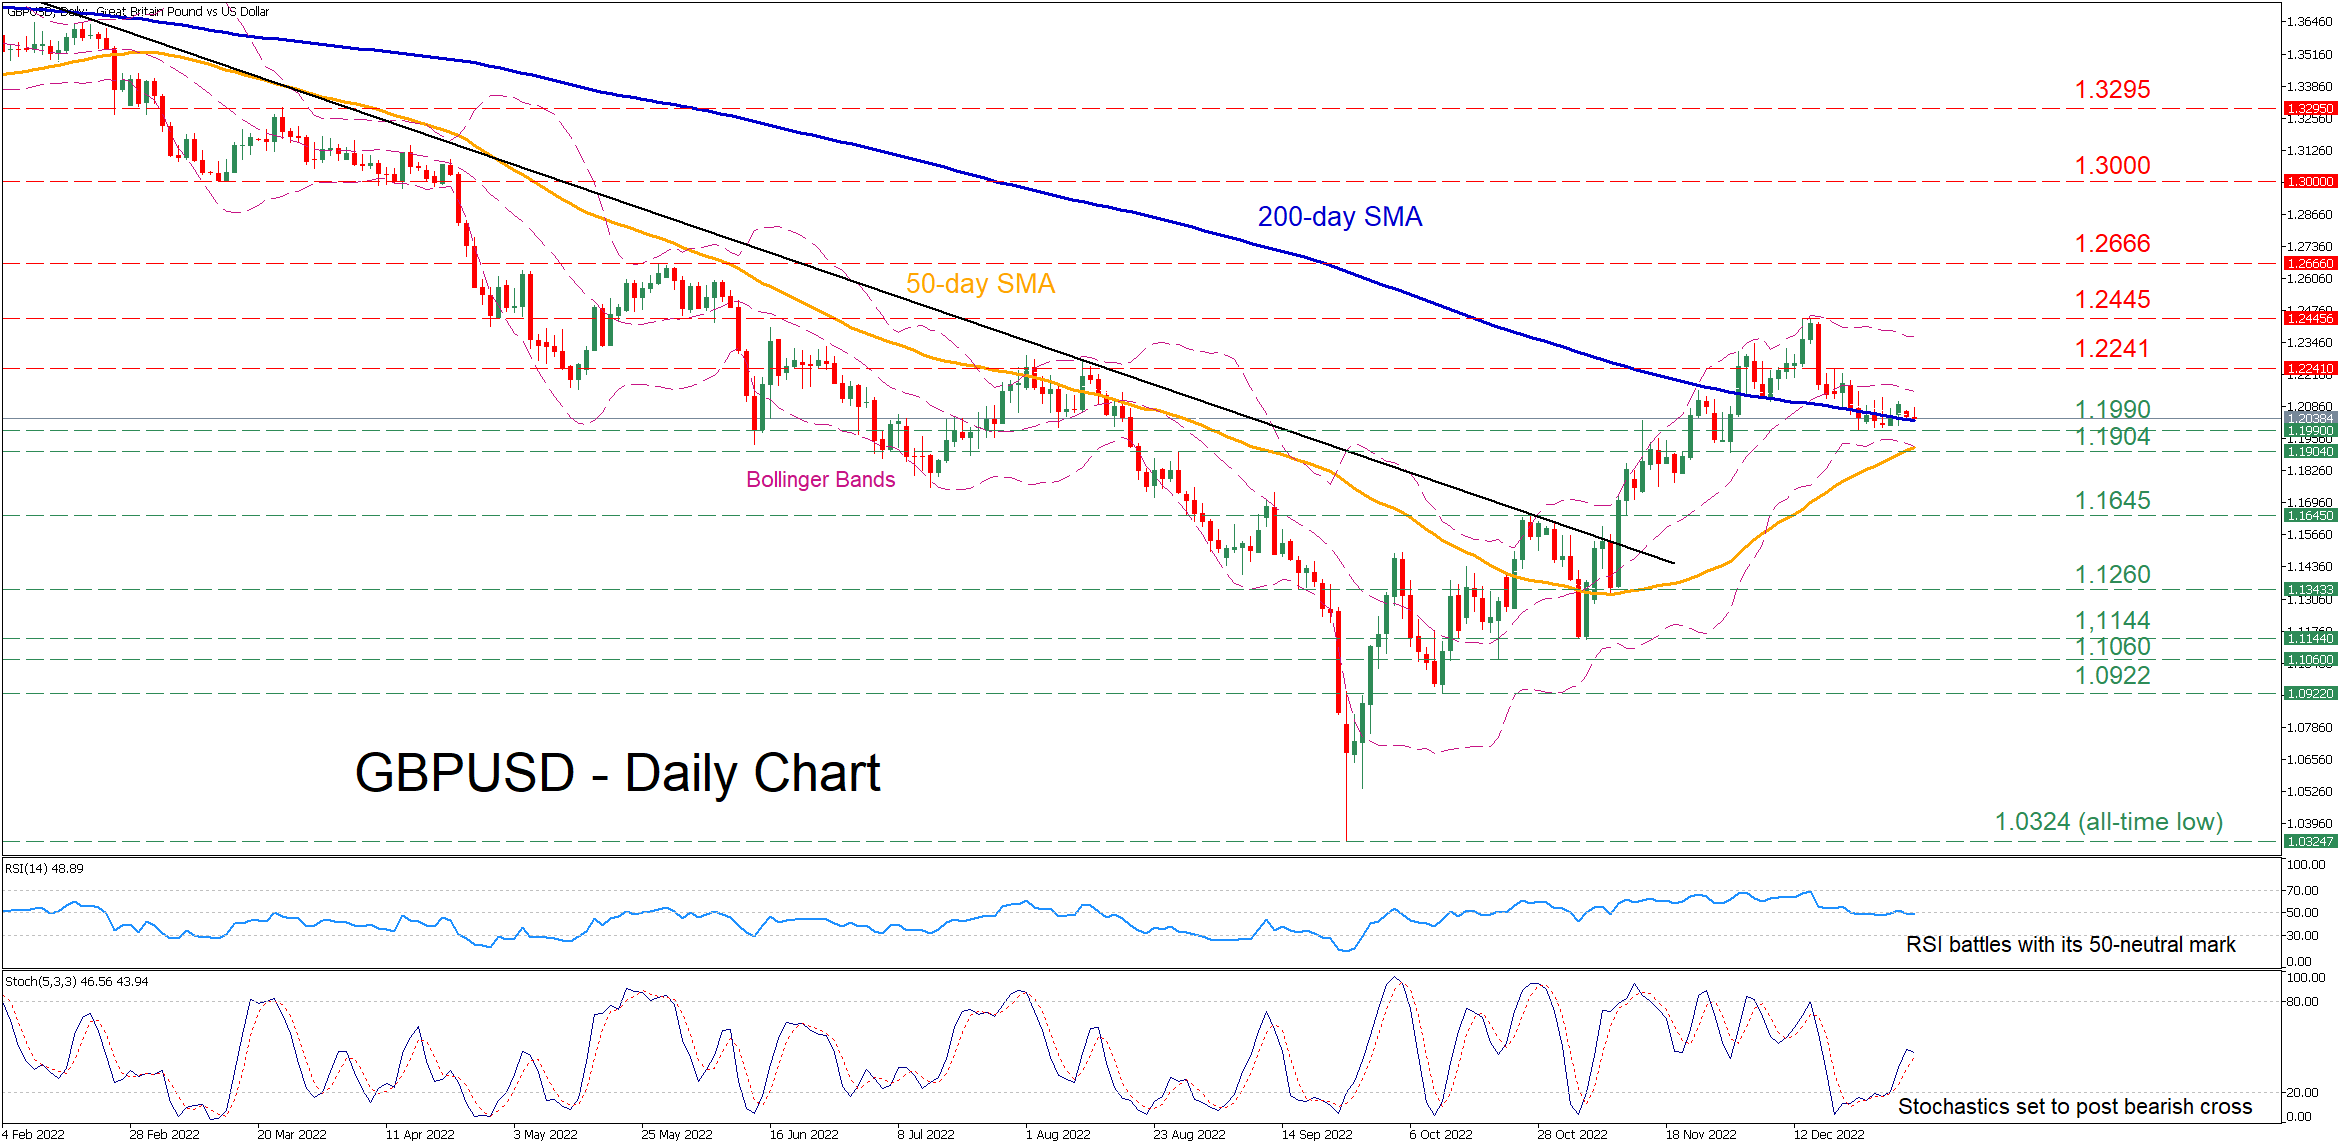
GBPUSD has been marching higher since September when the pair recorded an all-time low of 1.0324. However, in the short-term, the price appears to be stuck in a tight range around the 200-day simple moving average (SMA), with the narrowing Bollinger bands reinforcing the case of a potential impending spike.
The short-term oscillators currently suggest that near-term risks are tilted to the downside. Specifically, the RSI slid below its 50-neutral mark, while the stochastic oscillator is set to post a bearish cross.
If the negative momentum strengthens and the price extends its pullback below the 200-day SMA, immediate support could be met at the 1.1904 congested region, which includes the 50-day SMA and the lower Bollinger band. Sliding beneath that floor, the October resistance of 1.1645 may curb further declines. Failing to halt there, the 1.1260 barrier could prove to be a tough one for the price to overcome.
To the upside, bullish actions could propel the pair towards the recent resistance region of 1.2241.Violating this zone, the price might retest 1.2445, which rejected the pair’s medium-term rebound. Even higher, the bulls could aim for the May peak of 1.2666.
Overall, GBPUSD is experiencing a moderate downside correction since its uptrend encountered significant resistance. Therefore, a clear dive beneath the 200-day SMA may accelerate the downfall.
EURJPY Hits 3-month Low, But Key Support Area Nearby
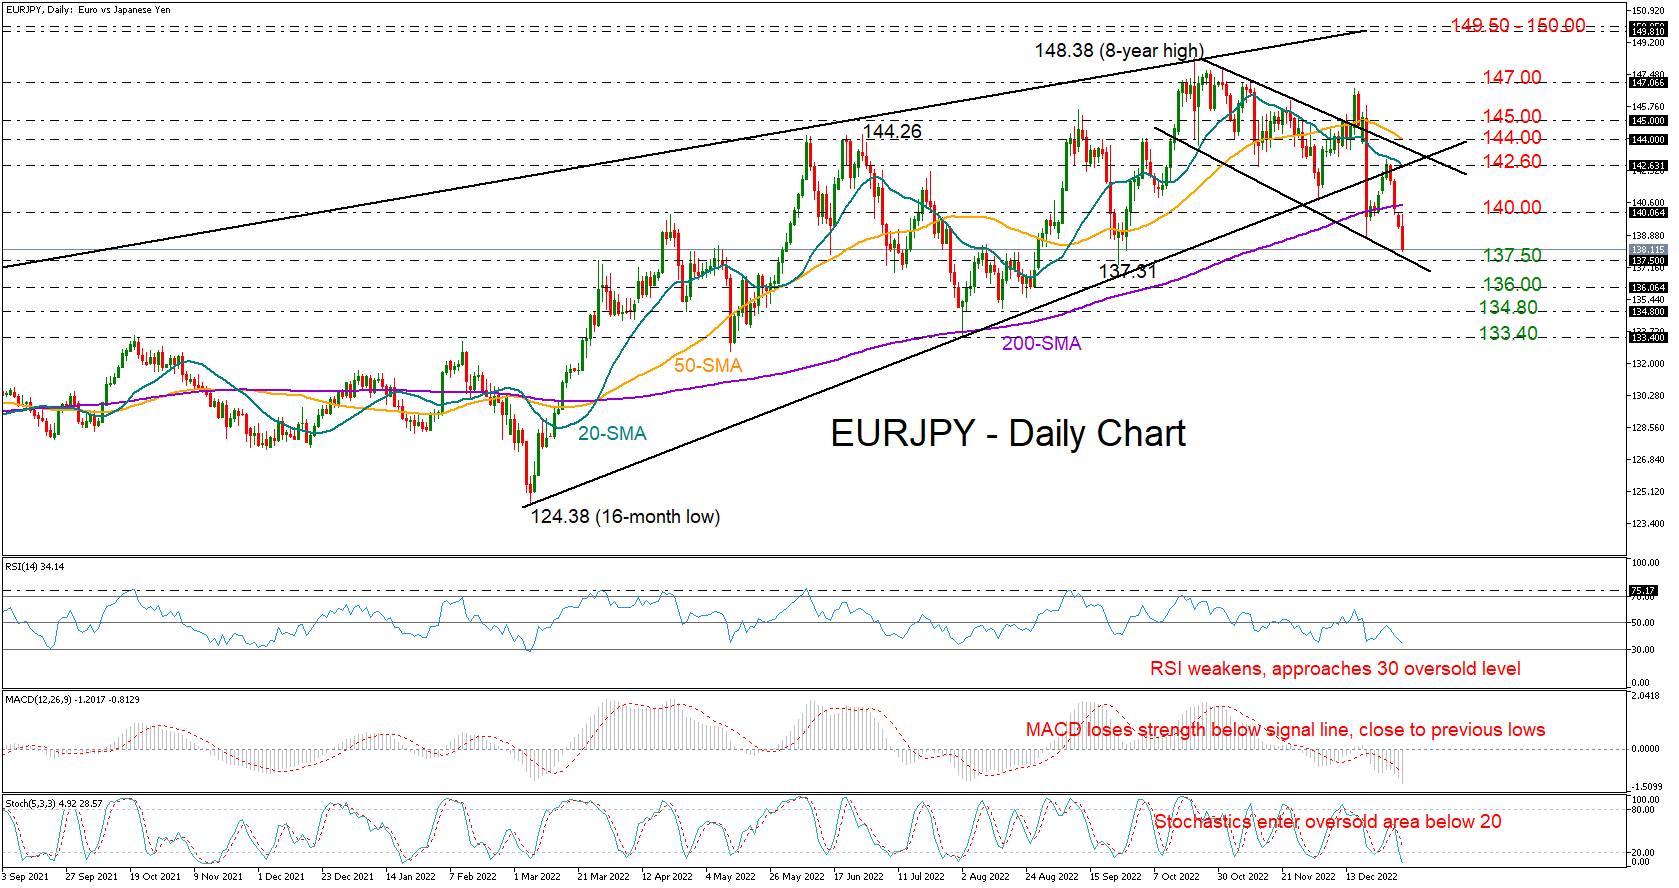
EURJPY stretched its bearish wave into the new year, tumbling to a three-month low of 138.20 on Tuesday.
Previously, the support trendline drawn from March lows turned into resistance, squeezing the price below the 200-day simple moving average (SMA). While the RSI and the stochastics have yet to confirm oversold conditions, the lower boundary of the bearish channel could soon halt the sell-off around 137.50.
If the above scenario materializes, the price may reverse up to retest the 140.00 mark. A decisive close higher and beyond the 200-day SMA could bring the ascending trendline back under examination near 142.60. Yet only a sustainable extension above the channel and the 50-day SMA at 144.00 would motivate new buying.
In the event the bears enhance their momentum below the channel, the next pivot point could develop around the 136.00 handle. Another negative correction here may take a rest near 134.80 before the way clears for the August low of 133.40.
Summarizing, although the short-term risk is tilted to the downside, EURJPY is currently approaching a key support area, raising hopes for a bullish rotation.
No More Festive Cheer
A mixed start to trading on Tuesday as traders return following the festive break to some rather gloomy forecasts for the coming year.
The IMF is among those warning of a tough year, more so than the one we've just left, as the simultaneous slowing down of the US, EU, and China takes its toll. Of course, all forecasts at this moment are subject to enormous uncertainty around the war in Ukraine, inflation, interest rates, and China's Covid response, among others, but it seems almost everyone is going into 2023 with a healthy dose of trepidation.
And following a series of nasty shocks last year, who can blame them? There is the potential for surprises this year to be of a more positive nature, of course, but as it stands, the outlook is understandably gloomy and will remain so unless something significant changes, either on the war in Ukraine or inflation.
If inflationary pressures remain stubborn - and a strong, successful transition from zero-Covid to zero restrictions could enable that - then central banks will have little choice but to continue tightening monetary policy in order to bring it down. That is something the IMF strongly urged them to do, with stubbornly high inflation deemed a far greater risk over the longer term.
As far as the economic calendar is concerned this week, we're easing ourselves back in today with mostly revised PMIs and other tier-three data. Things will pick up on that front from tomorrow, with the December Fed minutes being released alongside some more significant data and that will continue into the end of the week when we get the first jobs report of the year.
One interesting release this morning came from China, where the Caixin manufacturing PMI painted a less pessimistic picture than the official number over the weekend. While the surveys are different in the kind of firms they cover, it was interesting that the official number pointed to greater concern around the sector at the moment. That said, there does seem to be some promise in the Caixin future output index which suggests firms are more optimistic about the longer-term outlook since Covid-zero was abandoned despite the prospect of near-term difficulties.
Oil recovery continues
Oil prices are a little higher this morning as they continue to rebound strongly from their lows. Brent and WTI have recovered almost 15% from the lows a few weeks ago as traders continue to price in stronger Chinese demand. At the same time, the US is looking to refill the SPR after huge withdrawals during last year's oil price spike.
The outlook remains highly uncertain though which should ensure oil prices remain highly volatile. The G7 price cap has had little impact so far, the same can be said of Russia's response, but that could change if oil prices keep moving higher, nudging Russian crude ever closer to the cap level and forcing some very difficult decisions.
Finding momentum
Gold is rallying strongly on Tuesday, up more than 1% and gathering momentum after seeing it slip in recent weeks. The yellow metal appeared to be stuttering around $1,800 but that's suddenly changed, perhaps buoyed by the mild risk-aversion we're seeing in the markets and the expectation that the environment is looking more favorable.
This could be a year in which global growth slows significantly and traders are questioning whether that will warrant monetary policy to be loosened later in 2023. Central banks have pushed back strongly against the idea and I imagine the IMF would too at this point but we could see markets moving in that direction if the data doesn't continue to haunt us.
Range-bound
Bitcoin has remained quite stable recently, hovering in the $16,000-17,000 range over the last few weeks. That may come as a relief to the crypto crowd after another rough few months. The new year no doubt has plenty in store for cryptocurrencies but in the short term, the community may just be hoping for no new scandals that will drive investors away.
NZD/USD: Waiting for Successful Completion of the Final Wave (5)
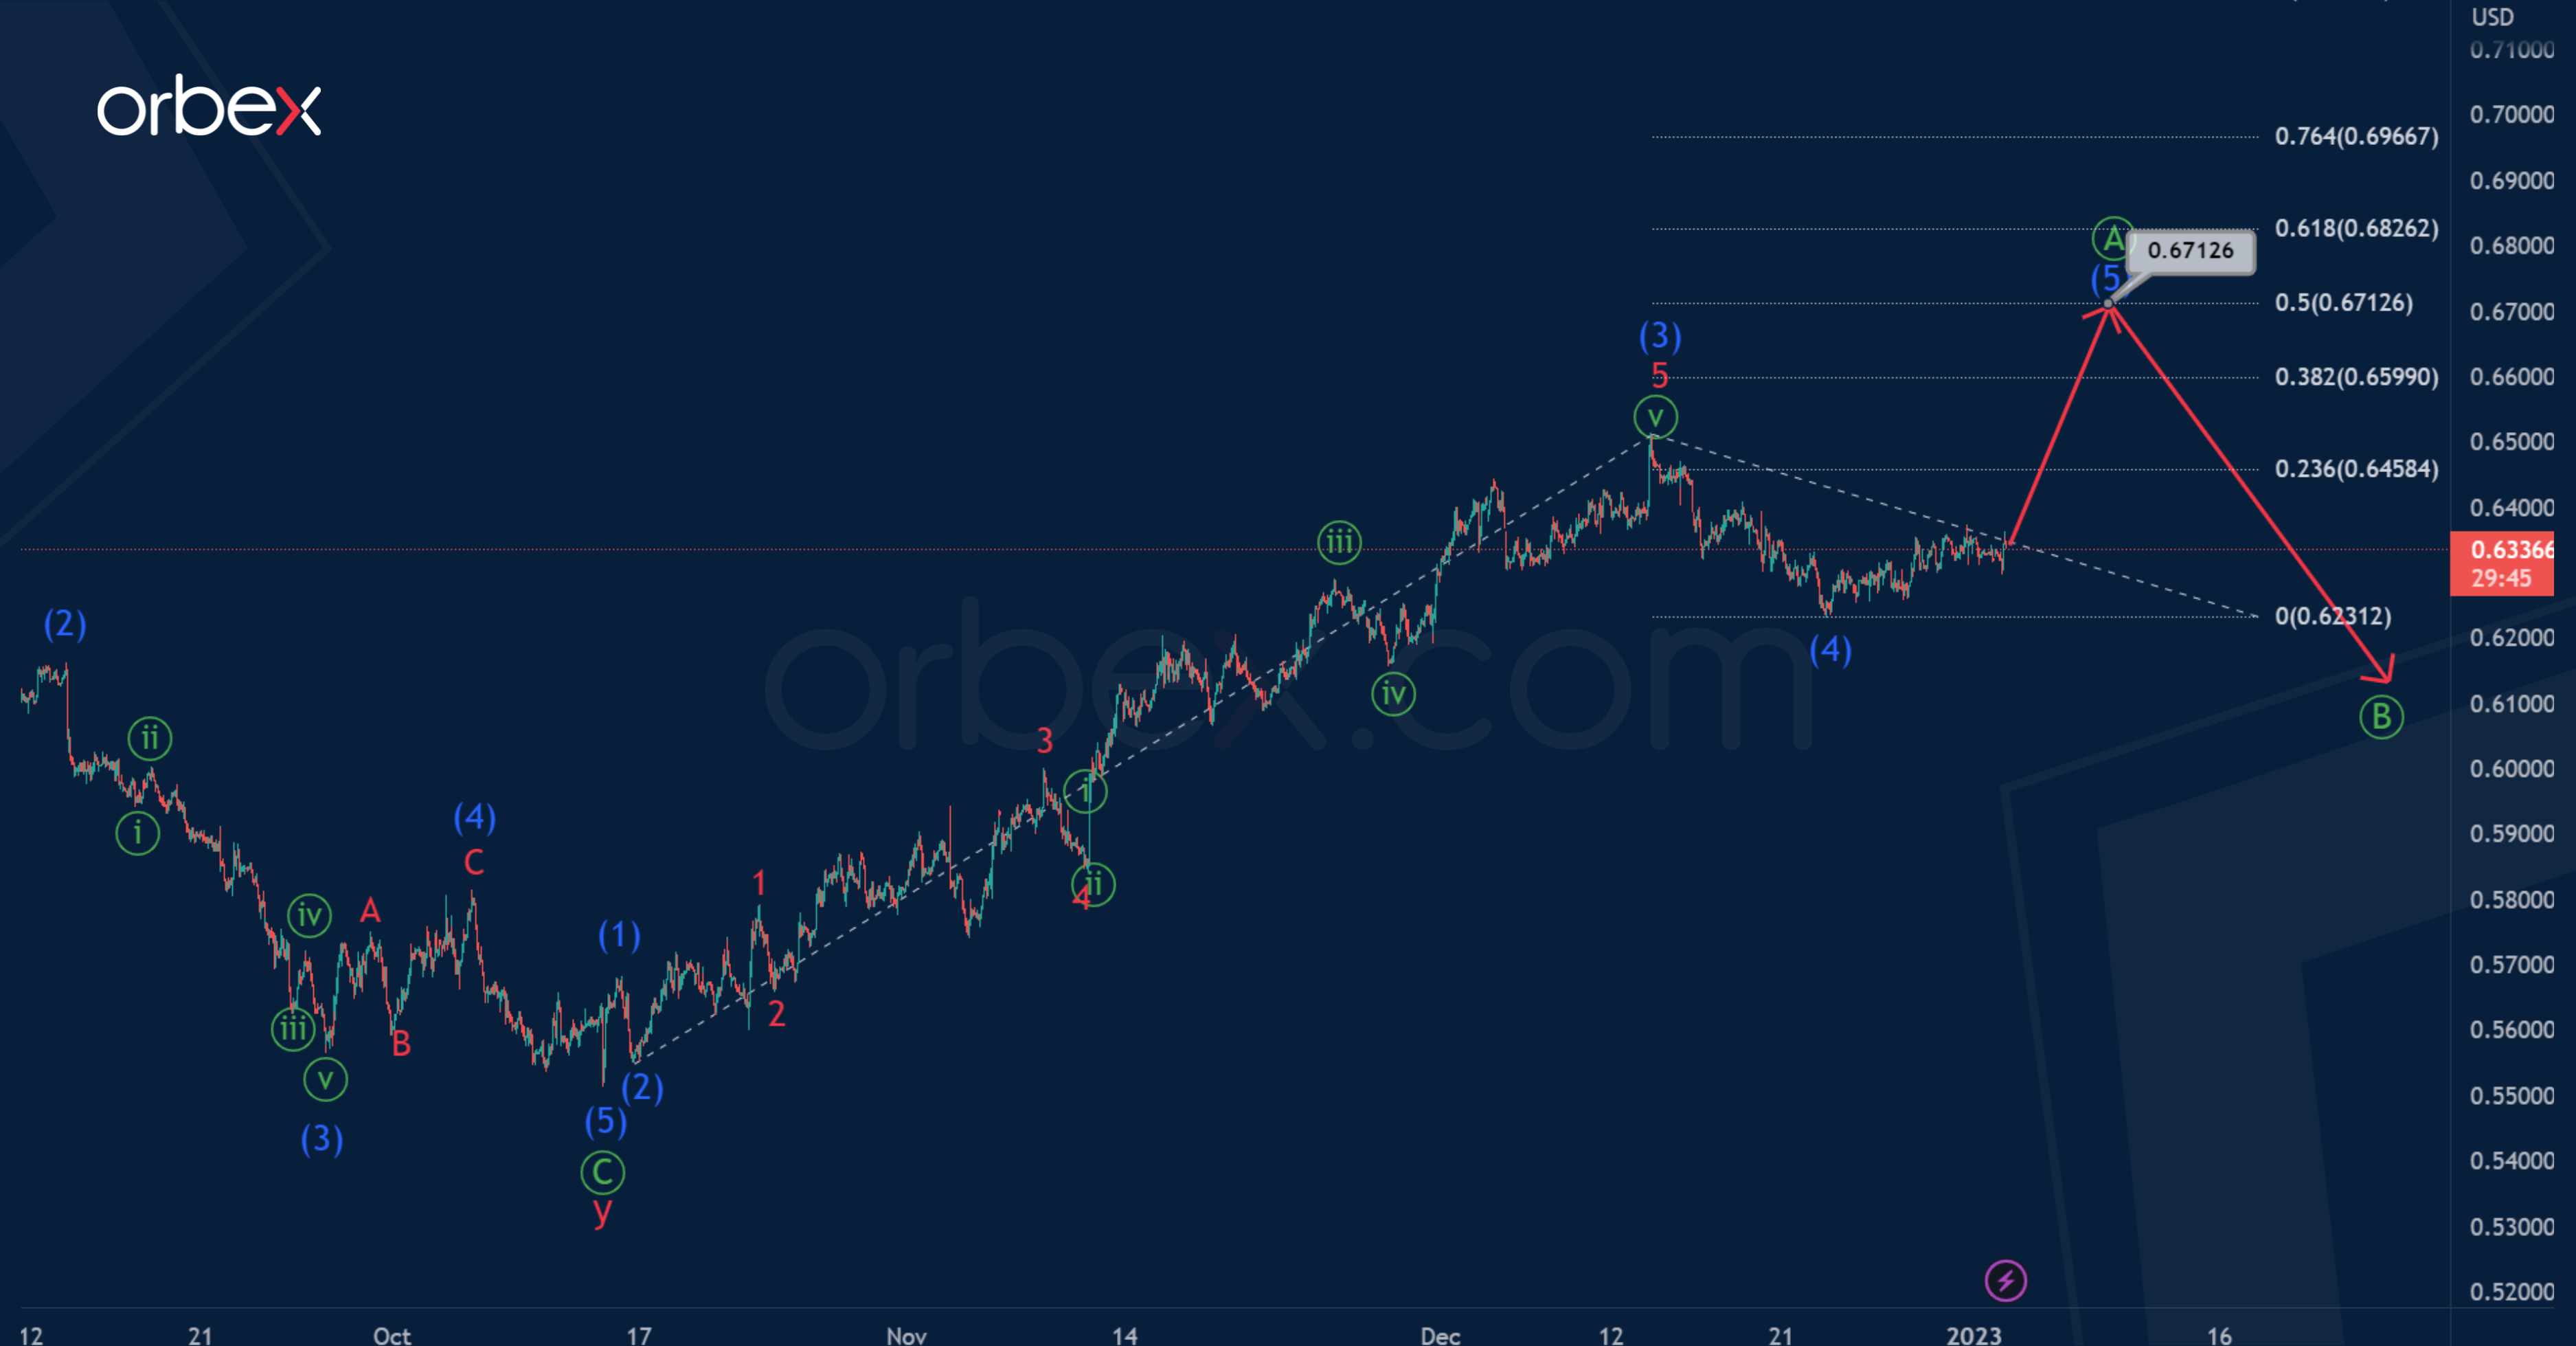
Looking at the 1H timeframe for the NZDUSD currency pair, we see that the market has already completed the formation of a cycle actionary wave y.
Thus, in the last section of the chart, we can see the formation of a new bullish trend. Most likely, there is a construction of the primary wave Ⓐ , which may take the form of an impulse of the intermediate degree (1)-(2)-(3)-(4)-(5). An approximate scheme of possible future movement is shown on the chart.
It is assumed that the bulls will push the price to 0.671. At that level, intermediate wave (5) will be at 50% of intermediate impulse wave (3).
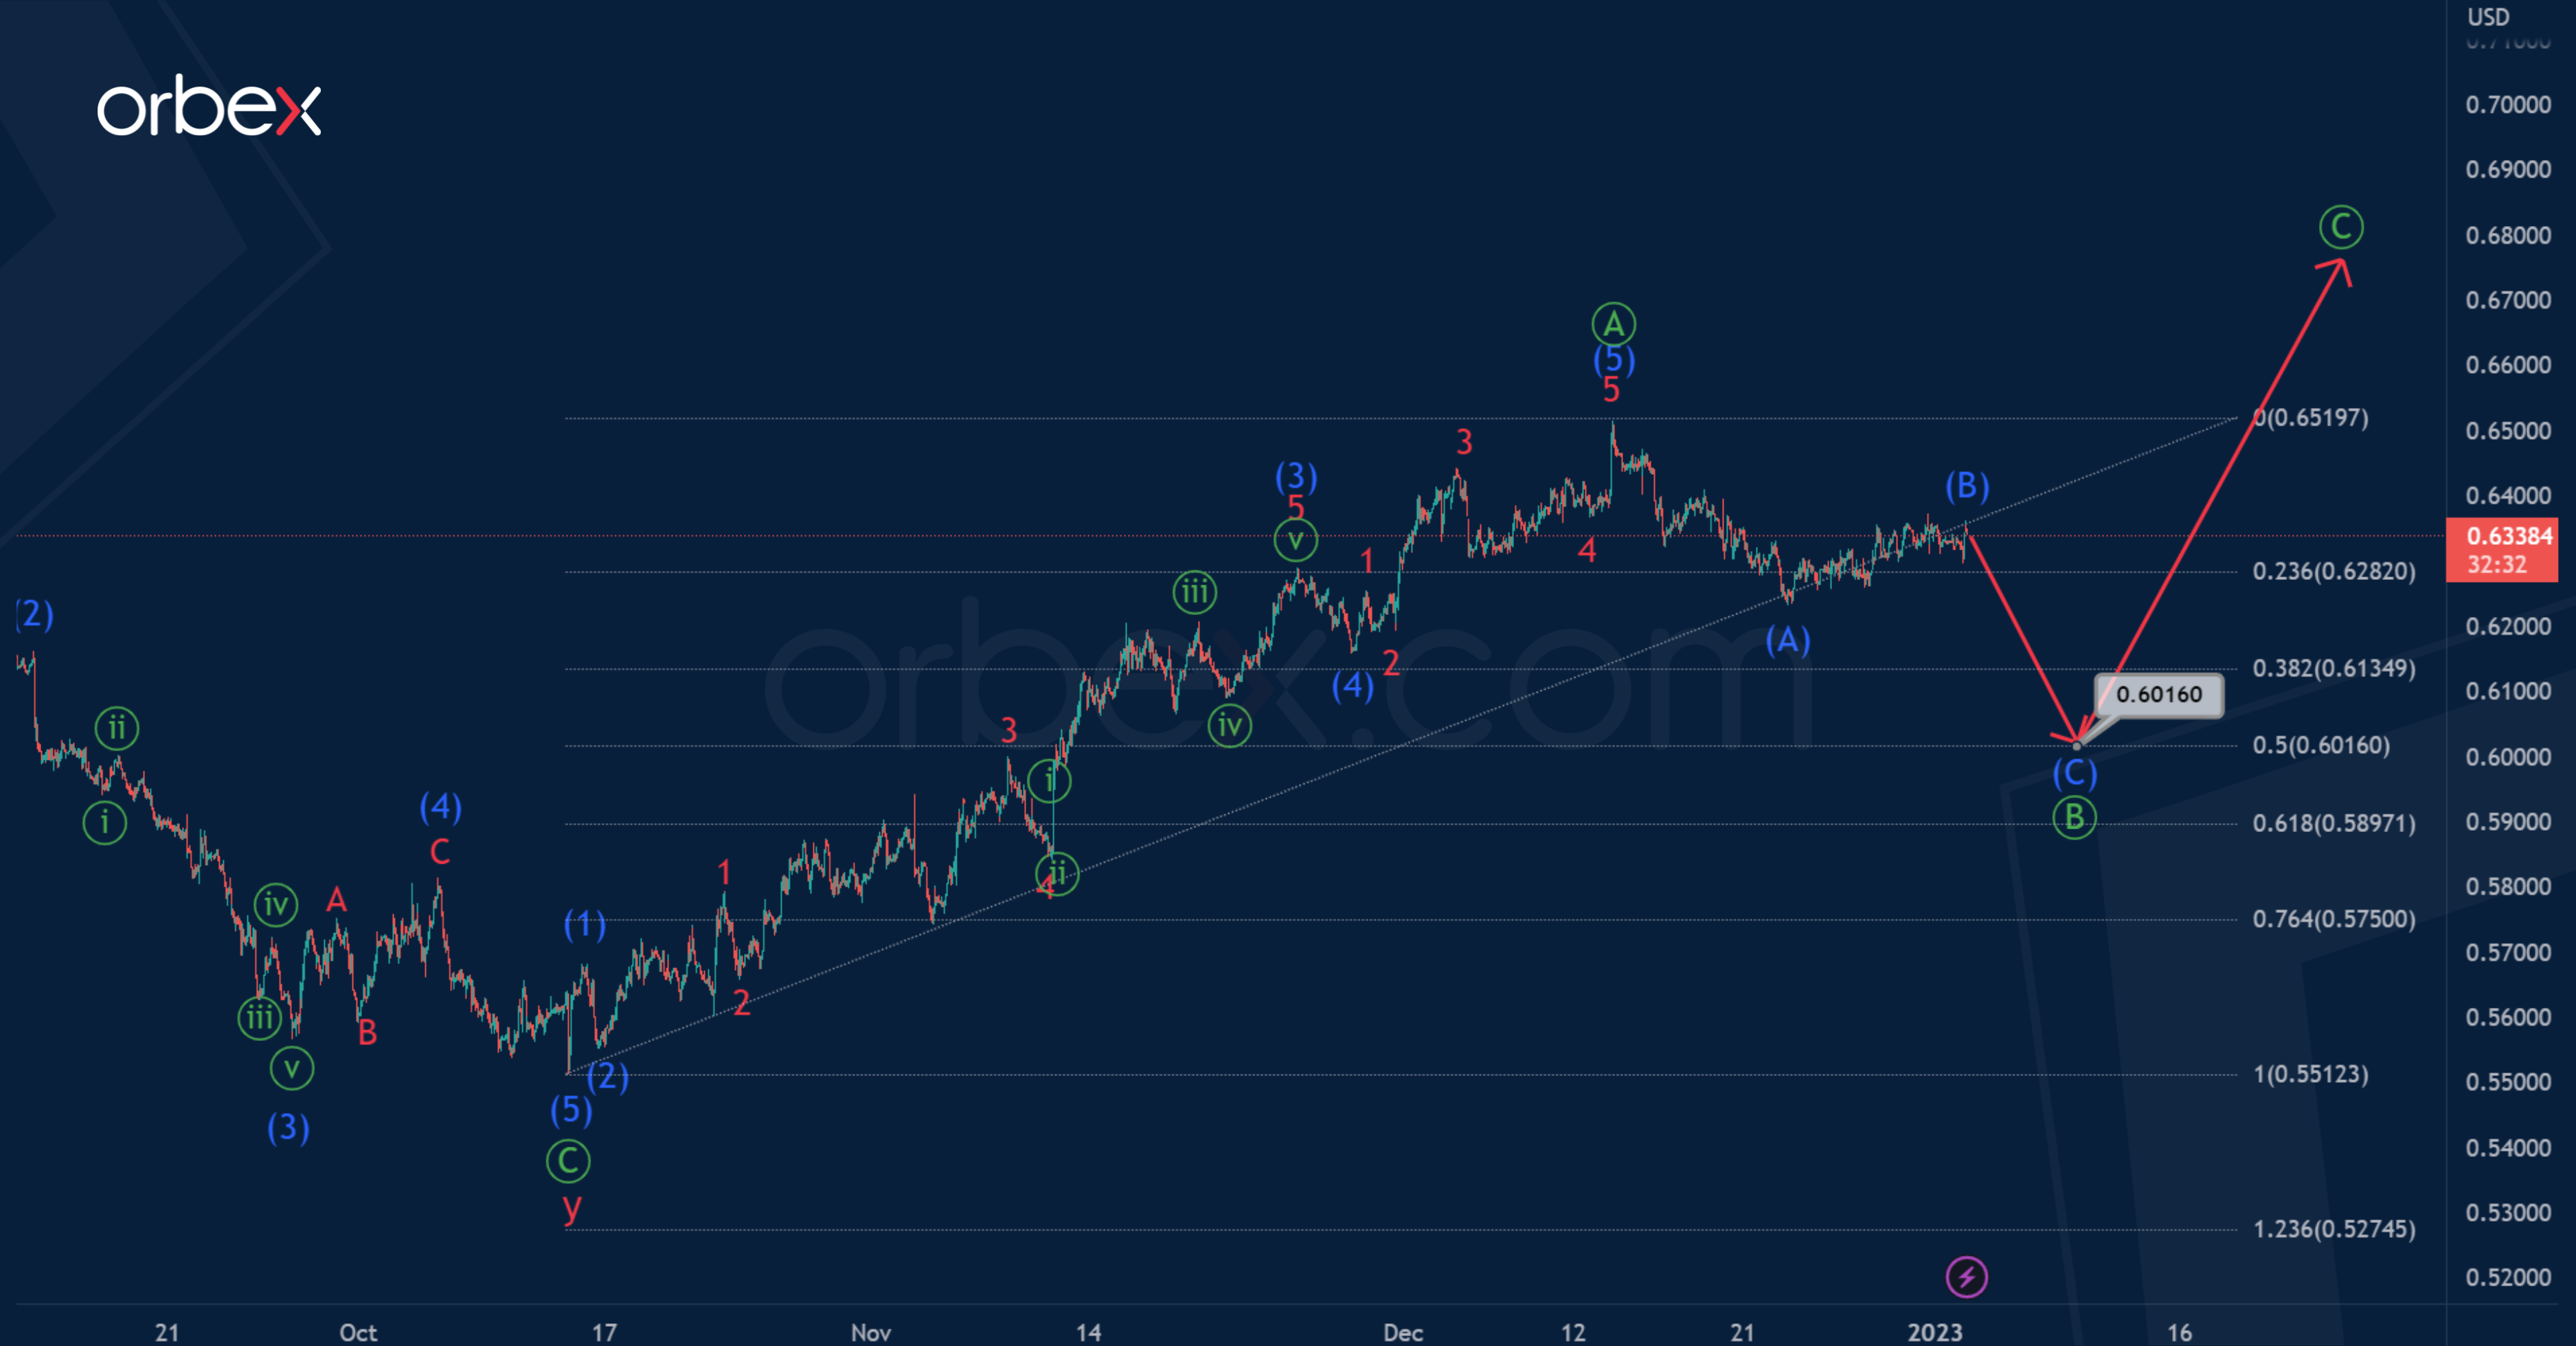
An alternative scenario suggests that the primary wave Ⓐ is fully completed. It represents an intermediate impulse (1)-(2)-(3)-(4)-(5), and a bearish correction is already under development.
The primary correction Ⓑ may take the form of an intermediate zigzag (A)-(B)-(C). Currently, impulse (A) and correction (B) look formed as part of this zigzag.
Most likely, the price in the last intermediate wave (C) will fall to 0.601. At that level, it will be at 50% of primary impulse Ⓐ.
Gold Price Increased Decently
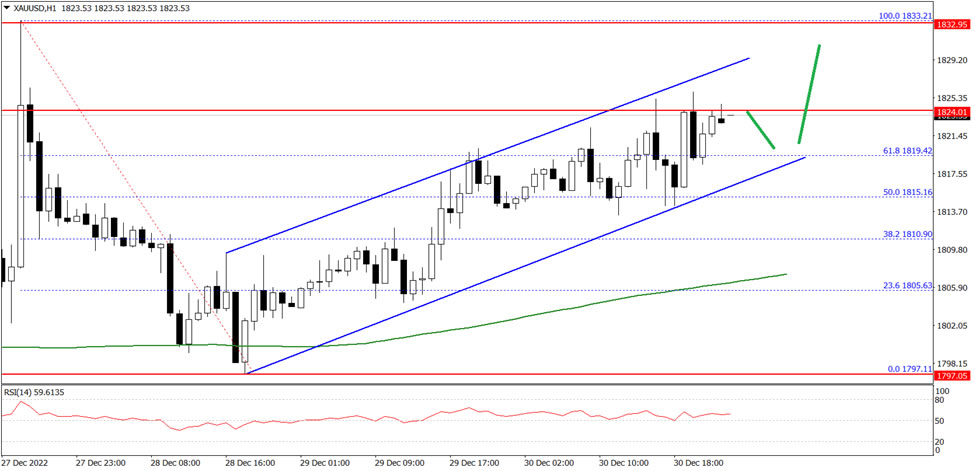
Gold price started a decent increase from the $1,795 zone against the US Dollar. The price was able to settle above the $1,810 level on FXOpen to move into a positive zone.
The pair even climbed above the $1,815 level and the 50 hourly simple moving average. The price is now trading above the $1,820 level and is showing positive signs. An immediate resistance on the upside is near the $1,830 level.
The first major resistance is near the $1,832 level. The next main resistance could be near the $1,840 level, above which the price could start a steady increase towards the $1,850 level.
On the downside, an immediate support is near the $1,819 level. The next major support is near the $1,810 level, below which the price might decline towards the $1,778 support level in the near term. Any more losses might call for a test of $1,760.
US 30 Awaits Breakout
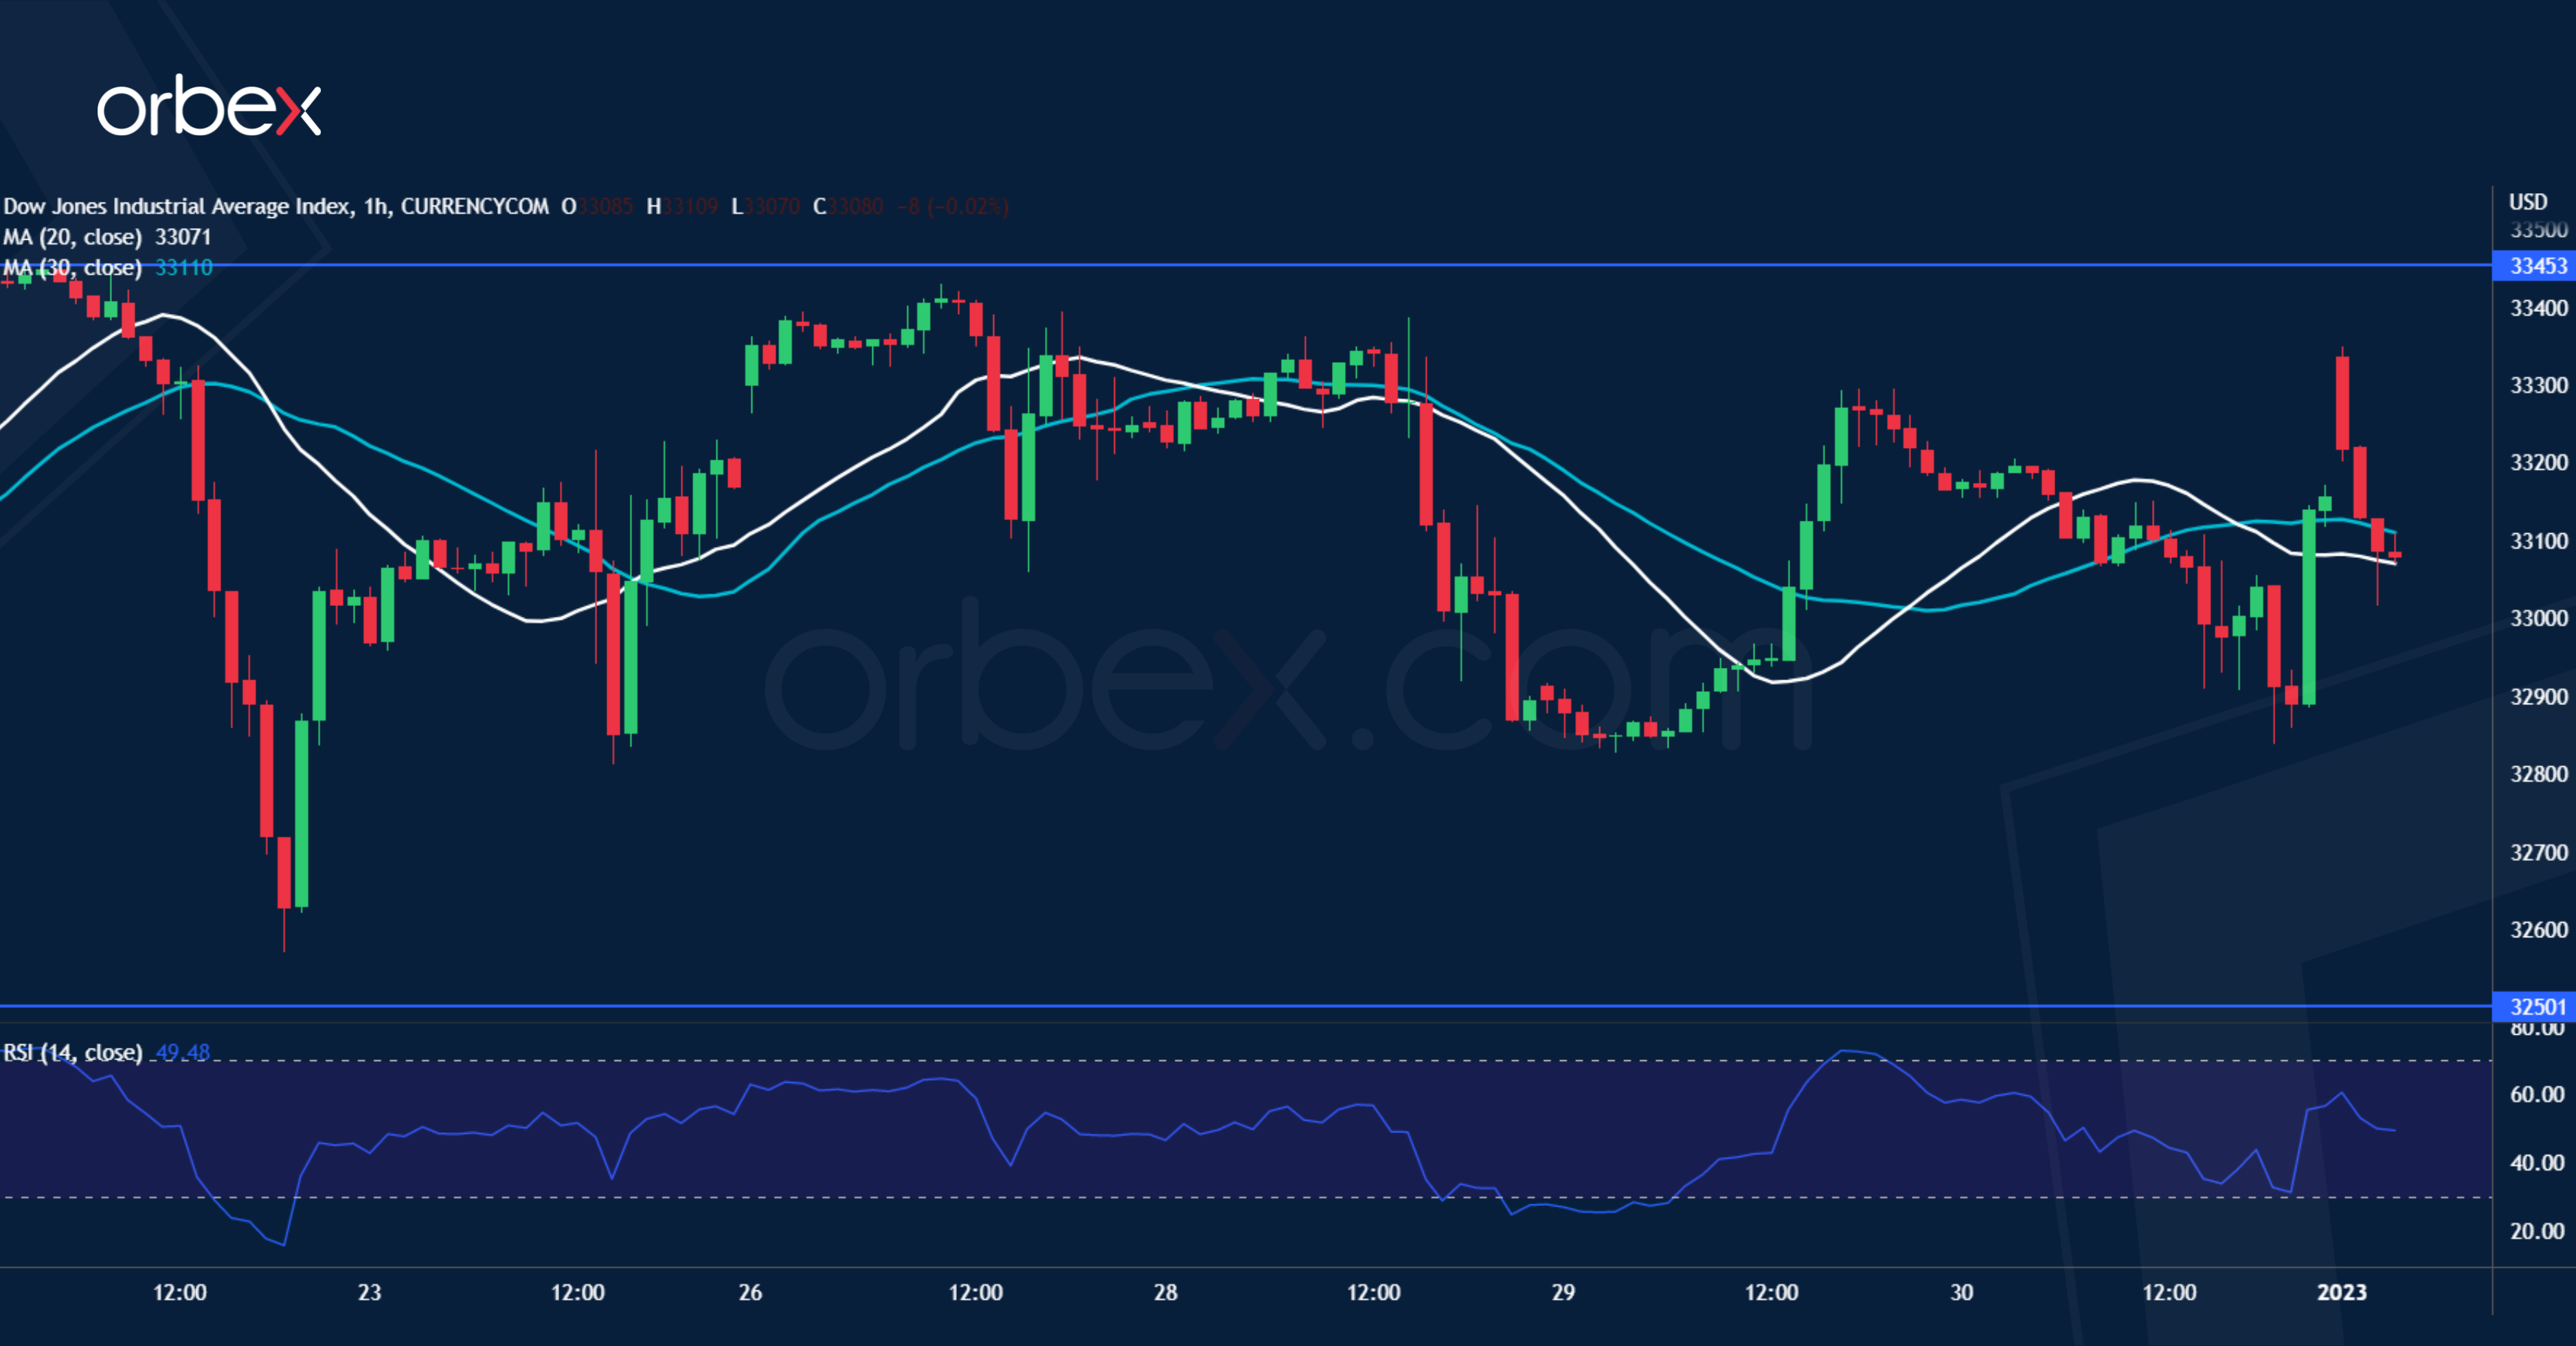
The Dow Jones ebbs and flows as investors probe risk appetite at the start of the year. The index has been struggling to hold onto the critical floor at 32500. The horizontal consolidation is a sign of a fragile balance and a breakout would heighten volatility due to increased pressure from both sides, shaping a new trading range for the days to come. A close above 33450 may carry the index back to 34100. However, a bearish breakout could trigger a new round of sell-off towards 31500 with more buyers abandoning ship.