Sample Category Title
Technical Outlook and Review
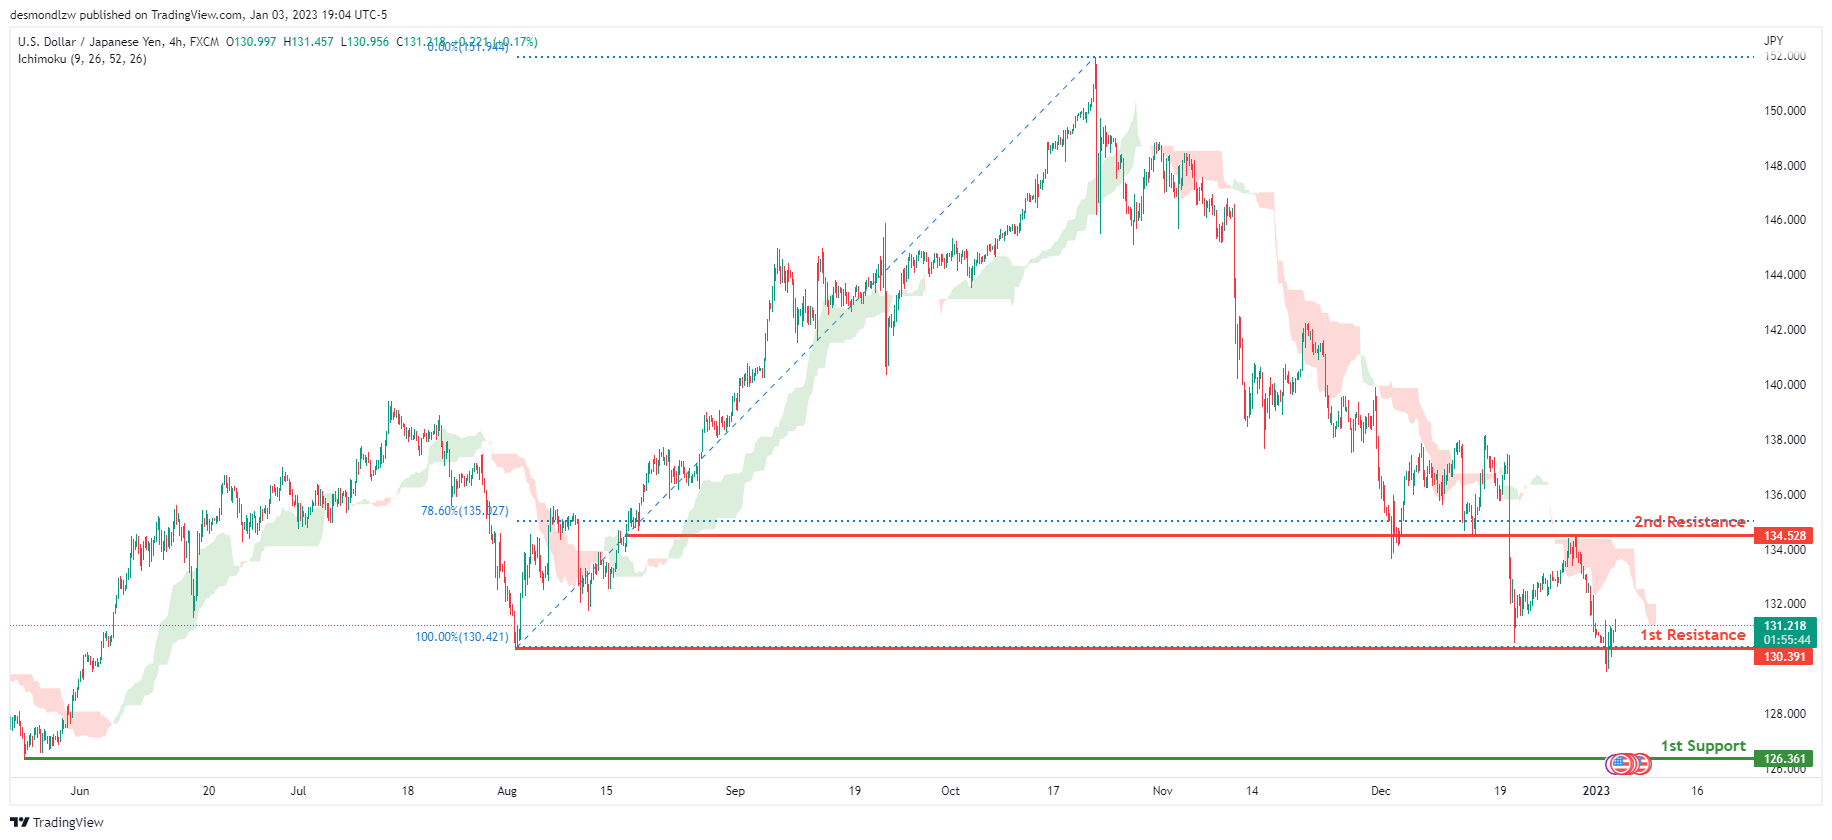
USD/JPY:
Looking at the H4 chart, my overall bias for USDJPY is bearish due to the current price being below the Ichimoku cloud, indicating a bearish market. If this bearish momentum continues, expect price to possibly continue heading towards the 1st support at 126.361, where the previous swing low is.In an alternate scenario, price could possibly head back up breaking the 1st resistance level at 130.391, where the previous swing low is before heading towards the 2nd resistance at 134.528, where the 78.6% Fibonacci line is.
Areas of consideration:
- H4 time frame, 1st resistance at 130.391
- H4 time frame, 2nd resistance at 134.528
- H4 time frame, 1st support at 126.361
DXY:
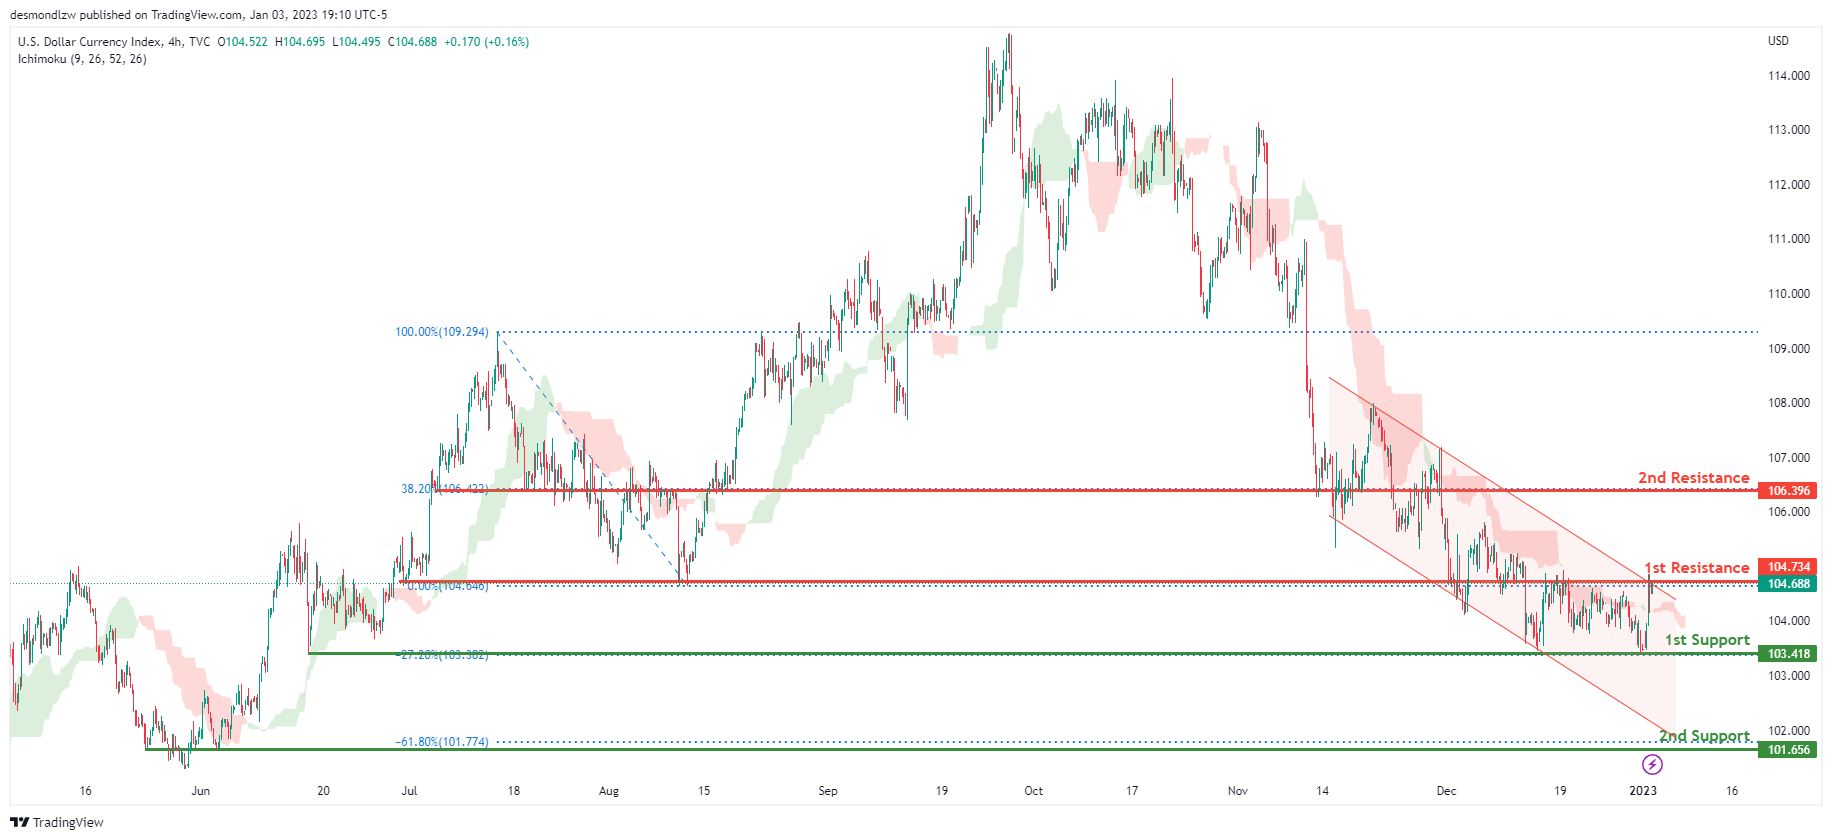
On the H4 chart, the overall bias for DXY is bearish. To add confluence to this, the price is within the descending channel which indicates a bearish market. If this bearish momentum continues, expect the price to possibly break the 1st support line at 103.418, where the -27.2% Fibonacci expansion line is before heading towards the 2nd support at 101.656, where the -61.8% Fibonacci expansion line is. In an alternative scenario, price could head back up and break the 1st resistance line resistance at 104.734, where the previous swing low is before heading towards the 2nd resistance at 106.396, where the 38.2% Fibonacci line is.
Areas of consideration:
- H4 time frame, 1st resistance at 104.734
- H4 time frame, 1st support at 103.418
- H4 time frame, 2nd support at 101.656
EUR/USD:
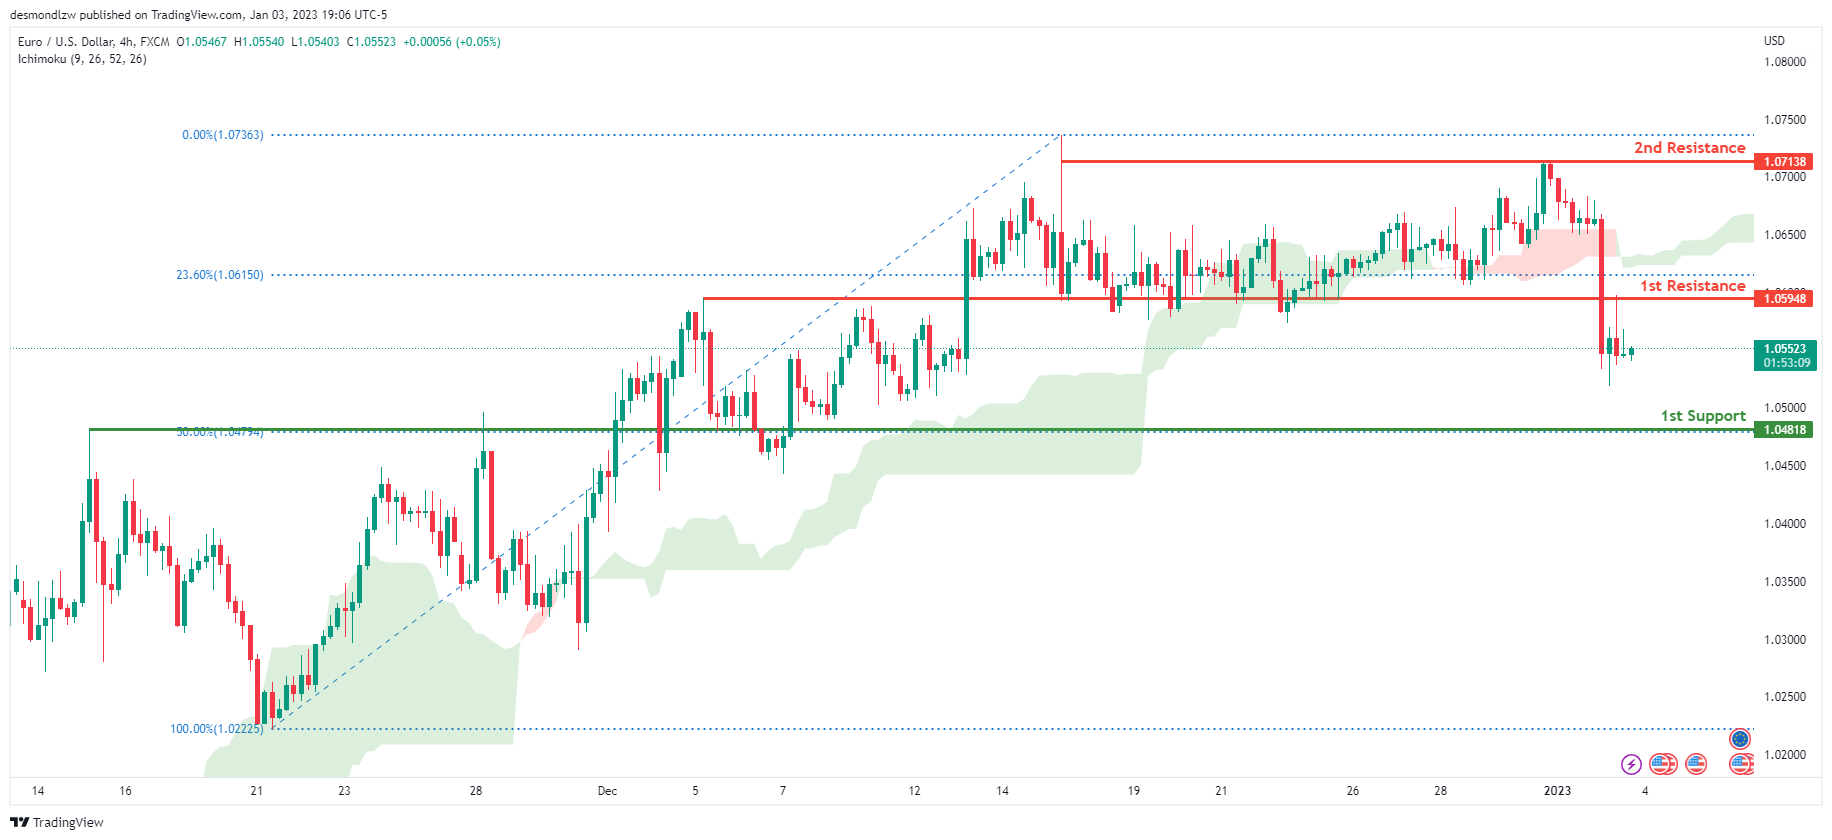
Looking at the H4 chart, my overall bias for EURUSD is bullish due to the current price being above the Ichimoku cloud, indicating a bullish market. If this bullish momentum continues, expect the price to possibly head towards the 1st resistance at 1.05948, where the 23.6% Fibonacci line is. In an alternate scenario, price could possibly head back down towards the 1st support level at 1.04818, where the 50% Fibonacci line is.
Areas of consideration :
- H4 1st resistance at 1.05948
- H4 1st support at 1.04818
GBP/USD:
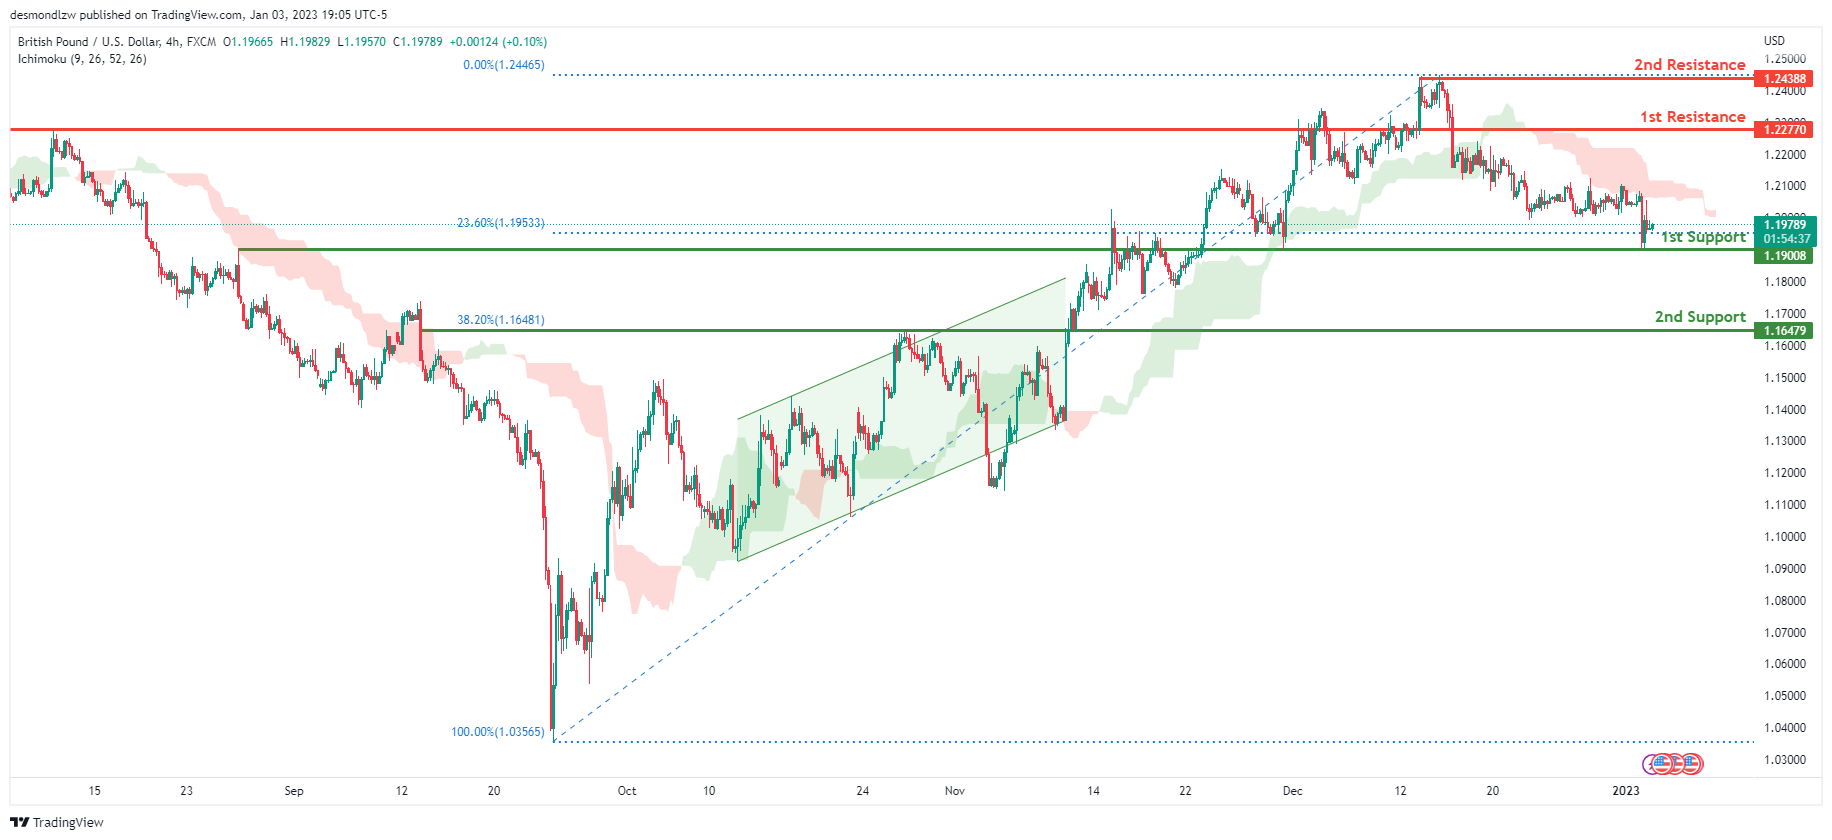
Looking at the H4 chart, my overall bias for GBPUSD is bearish due to the current price being below the Ichimoku cloud, indicating a bearish market. If this bearish momentum continues, expect price to possibly continue heading towards the 1st support at 1.19008, where the 23.6% Fibonacci line is. In an alternate scenario, price could possibly head back up to break the 1st resistance level at 1.22770, where the previous swing high is before heading towards the 2nd support at 1.16479, where the 38.2% Fibonacci line is.
Areas of consideration:
- H4 1st resistance at 1.22770
- H4 1st support at 1.19008
- H4 2nd support at 1.16479
USD/CHF:
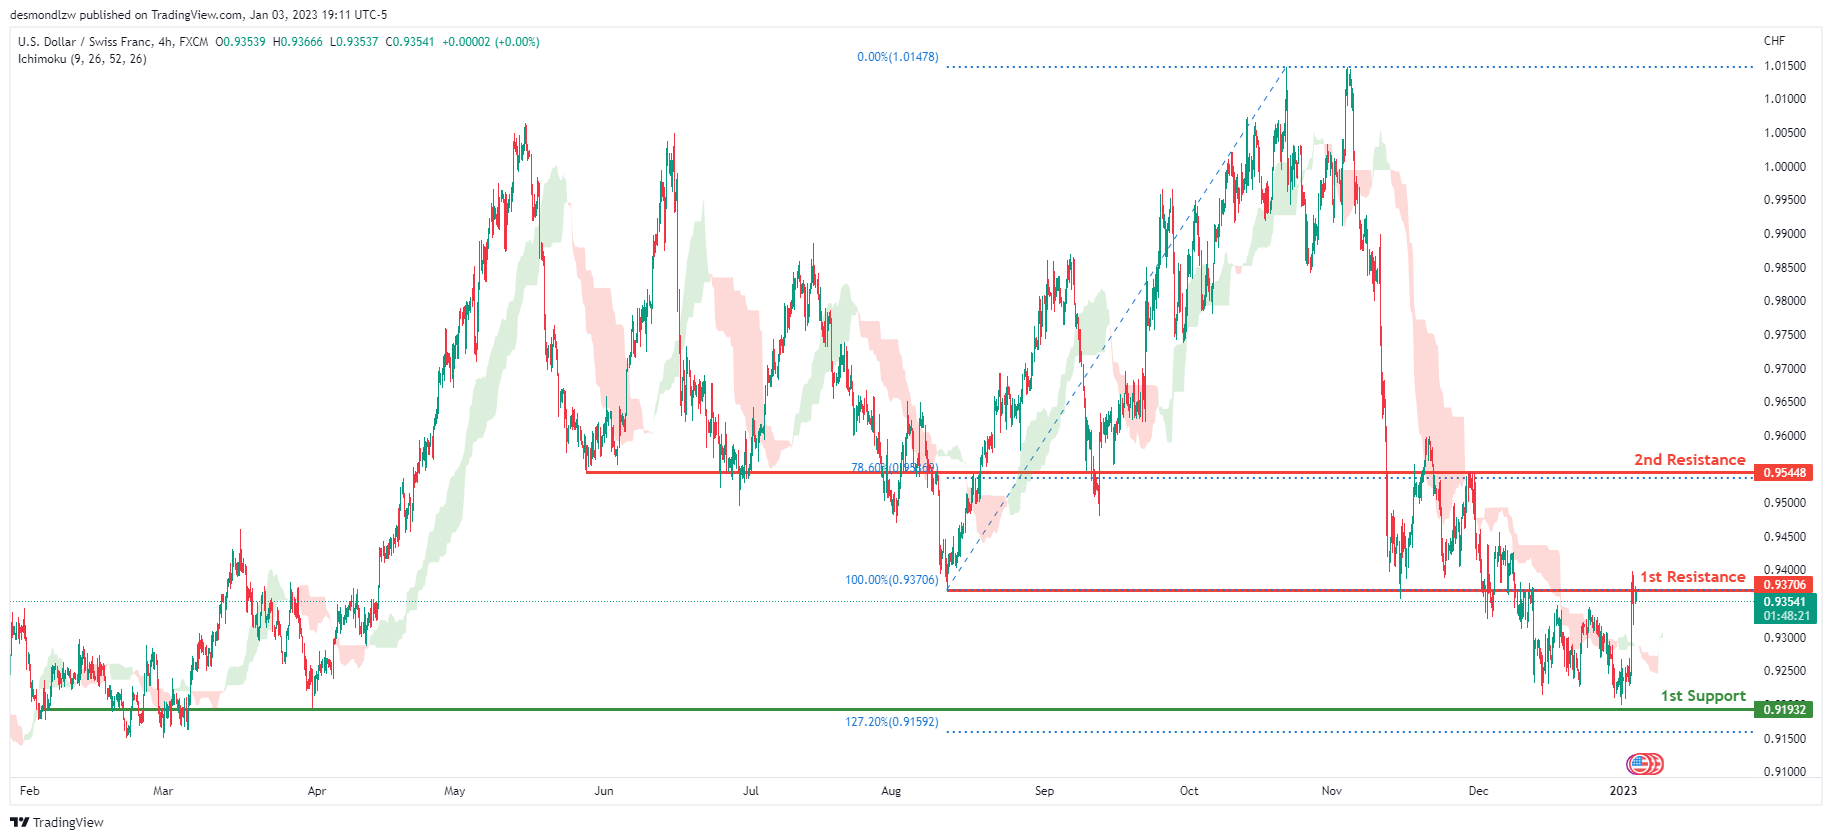
The overall bias for USDCHF on the H4 chart is bearish. In addition, the price is crossing below the Ichimoku cloud, indicating a bearish market. If the current bearish trend continues, expect the price to head back down towards the 1st support line at 0.91932, where the previous swing low and 12.72% Fibonacci extension line is . In an alternative scenario, price could possibly head up breaking the 1st resistance at 0.93706, where the previous swing low is, before heading towards the 2nd resistance at 0.95448, where the 78.6% Fibonacci line is.
Areas of consideration
- H4 1st support at 0.91932
- H4 1st resistance at 0.93706
- H4 2nd resistance at 0.95448
XAU/USD (GOLD):
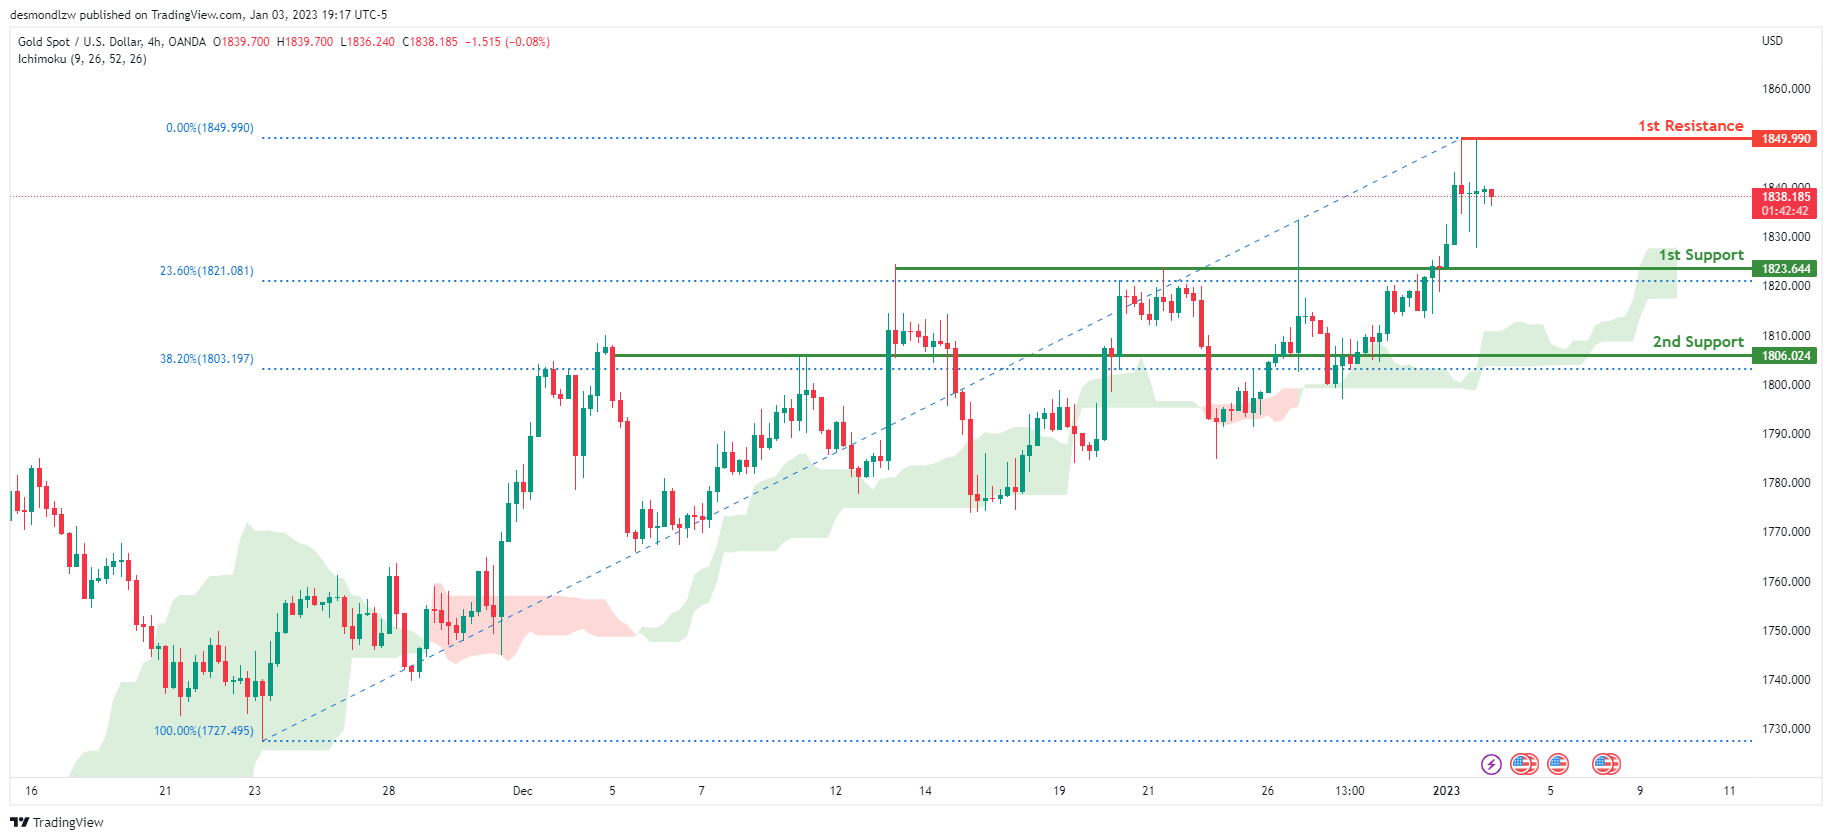
Looking at the H4 chart, my overall bias for XAUUSD is bullish due to the current price crossing above the Ichimoku cloud, indicating a bullish market. If this bullish momentum continues, expect the price to continue heading towards the 1st resistance at 1849.990 where the recent high is. In an alternative scenario, price could possibly head back down towards the 1st support at 1823.644, where the 23.62% Fibonacci line is.
Areas of consideration:
- H4 time frame, 1st resistance at 1849.990
- H4 time frame, 1st support at 1823.644
AUD/USD:
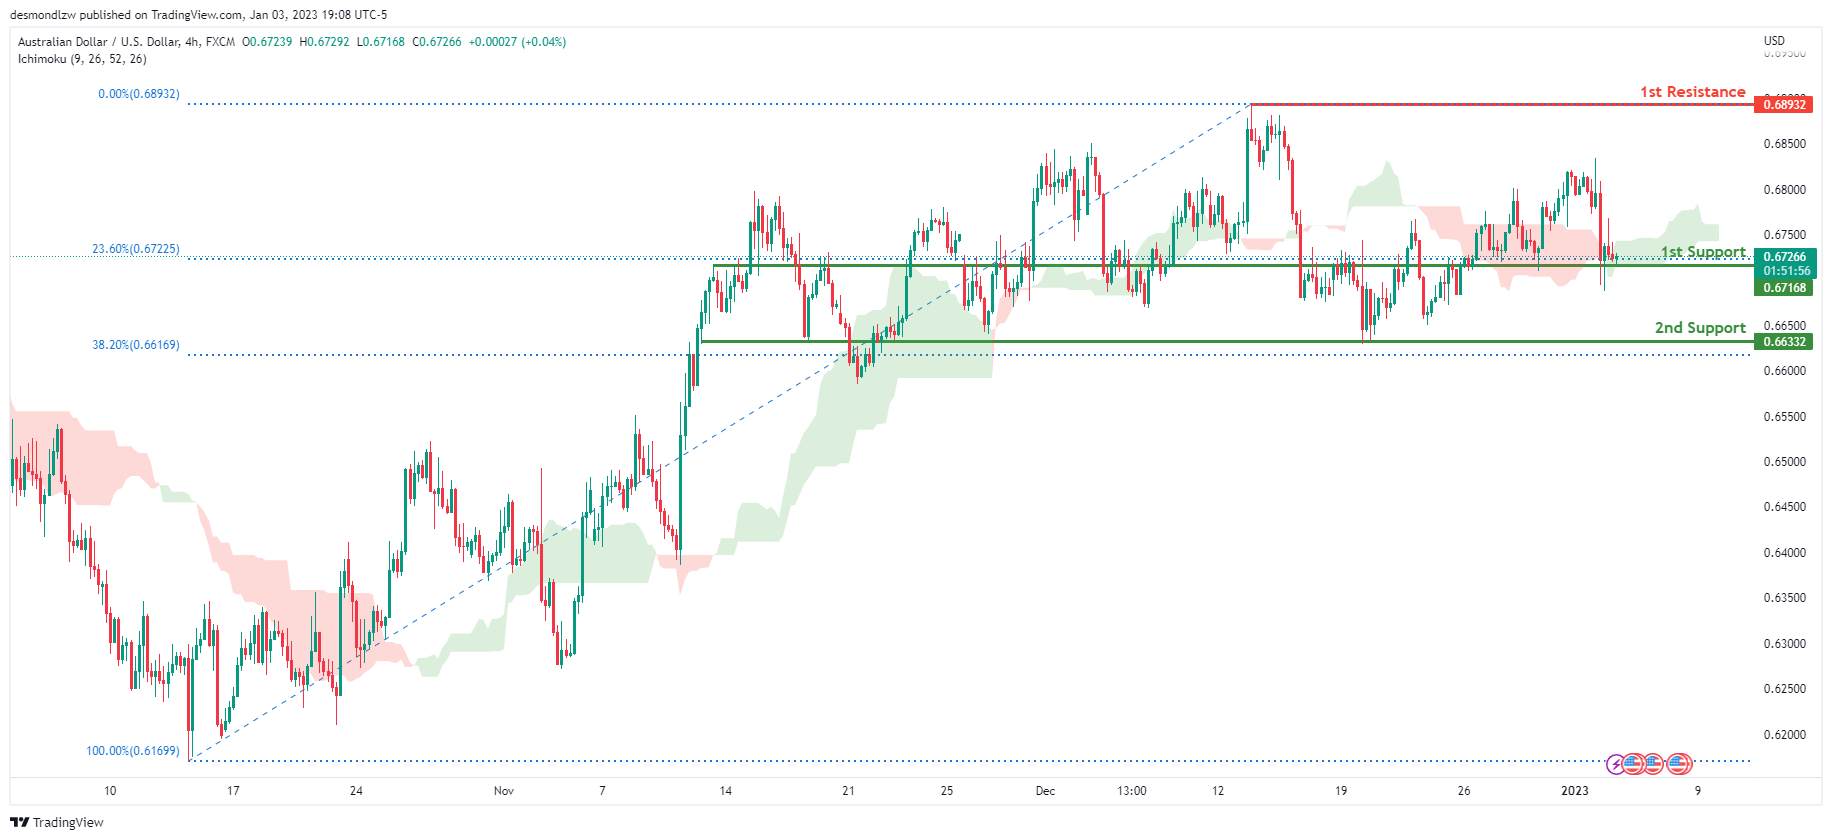
Looking at the H4 chart, my overall bias for AUDUSD is bearish due to the current price crossing below the Ichimoku cloud, indicating a possible shift to bearish market structure. If this bearish momentum continues, expect the price to possibly head back down breaking the 1st support at 0.67168, where the 23.6% Fibonacci line is, before heading towards the 2nd support at 0.66332, where the 38.2% Fibonacci line is. In an alternative scenario, price could possibly head back up towards the 1st resistance at 0.68932, where the recent swing high is.
Areas of consideration
- H4, 1st resistance at 0.68932
- H4, 1st support at 0.67168
- H4, 2nd support at 0.66332
NZD/USD:
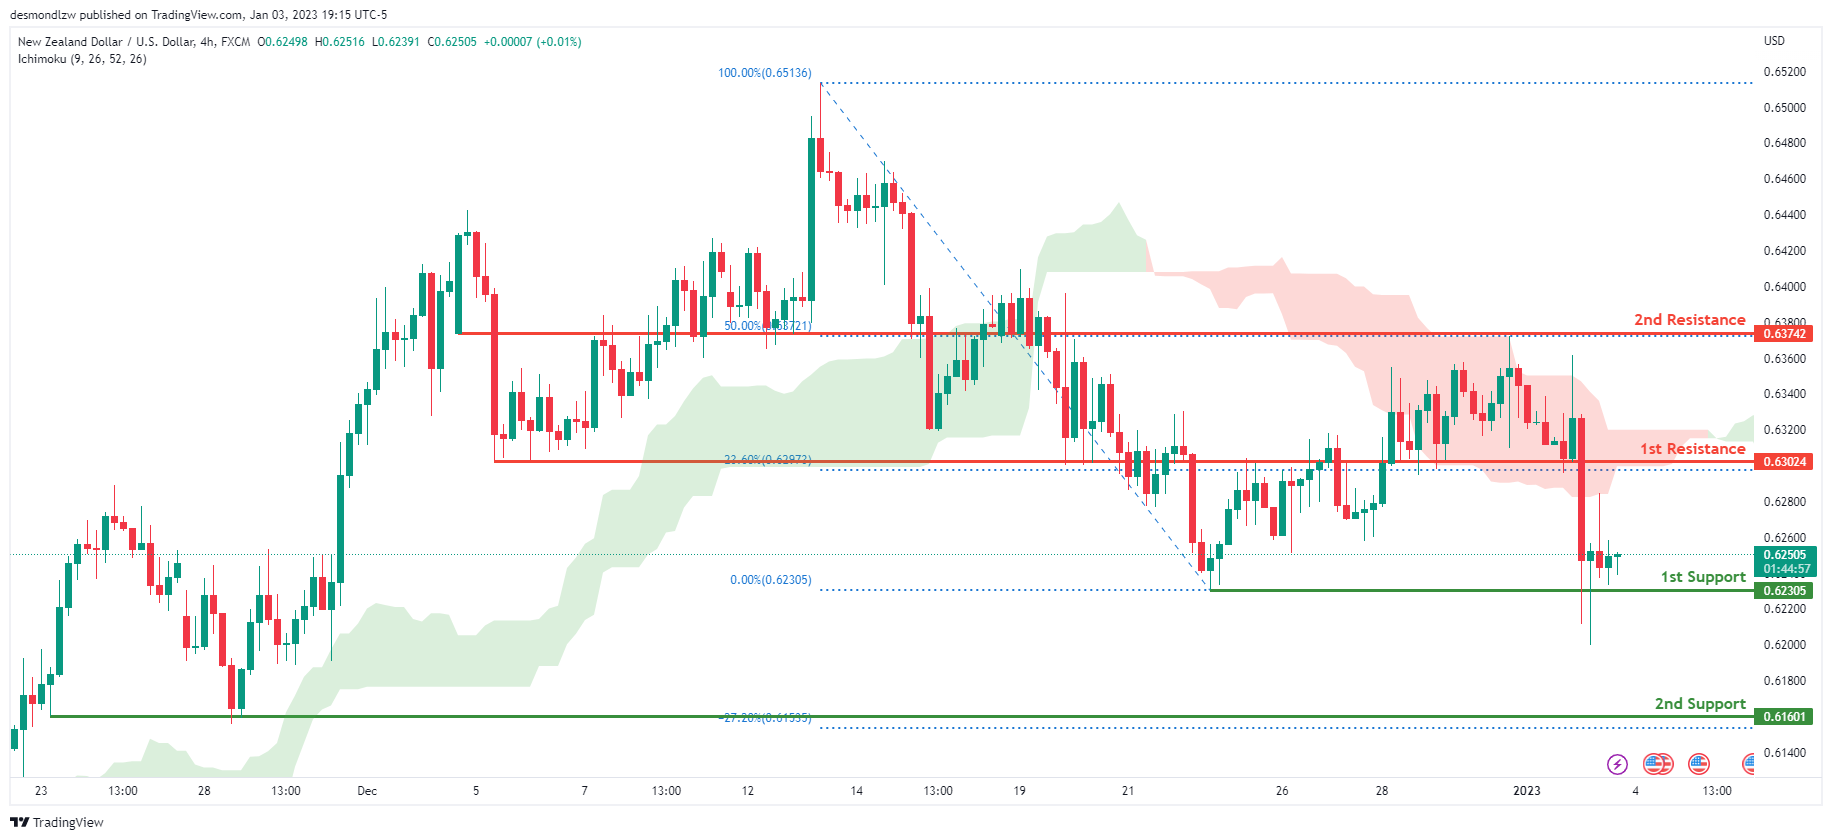
Looking at the H4 chart, my overall bias for NZDUSD is bearish due to the current price crossing below the Ichimoku cloud, indicating a bearish market. If this bearish momentum continues, expect price to possibly break the 1st support at 0.62305, where the previous swing low is, before heading towards the 2nd support at 0.61601, where the -27.2% Fibonacci line is. In an alternate scenario, price could possibly head back up towards the 1st resistance level at 0.63024, where the 23.6% Fibonacci line is
Areas of consideration:
- H4 time frame, 1st resistance at 0.63024
- H4 time frame, 1st support at 0.62305
- H4 time frame, 2nd support at 0.61601
USD/CAD:
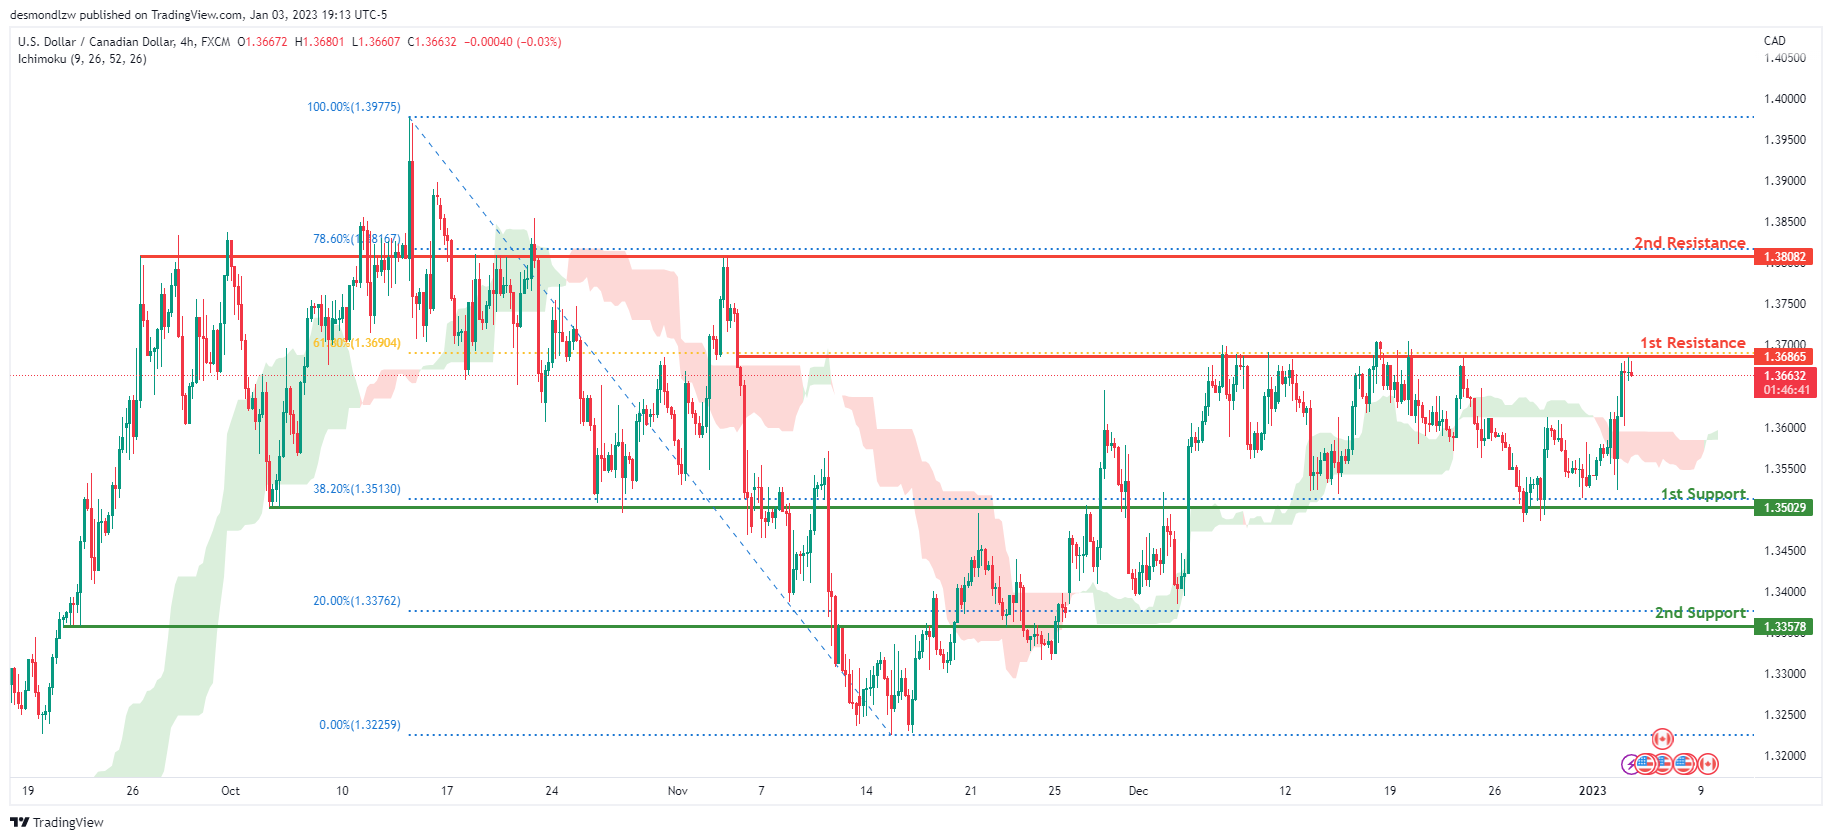
On the H4 chart, the overall bias for USDCAD is bullish . To add confluence to this, the price is above the Ichimoku cloud which indicates a bullish market. If this bullish momentum continues, expect the price to possibly head up and break 1st resistance line at 1.36865, where the 61.8% Fibonacci line is, before heading towards the 2nd resistance line at 1.38082, where the 78.6% Fibonacci line is. In an alternative scenario, price could head back down to break the 1st support at 1.35029, where the 38.2% Fibonacci line is, before heading towards the 2nd support at 1.33578, where the 20% Fibonacci line is.
Areas of consideration:
- H4 time frame, 1st resistance at 1.36865
- H4 time frame, 2nd resistance at 1.38082
- H4 time frame, 1st support at 1.35029
- H4 time frame, 2nd support at 1.33578
OIL:
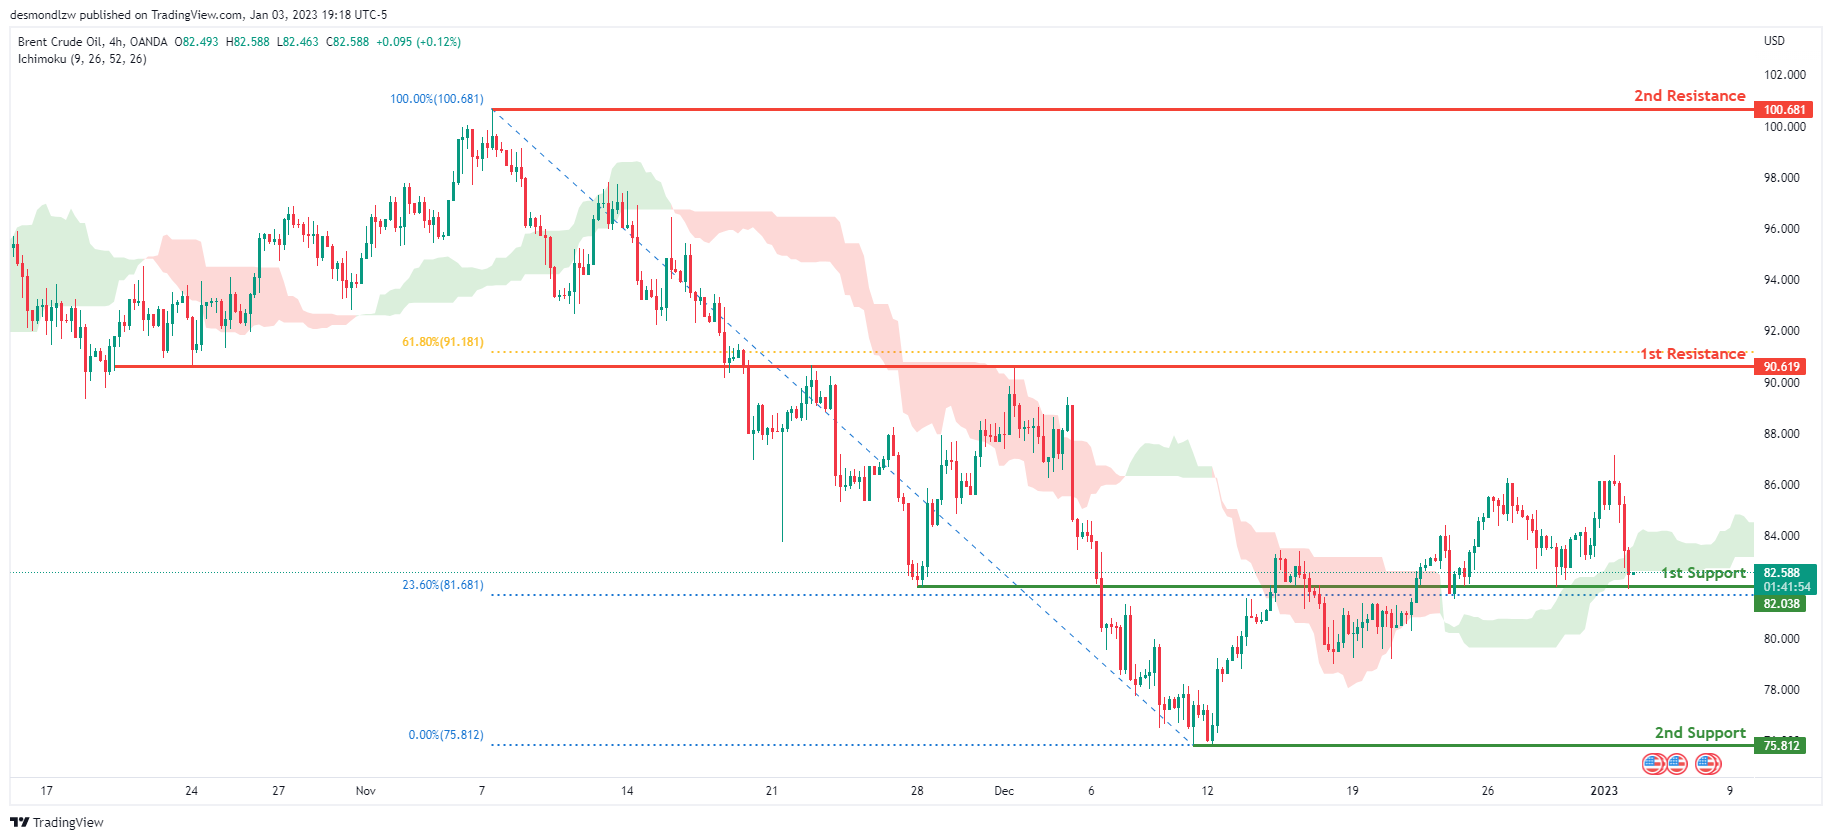
Looking at the H4 chart, my overall bias for BCOUSD is bearish due to the current price crossing below the Ichimoku cloud, indicating a bearish market. If this bearish momentum continues, expect the price to possibly break the 1st support level at 82.038, where the 23.6% Fibonacci line is, before heading towards the 2nd support at 75.812, where the previous swing low is. In an alternate scenario, price could possibly head back up towards the 1st resistance at 90.619, where the 61.8% Fibonacci line is.
Areas of consideration:
- H4 time frame, 1st resistance at 90.619
- H4 time frame, 1st support at 82.038
- H4 time frame, 2nd support at 75.812
Dow Jones Industrial Average:
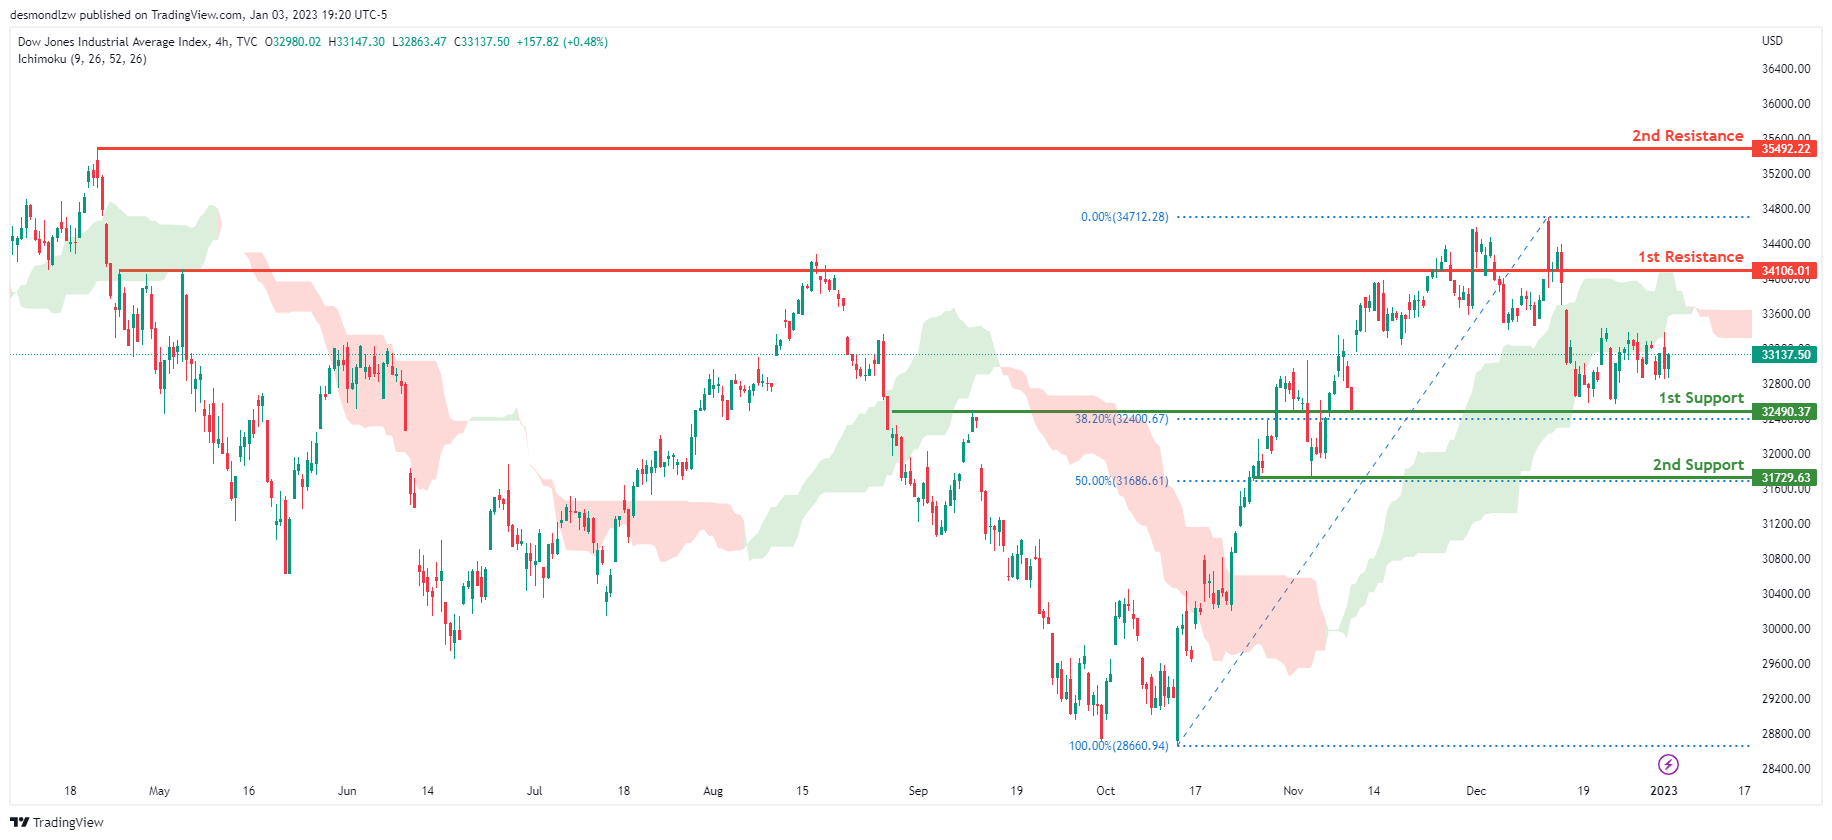
On the H4 chart, the overall bias for DJI is bearish. To add confluence to this, the price is below the Ichimoku cloud which indicates a bearish market. If this bearish momentum continues, expect the price to head back down towards the 1st support at 32490.37, where the 61.8% Fibonacci line is. In an alternative scenario, price could possibly break the 1st resistance line at 34106.01, where the previous swing high is before heading towards the 2nd resistance line at 35492.22, where the previous swing high is.
Areas of consideration:
- H4 time frame, 1st support at 32490.37
- H4 time frame, 1st Resistance at 34106.01
- H4 time frame, 2nd Resistance at 35492.22
DAX:
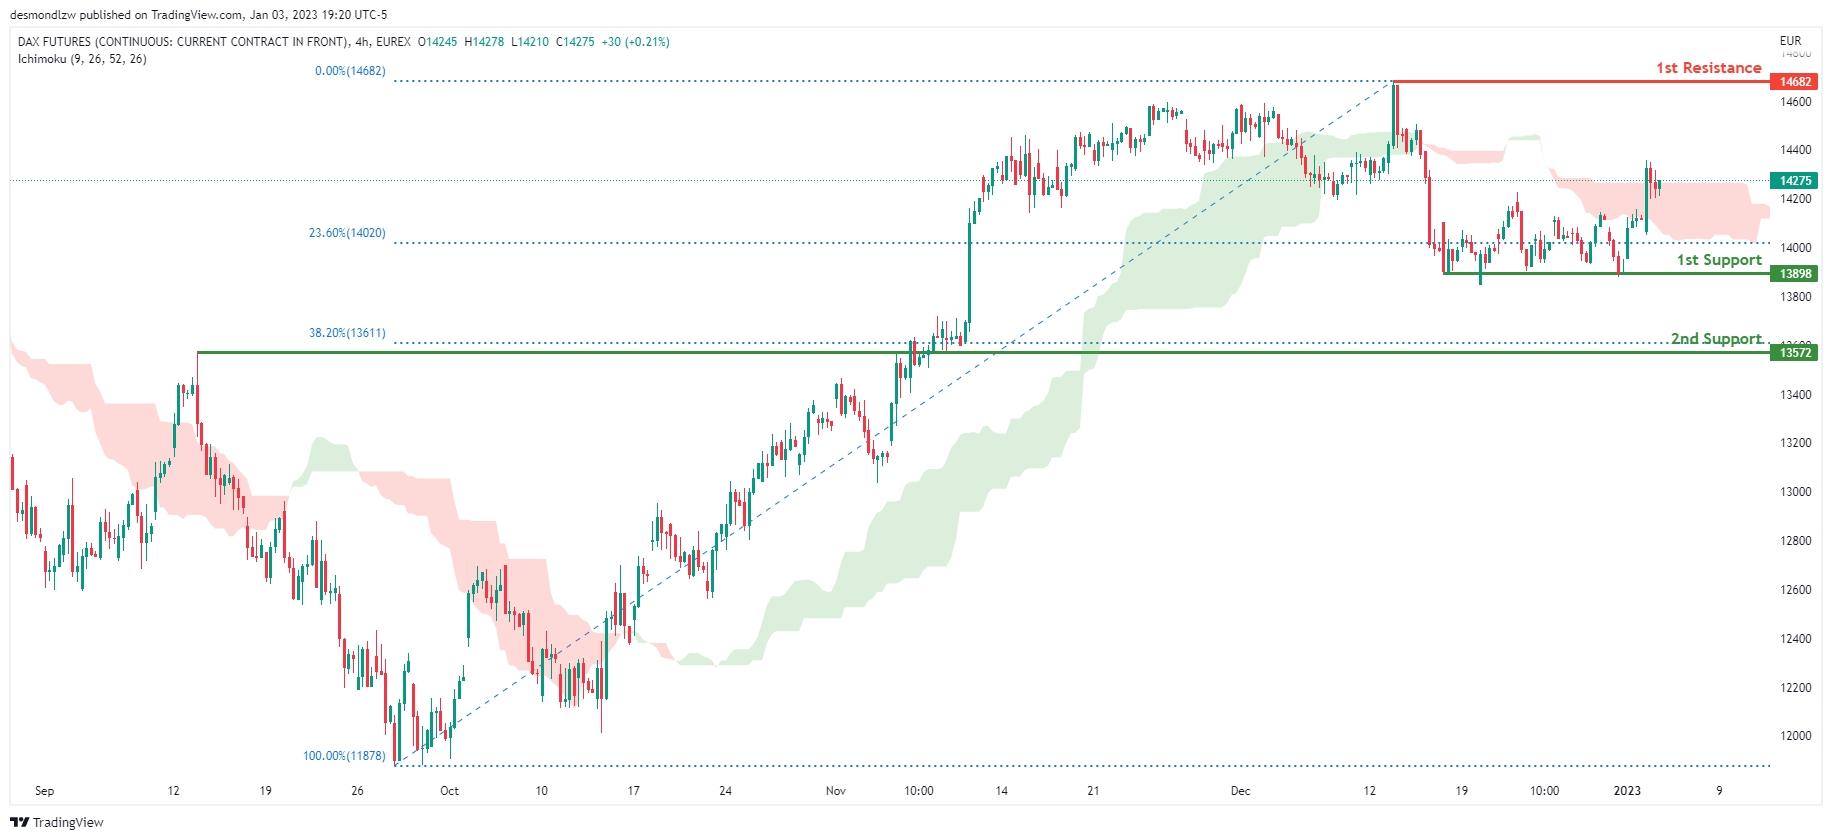
Looking at the H4 chart, my overall bias for DAX is bullish due to the current price crossing above the Ichimoku cloud, indicating a bullish market. If this bullish momentum continues, expect the price to possibly head towards the 1st resistance line at 14682, where the previous swing high is. In an alternative scenario, price could possibly head down to retest the 1st support at 13898, where the 23.6% Fibonacci line is.
Areas of consideration:
- H4 time frame, 1st resistance is at 14682
- H4 time frame, 1st support is at 13898
ETHUSD:
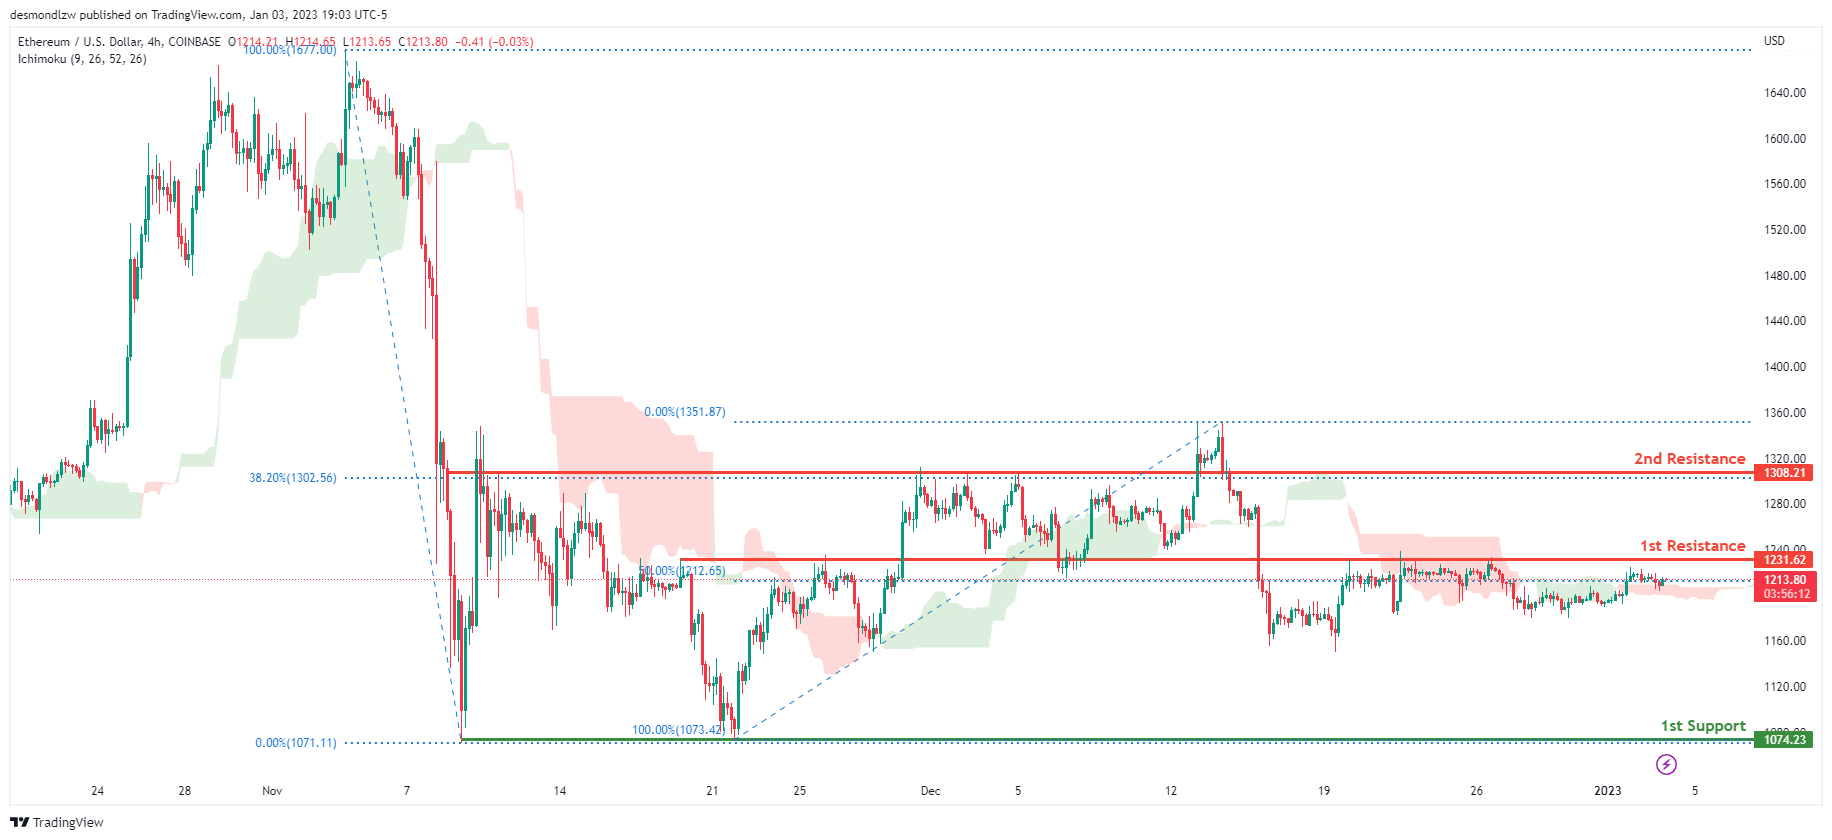
Looking at the H4 chart, my overall bias for ETHUSD is bearish due to the current price crossing below the Ichimoku cloud, indicating a bearish market. If this bearish momentum continues, expect price to head towards the 1st support at 1074.23, where the previous swing low is. In an alternative scenario, price could head back up to break the 1st resistance at 1231.62, where the 50% Fibonacci line is, before heading towards the 2nd resistance at 1308.21, where the 38.2% Fibonacci line is.
Areas of consideration:
- H4 time frame, 1st resistance of 1231.62
- H4 time frame, 2nd resistance of 1308.21
- H4 time frame, 1st support at 1074.23
BTCUSD:
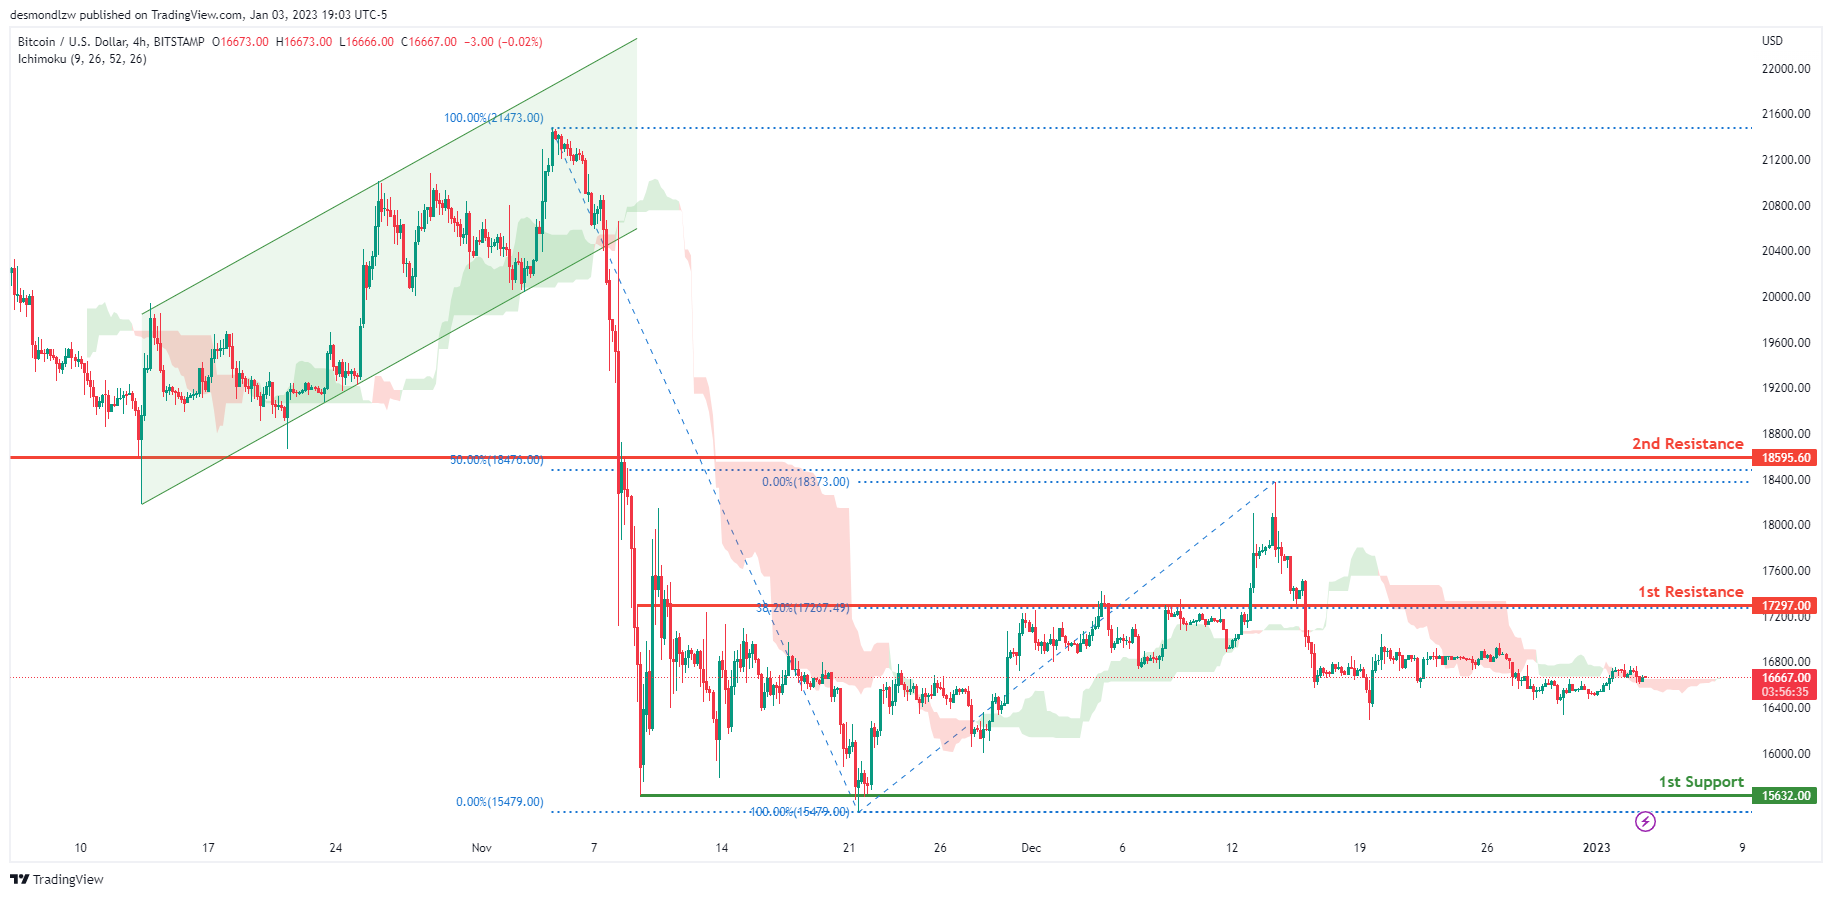
Looking at the H4 chart, my overall bias for BTCUSD is bearish due to the current price crossing below the Ichimoku cloud, indicating a bearish market. To add support to this bias, price has also broken down through the bullish ascending channel. If this bearish momentum continues, expect price to possibly continue heading towards the 1st support at 15632.00, where the previous swing low is. In an alternative scenario, price could possibly head up towards the 1st resistance at 17297.00, where the 38.2% Fibonacci line is.
Areas of consideration:
- H4 time frame, 1st resistance 17297.00
- H4 time frame, 1st support at 15632.00
S&P 500:
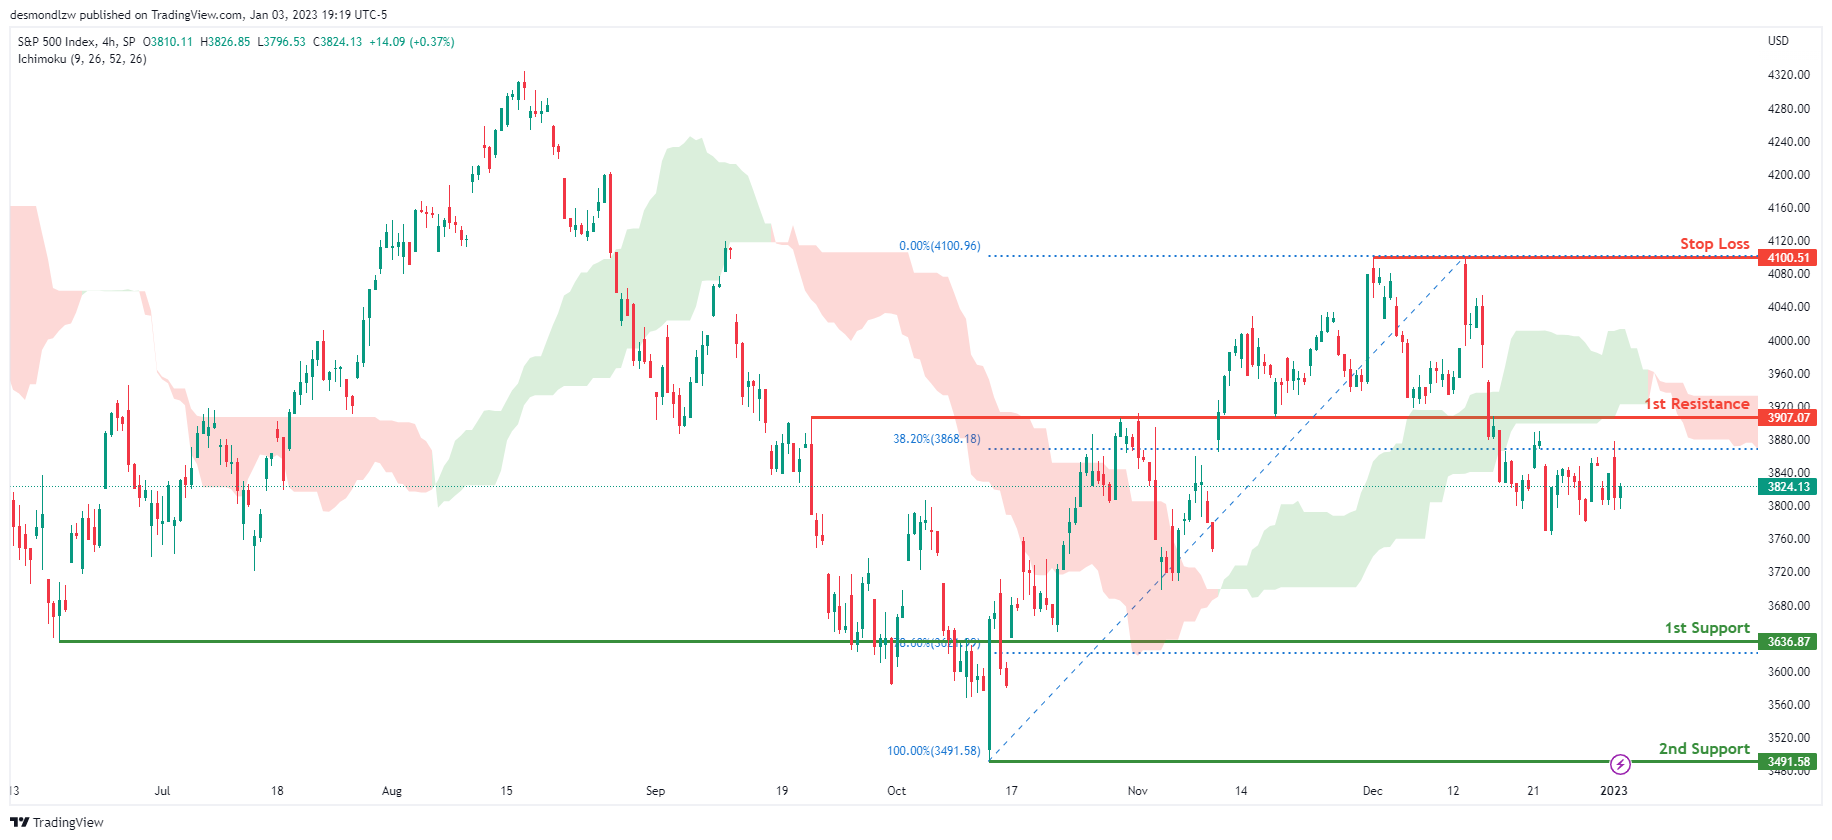
Looking at the H4 chart, my overall bias for S&P500 is bearish due to the current price being below the Ichimoku cloud, indicating a bearish market. If this bearish momentum continues, expect the price to continue heading towards the 1st support at 3636.87, where the 78.6% Fibonacci line is. In an alternative scenario, price could possibly head back up to retest the 1st resistance at 3907.07, where the 38.2% Fibonacci line is.
Areas of consideration:
- H4 time frame, 1st support at 3636.87
- H4 time frame, 1st resistance at 3907.07
Why the Threat of Deflation is Real
I know -- inflation has been grabbing all the headlines for a good while now -- so you may wonder why the subject of deflation is relevant.
First, the definitions of inflation and deflation go beyond commonly accepted meanings.
As Robert Prechter's Last Chance to Conquer the Crash says:
Inflation is an increase in the total amount of money and credit, and deflation is a decrease in the total amount of money and credit. ...
The most common misunderstanding about inflation and deflation ... is the idea that inflation is rising prices and deflation is falling prices. General price changes, though, are simply effects.
That said, let's start off with an occurrence which is quite rare. Here's a chart and commentary from the December Elliott Wave Theorist, a monthly publication which covers major financial and cultural trends:

The chart, published by the Fed, shows that absolute M2 has been declining on a month-by-month basis for the first time in many decades, probably since the 1930s or 1940s. This trend is deflationary.
Keep in mind that M2 is a measure of the U.S. money stock that includes M1 (currency and coins held by the non-bank public, checkable deposits, and travelers' checks) plus savings deposits (including money market deposit accounts), small time deposits under $100,000, and shares in retail money market mutual funds.
Another factor regarding deflation has to do with the Fed.
The November Global Forecast Service, an Elliott Wave International publication which analyzes 50-plus worldwide financial markets, showed this chart and noted:

The Federal Reserve is forging ahead with its balance sheet reduction, as the chart shows. This reduction in the central bank's assets which were paid for by money created out of thin air constitutes disinflation, and deflation (when the balance sheet is contracting on an annualized basis) will likely come by the end of the year.
So, now you see why deflation is very much on the radar screen of Elliott Wave International's Global Forecast Service, which can help you to prepare for what may be next.
Understanding the Elliott wave price patterns of global stock market indexes can also be of help in anticipating what's next for major economies around the globe.
You see, the economy tends to follow the stock market, in each country.
Getting back to the Wave Principle, here are some insights from Frost & Prechter's book, Elliott Wave Principle: Key to Market Behavior:
The Wave Principle is governed by man's social nature, and since he has such a nature, its expression generates forms. As the forms are repetitive, they have predictive value.
Sometimes the market appears to reflect outside conditions and events, but at other times it is entirely detached from what most people assume are causal conditions. The reason is that the market has a law of its own. It is not propelled by the external causality to which one becomes accustomed in the everyday experiences of life. The path of prices is not a product of news. Nor is the market the cyclically rhythmic machine that some declare it to be. Its movement reflects a repetition of forms that is independent both of presumed causal events and of periodicity.
The market's progression unfolds in waves. Waves are patterns of directional movement.
Would you like to read the entire online version of this Wall Street classic -- for free?
You may do so once you become a member of Club EWI, the world's largest Elliott wave educational community.
A Club EWI membership is also free (no obligations whatsoever) and allows for complimentary access to a wealth of Elliott wave resources on investing and trading.
So, get started now by following this link: Elliott Wave Principle: Key to Market Behavior.
This article was syndicated by Elliott Wave International and was originally published under the headline Why the Threat of Deflation is Real. EWI is the world's largest market forecasting firm. Its staff of full-time analysts led by Chartered Market Technician Robert Prechter provides 24-hour-a-day market analysis to institutional and private investors around the world.
BoJ Kuroda expects economy to grow firmly and stably this year
BoJ Governor Haruhiko Kuroda told the bankers' association that Japan is facing uncertainties "such as inflation and pandemic. Yet, he expects the economy to "firmly and stably this year backed by accommodative monetary conditions."
Kuroda reiterated that the central bank would keep monetary easing to achieve the 2% inflation target accompanied by wage growth.
Separately, Prime Minister Fumio Kishida said on a radio program that aired Tuesday, "raising interest rates has an impact on people's day-to-day lives and small and midsize businesses It's not the case that all that needs to be done is to raise rates. The government and the Bank of Japan each have a role to play."
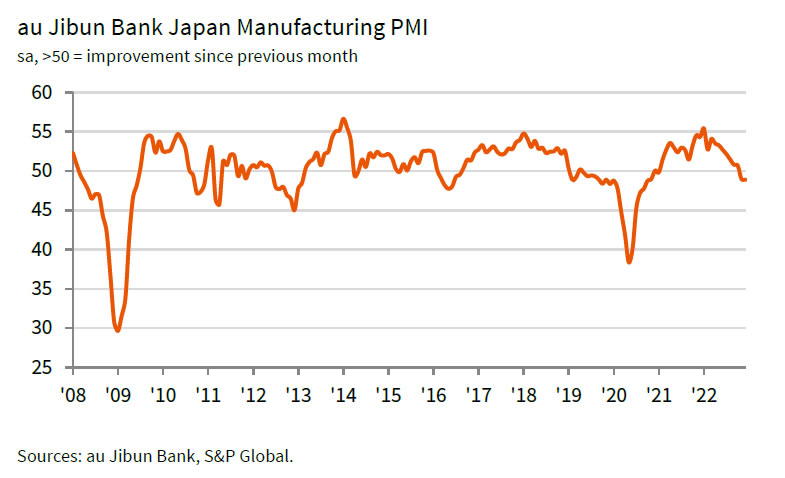
Japan PMI manufacturing finalized at 48.9, slipped further into contraction
Japan PMI Manufacturing was finalized at 48.9 in December, down from November's 49.0. That's the lowest level since October 2020. S&P Global noted there were strong reductions in output volumes and order books. Input buying was cut at strongest rate since September 2020. Supply pressures were the least widespread since February 2021.
Laura Den man, Economist at S&P Global Market Intelligence, said: "December PMI data saw the Japanese manufacturing sector slip further into contraction territory in the final month of 2022. The downturn was largely centred around the current demand environment which is weak both internationally and domestically....
"At the same time, forward looking indicators are increasingly painting a gloomier picture for Japan's manufacturing sector in the future. Companies have cut back input buying sharply, and business sentiment waned to a seven-month low."
ECB Kazaks see significant rate increases at Feb and Mar meetings
ECB Governing Council member Martins Kazaks said yesterday, "in the next two meetings I think we can still do quite large steps" on interest rates.
"Of course the steps may become smaller as necessary as we find the level appropriate to bring the inflation down to 2%," he added.
"Currently I would see that at the February and March meetings we will have significant rate increases," he said.
GBP/USD Could Attempt Fresh Increase Above 1.2200
Key Highlights
- GBP/USD started a downside correction from the 1.2450 zone.
- A key bearish trend line is forming with resistance near 1.2080 on the 4-hours chart.
- EUR/USD corrected lower from the 1.0735 level and declined below 1.0620.
- The US ISM Manufacturing Index could decline from 49.0 from 48.5 in Dec 2022.
GBP/USD Technical Analysis
The British Pound started a fresh decline from well above the 1.2400 level against the US Dollar. GBP/USD declined below the 1.2200 support zone to move into a short-term bearish zone.
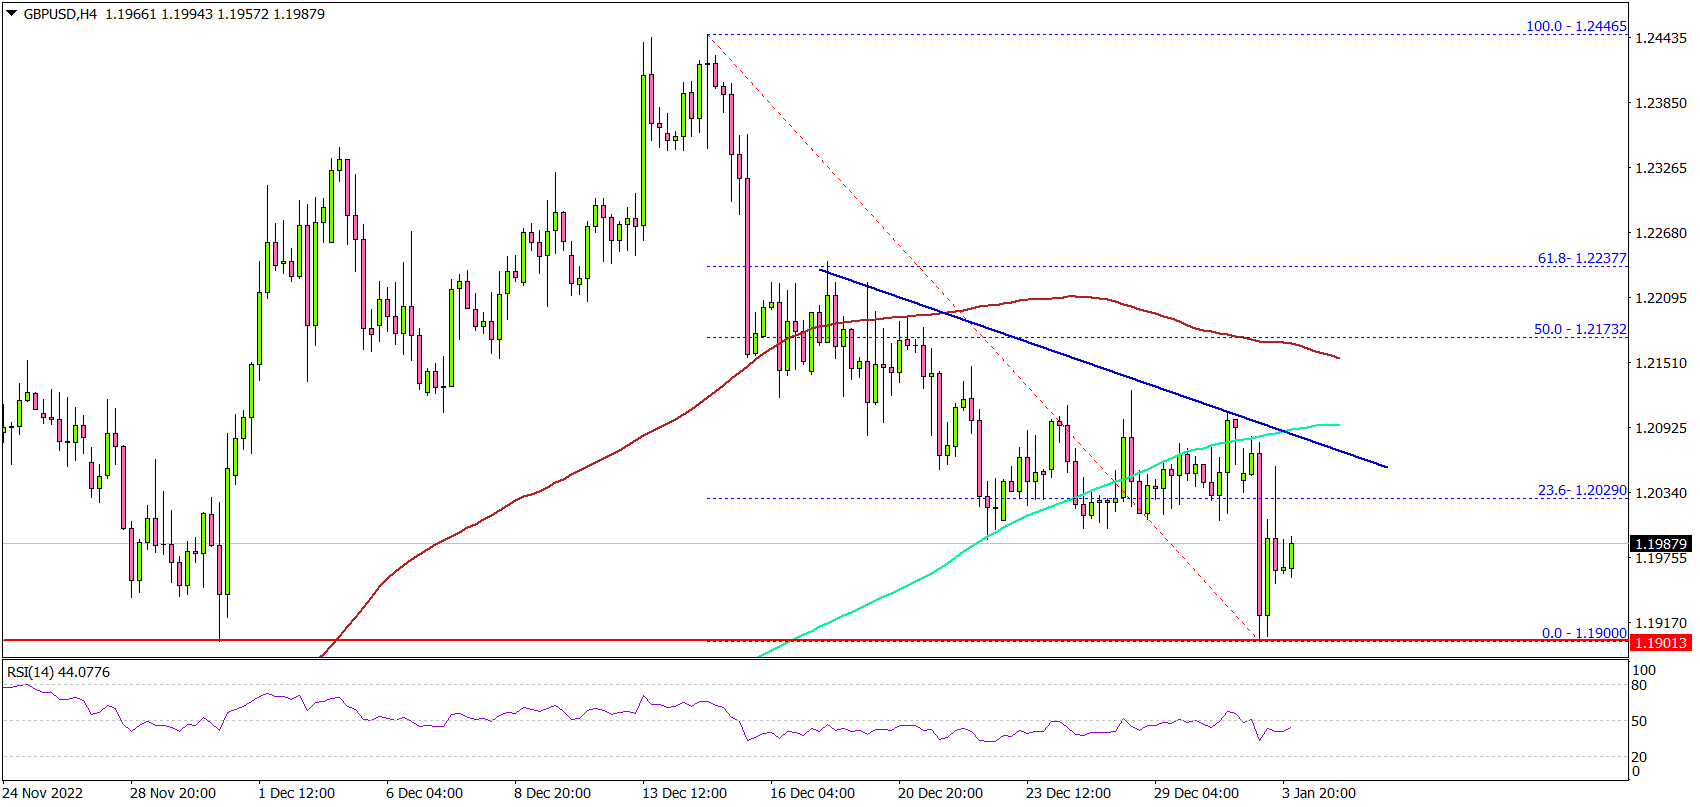
Looking at the 4-hours chart, the pair even declined below the 1.2000 level. There was a close below the 1.2050 level, the 100 simple moving average (red, 4-hours), and the 200 simple moving average (green, 4-hours).
The pair traded as low as 1.1900 and recently started a minor upside correction. The pair climbed above the 1.2000 level, but there are many hurdles on the upside.
On the upside, an initial resistance is near the 1.2080 level. There is also a key bearish trend line forming with resistance near 1.2080 on the same chart. The next major resistance may perhaps be near 1.2150.
A clear move above the 1.2150 resistance might start a steady increase. In the stated case, GBP/USD may perhaps rise towards the 1.2200 level or even 1.2250.
On the downside, there is a key support at 1.1950. The main support is now forming near the 1.1900 level. A downside break below the 1.1900 zone might trigger another drop. The next major support sits near the 1.1800 level. Any more losses might open the doors for a move towards the 1.1650 support zone.
Looking at EUR/USD, the pair struggled to clear the 1.0735 resistance zone and started a short-term downside correction.
Economic Releases
- Germany’s Services PMI for Dec 2022 - Forecast 49.0, versus 49.0 previous.
- Euro Zone Services PMI for Dec 2022 – Forecast 49.1, versus 49.1 previous.
- US ISM Manufacturing Index for Dec 2022 – Forecast 48.5, versus 49.0 previous.
- FOMC Meeting Minutes.
Sunset Market Commentary
Markets
Today counts as the real first trading year of the year with UK and US investors returning from New Year festivities. Only Japanese markets remained closed. German December inflation figures were the main dish. Regional numbers throughout the day served as an indicator for the national number, released in European afternoon. It explains the early market move. German inflation declined more than expected on a monthly basis (-1.2% M/M) with the Y/Y-reading down from 11.3% to 9.6%. The monthly fall is almost completely due to government support to help pay households’ gas bills. Food prices on the other hand continued to increase at the end of 2022. Last week’s Spanish inflation numbers showed a similar phenomenon: headline inflation rising by 0.1% M/M, but the Y/Y headline outcome down to 5.6% (from 6.7%). Spanish core inflation on the other hand set a new record high from 6.3%Y/Y to 6.9%. This divergence between headline and core inflation will be a theme in the first months of the year. Despite today’s market reaction, investors shouldn’t be mistaken: core inflation is the needle in the ECB’s compass and the reason why Lagarde and co delivered their hawkish 50 bps rate hike back in December. Strong German labour market data today also add to the central bank’s normalization/tightening case. Whatever the theory, markets today embraced the bigger-than-hoped for drop in headline inflation. German yield cede 4.8 bps (2-yr) to 11.7 bps (30-yr). The German 10-yr yield tested the previous cycle high at 2.53% around the turn of the year. Changes on the US yield curve are even slightly bigger (in a catch-up move) with yields 7.1 bps (2-yr) to 14.2 bps (10-yr) lower. The single currency faced a moment of weakness in the European session with EUR/USD losing more than one big figure intraday. The pair fell from 1.067 to 1.052, the lowest level since mid-December, before rebounding to 1.0570. EUR/GBP declines from 0.8850 to 0.88. Stock markets have a second strong session straight with main indices gaining over 1% in Europe and opening 0.5% to 1% stronger in the US.
With national Spanish and German inflation numbers pointing to a below-consensus EMU figure on Friday, market focus will now shift to the US with FOMC Minutes, ADP employment, payrolls and ISM’s for both manufacturing and non-manufacturing all printing between Wednesday and Friday. We see scope for a market reaction especially in case of stronger numbers given market thinking on the February Fed meeting. The market is split between a second consecutive 50 bps rate high (25%) or a new downshift to 25 bps (75%).
News Headlines
Turkish inflation slowed substantially in December. The monthly rise in prices slackened to 1.18%. Given a big 13.58 M/M rise in the last month of 2021, this difference caused a huge base effect, easing December 2022 Y/Y inflation to 64.27% from a 84.39% rise in November and a cycle top of 85.51% in October. The decline in headline inflation was also slightly bigger than expected. Core inflation eased sharply to 51.93% from 68.9%. PPI inflation declined 0.24% M/M to reduce the Y/Y reading to 97.72%. The positive base effect likely stays in play for the January inflation. At the same time, the decline might slow as the government prepared substantial fiscal support going into the presidential elections that are to take place in June this year. The Turkish lira showed a mixed picture today, losing modest ground against the dollar (USD/TRY 13.73) but gaining against a broadly weaker euro (EUR/TRY 19.80).
Bulgarian President Rumen Radev gave Nikolay Denkov of the formal ruling party (We Continue the Change) a chance to form a new government. The nomination of Denkov came as the biggest group in Parliament, the center right GERB party, failed to form a government after winning the Parliamentary elections on October 02 last year. However, analysts see only a slim chance for Denkov to be able to form a government. If the a third attempt also fails to from a new government, the president will have to dissolve Parliament with the ongoing political stalemate resulting in new snap elections in spring.
Will Eurozone Inflation Keep the ECB on Track for More 50bps Hikes?
Following a hawkish ECB in December, market participants may be eagerly awaiting the preliminary Euro area inflation numbers, due out on Friday at 10:00 GMT, as they try to assess whether more 50 basis points worth of rate hikes are indeed warranted. Will the data confirm the ECB’s aggressive stance? And how may the euro react?
Appearing in a hawkish suit
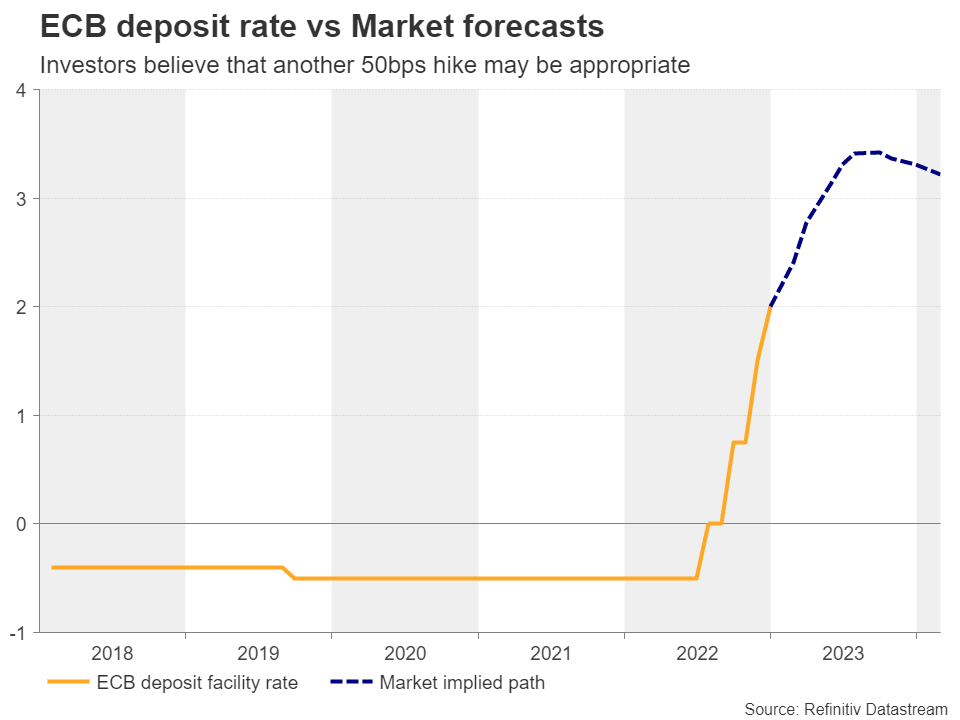
At its last meeting for 2022, the European Central Bank raised interest rates by 50bps after delivering two consecutive triple hikes in September and October. Though the slowdown was generally expected, at the press conference following the decision, President Lagarde appeared surprisingly hawkish. “Anybody who thinks this is a pivot for the ECB is wrong,” she said, adding that interest rates are likely to continue being raised at a 50bps pace for a period of time. That Bank also laid out a plan to start unwinding its bond holdings from March, another step towards tighter policy.
Another 50bps hike is almost fully priced in
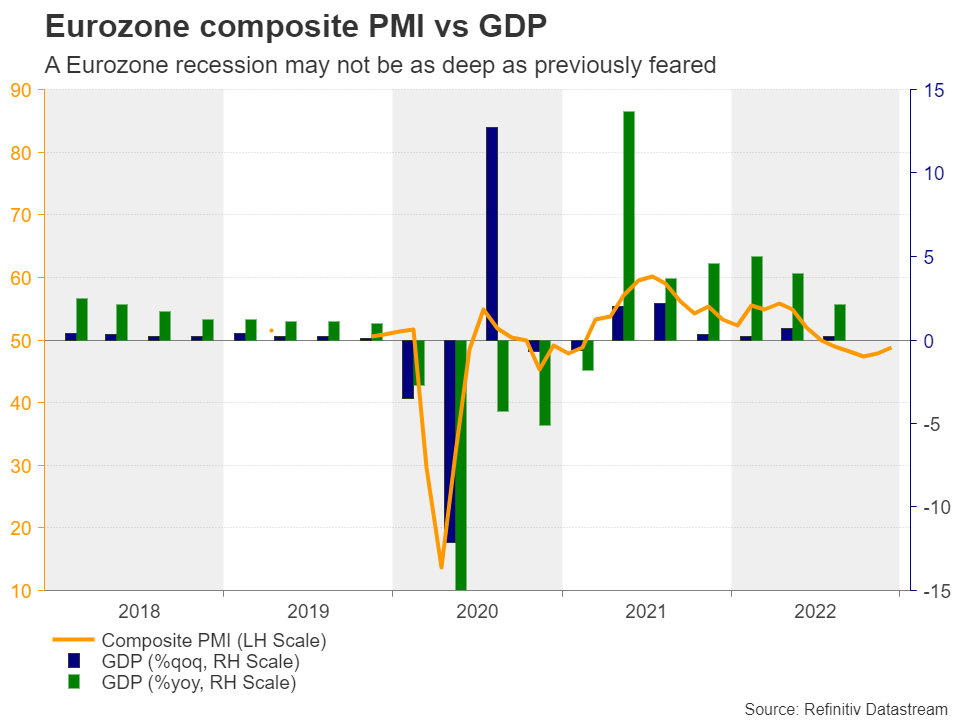
Just the next day, the preliminary PMIs for the month, despite staying in contractionary territory, improved by more than expected, with the surveys pointing to a reduced loss of orders, improving supply conditions, lower price pressures and an uplift in business confidence. Commenting on the flash data, the chief business economist at S&P Global Market Intelligence said that “While the further fall in business activity in December signals a strong possibility of recession, the survey also hints that any downturn will be milder than thought likely a few months ago.”
Combined with more hawkish remarks by ECB policymakers in the aftermath of the meeting, the PMIs may have prompted investors to believe that another 50bps hike at the February gathering is a nearly done deal. It is worth mentioning that on New Year’s Eve, President Lagarde noted that wages are growing faster than previously expected, something the Bank must prevent from adding to already-elevated inflation, while a few days earlier, ECB member Klaas Knot said that until July, the Bank would achieve a decent pace of tightening through half percentage point rises.
Inflation to slow but stay elevated
Friday’s data is expected to show that Eurozone’s headline harmonized index of consumer prices slowed further to 9.7% y/y in December from 10.1%, while the core rate is forecast to have ticked down to 6.5% y/y from 6.6%.
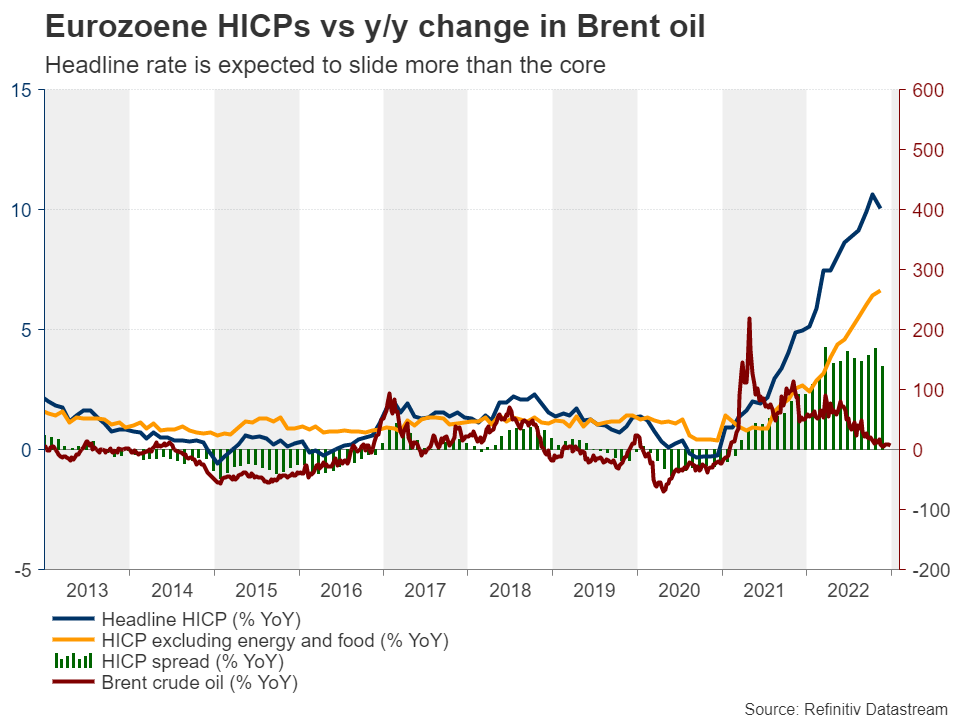
With underlying inflation not expected to have cooled much, the decent slide in the headline rate may be partly owed to the slide of the yearly change in oil prices. That change may turn negative in February or March as the war-related rally is thrown out of the year-on-year calculation, which could drag headline inflation even lower. However, should underlying inflation stay at levels more than triple the ECB’s objective, policymakers may have no other choice than keep delivering more double hikes. Despite their latest slowdown, producers’ prices remain extremely high, supporting the view that core consumer prices could stay elevated for longer.
Euro may be destined to trade north
Even if the euro corrects lower due a further slide in headline inflation, a still-elevated underlying metric could keep the losses limited and short-lived. Combined with a 70% probability for a further slowdown in Fed rate hikes to 25bps at its upcoming gathering and bets of nearly two quarter-point cuts by the end of the year, expectations that the ECB will continue with double hikes may result in a rebound in euro/dollar.
From a technical standpoint, the pair is trading above a prior downtrend line taken from the high of February 10, above a shorter-term upward sloping line drawn from the low of September 28, and above both the 50- and 200-day exponential moving averages (EMAs). Despite the strong setback on Tuesday, this keeps chances for a rebound well on the table.
With no clear catalyst to justify the strengthening of the dollar on Tuesday, the bulls may be tempted to re-enter the action from near the 1.0435 territory. Even if that zone breaks, they may have another opportunity at around 1.0200. A potential rebound could result in another test within the key resistance zone between 1.0715 and 1.0800, the break of which could add to the bullish narrative and may allow advances towards the peak of March 31, at around 1.1175.
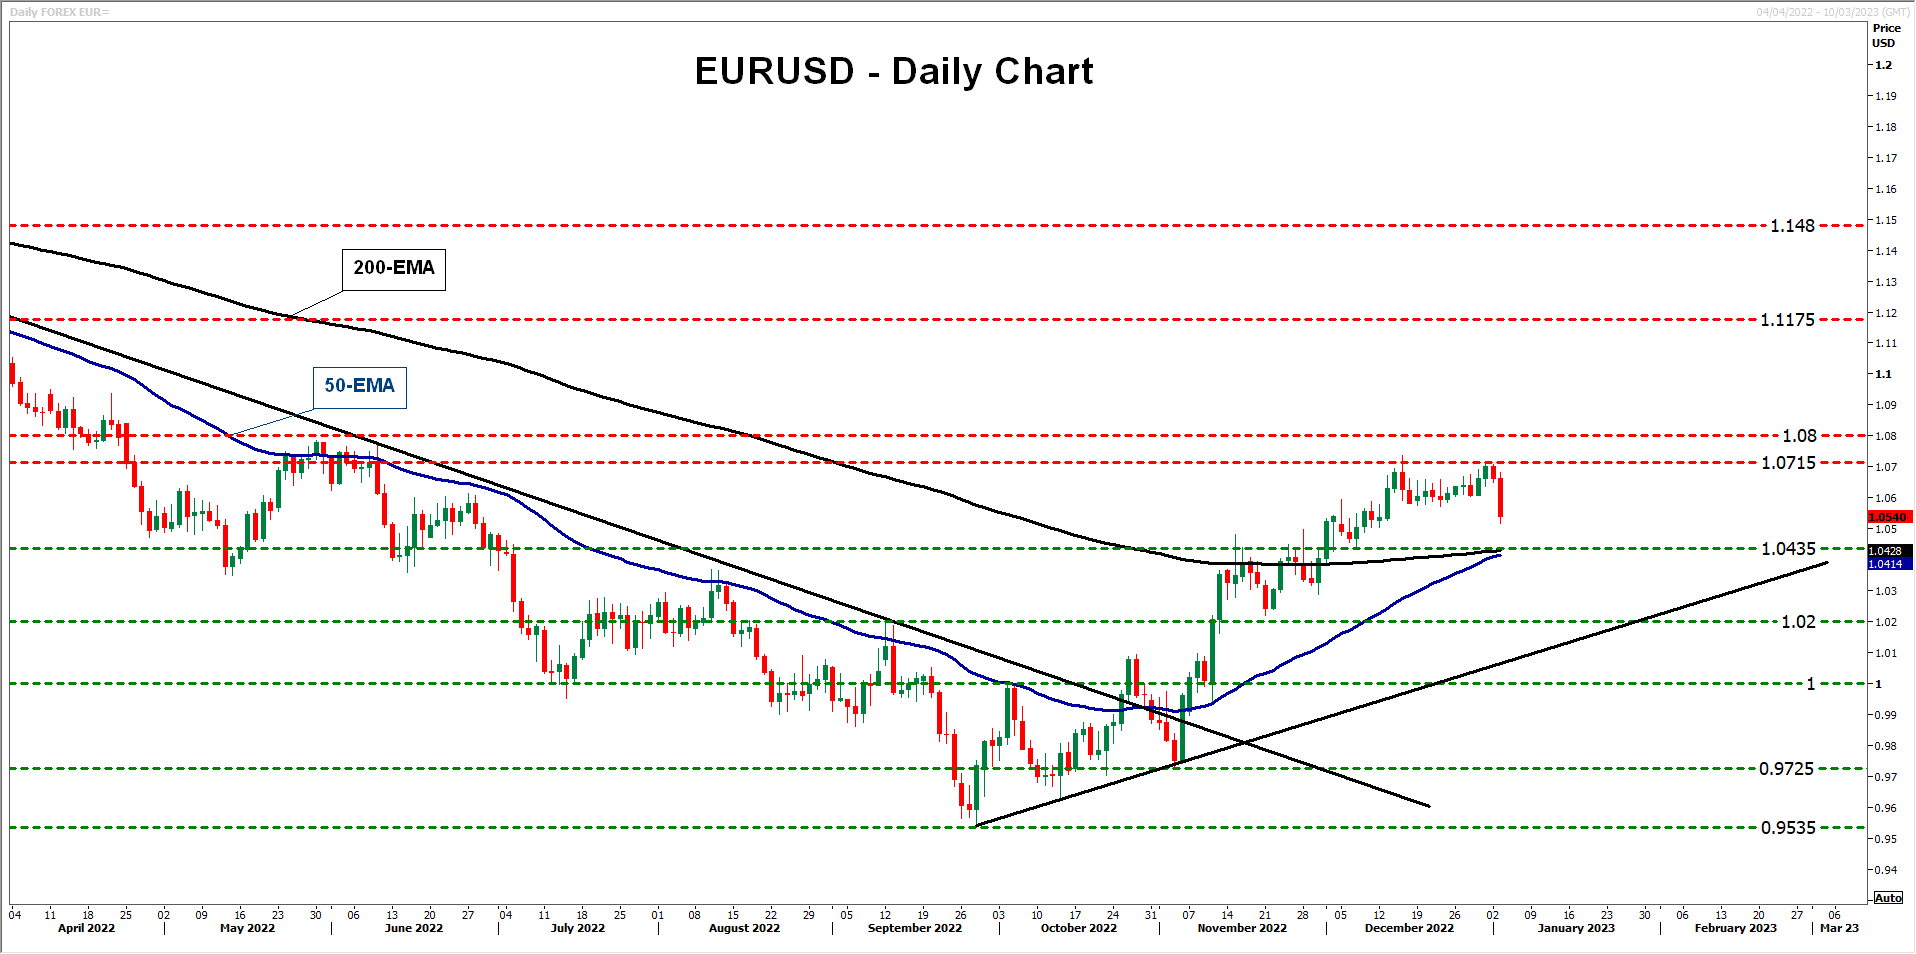
Flipping the coin, should underlying inflation in the Euro area start easing fast, the euro could come under selling interest on speculation that the ECB may further scale down its rate increments. Euro/dollar could fall even more if the ECB is seen as turning more dovish than the Fed. The move signaling that the bears are back in control may be a break back below parity. Such a dip would take the pair below the short-term uptrend line and may initially target the 0.9870 zone. If that line doesn’t hold, the pair could fall to 0.9725, or even all the way down to its 20-year low of 0.9535, hit on September 28.
EUR/USD Mid-Day Outlook
Daily Pivots: (S1) 1.0613; (P) 1.0704; (R1) 1.0757; More...
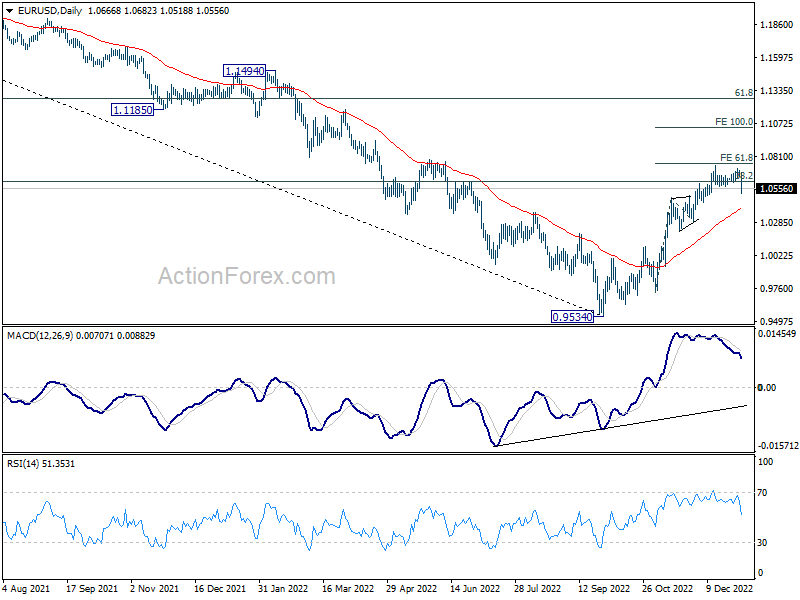
EUR/USD drops sharply today but stays above 1.0481 resistance turned support. Intraday bias remains neutral first. On the downside, break of 1.0481 will confirm short term topping, on bearish divergence condition in 4 hour MACD. Deeper fall would be seen back to 1.0289 support and below. On the upside, however, firm break of 61.8% projection of 0.9729 to 1.0481 from 1.0289 at 1.0754 will pave the way to 100% projection at 1.1041.
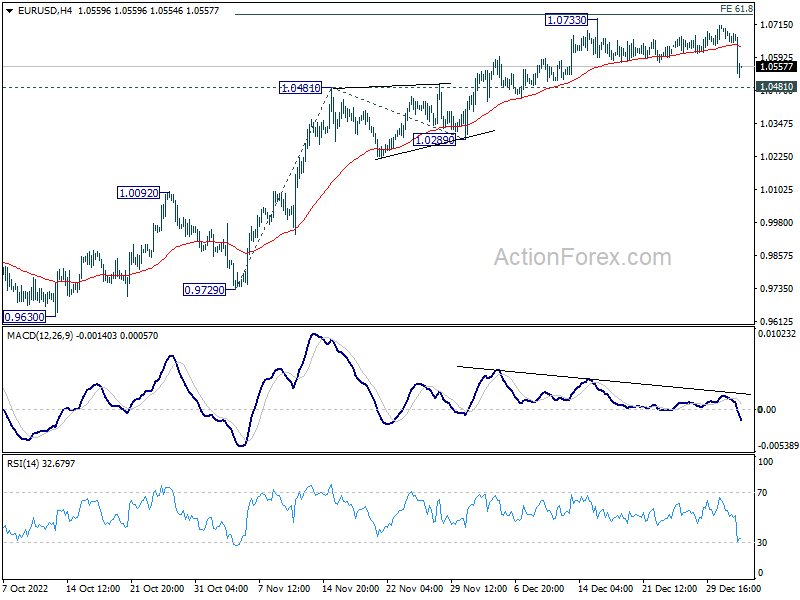
In the bigger picture, focus stays on 38.2% retracement of 1.2348 (2021 high) to 0.9534 at 1.0609. Rejection by 1.0609 will suggest that price actions from 0.9534 medium term bottom are developing into a corrective pattern. Thus, medium bearishness is retained for another fall through 0.9534 at a later stage. However, sustained break of 1.0609 will raise the chance of trend reversal and target 61.8% retracement at 1.1273.