Sample Category Title
USD/CHF Mid-Day Outlook
Daily Pivots: (S1) 0.7550; (P) 0.7667; (R1) 0.7730; More….
A temporary low is formed at 0.7603 in USD/CHF with current recovery and intraday bias is turned neutral first. Outlook will stay bearish as long as 0.7792 resistance holds Break of 0.7603 will resume the larger down trend to 0.7382 projection level next. However, firm break of 0.7792 will turn bias back to the upside, for stronger rebound to 0.7860 support turned resistance.
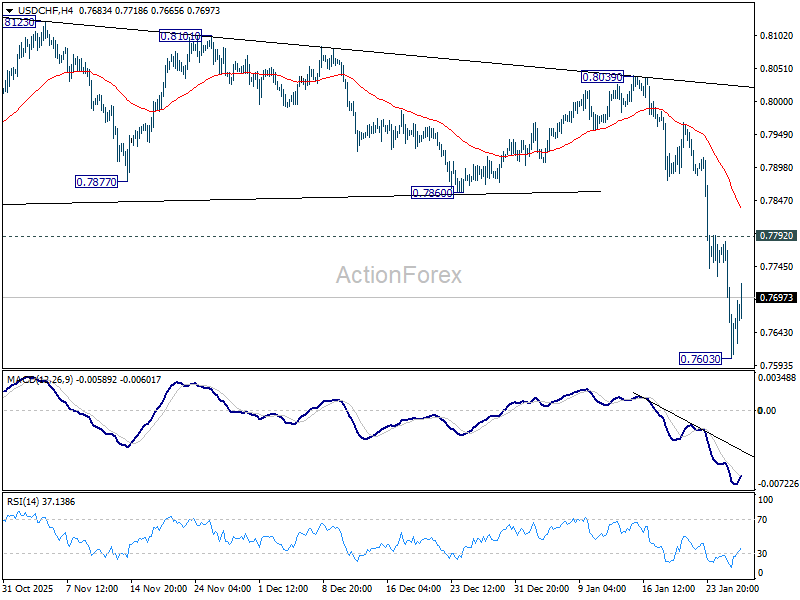
In the bigger picture, larger down trend from 1.0342 (2017 high) is still in progress and resuming. Next target is 100% projection of 1.0146 (2022 high) to 0.8332 from 0.9200 at 0.7382. In any case, outlook will stay bearish as long as 55 W EMA (now at 0.8184) holds.
Bessent’s Strong Dollar Talk Fails to Convince as Recovery Lacks Conviction
Dollar found modest support in early US trading, managing a mild recovery as markets position cautiously ahead of the Federal Reserve’s rate decision. The move looked more like a pause in selling than a decisive shift in sentiment, with traders reluctant to press positions before policy clarity.
Some stabilization came after comments from US Treasury Secretary Scott Bessent, who reiterated that the US maintains a “strong Dollar policy.” The remarks helped temper immediate nervousness, but failed to materially change the broader tone. That is largely because Bessent’s message stands in clear contrast to President Donald Trump’s comments a day earlier. Trump said Dollar was “doing great” despite sliding more than 10% over the past year, effectively signaling comfort with continued weakness.
As a result, markets have interpreted Bessent’s remarks as an attempt to smooth volatility rather than to reverse the White House’s permissive stance. The comments were seen as damage control, not a policy pivot. Technically, Bessent’s assertion is not entirely inaccurate. With the Dollar Index still hovering around 96, the currency remains well above its cycle lows near 70 seen during the 2008 financial crisis.
But that historical context has done little to inspire fresh Dollar demand. Traders appear fully adept at filtering political rhetoric. Rather than betting on verbal assurances, markets are focused on policy actions and institutional signals, leaving Bessent’s comments with limited traction.
Attention now turns to the Fed. Rates are widely expected to be held at 3.50–3.75%, making the decision itself largely a non-event. The real focus will be on the statement language and Jerome Powell’s press conference. The base case remains an easing bias framed within a wait-and-see stance. The Fed’s latest dot plot points to one rate cut this year, making a cautious tilt toward easing a logical extension of current guidance.
Still, a more non-committal tone cannot be ruled out. Solid pockets of economic data, still-elevated inflation, and renewed trade threats involving Europe and Canada give policymakers reason to retain flexibility rather than pre-commit.
That nuance matters politically. Even a straightforward hold is likely to draw renewed criticism from Trump. Any shift toward a more neutral or less dovish bias would almost certainly provoke sharper attacks, further testing perceptions of Fed independence. Against that backdrop, outcomes and market reactions remain highly fluid.
In FX performance terms, the picture remains unfavorable for Dollar. For the week so far, it is the worst-performing major, followed by Sterling and Euro. Yen leads, followed by Aussie and Kiwi. Loonie sits mid-pack after the BoC held rates and maintained a neutral stance. Swiss Franc has drifted back toward the middle as risk sentiment modestly improves.
BoC holds at 2.25%, US trade risk as key source of vulnerability
The BoC left its policy rate unchanged at 2.25%, in line with expectations, and reiterated a neutral bias. The Governing Council said the current setting “remains appropriate,” conditional on the economy evolving broadly in line with its outlook.
The Bank judged that the outlook for both the global and Canadian economies is little changed from the October MPR. However, it cautioned that the balance of risks remains tilted by external factors, particularly “unpredictable US trade policies and geopolitical risks.”
Near-term growth is expected to remain "modest". Growth forecasts were left broadly unchanged, with GDP expected to expand 1.1% in 2026 and 1.5% in 2027. A major source of uncertainty remains the upcoming review of the Canada-US-Mexico Agreement, which could materially affect trade flows and investment decisions. On inflation, the BoC expects price growth to stay close to its 2% target over the projection horizon.
Australia CPI surges to 3.6% in Q4, 3.8% in December
Australia’s Q4 CPI showed little relief for RBA where it matters most for policy. Headline inflation rose 0.6% qoq, slightly below expectations of 0.7% and slowing sharply from the prior quarter’s 1.3% gain. However, on an annual basis, CPI accelerated from 3.2% yoy to 3.6% yoy, matching forecasts and keeping inflation well above the RBA’s target band.
The more important signal came from underlying inflation. Trimmed mean CPI rose 0.9% qoq, easing marginally from 1.0% previously but beating expectations of 0.8%. Annual trimmed mean inflation climbed from 3.0% yoy to 3.4% yoy, above the expected 3.2%, reinforcing concerns that price pressures remain persistent.
December’s monthly details added to that unease. Headline CPI jumped 1.0% mom, lifting the annual rate from 3.5% yoy to 3.8%, both above expectations. Trimmed mean CPI rose a more modest 0.2% mom, but annual core inflation still edged up from 3.2% yoy to 3.3% yoy.
Price pressures remain broad in December. Goods inflation accelerated from 3.2% yoy to 3.4%, driven largely by a 21.5% surge in electricity prices. Services inflation climbed from 3.6% yoy to 4.1%, led by domestic travel and accommodation and rising rents.
Markets are now firming up their expectation that RBA will return to rate hike in February.
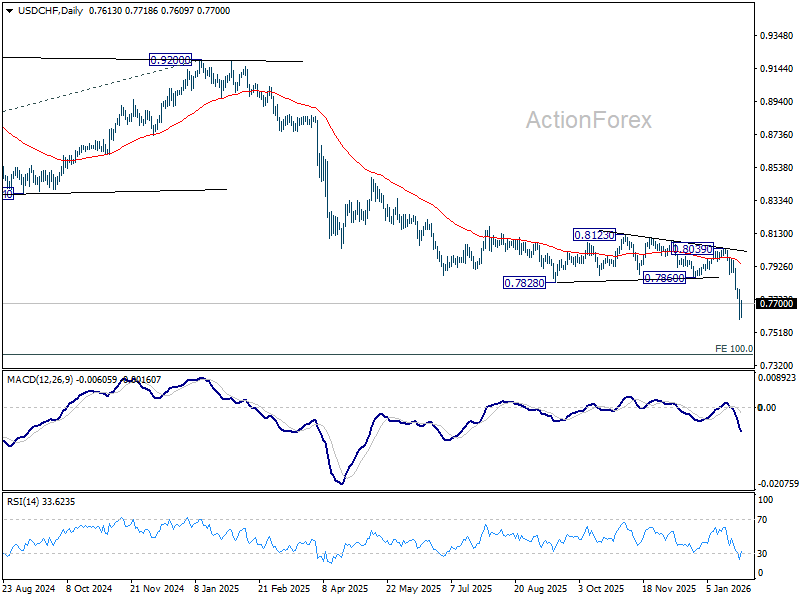
USD/CHF Mid-Day Outlook
Daily Pivots: (S1) 0.7550; (P) 0.7667; (R1) 0.7730; More….
A temporary low is formed at 0.7603 in USD/CHF with current recovery and intraday bias is turned neutral first. Outlook will stay bearish as long as 0.7792 resistance holds Break of 0.7603 will resume the larger down trend to 0.7382 projection level next. However, firm break of 0.7792 will turn bias back to the upside, for stronger rebound to 0.7860 support turned resistance.
In the bigger picture, larger down trend from 1.0342 (2017 high) is still in progress and resuming. Next target is 100% projection of 1.0146 (2022 high) to 0.8332 from 0.9200 at 0.7382. In any case, outlook will stay bearish as long as 55 W EMA (now at 0.8184) holds.
BoC holds at 2.25%, US trade risk as key source of vulnerability
The BoC left its policy rate unchanged at 2.25%, in line with expectations, and reiterated a neutral bias. The Governing Council said the current setting “remains appropriate,” conditional on the economy evolving broadly in line with its outlook.
The Bank judged that the outlook for both the global and Canadian economies is little changed from the October MPR. However, it cautioned that the balance of risks remains tilted by external factors, particularly “unpredictable US trade policies and geopolitical risks.”
Near-term growth is expected to remain "modest". Growth forecasts were left broadly unchanged, with GDP expected to expand 1.1% in 2026 and 1.5% in 2027. A major source of uncertainty remains the upcoming review of the Canada-US-Mexico Agreement, which could materially affect trade flows and investment decisions. On inflation, the BoC expects price growth to stay close to its 2% target over the projection horizon
Bank of Canada maintains policy rate at 2¼%
The Bank of Canada today held its target for the overnight rate at 2.25%, with the Bank Rate at 2.5% and the deposit rate at 2.20%.
The outlook for the global and Canadian economies is little changed relative to the projection in the October Monetary Policy Report (MPR). However, the outlook is vulnerable to unpredictable US trade policies and geopolitical risks.
Economic growth in the United States continues to outpace expectations and is projected to remain solid, driven by AI-related investment and consumer spending. Tariffs are pushing up US inflation, although their effect is expected to fade gradually later this year. In the euro area, growth has been supported by activity in service sectors and will get additional support from fiscal policy. China’s GDP growth is expected to slow gradually, as weakening domestic demand offsets strength in exports. Overall, the Bank expects global growth to average about 3% over the projection horizon.
Global financial conditions have remained accommodative overall. Recent weakness in the US dollar has pushed the Canadian dollar above 72 cents, roughly where it had been since the October MPR. Oil prices have been fluctuating in response to geopolitical events and, going forward, are assumed to be slightly below the levels in the October report.
US trade restrictions and uncertainty continue to disrupt growth in Canada. After a strong third quarter, GDP growth in the fourth quarter likely stalled. Exports continue to be buffeted by US tariffs, while domestic demand appears to be picking up. Employment has risen in recent months. Still, the unemployment rate remains elevated at 6.8% and relatively few businesses say they plan to hire more workers.
Economic growth is projected to be modest in the near term as population growth slows and Canada adjusts to US protectionism. In the projection, consumer spending holds up and business investment strengthens gradually, with fiscal policy providing some support. The Bank projects growth of 1.1% in 2026 and 1.5% in 2027, broadly in line with the October projection. A key source of uncertainty is the upcoming review of the Canada-US-Mexico Agreement.
CPI inflation picked up in December to 2.4%, boosted by base-year effects linked to last winter’s GST/HST holiday. Excluding the effect of changes in taxes, inflation has been slowing since September. The Bank’s preferred measures of core inflation have eased from 3% in October to around 2½% in December. Inflation was 2.1% in 2025 and the Bank expects inflation to stay close to the 2% target over the projection period, with trade-related cost pressures offset by excess supply.
Monetary policy is focused on keeping inflation close to the 2% target while helping the economy through this period of structural adjustment. Governing Council judges the current policy rate remains appropriate, conditional on the economy evolving broadly in line with the outlook we published today. However, uncertainty is heightened and we are monitoring risks closely. If the outlook changes, we are prepared to respond. The Bank is committed to ensuring that Canadians continue to have confidence in price stability through this period of global upheaval.
Information note
The next scheduled date for announcing the overnight rate target is March 18, 2026. The Bank’s next MPR will be released on April 29, 2026.
Bank of Canada holds as expected, but notes elevated uncertainty
The Bank of Canada (BoC) held its policy rate at 2.25%, in line with market expectations.
The opening statement noted that the Bank's outlook for growth and inflation "has not changed significantly" since the October projection, but uncertainty about the outlook was a common theme. The ongoing uncertainty and tariffs are expected to continue to weigh on the Canadian economy with the economy stalling out to end 2025. The updated Monetary Policy report showed growth is expected to register 1.1% in 2026 and 1.5% in 2027.
The Bank expects that inflation will continue to moderate in the coming months. Base-year effects from last year's GST/HST holiday will eventually drop out of the price calculation, and inflation should hold around the 2% target "over the projection as tariff-related cost pressures are offset by excess supply".
Importantly the release noted that, "[w]hile Council judges the current policy rate is appropriated based on our outlook, the consensus was that elevated uncertainty makes it difficult to predict the timing or direction of the next change in the policy rate".
Key Implications
Not much of a surprise here from the BoC as the data stream has essentially fallen in line with the Bank's expectations. Inflation has continued to moderate (absent base-effects from the GST/HST holiday), and economic growth is generally in line with expectations, leaving the Bank to stay the course.
A widely expected hold, but the emphasis on uncertainty in the statement was prominent. The Bank emphasized the data dependent approach in the coming months as the CUSMA review and geopolitical events could shift the outlook in 2026. That said, our baseline outlook is relatively in line with the BoC – below-trend growth helping inflation continue to moderate. Under these conditions we expect the BoC to stay on the sidelines in the coming months.
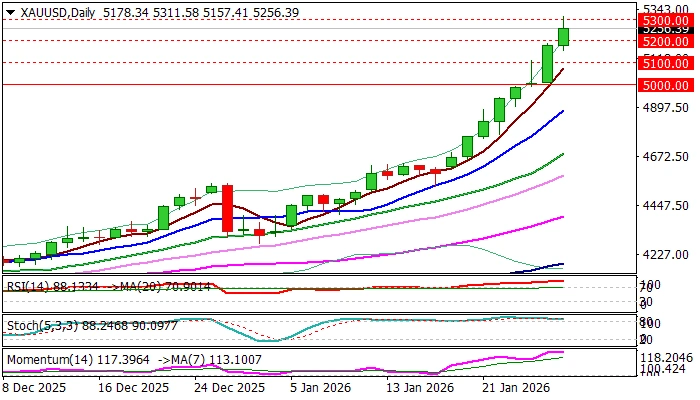
XAU/USD: Gold Hits New Record High Above $5,300
Gold cracked $5300 barrier and hit new record high ($5311) in early Wednesday, remaining in steep and uninterrupted rally that has registered the fastest moves from one to another round-figure level (less than 25 hours), after the price broke psychological $5000 barrier.
The latest strong fall of dollar (Tuesday) that pushed the currency to the lowest in four years and primarily driven by growing crisis of confidence in some US assets, contributed to yellow metal’s recent acceleration, along with dominant geopolitical factor, as well as political earthquake on growing US – EU tensions, endless tariff saga and clouded macroeconomic outlook.
Traders remain extremely cautious and refrain for now from any significant profit-taking action despite screaming overbought indicators on daily chart that keep the price well supported.
This contributes to scenario of shallow dips preceding fresh push higher, as pullback is evident on hourly chart, along with sort of bull-trap pattern above $5300 barrier, hourly RSI emerging from overbought zone and loss of positive momentum.
Broken $5200 level (reinforced by rising 20HMA and near Fibo 38.2% of $4990/$5311 upleg) offers solid support which should ideally contain dips and mark a healthy correction before larger bulls regain control.
Conversely, loss of $5200 handle would risk deeper drop and expose supports at $5150 (Fibo 50%) and $5100 (round-figure, former strong resistance).
Sustained break of $5300 barrier would unmask targets at $5384 (Fibo 200% expansion of five-wave cycle from $3997, Nov 18 low); $5400 (round-figure) and $5500/14 (round-figure / FE 223.6%).
Res: 5277; 5311; 5384; 5400.
Sup: 5235; 5200; 5150; 5100.
For the First Time In History, the Price of Silver Has Exceeded $115
The weakness of the US dollar amid the White House’s ambiguous policy stance, along with other factors (including geopolitics and industrial demand for silver), has led to the XAG/USD quote rising above $115 this week.
Since the beginning of the year, the price of an ounce of silver has increased by more than 50%, continuing the steep upward trend that began back in 2025.
It seems the bull market in precious metals is unstoppable, but the chart is sending important signals that cast doubt on this view.
Technical Analysis of the XAG/USD Chart
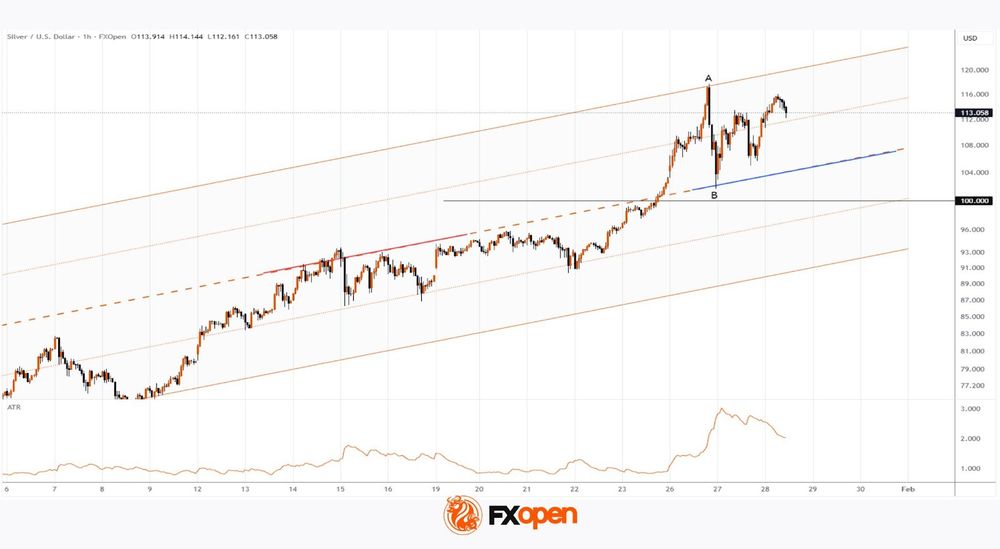
Price fluctuations are forming a broad ascending channel. Pay attention to the following:
→ A surge in volatility, clearly visible on the ATR indicator. It began to form after the psychological level of $100 was breached.
→ A sharp drop from A to B (approximately 12% within a single day) from the upper boundary of the channel to its median. Ordinary retail traders do not have the power to generate such an effect.
Given the above, it is reasonable to assume that after silver surpassed the psychological level of $100 per ounce, demand took on a frenzy-like character. Meanwhile, “smart money” is using the broad market to take profits on long positions after a staggering rise (more than +200% over the past six months). In other words, this points to a distribution phase in terms of Richard Wyckoff’s method.
If false bullish breakouts of resistance levels appear on the chart, followed by successful breaks of support, this will add weight to the argument behind the idea outlined above.
Start trading commodity CFDs with tight spreads (additional fees may apply). Open your trading account now or learn more about trading commodity CFDs with FXOpen.
This article represents the opinion of the Companies operating under the FXOpen brand only. It is not to be construed as an offer, solicitation, or recommendation with respect to products and services provided by the Companies operating under the FXOpen brand, nor is it to be considered financial advice.
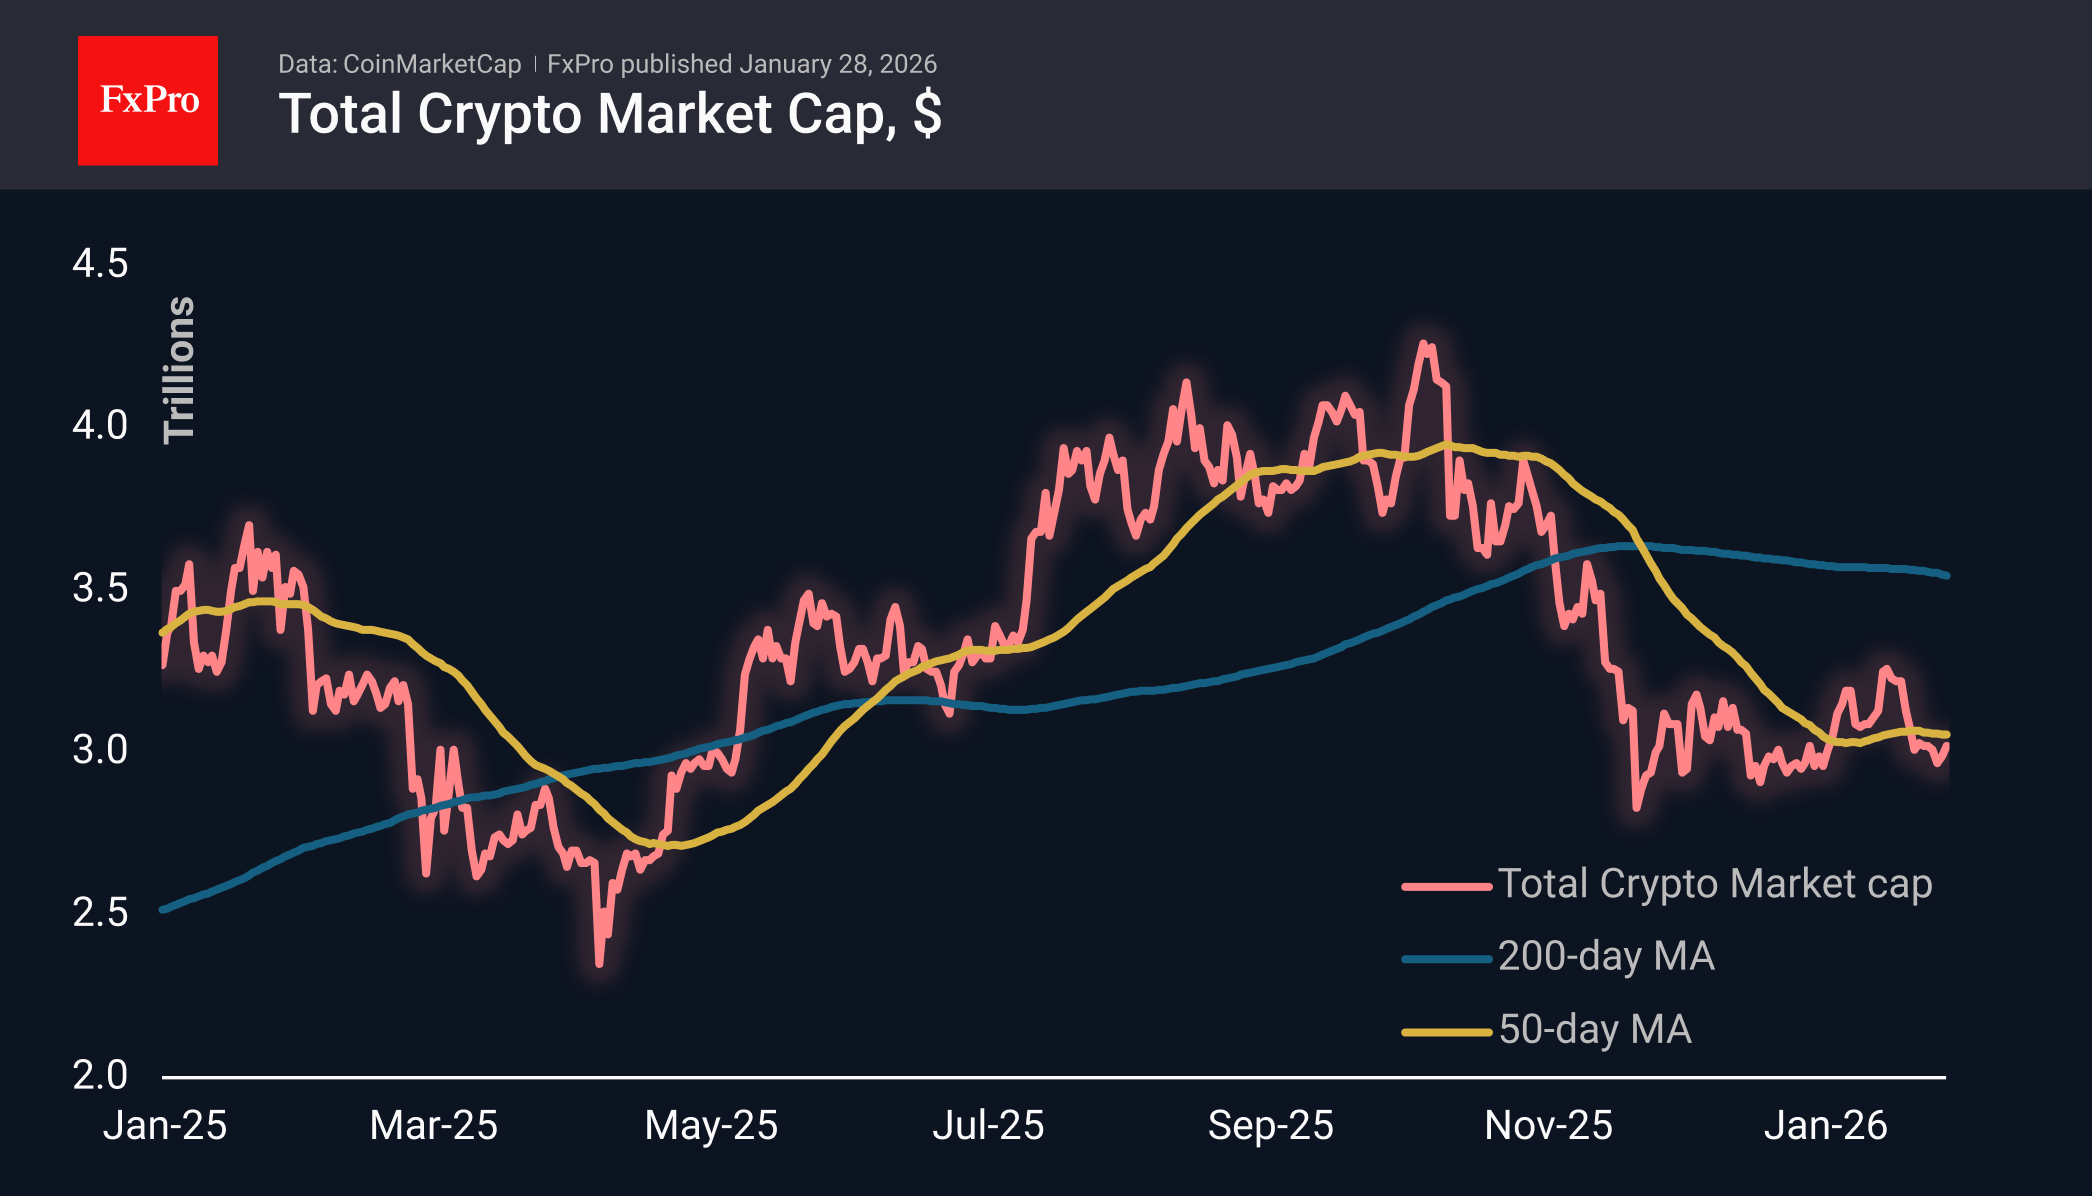
Just a Mild Crypto Winter
Market Overview
The crypto market capitalisation rose by another 1.1% over 24 hours to $3.02 trillion, mirroring the dollar’s weakening during this period. But this strengthening looks pale, as high-risk assets such as cryptocurrencies often move in much larger steps. For example, along with an 8% weakening of the dollar from April to June last year, Bitcoin rose by more than 50%. Without delving too deeply into history, it is easy to see that the 4% drop in the dollar index in less than two weeks was met with a 30% jump in silver and a 15% jump in gold. The US S&P 500 is also rewriting historical highs. Against this backdrop, even a slight increase in market capitalisation looks like a mild winter for cryptocurrencies, and a deeper decline is only a matter of time.
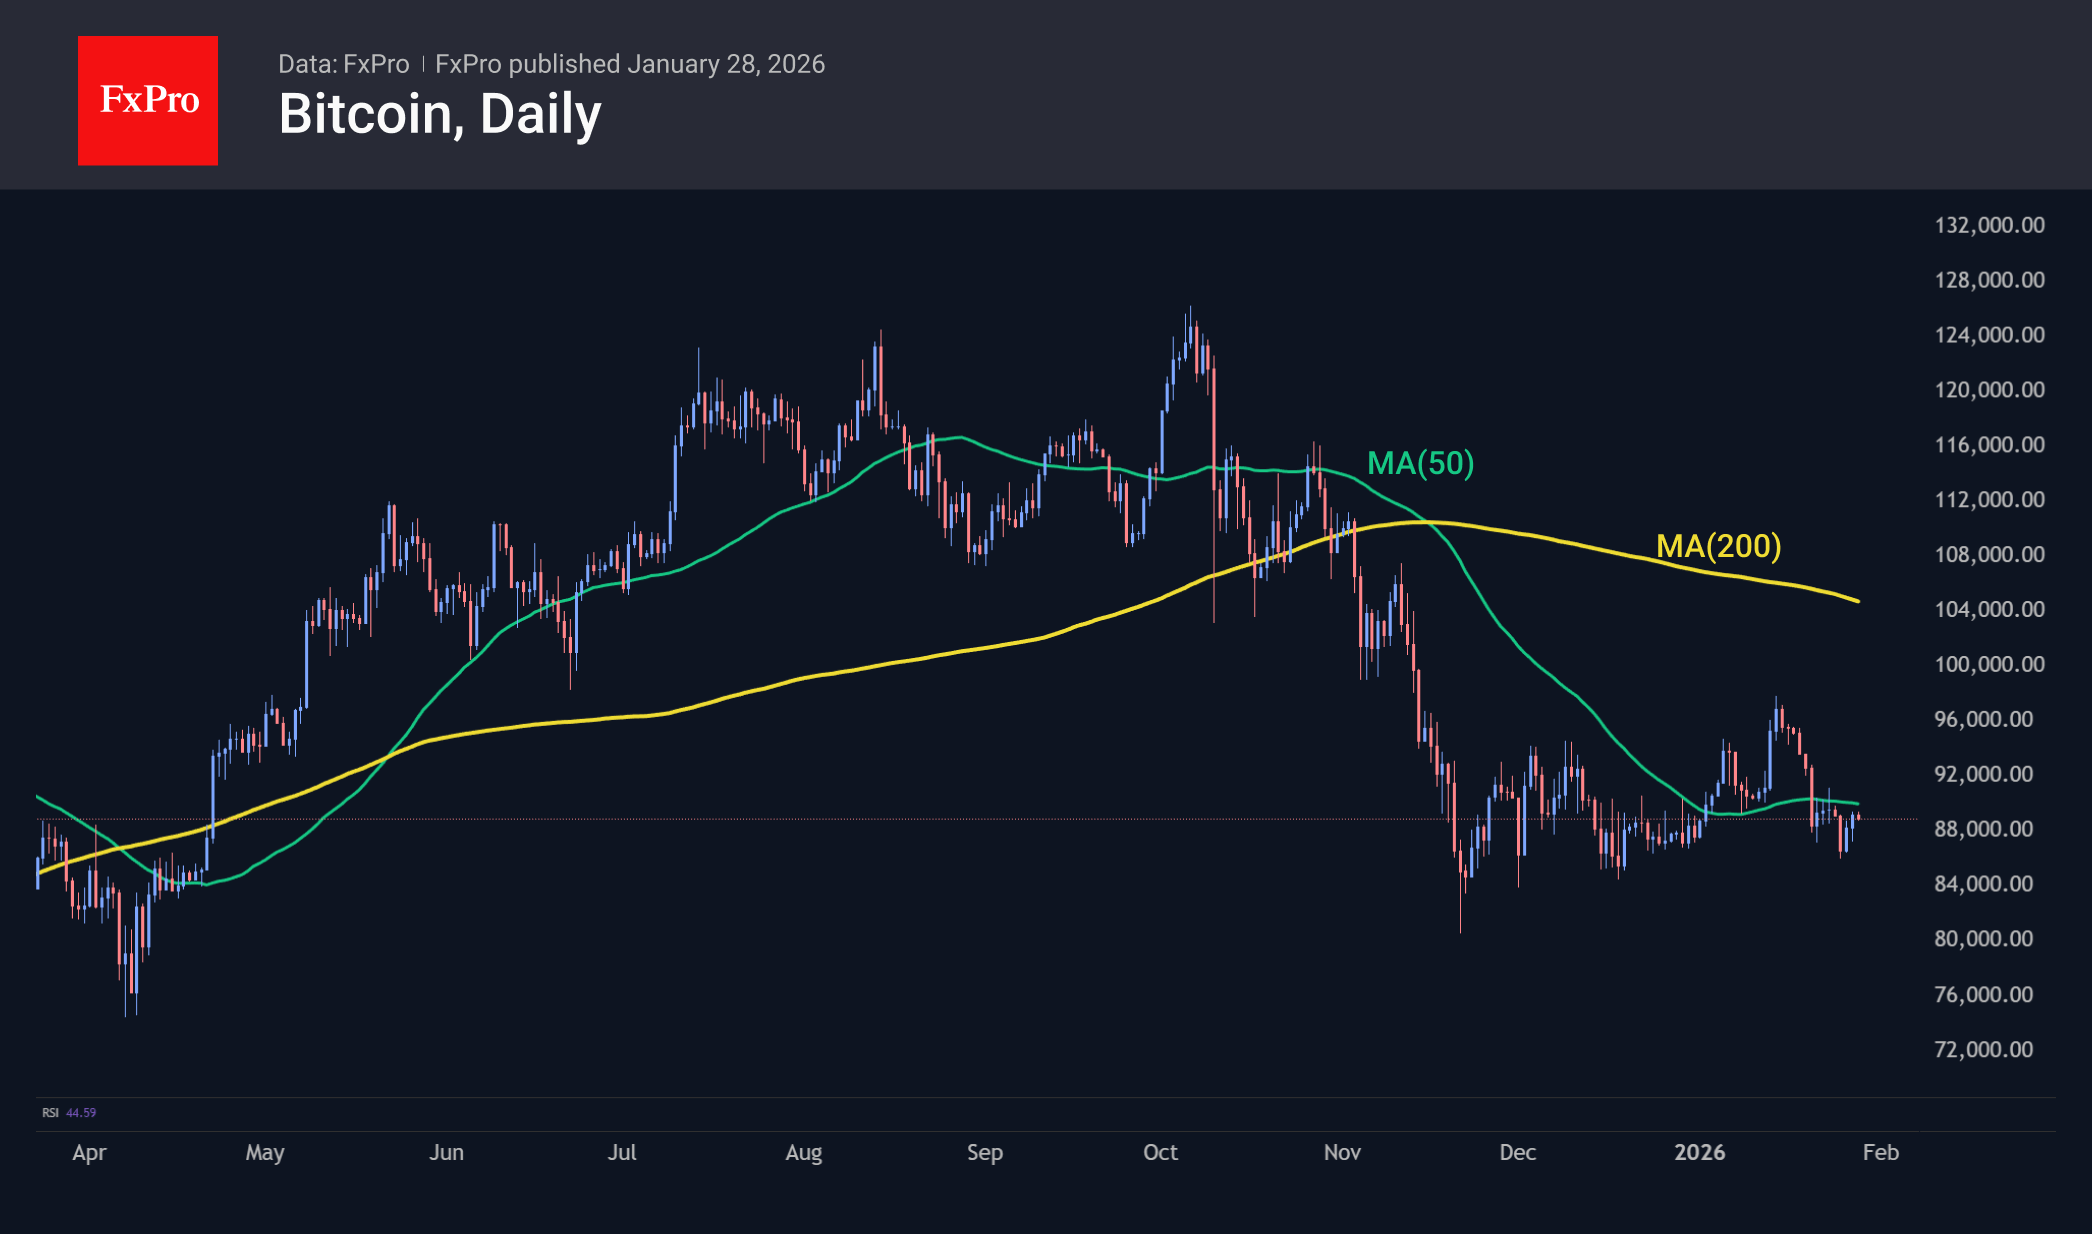
Bitcoin continues to attempt to consolidate above $89K. This resistance level, approaching a round number, is reinforced by the 50-day moving average. BTC’s position relative to this curve indicates a bearish market. Due to a relatively favourable external environment, it has managed to successfully defend support near $85K. Still, fluctuations about a third below the highs of the last two months are cause for pessimism. Neither institutional demand nor the president’s pro-cryptocurrency administration has helped to overcome the accumulated fatigue after the rally of the previous three years.
News Background
In these times of uncertainty and stress in the markets, investors are selling the first cryptocurrency en masse to get cash, turning Bitcoin into an ‘ATM,’ according to NYDIG. This is damaging Bitcoin’s reputation.
According to Santiment, against the backdrop of the gold rally, the capitalisation of stablecoins has fallen by $2.24 billion over the past 10 days. This indicates an outflow of capital from the cryptocurrency market into traditional safe-haven assets and may delay its recovery.
Strategy has reduced its Bitcoin purchases by almost eight times in a week. The company purchased 2,932 BTC ($264.1 million) between 19 and 25 January at an average price of $90,061 per coin. Strategy now owns 712,647 BTC, purchased for $54.2 billion at an average price of $76,037 per Bitcoin.
Japanese company Metaplanet incurred an unrealised loss of $680 million in 2025 due to the depreciation of its Bitcoin reserve. According to BitcoinTreasuries, the ‘Asian Strategy’ owns 35,102 BTC worth $3.1 billion.
Bitmine, the largest corporate holder of Ethereum, reported that it has accumulated 4,243,338 ETH worth more than $12 billion. This represents 3.52% of the total ETH supply, with a target of 5%.
Tether has launched a separate stablecoin for the US market. USAT was created in accordance with last year’s Genius Act, which sets rules for stablecoins and is the first significant piece of legislation for the crypto industry in the country.
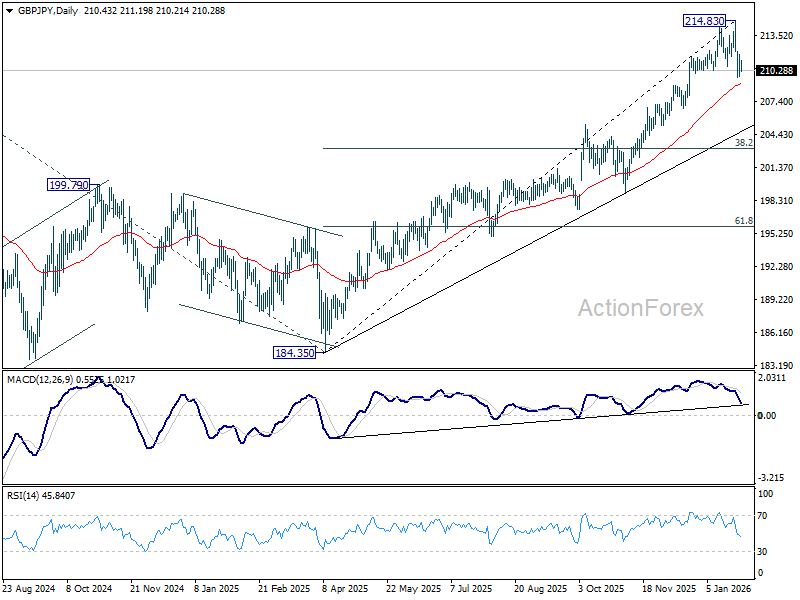
GBP/JPY Daily Outlook
Daily Pivots: (S1) 209.80; (P) 210.78; (R1) 211.76; More...
Intraday bias in GBP/JPY is turned neutral for consolidations above 209.61 temporary low. Risk will stay on the downside as long as 214.83 holds, even in case of strong recovery. Below 209.61, and sustained break of 55 D EMA (now at 209.00) will argue that it's correcting whole rise from 184.35 and target 38.2% retracement of 184.35 to 214.83 at 203.18.
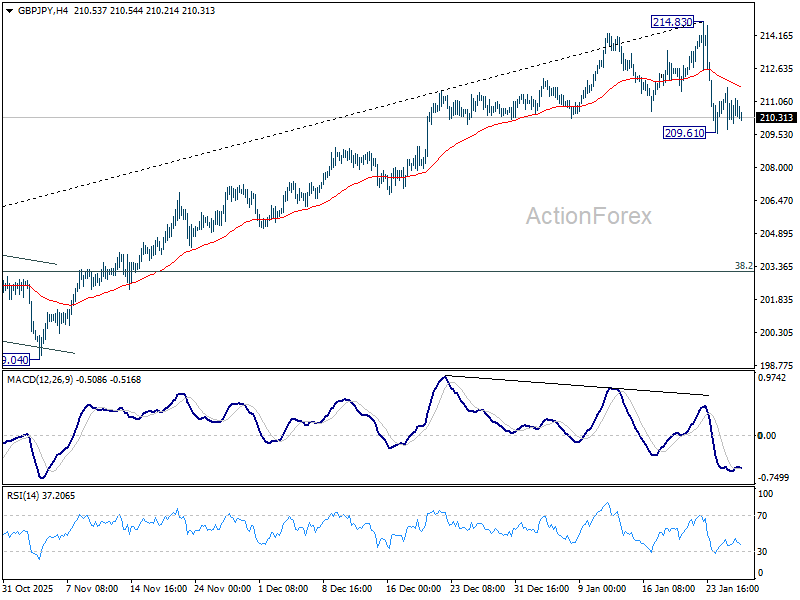
In the bigger picture, up trend from 123.94 (2020 low) is in progress. Next target is 61.8% projection of 148.93 (2022 low) to 208.09 (2024 high) from 184.35 at 220.90. On the downside, break of 205.30 resistance turned support is needed to indicate medium term topping. Otherwise, outlook will stay bullish even in case of deep pullback.
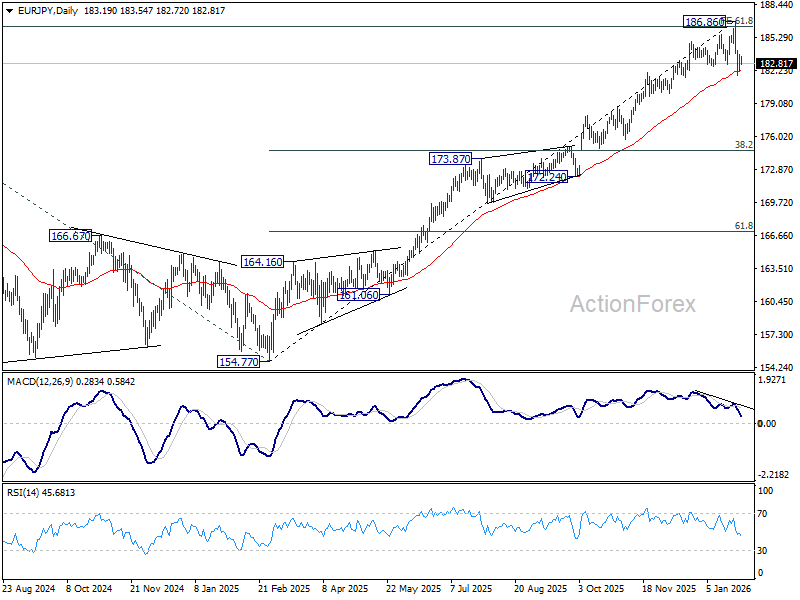
EUR/JPY Daily Outlook
Daily Pivots: (S1) 182.33; (P) 183.06; (R1) 184.01; More...
Intraday bias in EUR/JPY is turned neutral for consolidations above 181.76 temporary low. But risk will stay on the downside as long as 186.86 holds, in case of strong recovery. Break of 181.76 and sustained trading below 55 D EMA (now at 182.14) should solidify the case that fall from 186.86 medium term top is correcting whole rise from 154.77. Deeper decline should then be seen to 38.2% retracement of 154.77 to 186.86 at 174.60.
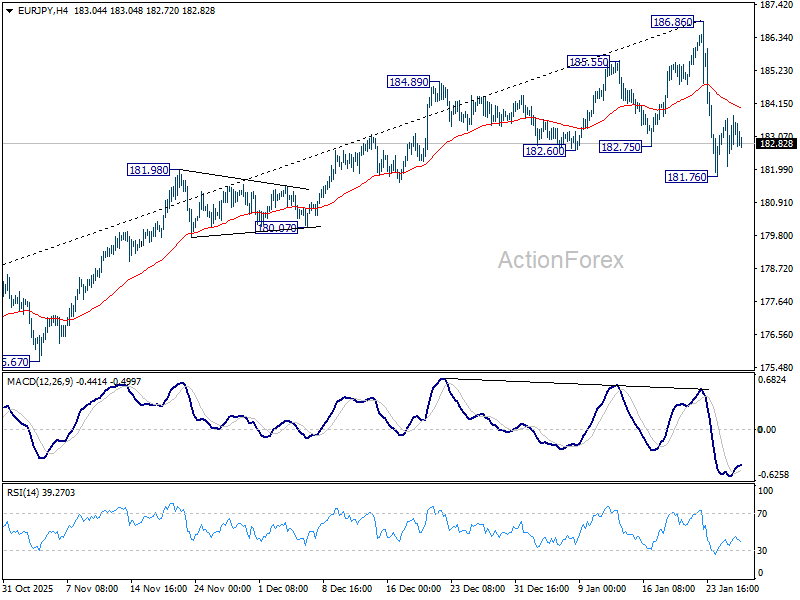
In the bigger picture, up trend from 114.42 (2020 low) is in progress and and met 61.8% projection of 124.37 to 175.41 from 154.77 at 186.31. Considering bearish divergence condition in D MACD, upside could be capped by 186.31 on first attempt. Still, outlook will stay bullish as long as 55 W EMA (now at 173.32) holds, even in case of deep pullback. Sustained break of 186.31 will pave the way to 78.6% projection at 194.88 next.