
Sample Category Title
EUR/USD Rally Accelerates Past 1.20, USD/CHF Buckles
EUR/USD started a fresh surge above 1.1900 and 1.2000. USD/CHF declined further and is now struggling below 0.7750.
Important Takeaways for EUR/USD and USD/CHF Analysis Today
- The Euro started a major increase from 1.1700 against the US Dollar.
- There is a key bullish trend line forming with support near 1.1915 on the hourly chart of EUR/USD at FXOpen.
- USD/CHF declined below the 0.7800 and 0.7750 support levels.
- There is a key bearish trend line forming with resistance near 0.7675 on the hourly chart at FXOpen.
EUR/USD Technical Analysis
On the hourly chart of EUR/USD at FXOpen, the pair started a fresh increase from the 1.1700 zone. The Euro cleared the 1.1850 barrier to move into a bullish zone against the US Dollar.
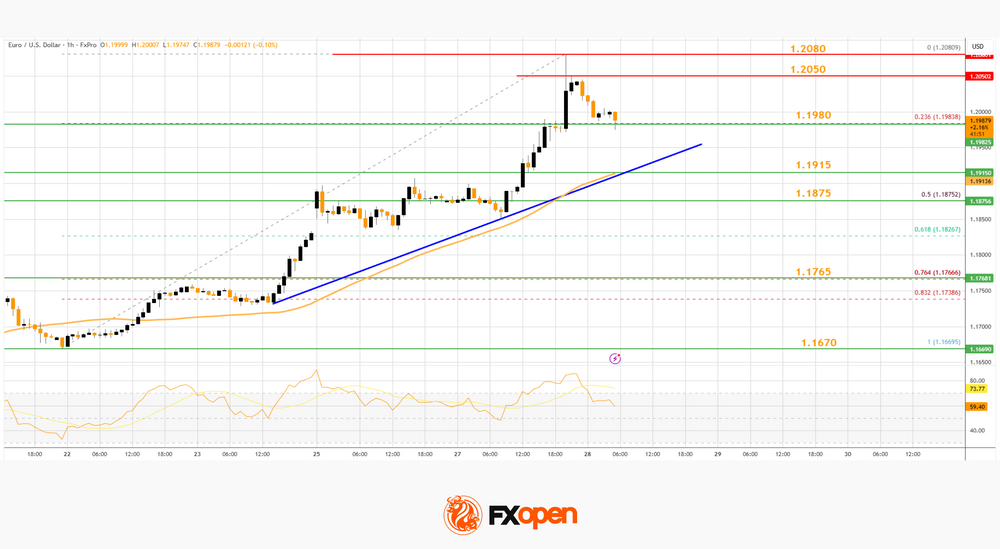
The bulls pushed the pair above the 50-hour simple moving average and 1.1950. Finally, the pair cleared 1.2000 and 1.2050. A high was formed near 1.2080 and the pair is now consolidating gains. There was a minor pullback to the 23.6% Fib retracement level of the upward wave from the 1.1669 swing low to the 1.2080 high.
An Immediate bid zone on the downside is near a connecting bullish trend line at 1.1915 and the 50-hour simple moving average. The next area of interest could be near the 50% Fib retracement at 1.1875.
A downside break below 1.1875 might send the pair toward 1.1765. Any more losses might send the pair into a bearish zone toward 1.1670.
If there is a fresh increase, an immediate hurdle on the EUR/USD chart is 1.2050. The first major pivot level for the bulls could be 1.2080. An upside break above 1.2080 might send the pair to 1.2120. The next selling zone could be 1.2150. Any more gains might open the doors for a move toward 1.2200.
USD/CHF Technical Analysis
On the hourly chart of USD/CHF at FXOpen, the pair started a fresh decline from well above 0.7880. The US Dollar dropped below 0.7800 to move into a negative zone against the Swiss Franc.
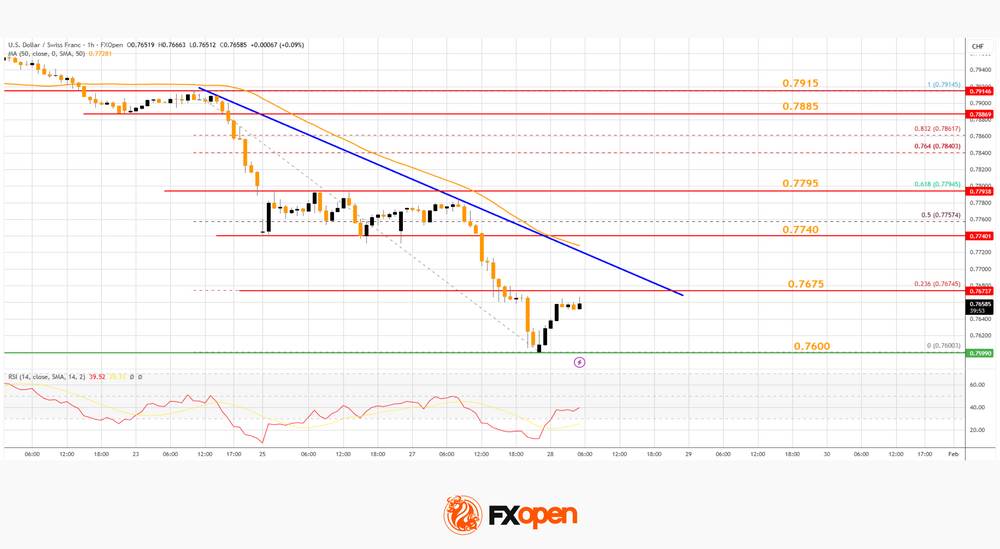
The bears pushed the pair below the 50-hour simple moving average and 0.7750. Finally, the bulls appeared near 0.7600. A low was formed near 0.7600, and the pair is now consolidating losses. There was a minor recovery toward the 23.6% Fib retracement level of the downward move from the 0.7914 swing high to the 0.7600 low.
On the upside, the pair could face bears near 0.7675 and a key bearish trend line. The first major resistance sits near the 50-hour simple moving average at 0.7740. The main barrier for an upside break could be near the 61.8% Fib retracement at 0.7795.
A daily close above 0.7795 could start a fresh increase. In the stated case, the pair could rise toward 0.7885. The next stop for the bulls might be 0.7915.
On the downside, immediate support on the USD/CHF chart is 0.7600. The first major breakdown zone could be 0.7565. A close below 0.7565 might send the pair to 0.7730. Any more losses may possibly open the doors for a move toward 0.7700 in the coming days.
Trade over 50 forex markets 24 hours a day with FXOpen. Take advantage of low commissions, deep liquidity, and spreads from 0.0 pips (additional fees may apply). Open your FXOpen account now or learn more about trading forex with FXOpen.
This article represents the opinion of the Companies operating under the FXOpen brand only. It is not to be construed as an offer, solicitation, or recommendation with respect to products and services provided by the Companies operating under the FXOpen brand, nor is it to be considered financial advice.
EUR/USD Daily Outlook
Daily Pivots: (S1) 1.1902; (P) 1.1992; (R1) 1.2134; More….
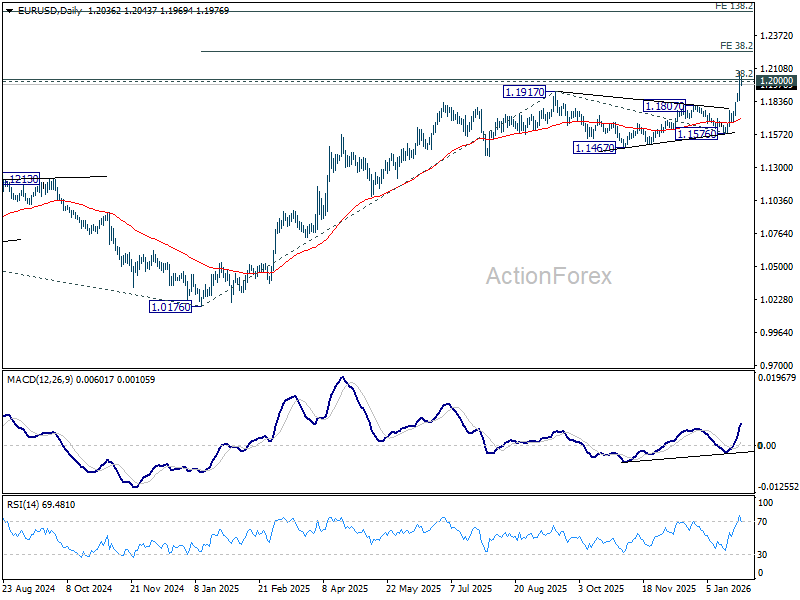
EUR/USD's rally is still in progress and breached 1.2 psychological level before retreating slightly. Intraday bias stays on the upside. Decisive break above 1.2 will carry larger bullish implications. Next near term target will be 38.2% projection of 1.0176 to 1.1917 from 1.1576 at 1.3434. On the downside, below 1.1906 minor support will turn intraday bias neutral first. But outlook will stay bullish as long as 1.1576 support holds, even in case of deep pullback.
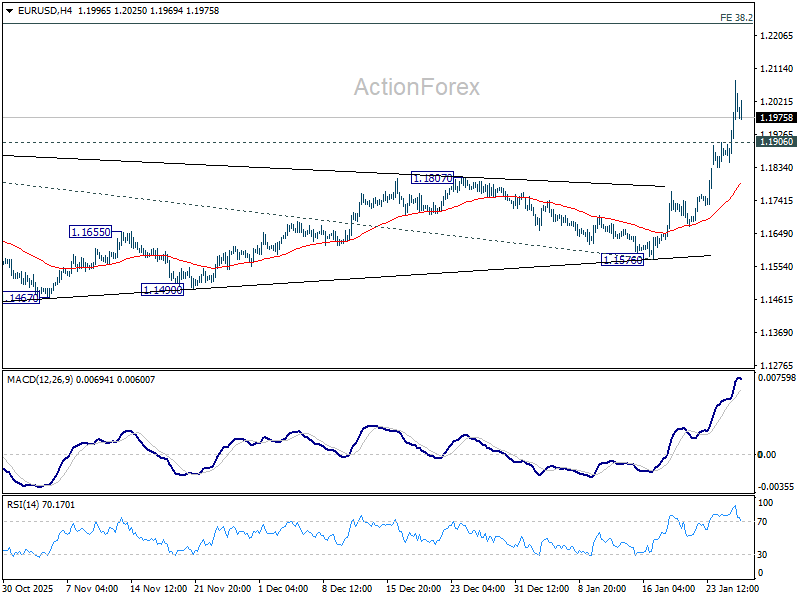
In the bigger picture, as long as 55 W EMA (now at 1.1443) holds, up trend from 0.9534 (2022 low) is still in favor to continue. Decisive break of 1.2 key psychological level will add to the case of long term bullish trend reversal. Next medium term target will be 138.2% projection of 0.9534 to 1.1274 from 1.0176 at 1.2581. However, sustained trading below 55 W EMA will argue that rise from 0.9534 has completed as a three wave corrective bounce, and keep long term outlook bearish.
Dollar Breaches 1.2 Against Euro, Selloff Deepens as Trump Welcomes Weakness
Dollar’s selloff extended through the week, only managing a brief pause after slipping through the key psychological level of 1.2 against Euro briefly. While the pace of decline has slowed, there is little sign of a meaningful recovery taking shape. The bounce has so far been shallow. And, Dollar remains under pressure on multiple fronts, with headwinds increasingly coming from within the US rather than from external shocks or data surprises.
Markets took particular note of remarks from US President Donald Trump, who expressed clear comfort with Dollar’s decline. In a market accustomed to verbal pushback against sharp currency moves, the lack of resistance from the White House has been interpreted as a green light for further weakness.
Asked directly whether the Dollar had fallen too far after sliding about 10% over the past year, Trump dismissed the concern, saying the currency was “doing great” and pointing to strong business activity as justification. Trump also revisited his long-standing complaints about Asian currencies, recalling past disputes with Japan and China over devaluation. The contrast between those confrontations and his current stance reinforces the impression that a weaker Dollar is no longer seen as a problem.
Such remarks matter for markets. When the President signals indifference—or endorsement—toward currency depreciation, it emboldens traders to maintain pressure rather than anticipate a policy-backed rebound.
Adding to the unease, IMF Managing Director Kristalina Georgieva said earlier this week that the Fund is preparing for scenarios involving sharp selloffs in US dollar-denominated assets. While framed as contingency planning, the comments highlights growing institutional awareness of tail risks around the Dollar. Georgieva noted that the IMF is stress-testing “unthinkable” scenarios, including potential runs on Dollar assets, as part of its broader surveillance work. Even without assigning probabilities, the acknowledgement adds to a fragile confidence backdrop.
In currency markets, the impact is clear. For the week so far, Dollar sits at the bottom of the performance table, followed by Loonie and Sterling. At the other end, Yen remains the strongest, supported by lingering intervention threats, though follow-through buying has been limited. Swiss Franc is the second strongest, with gains against both Euro and Sterling pointing to underlying risk aversion. Aussie ranks third, buoyed by strong inflation data that has all but confirmed an RBA rate hike next week. Euro and Kiwi trade in the middle of the pack.
Australia CPI surges to 3.6% in Q4, 3.8% in December
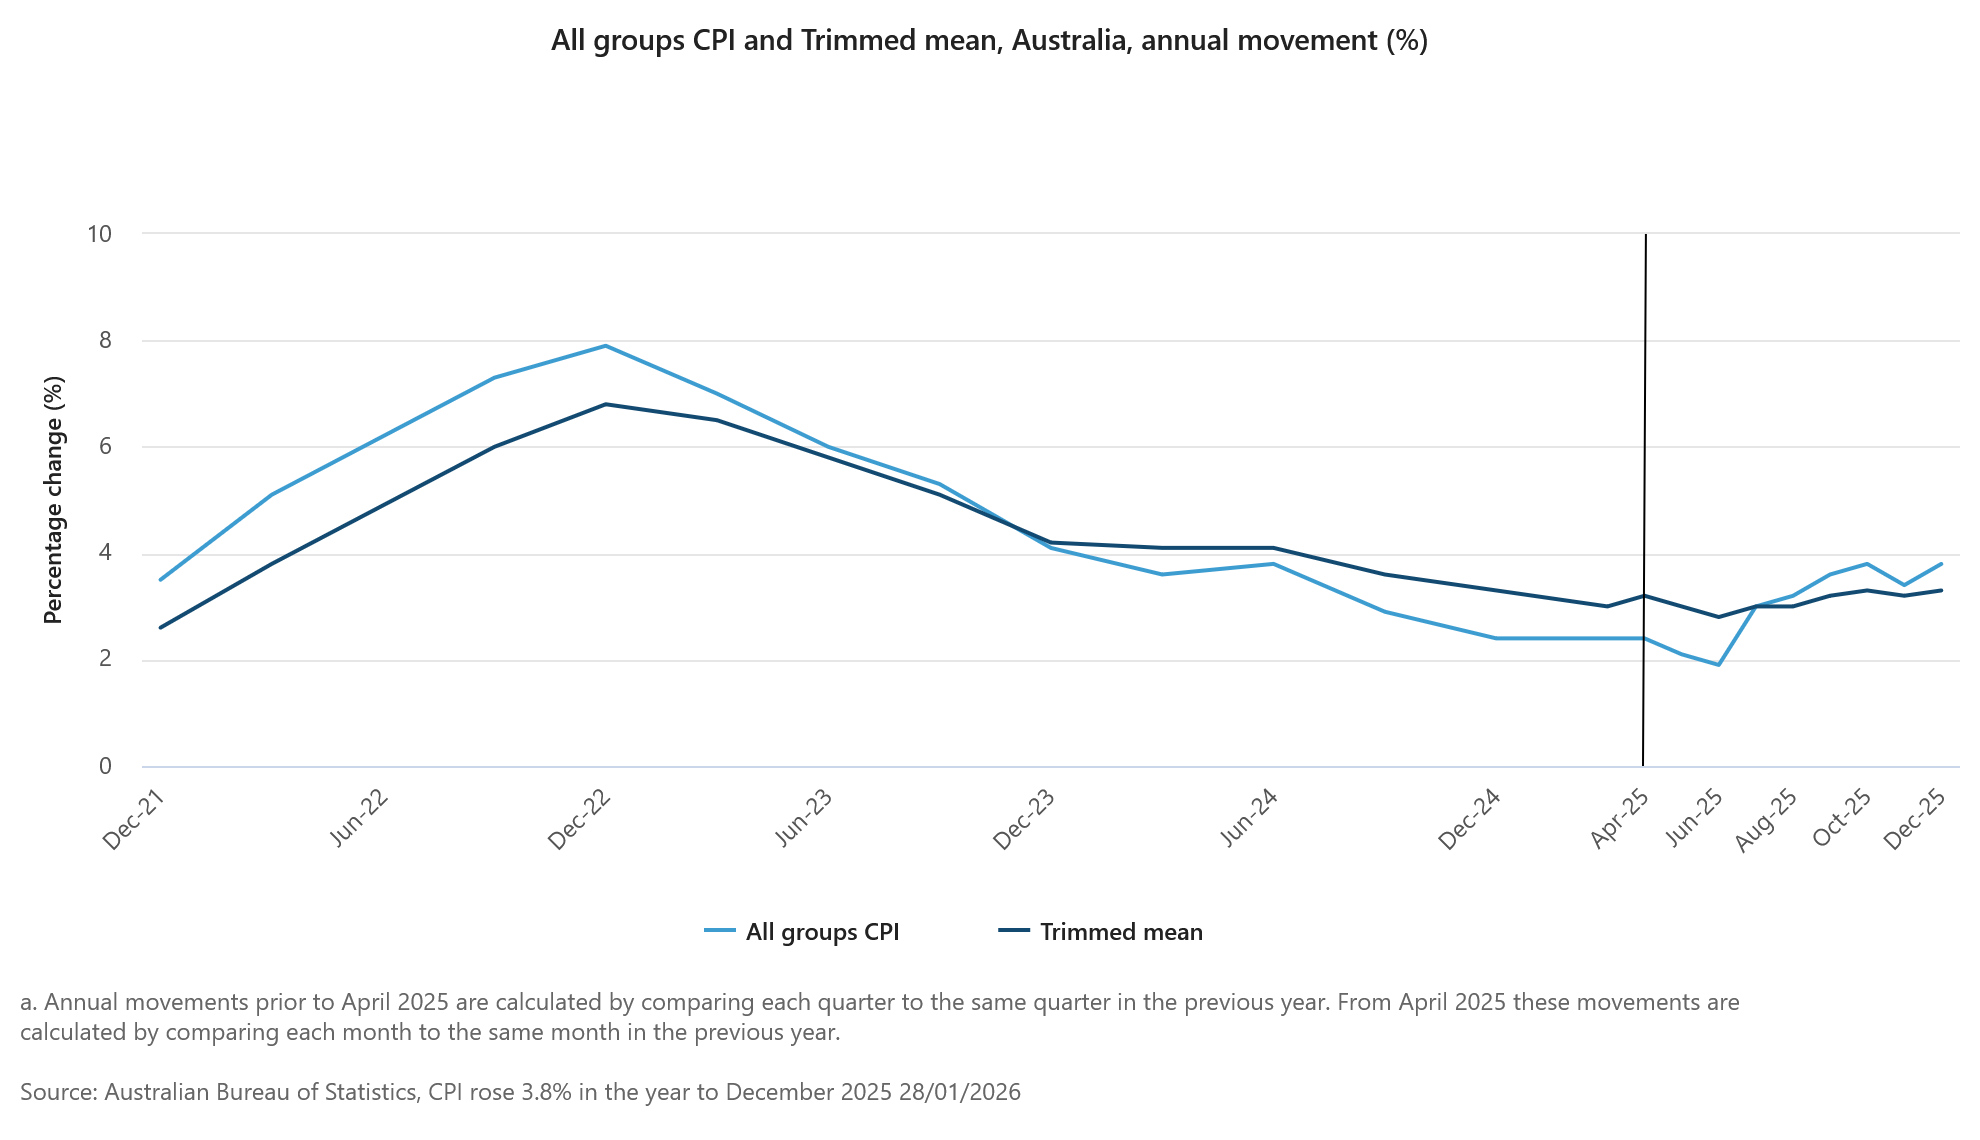
Australia’s Q4 CPI showed little relief for RBA where it matters most for policy. Headline inflation rose 0.6% qoq, slightly below expectations of 0.7% and slowing sharply from the prior quarter’s 1.3% gain. However, on an annual basis, CPI accelerated from 3.2% yoy to 3.6% yoy, matching forecasts and keeping inflation well above the RBA’s target band.
The more important signal came from underlying inflation. Trimmed mean CPI rose 0.9% qoq, easing marginally from 1.0% previously but beating expectations of 0.8%. Annual trimmed mean inflation climbed from 3.0% yoy to 3.4% yoy, above the expected 3.2%, reinforcing concerns that price pressures remain persistent.
December’s monthly details added to that unease. Headline CPI jumped 1.0% mom, lifting the annual rate from 3.5% yoy to 3.8%, both above expectations. Trimmed mean CPI rose a more modest 0.2% mom, but annual core inflation still edged up from 3.2% yoy to 3.3% yoy.
Price pressures remain broad in December. Goods inflation accelerated from 3.2% yoy to 3.4%, driven largely by a 21.5% surge in electricity prices. Services inflation climbed from 3.6% yoy to 4.1%, led by domestic travel and accommodation and rising rents.
Markets are now firming up their expectation that RBA will return to rate hike in February.
AUD/USD surges past 0.70 as RBA hike solidify, 0.72 the test for long term strength
Australian Dollar extended its rally this week, with AUD/USD breaking above 0.70 psychological level. The move has been supported by broad-based Dollar weakness, but domestic factors have played a central role following Australia’s stronger-than-expected inflation data.
December CPI showed another month of acceleration, while Q4 headline inflation printed at 3.6%. More importantly for policymakers, trimmed mean CPI at 3.4% underscored persistent underlying inflation that sits uncomfortably above the RBA’s target band. That inflation shock has quickly filtered into economist forecasts. Westpac and ANZ revised their outlooks, now expecting the RBA to raise the cash rate at its upcoming meeting next week. All four major Australian banks now forecast a 25bp hike back to 3.85%.
The key uncertainty now lies beyond the initial move. The question is whether the RBA would signal scope for a more extended tightening cycle, or frame the hike as a one-off adjustment designed to reassert inflation control.
Technically, AUD/USD remains in clear upward acceleration, with D MACD still pointing higher. The advance from 0.5913 is on track toward its 100% projection of 0.5913 to 0.6706 from 0.6420 at 0.7213 next. On the downside, below 0.6901 support will bring consolidations first. But downside should be contained above 0.6706 resistance turned support to bring another rally.
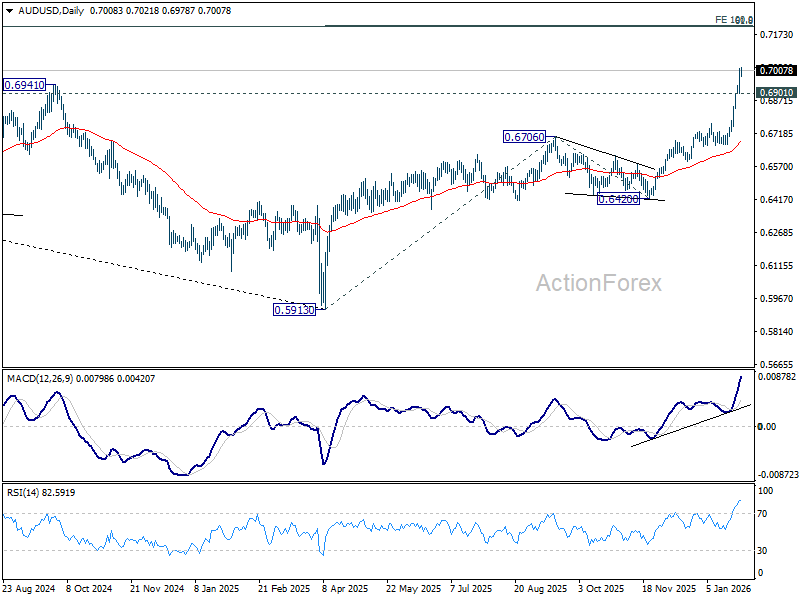
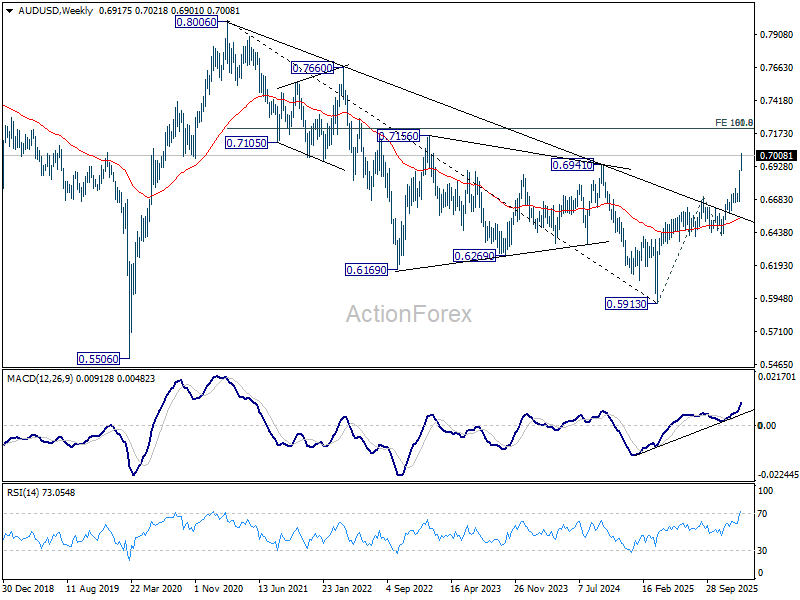
More importantly, the decisive break above 0.6941 structural resistance this week strengthens the case that the rise from 0.5913 is reversing the entire decline from the 0.8006 (2020 high). Next target is 61.8% retracement of 0.8006 to 0.5913 at 0.7206, which is close to the above 0.7213 projection level.
Reactions to this 0.72 resistance zone will decide whether current rise from 0.5913 is the third leg of the pattern from 0.5506 (2020 low), and open the door to further medium up trend through 0.8006.
Fed and BoC holds unlikely to alter USD/CAD downtrend
Two major central bank decisions from North America headline the day, with both the BoC and the Fed widely expected to keep interest rates unchanged. USD/CAD, meanwhile, is unlikely to see its broader trend altered by either decision. The current selloff would likely continue through 1.3538 low as driven by the overall selloff in Dollar.
For the BoC, markets expect rates to remain at 2.25%, the lower bound of the bank’s estimated 2.25–3.25% neutral range. A recent Reuters poll showed nearly 75% of economists expect the BoC to keep policy unchanged through 2026.
At this stage, the BoC appears comfortable with a prolonged wait-and-see stance. However, slack remains in the labour market, growth momentum is uncertain, and policy is not yet clearly stimulative despite the 275bp of rate cuts delivered between June 2024 and October 2025.
Hence, if policy does move again this year, risks are tilted toward further cuts rather than hikes. That bias hinges heavily on trade outcomes. As long as key sectors retain preferential access to the US—either through deals or prolonged negotiations—the growth outlook remains intact.
However, should tariffs expand to a broader range of industries, the drag on activity would intensify. In that scenario, the BoC would likely be forced to resume easing to cushion the economic impact.
Turning to the Fed, rates are expected to remain unchanged at 3.50–3.75%, making this very much a holding meeting. Markets will be listening closely for any shift in tone that hints at future action rather than focusing on the decision itself.
Voting dynamics will be watched carefully. Stephen Miran, a known dove, is expected to dissent in favor of a cut. Any additional votes for easing beyond Miran would be interpreted as a clear dovish signal.
For now, the Fed is expected to remain on hold through the remainder of Jerome Powell’s term in May. Markets price roughly a 63% chance of a June cut, but conviction remains limited given multiple wild cards, including economic data, trade relations, financial market stability, and President Donald Trump’s choice of the next Fed chair.
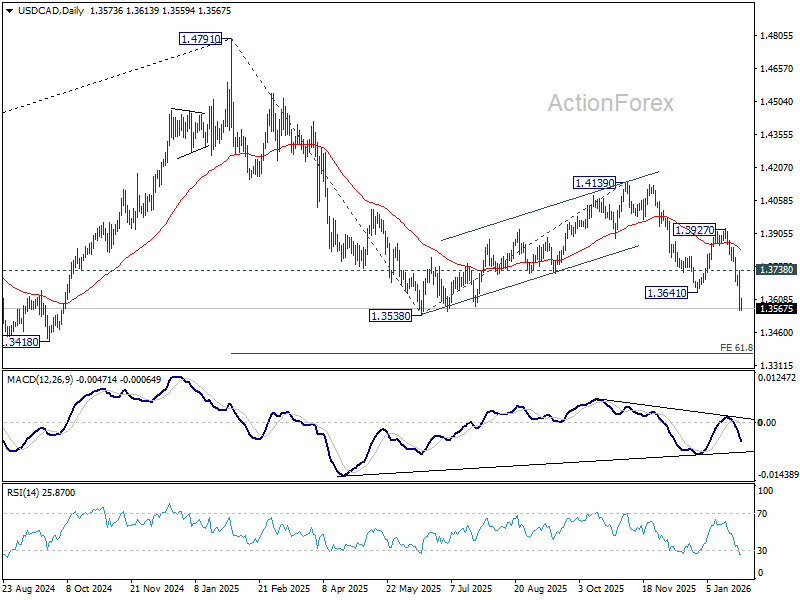
Technically, for USD/CAD, current decline should continue as long as 1.3738 resistance holds. It's seen as part of the downtrend from 14791. Break of 1.3538 will pave the way to 61.8% projection of 1.4791 to 1.3538 from 1.4139 at 1.3365 in the near term.
EUR/USD Daily Outlook
Daily Pivots: (S1) 1.1902; (P) 1.1992; (R1) 1.2134; More….
EUR/USD's rally is still in progress and breached 1.2 psychological level before retreating slightly. Intraday bias stays on the upside. Decisive break above 1.2 will carry larger bullish implications. Next near term target will be 38.2% projection of 1.0176 to 1.1917 from 1.1576 at 1.3434. On the downside, below 1.1906 minor support will turn intraday bias neutral first. But outlook will stay bullish as long as 1.1576 support holds, even in case of deep pullback.
In the bigger picture, as long as 55 W EMA (now at 1.1443) holds, up trend from 0.9534 (2022 low) is still in favor to continue. Decisive break of 1.2 key psychological level will add to the case of long term bullish trend reversal. Next medium term target will be 138.2% projection of 0.9534 to 1.1274 from 1.0176 at 1.2581. However, sustained trading below 55 W EMA will argue that rise from 0.9534 has completed as a three wave corrective bounce, and keep long term outlook bearish.
Fed and BoC holds unlikely to alter USD/CAD downtrend
Two major central bank decisions from North America headline the day, with both the BoC and the Fed widely expected to keep interest rates unchanged. USD/CAD, meanwhile, is unlikely to see its broader trend altered by either decision. The current selloff would likely continue through 1.3538 low as driven by the overall selloff in Dollar.
For the BoC, markets expect rates to remain at 2.25%, the lower bound of the bank’s estimated 2.25–3.25% neutral range. A recent Reuters poll showed nearly 75% of economists expect the BoC to keep policy unchanged through 2026.
At this stage, the BoC appears comfortable with a prolonged wait-and-see stance. However, slack remains in the labour market, growth momentum is uncertain, and policy is not yet clearly stimulative despite the 275bp of rate cuts delivered between June 2024 and October 2025.
Hence, if policy does move again this year, risks are tilted toward further cuts rather than hikes. That bias hinges heavily on trade outcomes. As long as key sectors retain preferential access to the US—either through deals or prolonged negotiations—the growth outlook remains intact.
However, should tariffs expand to a broader range of industries, the drag on activity would intensify. In that scenario, the BoC would likely be forced to resume easing to cushion the economic impact.
Turning to the Fed, rates are expected to remain unchanged at 3.50–3.75%, making this very much a holding meeting. Markets will be listening closely for any shift in tone that hints at future action rather than focusing on the decision itself.
Voting dynamics will be watched carefully. Stephen Miran, a known dove, is expected to dissent in favor of a cut. Any additional votes for easing beyond Miran would be interpreted as a clear dovish signal.
For now, the Fed is expected to remain on hold through the remainder of Jerome Powell’s term in May. Markets price roughly a 63% chance of a June cut, but conviction remains limited given multiple wild cards, including economic data, trade relations, financial market stability, and President Donald Trump’s choice of the next Fed chair.
Technically, for USD/CAD, current decline should continue as long as 1.3738 resistance holds. It's seen as part of the downtrend from 14791. Break of 1.3538 will pave the way to 61.8% projection of 1.4791 to 1.3538 from 1.4139 at 1.3365 in the near term.
AUD/USD surges past 0.70 as RBA hike solidify, 0.72 the test for long term strength
Australian Dollar extended its rally this week, with AUD/USD breaking above 0.70 psychological level. The move has been supported by broad-based Dollar weakness, but domestic factors have played a central role following Australia’s stronger-than-expected inflation data.
December CPI showed another month of acceleration, while Q4 headline inflation printed at 3.6%. More importantly for policymakers, trimmed mean CPI at 3.4% underscored persistent underlying inflation that sits uncomfortably above the RBA’s target band. That inflation shock has quickly filtered into economist forecasts. Westpac and ANZ revised their outlooks, now expecting the RBA to raise the cash rate at its upcoming meeting next week. All four major Australian banks now forecast a 25bp hike back to 3.85%.
The key uncertainty now lies beyond the initial move. The question is whether the RBA would signal scope for a more extended tightening cycle, or frame the hike as a one-off adjustment designed to reassert inflation control.
Technically, AUD/USD remains in clear upward acceleration, with D MACD still pointing higher. The advance from 0.5913 is on track toward its 100% projection of 0.5913 to 0.6706 from 0.6420 at 0.7213 next. On the downside, below 0.6901 support will bring consolidations first. But downside should be contained above 0.6706 resistance turned support to bring another rally.
More importantly, the decisive break above 0.6941 structural resistance this week strengthens the case that the rise from 0.5913 is reversing the entire decline from the 0.8006 (2020 high). Next target is 61.8% retracement of 0.8006 to 0.5913 at 0.7206, which is close to the above 0.7213 projection level.
Reactions to this 0.72 resistance zone will decide whether current rise from 0.5913 is the third leg of the pattern from 0.5506 (2020 low), and open the door to further medium up trend through 0.8006.
Australia CPI surges to 3.6% in Q4, 3.8% in December
Australia’s Q4 CPI showed little relief for RBA where it matters most for policy. Headline inflation rose 0.6% qoq, slightly below expectations of 0.7% and slowing sharply from the prior quarter’s 1.3% gain. However, on an annual basis, CPI accelerated from 3.2% yoy to 3.6% yoy, matching forecasts and keeping inflation well above the RBA’s target band.
The more important signal came from underlying inflation. Trimmed mean CPI rose 0.9% qoq, easing marginally from 1.0% previously but beating expectations of 0.8%. Annual trimmed mean inflation climbed from 3.0% yoy to 3.4% yoy, above the expected 3.2%, reinforcing concerns that price pressures remain persistent.
December’s monthly details added to that unease. Headline CPI jumped 1.0% mom, lifting the annual rate from 3.5% yoy to 3.8%, both above expectations. Trimmed mean CPI rose a more modest 0.2% mom, but annual core inflation still edged up from 3.2% yoy to 3.3% yoy.
Price pressures remain broad in December. Goods inflation accelerated from 3.2% yoy to 3.4%, driven largely by a 21.5% surge in electricity prices. Services inflation climbed from 3.6% yoy to 4.1%, led by domestic travel and accommodation and rising rents.
Markets are now firming up their expectation that RBA will return to rate hike in February.
RBA to Hike in February on Second Uncomfortably High Quarterly Inflation Read
December quarter inflation had the casting vote and voted ‘Yes, hike’. RBA to raise cash rate at February meeting to 3.85%. Further rate hikes possible but ‘one-and-done’ as a base case.
- When the economy is close to full employment and full capacity utilisation, it is hard to know which side of the line it is on. Inflation outcomes are the best guide in this situation. This is one reason why inflation gets the ‘casting vote’ at the RBA’s February meeting. With trimmed mean as the clearest signal of the underlying inflation trend, its 0.9%qtr, 3.4%yr quarterly result in the December quarter implies that the RBA is likely to raise rates at the February meeting.
- Looking beyond the next meeting, Australia’s inflation outlook got murkier in recent weeks. A higher starting point is implied by the September and December quarter data, a stronger labour market and a clear upswing in consumer spending. Further out, though, higher market pricing for interest rates and a noticeably higher exchange rate should dampen the forecast trajectory relative to the November SMP round. The RBA’s judgement on how these factors balance out will be key to the rates outlook beyond the next meeting.
- A cash rate increase next week might not necessarily be followed up with a sequence of moves. Nobody doubted that a cash rate in the 4s last year was restrictive, and the amount of disinflation required from here is not large. Expect a ‘wait-and-see’ stance, with a clear willingness to follow up to be communicated following the meeting.
As we highlighted last week, it really shouldn’t be that the RBA decision comes down to one number. With the other data finely balanced, though, the quarterly inflation print gets the casting vote. Today’s data voted for a rate hike. This means that we now expect that the RBA to react by raising the cash rate at its February meeting. September quarter’s high reading could be looked through on the grounds that some of the pick-up was temporary. This was also our view. Two higher-than-desired quarters are harder to look through, however, even allowing for the uncertainties involved in the new CPI collection.
After preparing the ground in recent weeks for a rate hike, we believe the RBA Monetary Policy Board will follow through on these warnings with a 0.25ppt increase in the cash rate to 3.85%.
There is still a small chance they hold, and we expect the Board to debate the merits of holding versus raising the cash rate at the meeting. We are mindful of the messaging via the media that the RBA would hike if trimmed mean inflation remained above its 2–3% target and was drifting further away from the desired midpoint (our emphasis). The run of quarterly data might not quite meet the second part of that test, though there are definitely ways to construe the data to argue that it does. There are also arguments to be cautious given that the new monthly collection has made the inflation data harder to interpret. With market and public expectations already primed, though, the Board is likely to see little reason to wait.
The key quarterly trimmed mean inflation rate (the pre-October method now buried in an appendix, given the current calculation methods are afflicted with seasonality-related uncertainty) printed higher than Westpac expected, at 0.9%qtr, 3.4%yr. This is too high for the RBA’s comfort, even though it is a little lower than the September quarter result. Its November forecast was for quarterly-basis trimmed mean inflation to print at 3.2%yr. Other measures of underlying inflation were likewise too high.
The monthly data was a bit more of a mixed bag. Seasonally adjusted headline inflation was in line with our year-ended view (PDF 901KB) (3.7%yr). Housing-related inflation was more benign than expected in December, with both rent inflation and home-building inflation below our year-ended forecasts. Rent inflation continues to moderate, and the run of monthly data on home-building costs looks like inflation in that category might have peaked.
Some other categories were above our expectations, though, if only a little, and this was enough to push the trimmed mean – both monthly and quarterly – higher than our calculations implied. The result was also clearly above what the RBA would have needed to see to hit their November forecast, as noted above.
Looking beyond the next meeting, Australia’s inflation outlook got murkier in recent weeks. A higher starting point is implied by the September and December quarter data, stronger labour market and clear upswing in consumer spending. Further out, though, higher market pricing for interest rates and a noticeably higher exchange rate should dampen the forecast trajectory relative to the November SMP round, steepening a downward slope in the inflation forecasts.
Whether the RBA actually incorporates this downside is another matter. The RBA has recently been working on the basis that the Australian economy is trapped in the slow lane, hemmed in by slow-growing supply. As we have previously highlighted, this working assumption rests on further assumptions about productivity growth and population growth that are both on the low side of reasonable estimates. Today’s data will only solidify the RBA’s view, and we expect renewed emphasis on this narrative in the next Statement on Monetary Policy.
We do not, however, assume this necessarily means a sequence of back-to-back hikes. An increase in the cash rate next week will put policy in an unambiguously restrictive position, a point on which there has been some debate recently. The peak cash rate is only half a point higher than next week’s expected outcome. And with measures of underlying inflation in the bottom half of the 3s, the amount of disinflation needed to get back to the 2½% target midpoint is relatively modest.
If inflation remains uncomfortably high in coming quarters, the Board will act again. However, further moderation over coming quarterly inflation prints, together with benign reads on the labour market, might see the Board wait for some time before moving the cash rate again. Since this is our current view of the inflation outlook, pending a full review, our base case is for a single hike as the most likely outcome, followed by an extended pause. Depending on the time elapsed and pace of disinflation from here, the next move could be in either direction.
US Administration’s Take on Dollar is a Risky One
Markets
The calm in most major (dollar) pairs since last summer got completely shattered. It started with the Fed subpoenas and the Greenland crisis, which fueled already lingering concerns about the stability and relative worth of US assets including the dollar. Next came the news about a potential coordinated intervention between the US and Japan to prop up the ailing yen. From the US side it signaled tolerance for a weaker dollar. We saw a dramatic two-day USD/JPY slide in response with strong spillovers to all other USD cross rates. There was some stabilization in early dealings yesterday but it was nothing but a false dawn. Then there was president Trump late yesterday. Asked if he was worried about the dollar’s recent decline, Trump said it is fine and that the dollar is doing great. Instead he pointed fingers at Japan and China, who “devalue, devalue, devalue” to be more competitive. Trump’s comments were taken as the go ahead for further dollar weakness. And USDoooown it was. EUR/USD soared from an intraday low around 1.185 to as high as 1.2081 before closing at 1.2041 – a new 4-year high. It prompted the first comments from ECB policymakers. The Austrian Kocher in an interview with the Financial Times warned that the central bank may act if further “significant increases” would lower inflation projections. The trade-weighted index tanked to 95.55 but managed to close above 96 and at the 2025 September low) eventually. Cable (GBP/USD) had its first +1.38 finish in four years as well. Most pairs were driven by the dollar side of the equation and the greenback will remain at the center of attention today. There were a few exceptions though. The CHF for example racked in haven flows, rallying against the dollar but also the euro. EUR/CHF closed at a record low of 0.916, barring the 2015 episode. SEK and NOK completed the top three. Dollar weakness translated in record gold and silver prices too. Stock markets still closed in the green and losses for US Treasuries remained orderly so far with yields rising up to 5.8 bps at the long end. But the US administration’s take on the dollar is a risky one. If markets were to lose confidence in the dollar as beacon of stability, rest assured that the sell-off won’t stay limited to the currency. The near 10 bps rise in the 5y5y US inflation swap (inflation expectations gauge) yesterday to among the highest in seven months serves as a warning sign.
Just like that Trump downgraded the FOMC policy meeting to a secondary event. He didn’t even have to announce his Fed chair pick shortly before the kickoff to steal the central bank’s thunder. We still see risks of that happening though. In all fairness, the rates status quo expected for today has been long in the making and we don’t expect chair Powell to reveal much of the veil for the future. He probably won’t have to, with the Q&A in the presser probably centering around everything but monetary policy: expect questions about Trump’s comments on the dollar, the Fed subpoenas and his video response to it & his attendance in governor Cook’s hearing during governor Cook’s hearing.
News and views
Quarterly Australian inflation data showed price pressure slowing from 1.3% Q/Q in Q3 to 0.6% Q/Q in the final quarter of the year, matching expectations. The central bank’s preferred trimmed mean gauge stayed sticky at 0.9% Q/Q (from 1%) with the annual pace accelerating to 3.4% from 3% in Q3 and returning above the Reserve Bank of Australia’s 2-3% inflation target. On a monthly basis, inflation accelerated with a 1% increase resulting in a Y/Y-acceleration from 3.4% to 3.8% (vs 3.6% expected). The largest contributor to annual inflation was housing, up 5.5%. Annual goods inflation moved from 3.3% Y/Y to 3.4% Y/Y while services inflation accelerated from 3.6% Y/Y to 4.1% Y/Y. Australian money markets add to bets 68% probability that the RBA could switch to rate hikes as soon as at the next, February 3, policy meeting. The Aussie dollar surpassed AUD/USD 0.70 for the first time since February 2023. A commodity rally, rate hike bets and an overall weak USD, propelled the pair from levels below 0.67 only a week ago.
MSCI has concluded its consultation on free float assessment of Indonesian securities. Investors highlighted that fundamental investability issues persist due to ongoing opacity in shareholding structures and concerns about possible coordinated trading behaviour that undermines proper price formation. In light of the foregoing concerns, MSCI will apply an interim freeze on certain index related changes for Indonesian securities. If insufficient progress is made towards achieving necessary transparency enhancements by May 2026, MSCI will reassess Indonesia's market accessibility status. This could result in a weighting reduction in MSCI Emerging Markets Indexes for all Indonesian securities or a potential reclassification of Indonesia from Emerging Market to Frontier Market status. The Jakarta Composite Index in currently 8% lower, triggering a market halt.
The Only Real Comfort is that US Inflation Has Not Surged as a Result of Tariffs
There were plenty of major stories and market moves yesterday, but the most significant — and most impactful — was undoubtedly the sharp sell-off in the US dollar. It pushed the US Dollar Index to a four-year low and continues to drive gold and silver to fresh record highs this morning.
Trade and geopolitical uncertainty, tied to an increasingly unreliable American friend and ally, as well as growing concerns about what will happen to the Federal Reserve’s (Fed) credibility once Jerome Powell leaves office (it will fly out of the window), continue to weigh on the US dollar. Add to that the latest US consumer survey, which showed a sharp drop in consumer confidence, a marked deterioration in how households view the current situation, a decline in the share of consumers expecting income growth, and a steady rise in those saying jobs are hard to get. You get a pretty murky picture for the greenback and the two-speed US economy.
Still, this will hardly convince the Fed to cut rates today or in the coming months. Jerome Powell is likely to avoid political commentary at his post-decision speech today and keep the focus firmly on economic data to justify policy decisions.
That said, we all know the US President is waiting just outside the room — and anything he might say about the Fed’s decision, or about how much he dislikes Powell, would only risk making matters worse for the US dollar, much to the delight of gold and silver longs. But with or without buzzy headlines, the US dollar looks condemned to weaken.
The only real comfort is that US inflation has not surged as a result of tariffs. That is partly because importers built up stockpiles to buy time, but also because only around 20% of announced tariff threats have actually been implemented since November 2024, according to Bloomberg. In other words, only a fifth of tariff threats have materialised so far — giving the so-called TACO trade (“Trump Always Chickens Out”) some concrete data backing today.
This may help explain why Korean equities barely reacted when President Trump threatened to impose 25% tariffs on Korea, citing the lack of formal codification of last year’s trade deal. That agreement includes up to $350bn of Korean investment commitments in the US — a massive sum, especially with the won under pressure. South Korea has already signalled it may delay up to $20bn of planned US investment this year. Fury.
Political tensions aside, the Kospi hit fresh highs today, with SK Hynix continuing its “Free Solo” climb after reports it has become the exclusive supplier of memory chips for Microsoft’s new AI chip!
Elsewhere, after a year of trade tensions, former US allies appear increasingly keen to diversify. Last week, Canada signed a trade arrangement with China, easing rules on several sensitive areas, including Chinese EV exports. This week, Europe finalised a trade deal with Mercosur and another with India after two+ decades of negotiations. Funny how a common adversary can accelerate diplomacy!
Ursula von der Leyen dubbed the India agreement “the mother of all deals”. It eliminates more than 95% of tariffs on both sides and covers cars, industrial goods, wine, pasta, chocolate and other European exports for India’s 1.5bn consumers to enjoy without tariffs.
The mood among European investors would have been even better had LVMH not reported weaker sales on the same day. Still, the Stoxx 600 closed close to record highs, led once again by defence stocks, as Europe continues to ramp up spending on security and technology amid an increasingly strained relationship with the US.
Europe has strong players in defence. In tech, the challenge is far greater and will take years to address. That said, there are signs of progress: this week, the EU switched on parts of its home-grown secure satellite communications network, designed to reduce reliance on Starlink for sensitive uses. These efforts are likely to intensify as geopolitical risks grow, justifying investment in European defence and tech.
Speaking of tech, ASML — Europe’s largest technology company and the world’s sole supplier of the most advanced chip-making machines — reported earnings this morning. Results showed a modest beat on revenue and profit, and a significant upside surprise on bookings. Order intake reached around €13.2bn, roughly double expectations, underlining strong forward demand, particularly for EUV systems.
European futures are higher, while Nasdaq futures are leading gains among major indices, with ASML’s results boosting sentiment ahead of a busy US earnings calendar. Meta, Microsoft and Tesla report after the bell. For Microsoft, focus will be on Azure growth, AI-related product revenues and data-centre spending plans. For Meta, attention will centre on costs and monetisation of AI initiatives. I personally remain little convinced with Meta’s shift from social media to AI media, but hey... For Tesla, the spotlight is happily less on plunging car sales and more on dream... The pace of robotaxi expansion and the timeline for Optimus will matter more than actual numbers— though Elon Musk has already warned that production will be slow. Market reaction may once again hinge more on a single man's persuasion than on reality.
Weak USD and Fed Rate Pause Take Centre Stage
In focus today
The main event will be tonight's FOMC meeting. We expect no monetary policy changes, in line with broad consensus and market pricing. As the Fed will not be releasing updated economic projections, attention will centre on Powell's assessment of recent economic data, and the likelihood of further rate cuts this spring. We expect Powell to avoid any specific speculation regarding future Fed nominations and recent challenges to the central bank's independence. Read more in: Fed preview - Temporary pause on rate cuts, 23 January.
The Bank of Canada also meet today, and we expect the central bank to maintain its policy rate at 2.25%.
Economic and market news
What happened yesterday
In the US, the consumer confidence index for January unexpectedly fell to 84.5 (cons: 90.9, prior: 94.2), diverging sharply from the University of Michigan's survey, which had painted a more optimistic picture. The decline was most pronounced in the 'present situation' assessment, with labour market indicators showing weakness. The widely followed 'jobs plentiful' index dropped to its lowest level since February 2021, a time when the unemployment rate stood at 6.2%. This appears more tied to real economic conditions than tariff concerns, as inflation expectations eased. These sentiment indicators have sent somewhat conflicting signals lately, but all else equal, this could fuel some further USD weakness.
The EU and India have concluded a landmark trade agreement that will remove tariffs on over 90% of goods traded between the two economies. Under the deal, India will lower tariffs on European automobiles and agricultural products, while the EU will reciprocate by easing duties on India's labour-intensive exports, which have suffered significantly due to the 50% tariffs imposed by the US. Currently ranked as the EU's ninth-largest trading partner, India accounted for 2.4% of the bloc's total goods trade in 2024. The EU anticipates that the agreement will double its exports to India by 2032, fostering stronger economic ties.
In Hungary, the central bank kept policy rate unchanged at 6.50%, in line with market expectations.
Equities: Equities generally higher, with the same dynamics observed over the last three trading sessions: US tech and related utilities orchestrated a comeback, while small caps underperformed for a third session. Semis were particularly strong, likely speculation of hiked AI capex plans from the hyperscalers. Microsoft is important, reporting today after US closing.
European and Nordic equities also somewhat higher, but below the highs taken prior to the tariff threats. The rapid dollar decline probably plays a role behind the sluggish rebound, as the FX headwind hits earnings. Be aware that earnings revisions will be negative for most Nordic companies after post results, solemnly due to FX, although demand assumption is held constant, or even lifted. Another reason is that there were no contrarian dip to buy in the first place. Despite last week's selloff we did not observe any genuine market stress and positioning were far from oversold. Investors are buying equities, but anchored in fundamental economic strength, which is a slower process higher than a dip buying opportunity.
FI and FX: Broad USD remains under heavy pressure as the prospect of joint FX intervention between the US and Japan added further momentum to the recent USD sell-off. EUR/USD finds itself flirting with the 1.20 mark, whereas EUR/CHF broke below the 0.92 mark, as the CHF has benefitted from the increased uncertainty and as an alternative to the USD. Scandies continue to do well, just as anything with a reverse correlation to USD, and EUR/SEK and EUR/NOK both saw Monday's bounce completely reversed yesterday, with the latter once again breaking below 10.60.