Sample Category Title
AUD/USD Pair Started a Downside Correction Below 0.6800
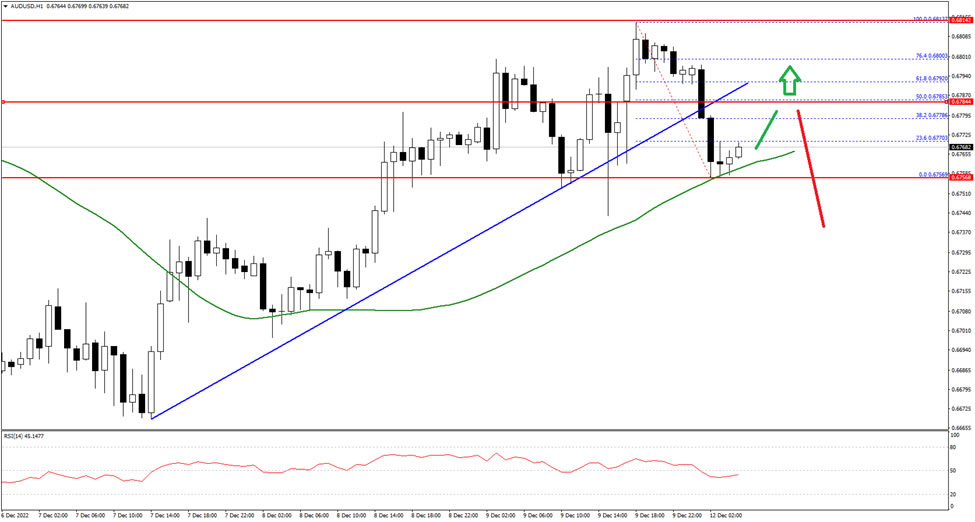
The Aussie Dollar failed to clear the 0.6820 resistance against the US Dollar. The AUD/USD pair started a downside correction below the 0.6800 and 0.6780 support levels.
There was a move below a key bullish trend line with support at 0.6780 on the hourly chart. The pair is now consolidating above the 0.6755 support and the 50 hourly simple moving average. An immediate resistance on the upside is near the 0.6785 level.
If there is an upside break above the 0.6785 zone, the pair could rise steadily towards the 0.6820 level in the near term. The main resistance now sits near 0.6850 on FXOpen.
An immediate support is near the 0.6760 level. The next key support is near the 0.6750 level. A downside break below the 0.6750 support could lead the pair towards the 0.6710 support.
NIESR: UK GDP to remain flat in Q4
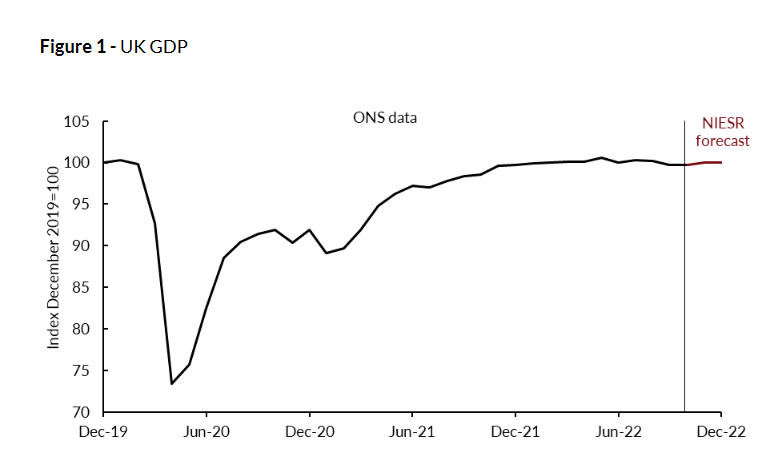
NIESR said the 0.5% mom growth in UK GDP in October "largely reflects the weakness in September" resulting from additional Bank Holiday for the State Funeral of HM Queen Elizabeth II. The risks of GDP contraction in Q4 "remains elevated". It expects GDP to remain flat in Q4.
Paula Bejarano Carbo Associate Economist, NIESR said:
"Monthly GDP grew by 0.5 per cent in October, in line with our forecast last month, driven by a strong pick-up in wholesale and retail trade, and repair of motor vehicles and motorcycles, which seem to have been strongly affected by the additional September bank holiday.
"Despite this positive outlook from the monthly growth figure, there are still strong downside risks to GDP in the fourth quarter of this year due to high inflation and interest rates –which continue to suppress demand –and supply chain disruptions, as well as work backlogs due to industrial action and a tight labour market –which continue to weigh on business growth. We still expect GDP to remain flat in the fourth quarter of this year."
BTCUSD Crawls Above 17,000; Bullish Action Limited
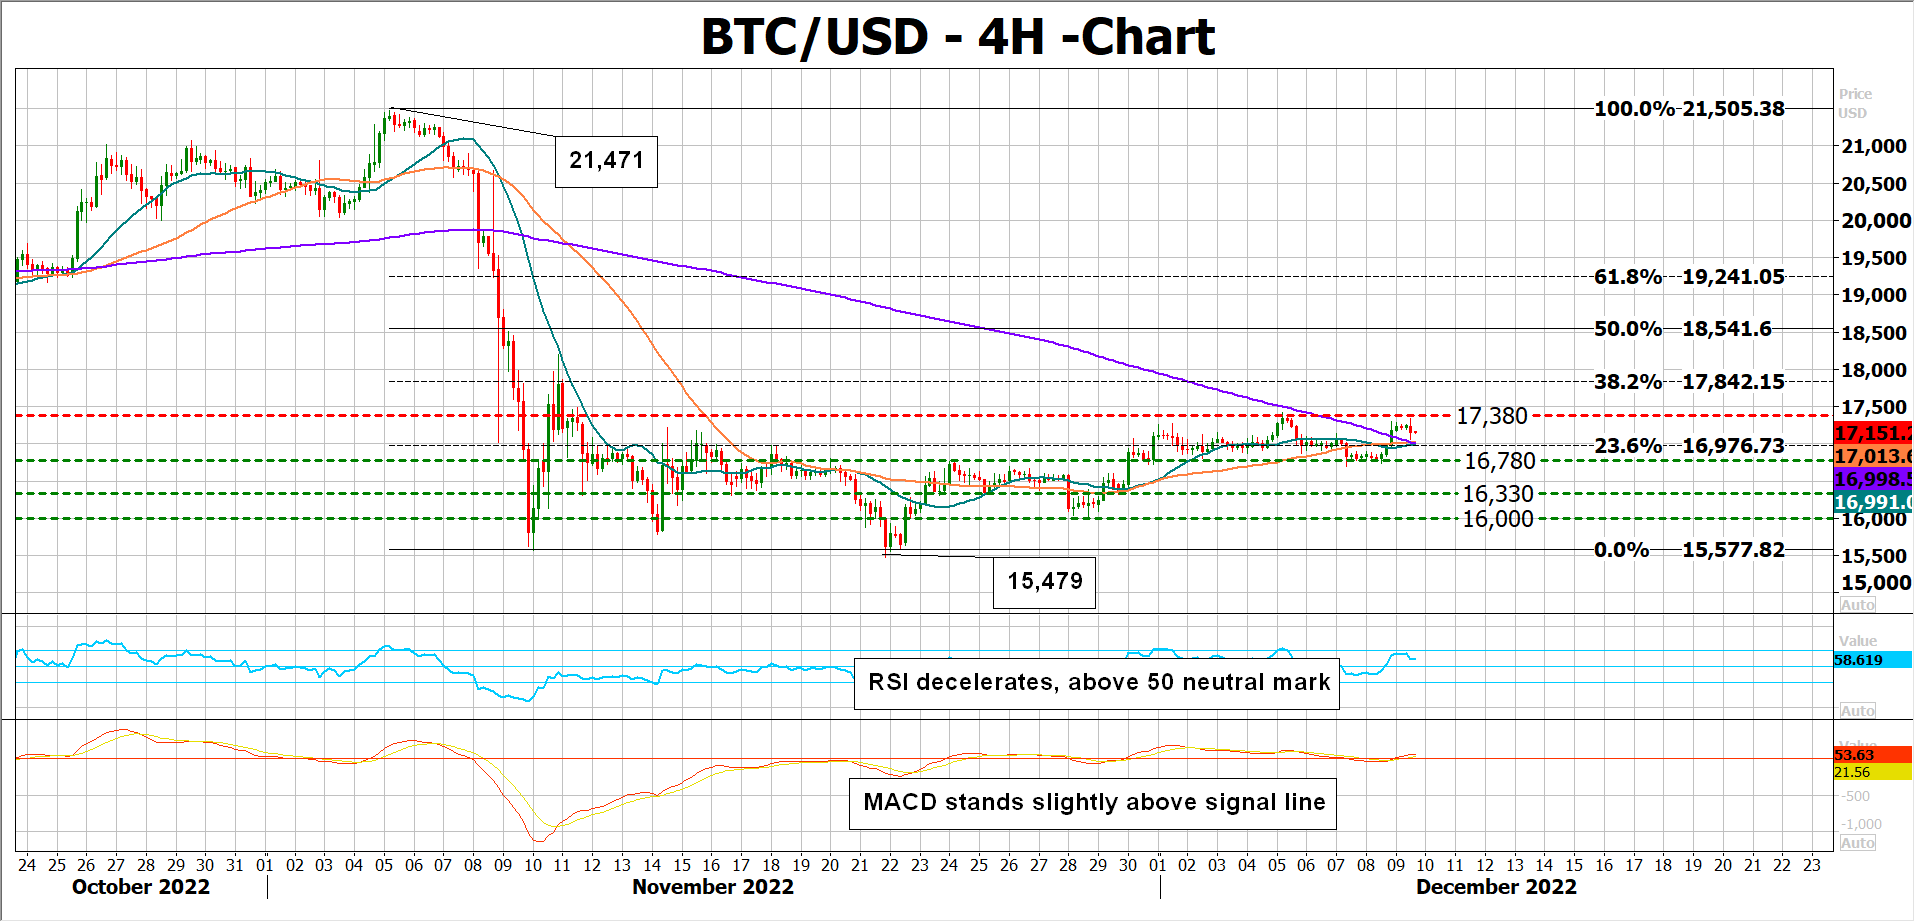
BTCUSD (Bitcoin) pierced through its simple moving averages (SMAs) for the first time since the start of November to crawl back above the 17,000 round level.
While the weekly resistance of 17,380 seems to be a hurdle at the moment, and some weakness is evident in the RSI and the MACD, the indicators keep hanging within the bullish area, promoting a continuation higher. If that proves to be the case, the spotlight will shift towards the 38.2% Fibonacci retracement of November’s fall, seen at 17,842. Additional gains may flirt with the 50% and 61.8% Fibonacci levels at 18,540 and 19,240 respectively. Yet, whether the bulls have enough fuel to trim the collapse from 21,470 remains to be seen.
Should the bears retake control, squeezing the price beneath the 17,000–16,780 support region, some congestion could initially develop somewhere between 16,330 and 16,000 before the door opens again for the 15,749 low.
In short, BTCUSD is facing renewed downside pressures around 17,380. A successful close higher would strengthen the bull case.
Pound Shrugs as GDP Beats Forecast
It promises to be a very busy week in the UK, with a host of key events on the calendar. Monday started on a positive note, as GDP for October climbed 0.5%, up from -0.6% in September and ahead of the 0.4% consensus. Investors will have plenty of data to digest, including employment, inflation, retail sales and the Bank of England rate decision. It should be a busy week for the pound as well.
The UK economy is likely in recession, and the markets are bracing for a winter of discontent on the public sector front. Many workers, faced with the ever-increasing cost-of-living, could go on strike in order to demand higher wages. This could trigger a cost-wage spiral, which would be a massive headache for the BoE as it would exacerbate inflationary pressures. With inflation already at a staggering 11.1%, the BoE has little choice but to continue raising rates, and the markets have priced in 50 basis points at the final meeting of the year on Thursday. The cash rate which is currently at 3.0%, is expected to continue to rise in 2023, with forecasts ranging from 3.50% to 4.75%.
The Federal Reserve will also be in the spotlight this week, with the final rate meeting on Wednesday. The Fed is on its way to a record year for tightening, with 375 bp in rate hikes already this year. Even with a torrid pace of rate hikes, the markets have been reluctant to internalize the Fed’s hawkish message, and softer-than-expected inflation reports have renewed risk appetite and hopes of a dovish Fed pivot. The Fed recently trotted out a stream of FOMC members to drum up the message that inflation remained unacceptably high and that the Fed expects to raise rates higher than anticipated. The Fed doesn’t want to see financial conditions loosening before inflation is defeated, which makes it critical that the markets buy into the Fed’s hawkish stance.
GBP/USD Technical
- 1.2240 and 1.2136 are the next support levels
- There is resistance at 1.2374 and 1.2478
USD/JPY: 131.35 Likely to Complete Double Zigzag Pattern
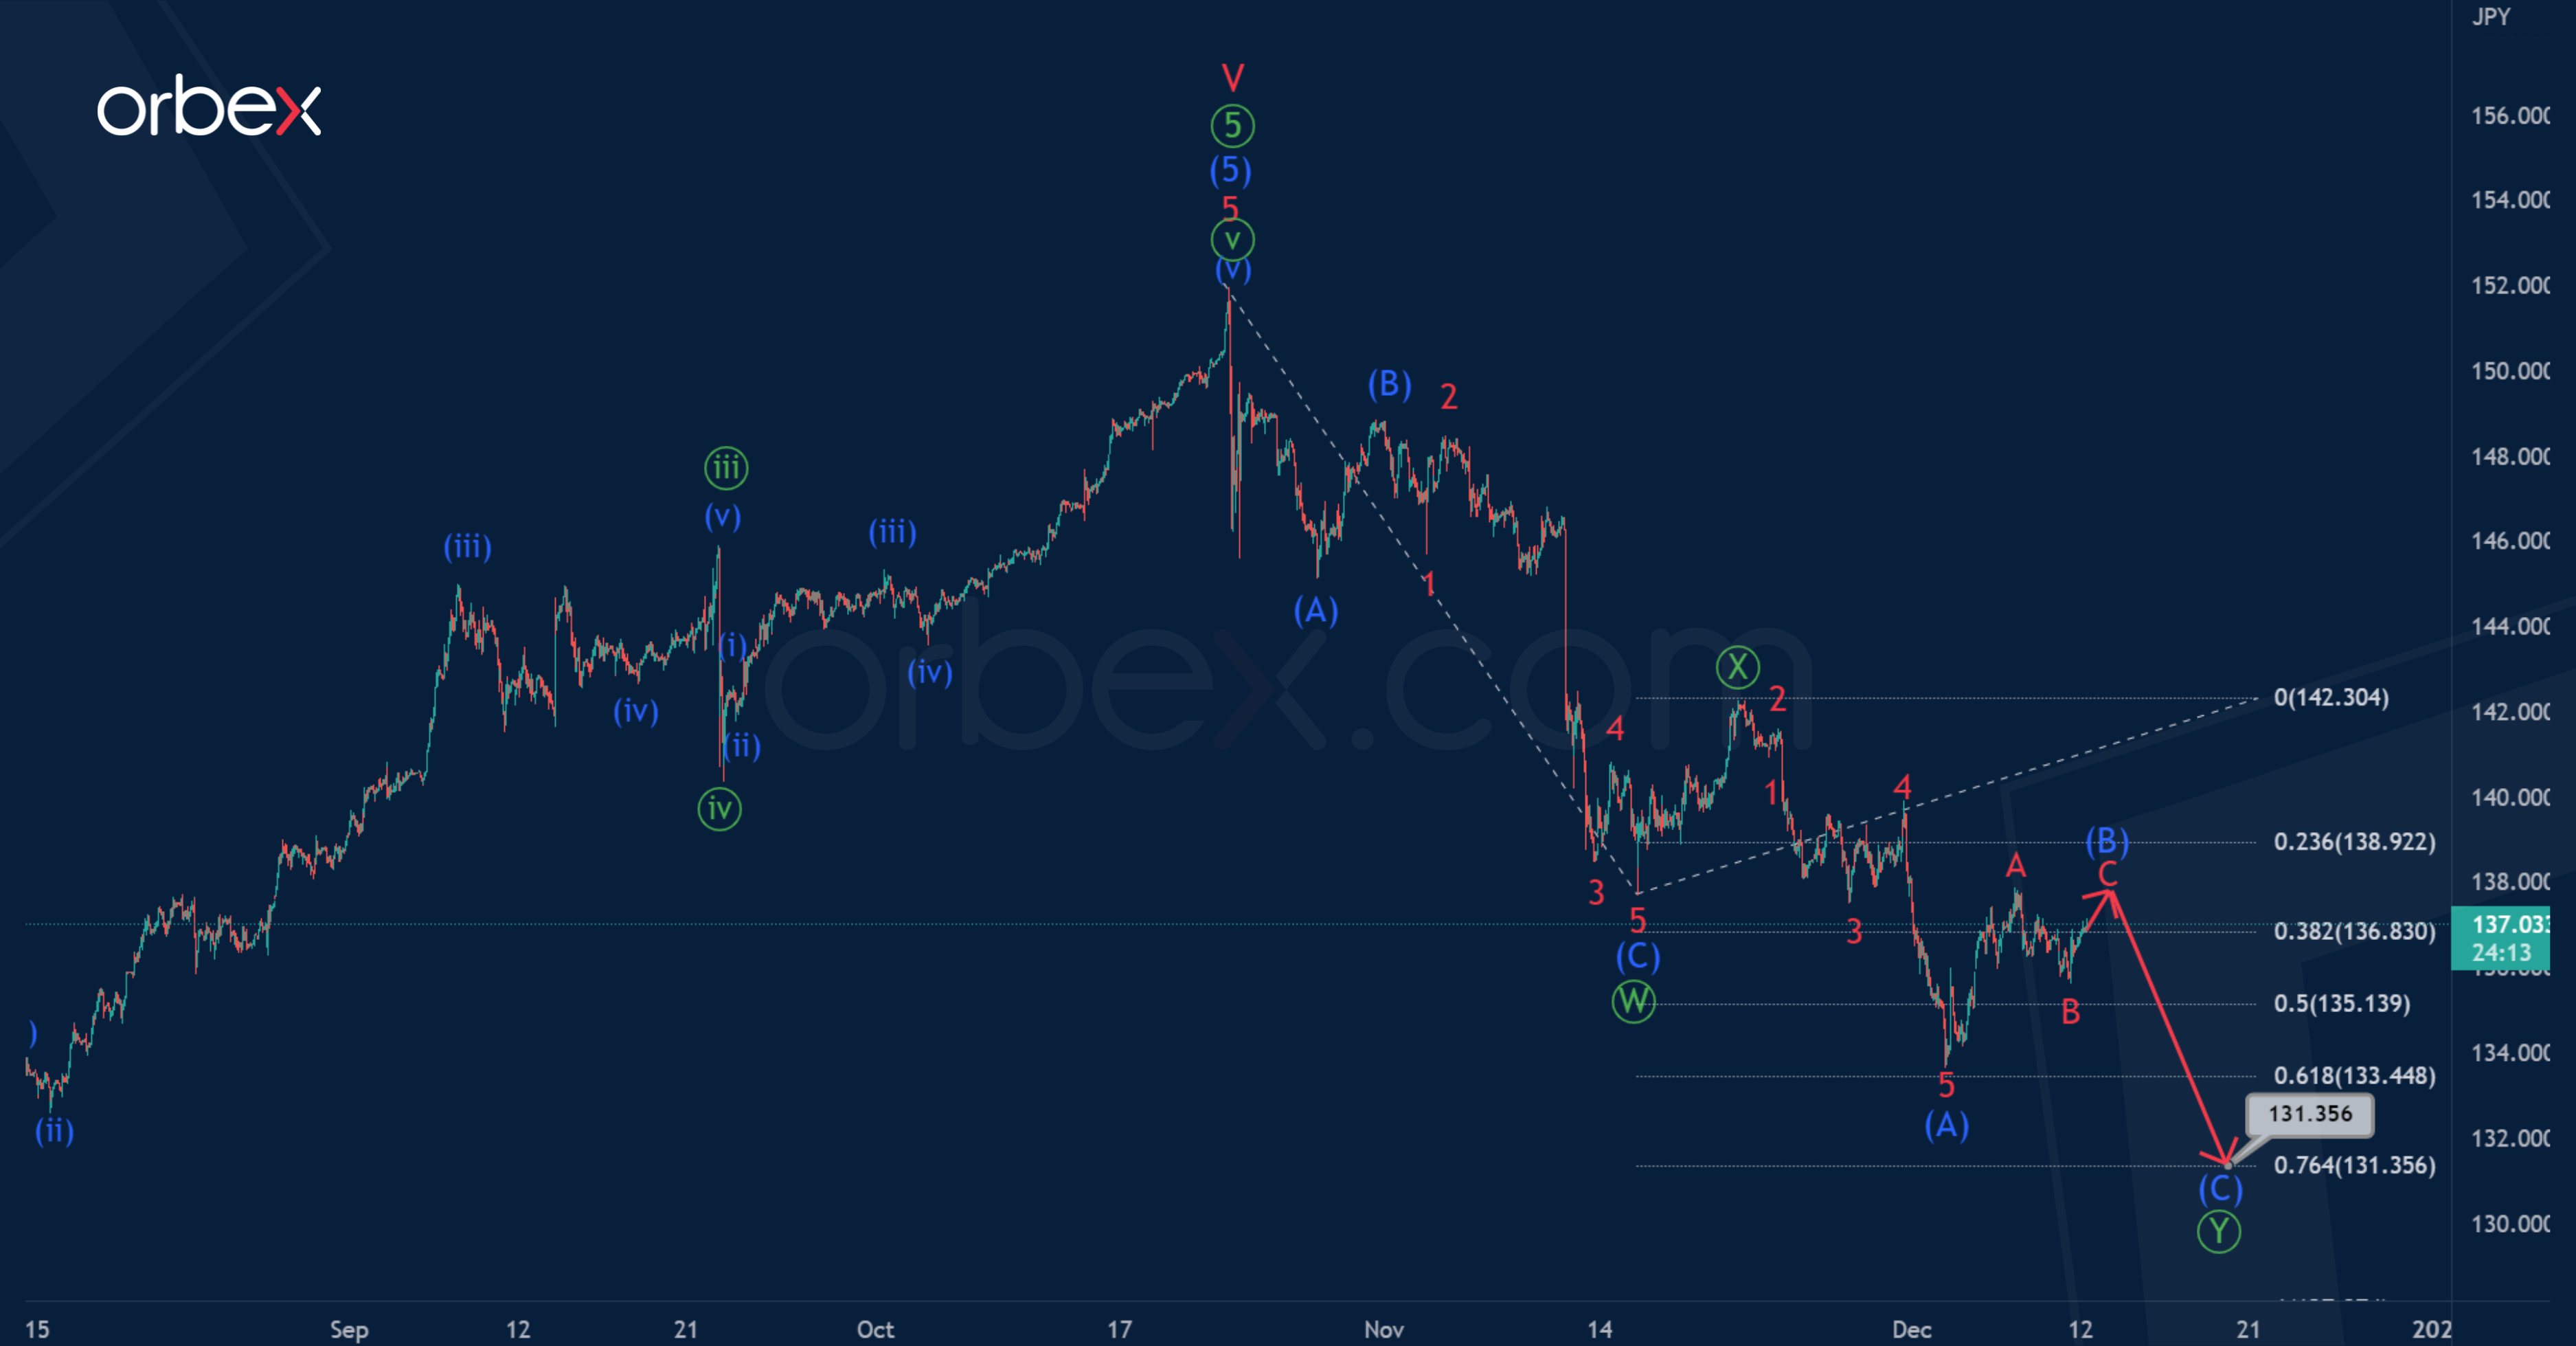
The 1H timeframe of the USDJPY pair shows that the formation of a global cycle impulse could have ended not so long ago. Then the fall of the exchange rate and the formation of a new bearish trend began.
It is assumed that a bearish double zigzag of the primary degree may form in the market. It is possible that the actionary wave and the intervening wave have been completed to date.
Thus, in the near future we can expect the development of the final actionary wave, which can take a standard zigzag structure (A)-(B)-(C) and end near 131.35. At that level, wave will be at 76.4% of wave.
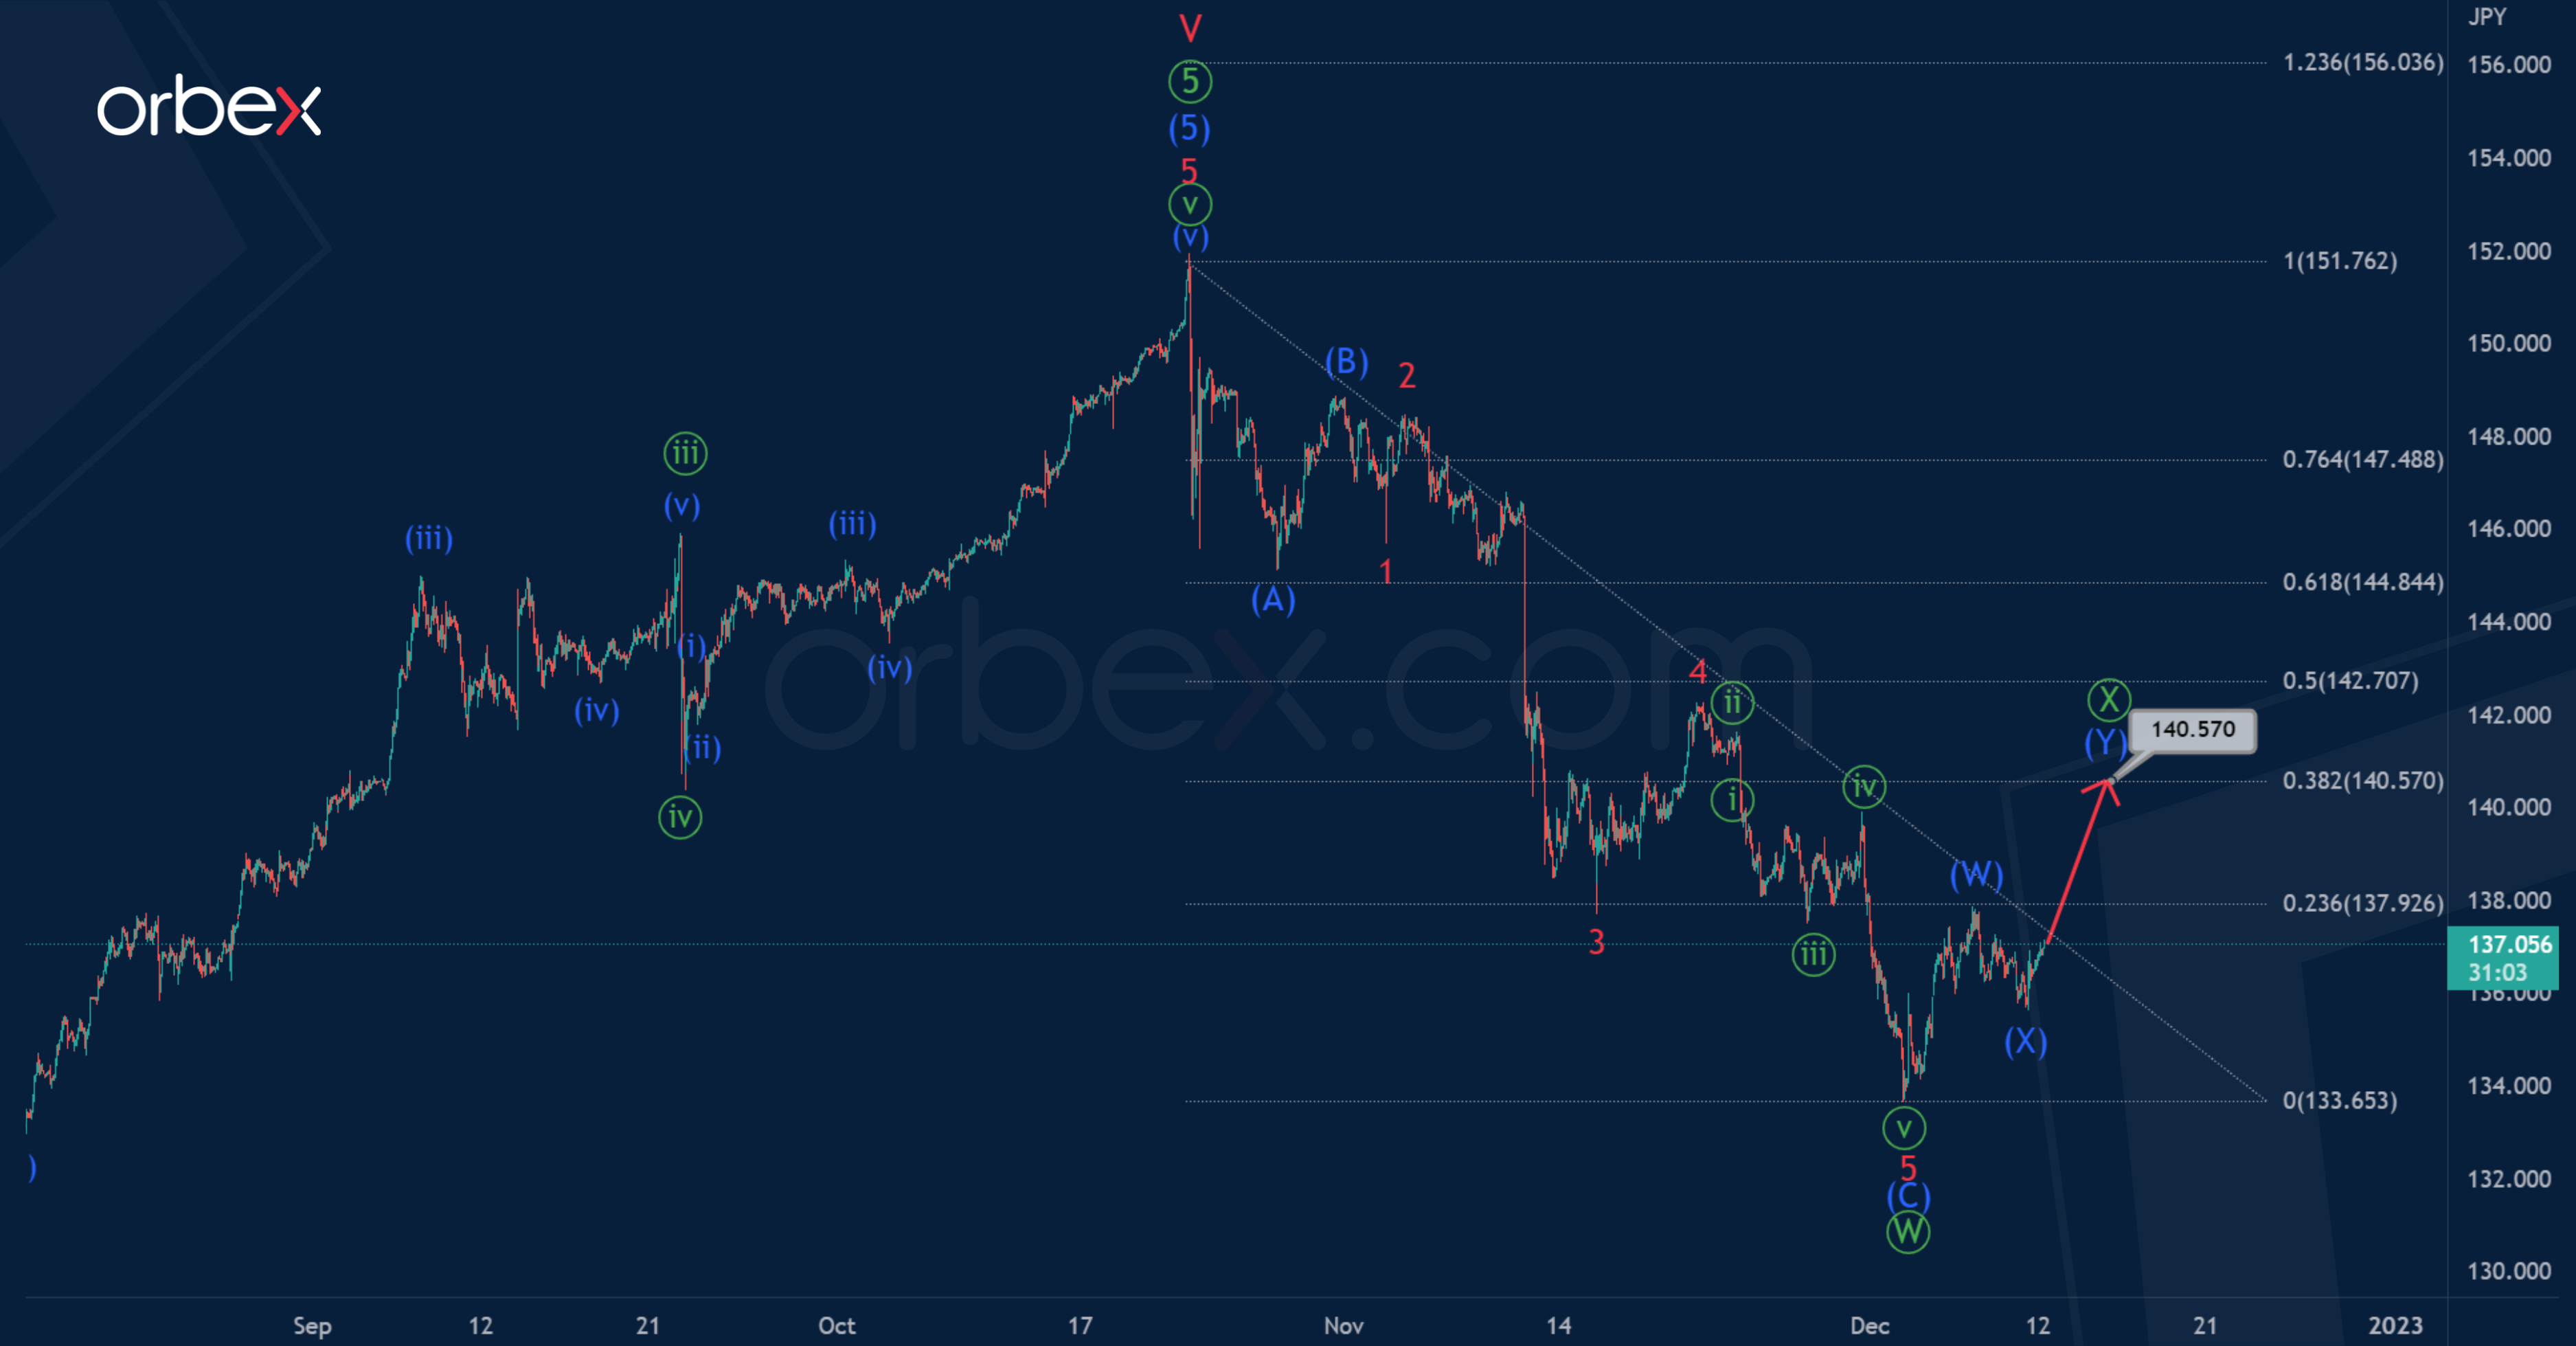
Alternatively, it is assumed that in the bearish double zigzag, only the first actionary wave is completed, and the intervening wave is still under development.
Perhaps the wave will have the form of a double zigzag (W)-(X)-(Y), as shown in the chart. In the near future, the price growth may continue in the sub-wave (Y) at 140.57.
At that level, wave will be at 38.2% along the Fibonacci lines of wave.
More Weakness on USD/JPY after Corrective Rally
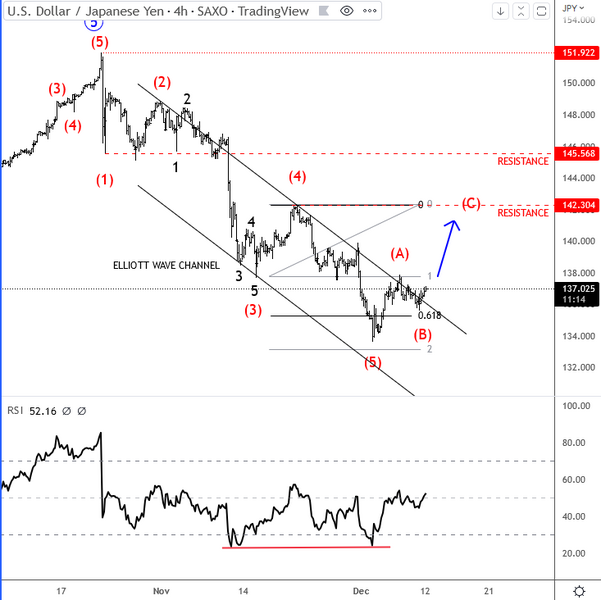
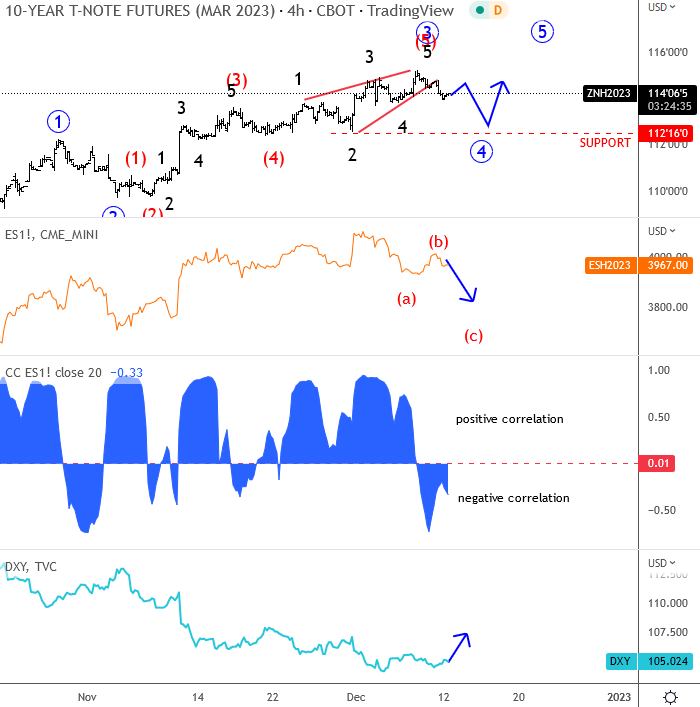
We have a busy week ahead, with plenty of important data for the interest rates policy in US, UK and EU. We have US CPI already tomorrow, which will be interesting data as speculators will put their bets on FOMC decision which is schedule a day later. From an Elliott wave perspective, I still focus on the 10 year US notes, where I see price coming back into a wave four, so short-term weakness on bonds can support USD while stocks can drop lower. However, that's only for the short-term correction, the mid-term trend is still down for the USD which is clearly defined on USDJPY after five wave drop from 151.92. I will again turn bearish on USD across the board after USDJPY completes corrective rise. Nice resistance is at 140-142.30.
EURUSD Consolidates After Advance Pauses
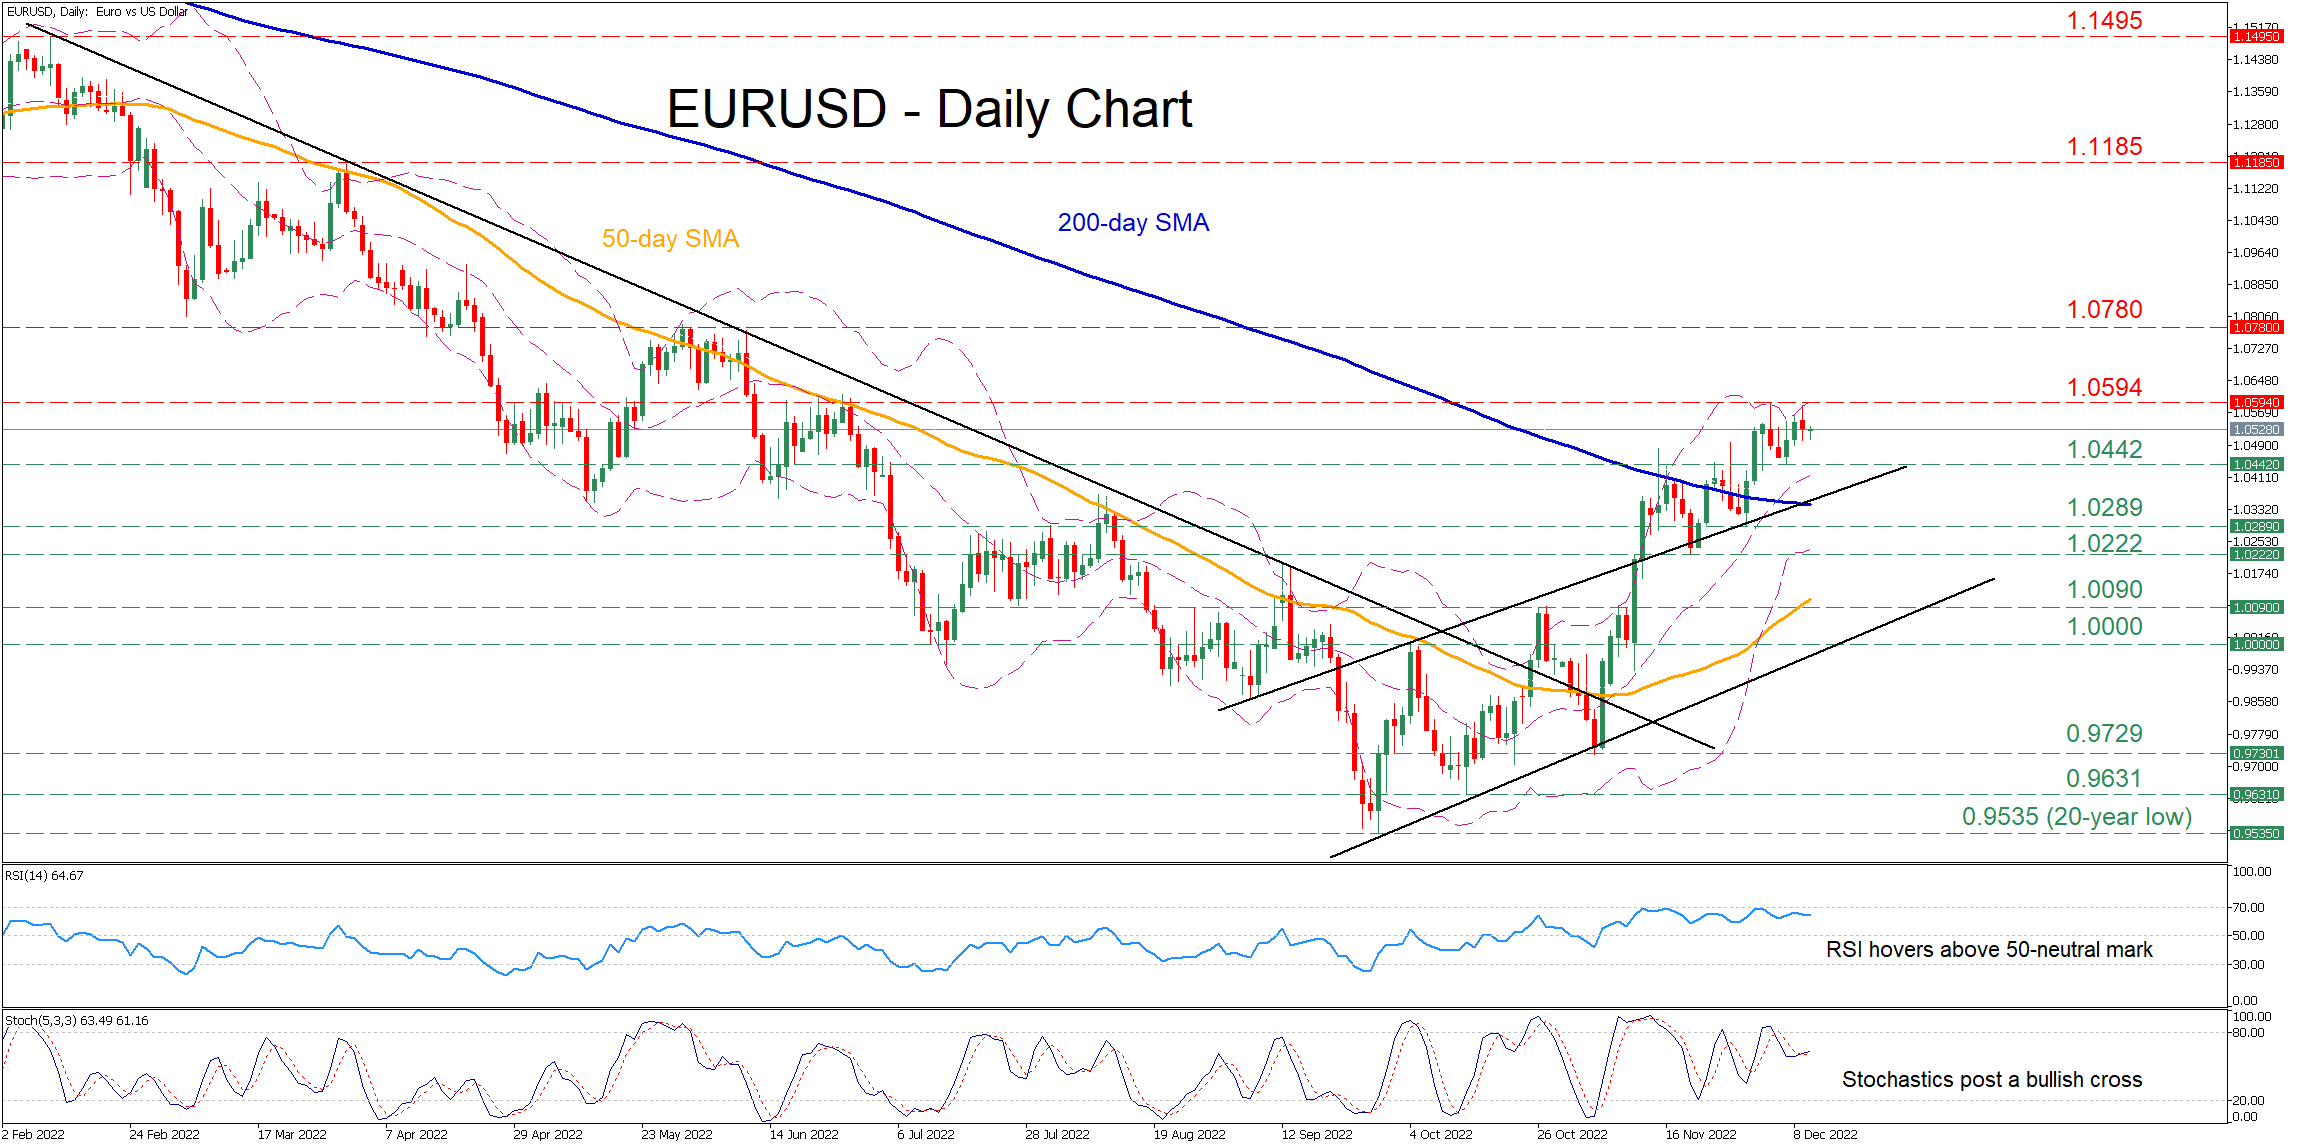
EURUSD has been edging higher since early October after its long-term downtrend paused at the 20-year low of 0.9535. However, the pair has been stuck in a sideways pattern in the last few daily sessions after its advance failed to surpass the 1.0594 barrier.
The momentum indicators currently suggest that bullish forces are in control. Specifically, the RSI is hovering above its 50-neutral mark, while the stochastic oscillator has posted a bullish cross.
To the upside, if buyers re-emerge and push the price higher, initial resistance might be encountered at the recent high of 1.0594. Conquering this barricade, the bulls could then aim at the May peak of 1.0780. Even higher, the March resistance of 1.1185 might curb any further advances.
On the flipside, bearish actions could send the price to test the 1.0442 support region. Should that floor collapse, the spotlight could turn to 1.0289 before the November support of 1.0222 comes under examination. Failing to halt there, the pair could descend towards the 1.0090 resistance zone, which could now act as support.
In brief, EURUSD appears to have altered its short-term picture back to positive after jumping above its 200-day simple moving average (SMA). Hence, a break above the 1.0594 ceiling could signal the resumption of its rebound.
Gold Bulls Look Exhausted Near 200-day SMA
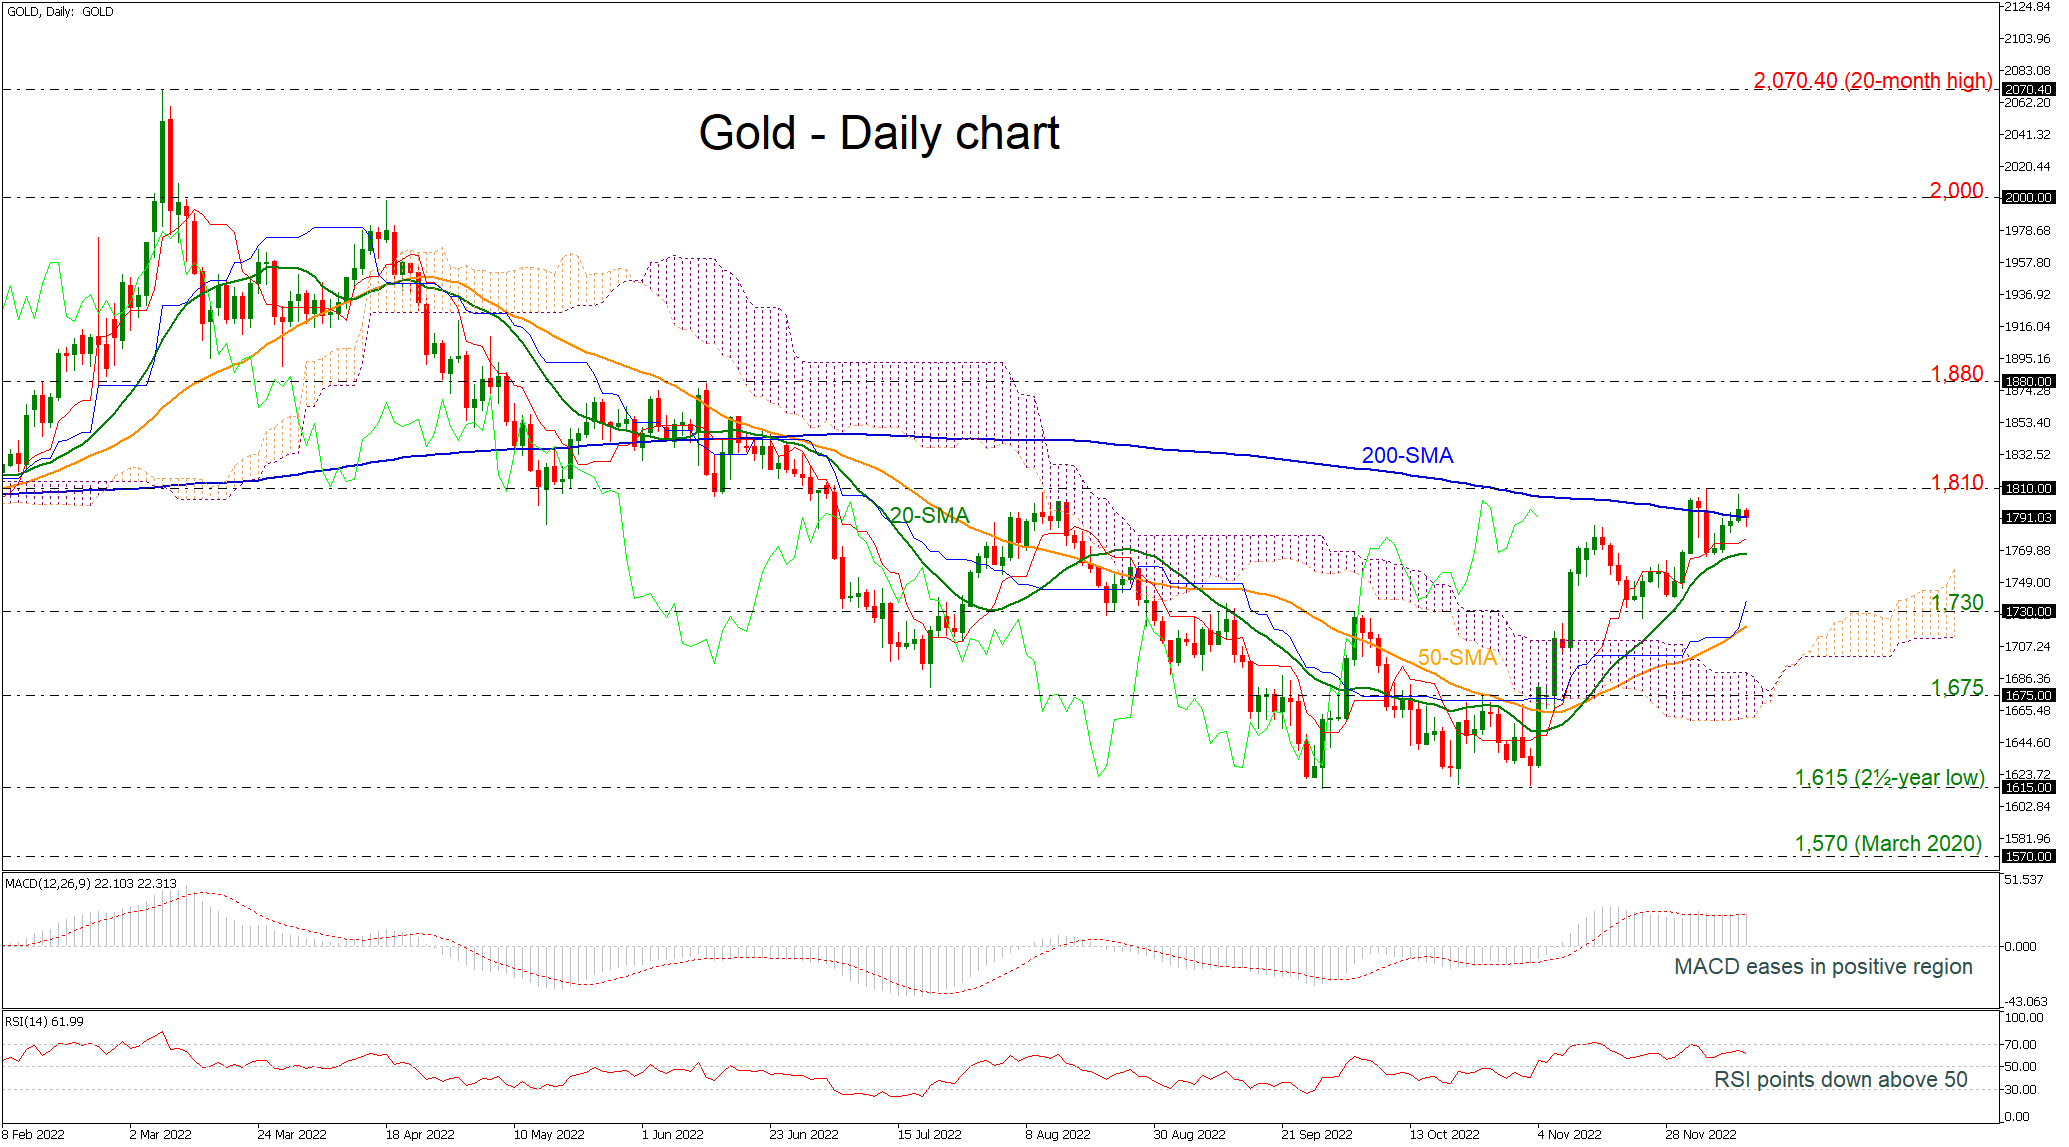
Gold prices have been battling with the 200-day simple moving average (SMA) over the last week, posting some spikes towards the 1,810 resistance level. Any movements beyond these obstacles could add to the optimism for more aggressive bullish actions.
However, the technical oscillators are suggesting some losses in the near future. The MACD fell below its trigger line in the positive territory, while the RSI is sloping downwards above the neutral threshold of 50.
Should weakness extend below the 200-day SMA line, support to downside movements could initially be detected from the 20-day SMA at 1,766 ahead of the 1,730 barrier. Clearing that zone, the next stop could be near the 50-day SMA at 1,720 before the bears hit the 1.675 line.
Alternatively, the pair needs to overcome the 1,810 resistance top to meet a key barrier of 1,880. The 2,000 psychological mark could act as resistance too before a more important battle starts near the 20-month high of 2,070, switching the outlook to strongly bullish.
In the medium-term picture, the sentiment will turn bullish if the price surpasses the 200-day SMA and the 1,810 barrier.
Risk-off/Wait-and-See Approach Makes Perfect Sense
Markets
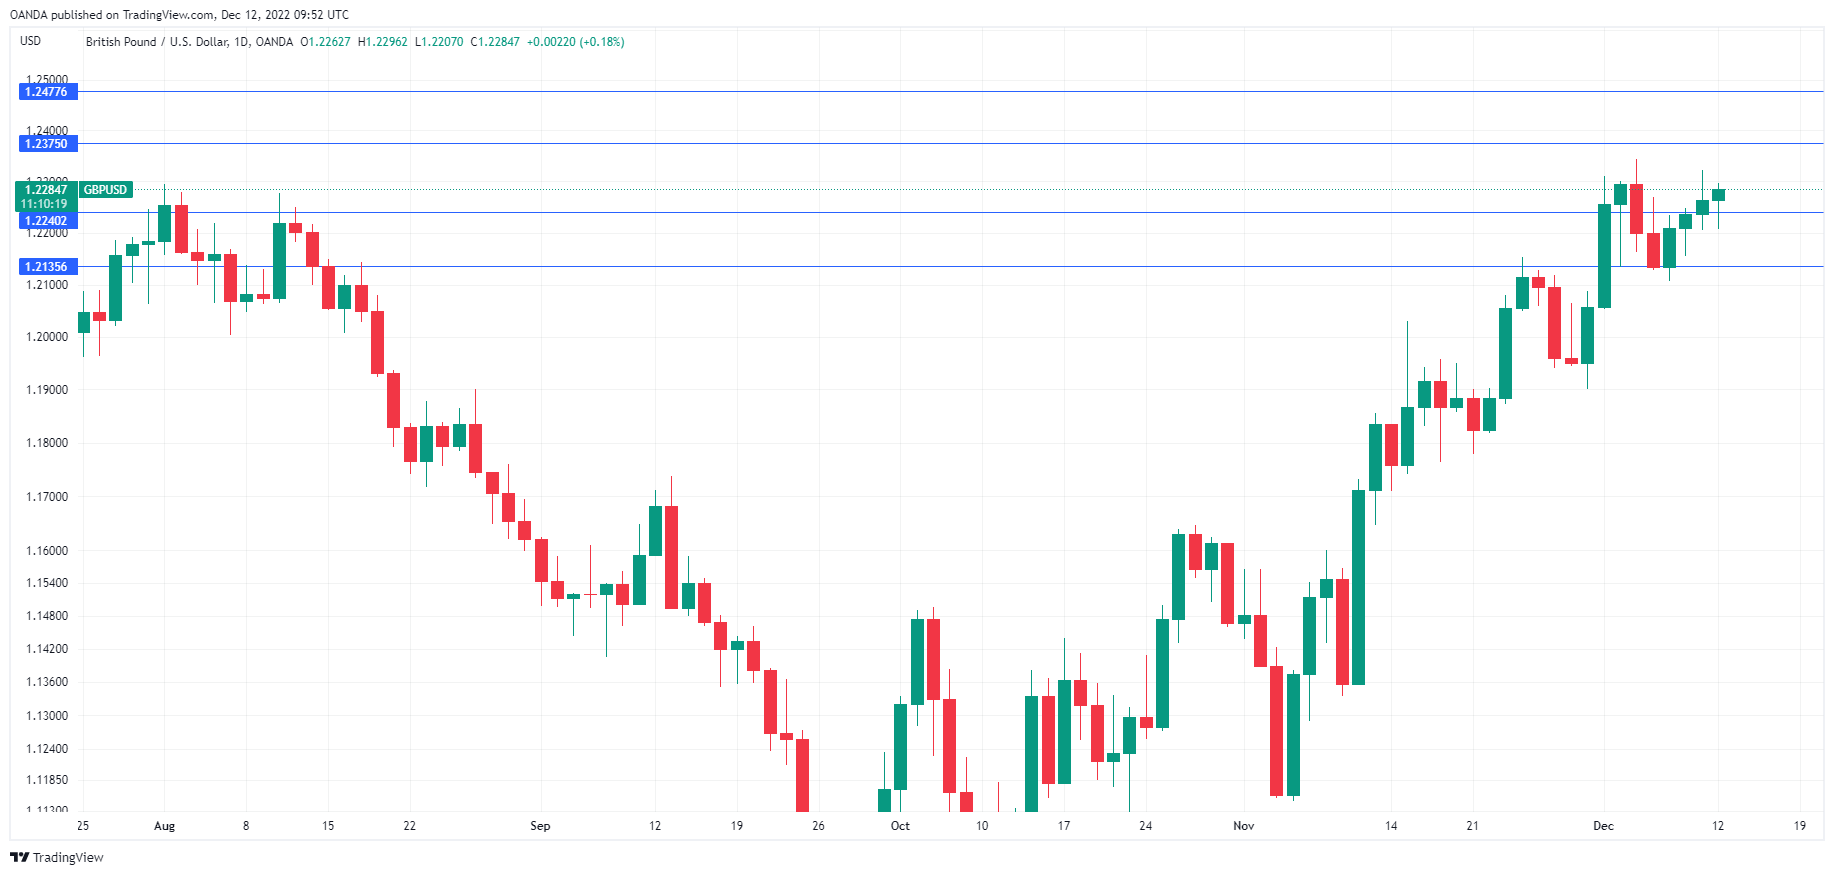
Friday’s session had some interesting features in store. European traders eyed the second voluntary TLTRO repayment opportunity. The amount totaled a little less than €450bn, topping the €296bn in November and bringing the remaining outstanding amount to around €1.3bn. In US dealings, a higher-than-expected PPI reading served as a reminder of sticky price pressures and traders focused on more resilient headline US consumer confidence (U. of Michigan) instead of a sub indicator showing 1-year inflation expectation unexpectedly easing. Core bond yields rebounded. German yields underperformed vs swaps, in line with one could expect following the TLTRO repayment. Yields rose between 9.1 to 11.3 bps with the long-end slightly underperforming the front. US yields added 3.8 bps (2y) to 12.9 bps (30y). In both areas, the 10y yield support at 1.77% and 3.42 (and even 3.55%) respectively thus survived the week. The dollar held a slight advantage over the euro. EUR/USD returned from close to but below 1.06 to 1.054. DXY (trade-weighted dollar) closed just below 105.01 (38.2% retracement of the 2021-2022 rally). Sterling was strong but we’ve seen little reason for it. EUR/GBP tested 0.8567 critical support for an umpteenth time but it lived to fight another day. The pair eventually closed at 0.8592. Cable (GBP/USD) eked out a slight gain to 1.2259. Equities finished mixed with 0.54% gains in Europe (Eurostoxx50) but up to 0.90% lower in the US (DJI).
The Asian session this morning is a dull one. Stocks slip in the wake of WS’s performance. Core bounds recoup a tad of Friday’s slide and the US dollar enjoys some safe haven flows. This risk-off/wait-and-see approach makes perfect sense at the start of a pivotal trading week. All major central banks, Fed, ECB and Bank of England, and some smaller ones hold their final policy meeting of the year. The former two publish new forecasts that will offer guidance on what to expect for 2023. The monetary festive kicks off on Wednesday with the Fed and we probably shouldn’t expect a lot of market zest in the run-up to it. Tomorrow’s US CPI reading and to a lesser extent UK CPI on Wednesday do serve as the last wildcards though. For today, the double $40bn 3-y and $32bn 10-y auction is worth watching to gauge investor appetite after the recent yield correction lower, especially on the long-end of the curve. But it won’t dramatically alter market positioning. Perhaps capturing less (market) attention, but let’s also watch commodity markets, especially gas and power prices. Europe is facing its first serious stress test with temperatures dropping well in subzero territory this week.
News Headlines
Rating agency Fitch confirmed the UK’s AA- rating while keeping the outlook negative. The latter reflects the UK's rising government debt and significant fiscal risks derived from the country’s weaker macroeconomic outlook primarily due to the severe energy shock. The UK economy will enter recession in 2H22 and contract by 1.2% in 2023. Short term government support will avoid a deeper recession and help a gentle (1.5%) recovery in 2024. Inflation is expected to average 9.1% this year, before gradually declining to 3.4% (avg) in 2024. Fitch projects that the general government deficit will remain high at 6.6% of GDP in 2022 and 6.9% in 2023, before declining to 5.1% in 2024, consistently remaining above the projected average deficits of 2.4% for the 'AA' median. The debt ratio is forecast to rise to 107% of GDP by 2024 and roughly stabilize at that level over the medium term. The UK is rated similarly by Moody’s (Aa3; negative) and one notch better at S&P (AA, negative).
Czech Industry Minister Sikela urged governments to agree on a temporary gas market correction mechanism ahead of tomorrow’s extraordinary EU Council on transport, telecommunications and energy. The current gas price cap proposal would kick in if European reference prices (Dutch TTF) hit €275 per megawatt hour and the gap between world prices is more than €58. In response to some countries wanting a more aggressive mechanism, the Czech government, who holds the EU’s rotating presidency, floated the idea of lowering the thresholds to €220 and €35 respectively. Other countries want a cautious approach to avoid endangering the security of supply.
DAX 40 Struggles for Support
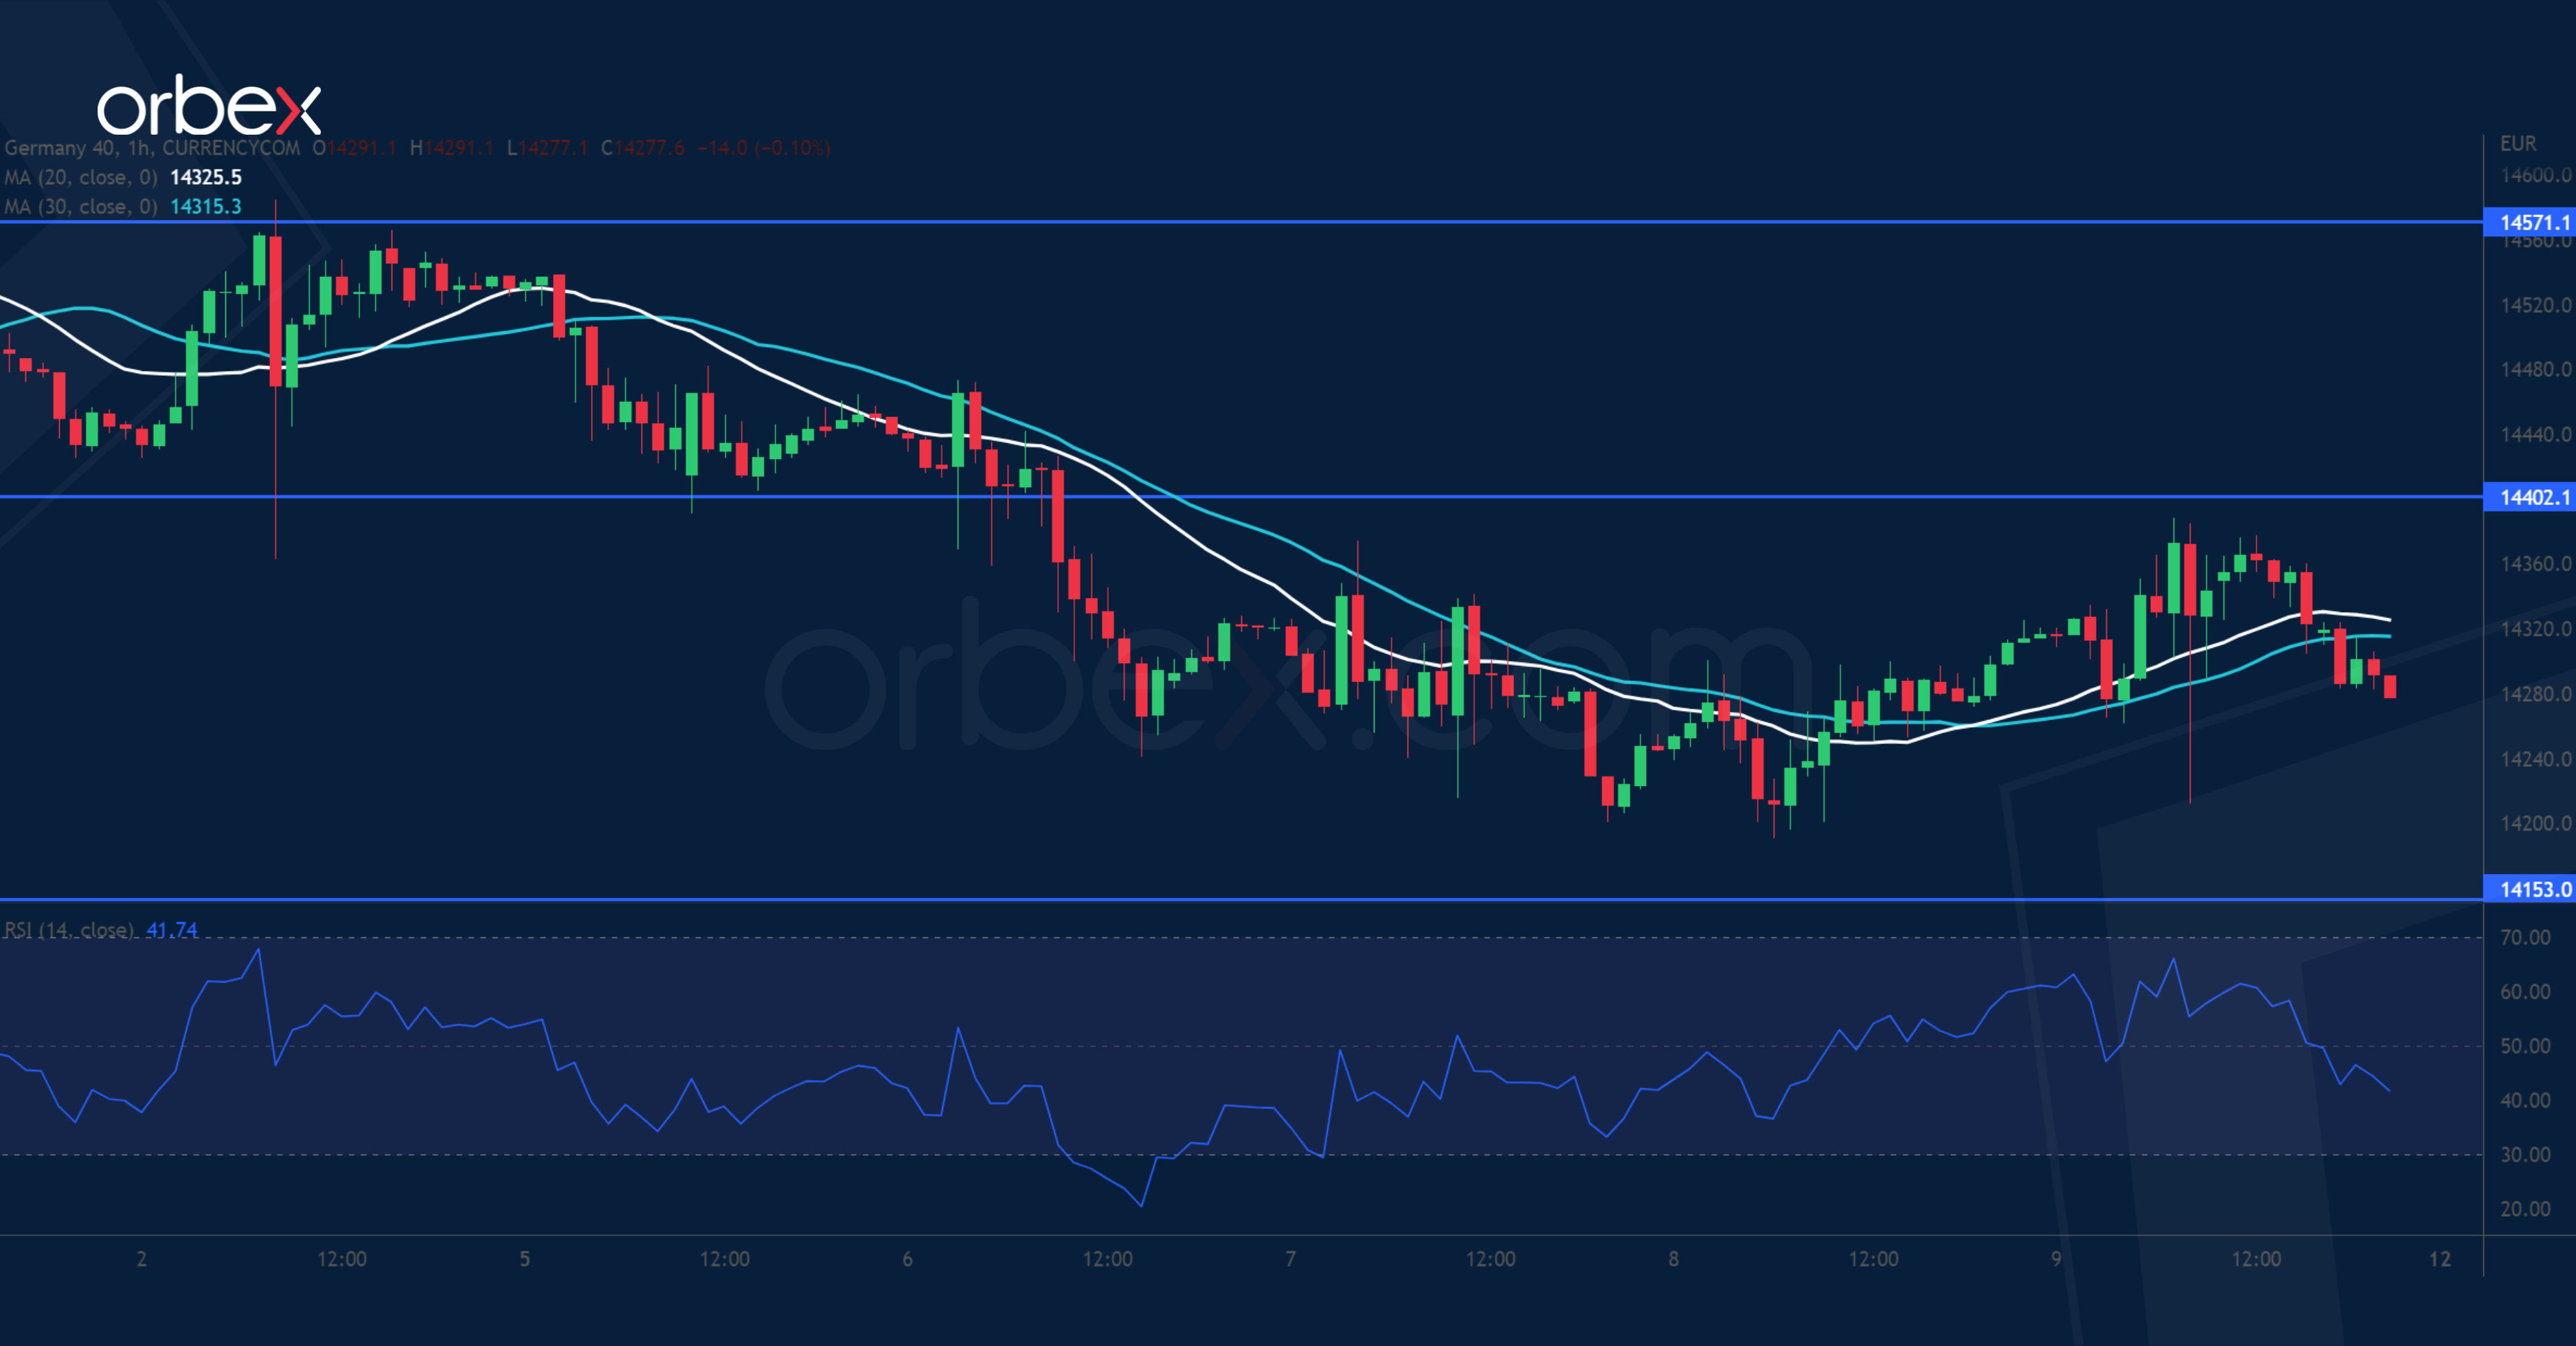
The Dax 40 fell back as traders took profit ahead of a data-intensive week. The bulls have struggled to lift offers around June’s peak of 14650. Instead, a fall below 14350 prompted short-term buyers to take some chips off the table. The former demand zone around 14400 has become a supply one, and more sellers would join the rank if the buy side fails to reclaim it. The recent low of 14150 sits on the 30-day moving average and is a major support. The index could be vulnerable to a deep retracement should it be pierced.