Sample Category Title
Technical Outlook and Review
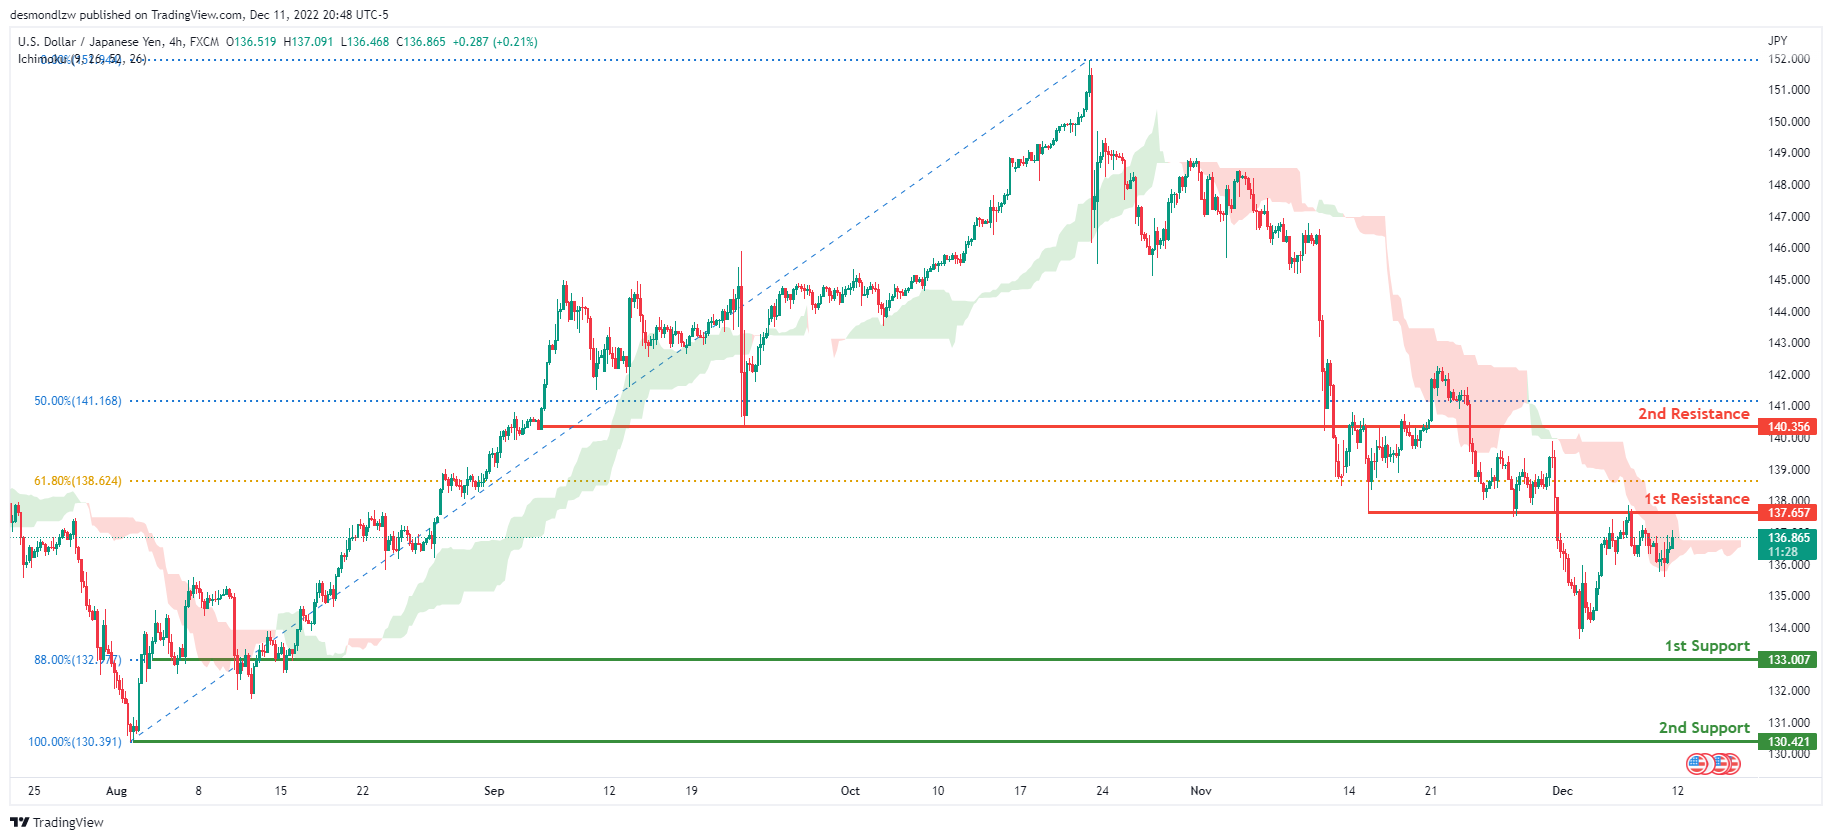
USD/JPY:
The current general bias for USDJPY on the H4 chart is bearish. To add confluence to this, the price is under the Ichimoku cloud which indicates a bearish market. If the bearish momentum continues, expect USDJPY to continue heading towards the 1st support at 133.007 where the 88% Fibonacci line is. In an alternative scenario, price could head back up to retest the 1st resistance line at 137.657, where the 61.8% Fibonacci line and previous low are located.
Areas of consideration:
- H4 time frame, 1st resistance at 137.657
- H4 time frame, 1st support at 133.007
DXY:
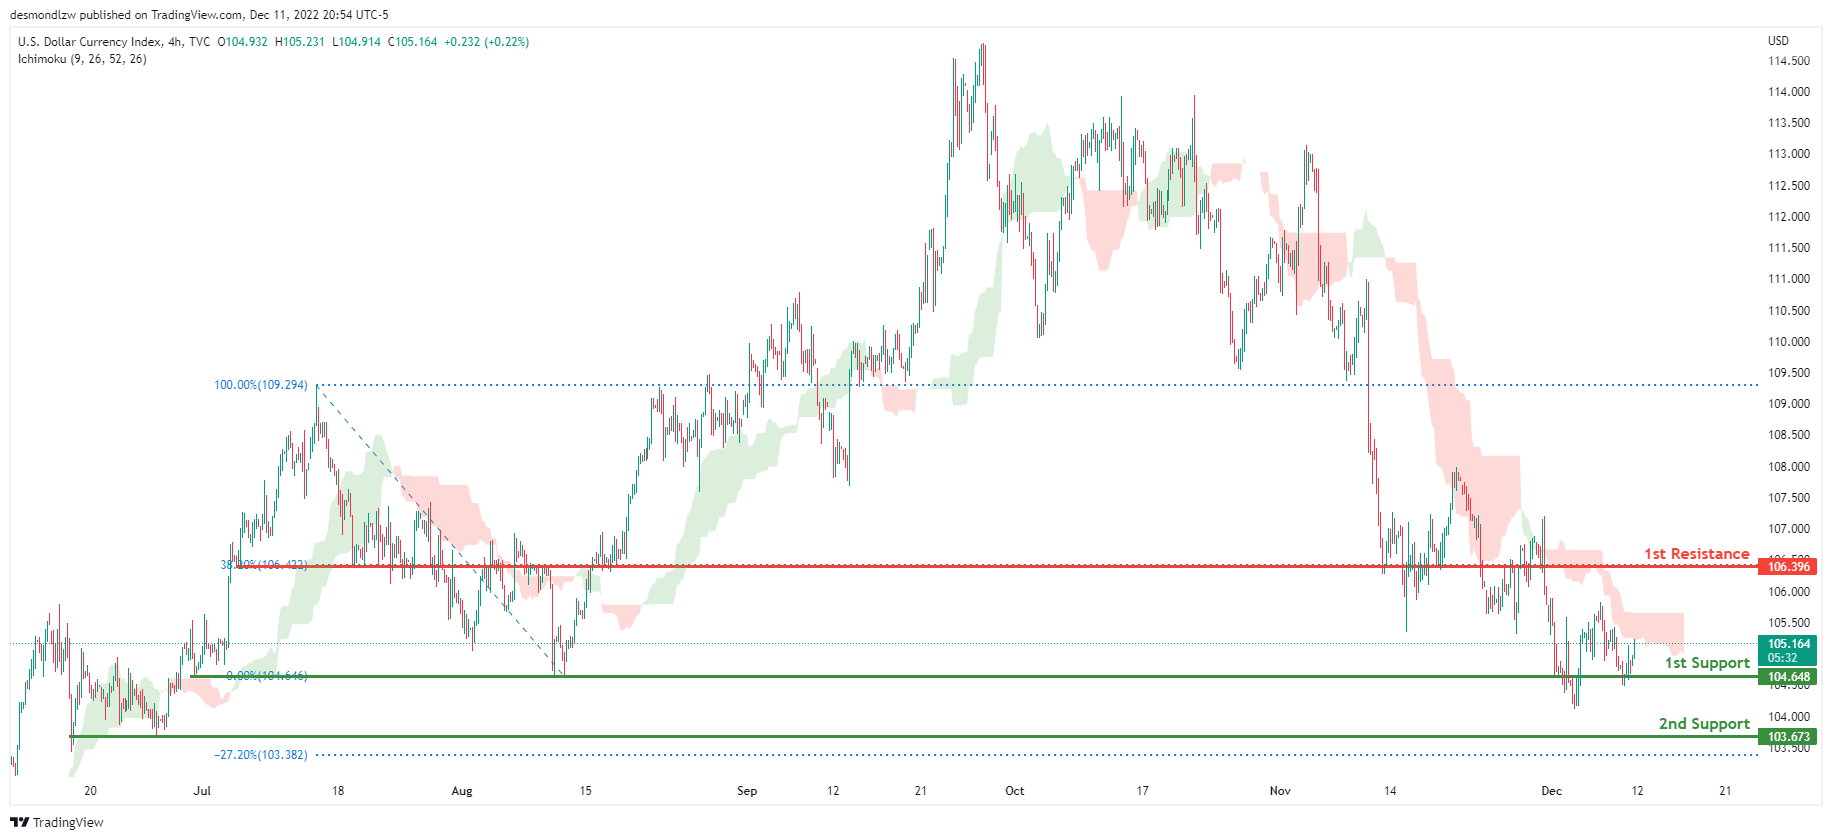
On the H4 chart, the overall bias for DXY is bearish. To add confluence to this, the price is below the Ichimoku cloud which indicates a bearish market. If this bearish momentum continues, expect the price to continue heading towards the 1st support line at 104.648, where the previous swing low is. In an alternative scenario, price could head back up and retest the 1st resistance line resistance at 106.396, where the 38.2% Fibonacci line is.
Areas of consideration:
- H4 time frame, 1st resistance at 106.396
- H4 time frame, 1st support at 104.648
EUR/USD:
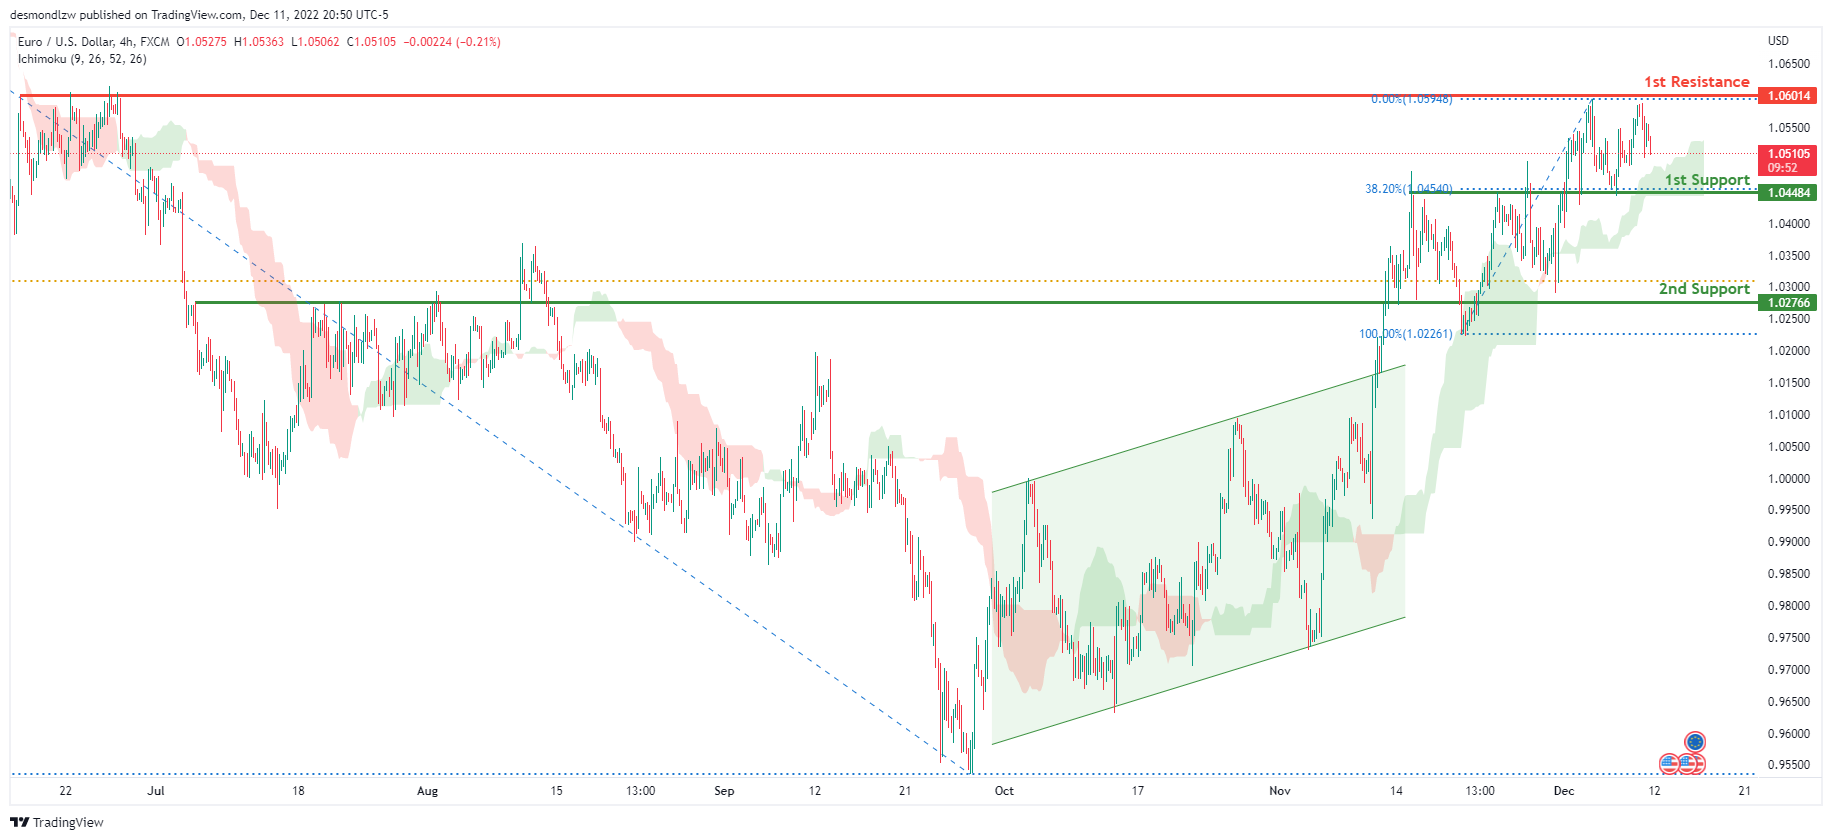
Looking at the H4 chart, my overall bias for EURUSD is bullish due to the current price being above the Ichimoku cloud, indicating a bullish market. To add confluence to this bias, price has also broken above the ascending bullish channel. If this bullish momentum continues, expect the price to possibly head towards the 1st resistance at 1.06014, where the previous swing high and 78.6% Fibonacci line are located., before heading towards the 2nd resistance at 1.07652, where the previous swing high is. In an alternate scenario, price could possibly head back down to break the 1st support level at 1.04484, where the previous high and 38.2% Fibonacci line are located before heading towards the 2nd support at 1.02766 where the 61.8% Fibonacci line is.
Areas of consideration :
- H4 1st resistance at 1.06014
- H4 1st support at 1.04484
- H4 2nd support at 1.02766
GBP/USD:
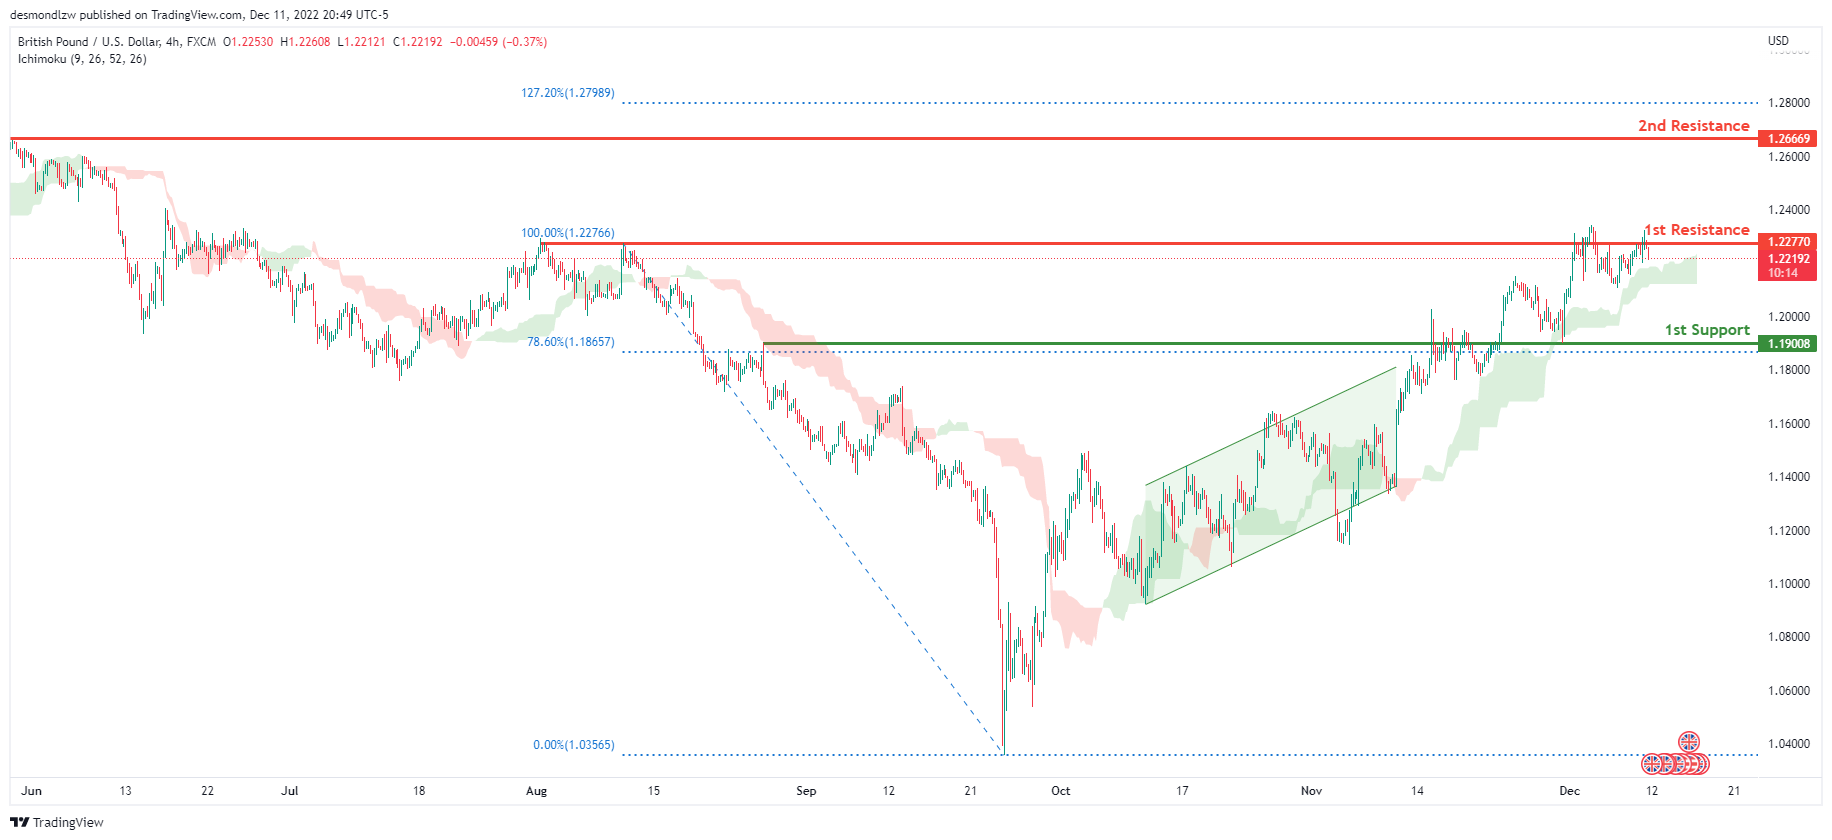
Looking at the H4 chart, my overall bias for GBPUSD is bullish due to the current price being above the Ichimoku cloud, indicating a bullish market. Expecting price to head back up to possibly break the 1st resistance line at 1.22770, where the previous high is, before heading towards the 2nd resistance at 1.26669, where the previous swing high is. In an alternative scenario, price could possibly head back down towards the 1st support at 1.19008, where the 78.6% Fibonacci line is.
Areas of consideration:
- H4 1st resistance at 1.22770
- H4 2nd resistance at 1.26669
- H4 1st support at 1.19008
USD/CHF:
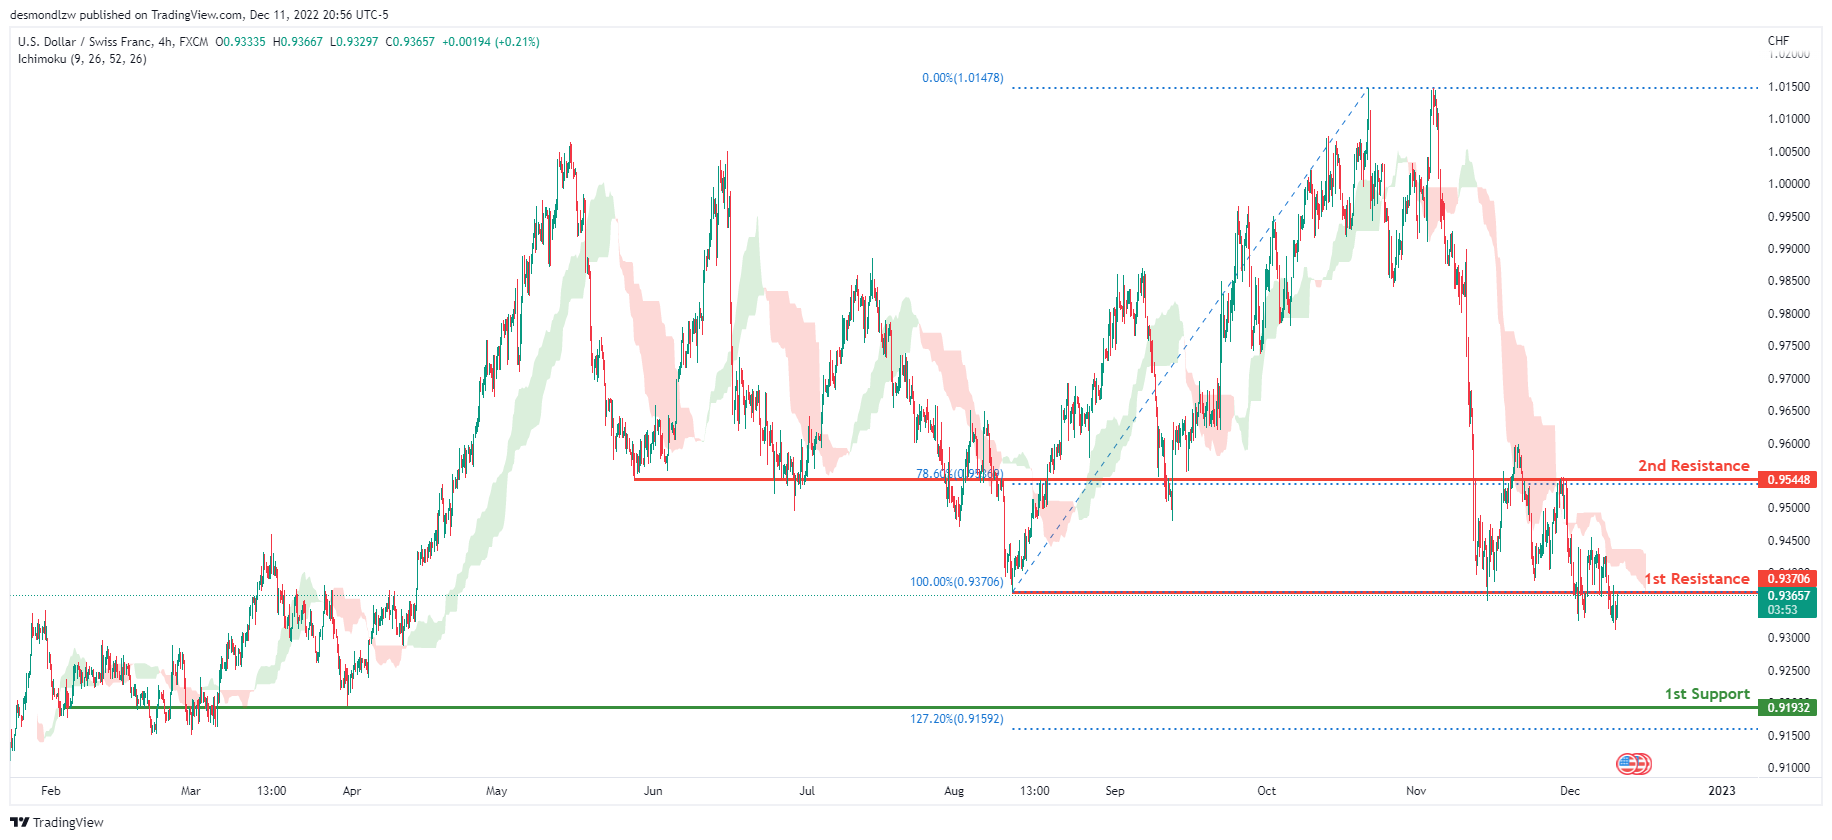
The overall bias for USDCHF on the H4 chart is bearish. In addition, the price is below the Ichimoku cloud, indicating a bearish market. If the current bearish trend continues, expect the price to head back down towards the 1st support line at 0.91932, where the previous swing low and 12.72% Fibonacci extension line is . In an alternative scenario, price could possibly head up towards the 1st resistance at 0.93706, where the previous swing low is .
Areas of consideration
- H4 1st support at 0.91932
- H4 1st resistance at 0.93706
XAU/USD (GOLD):
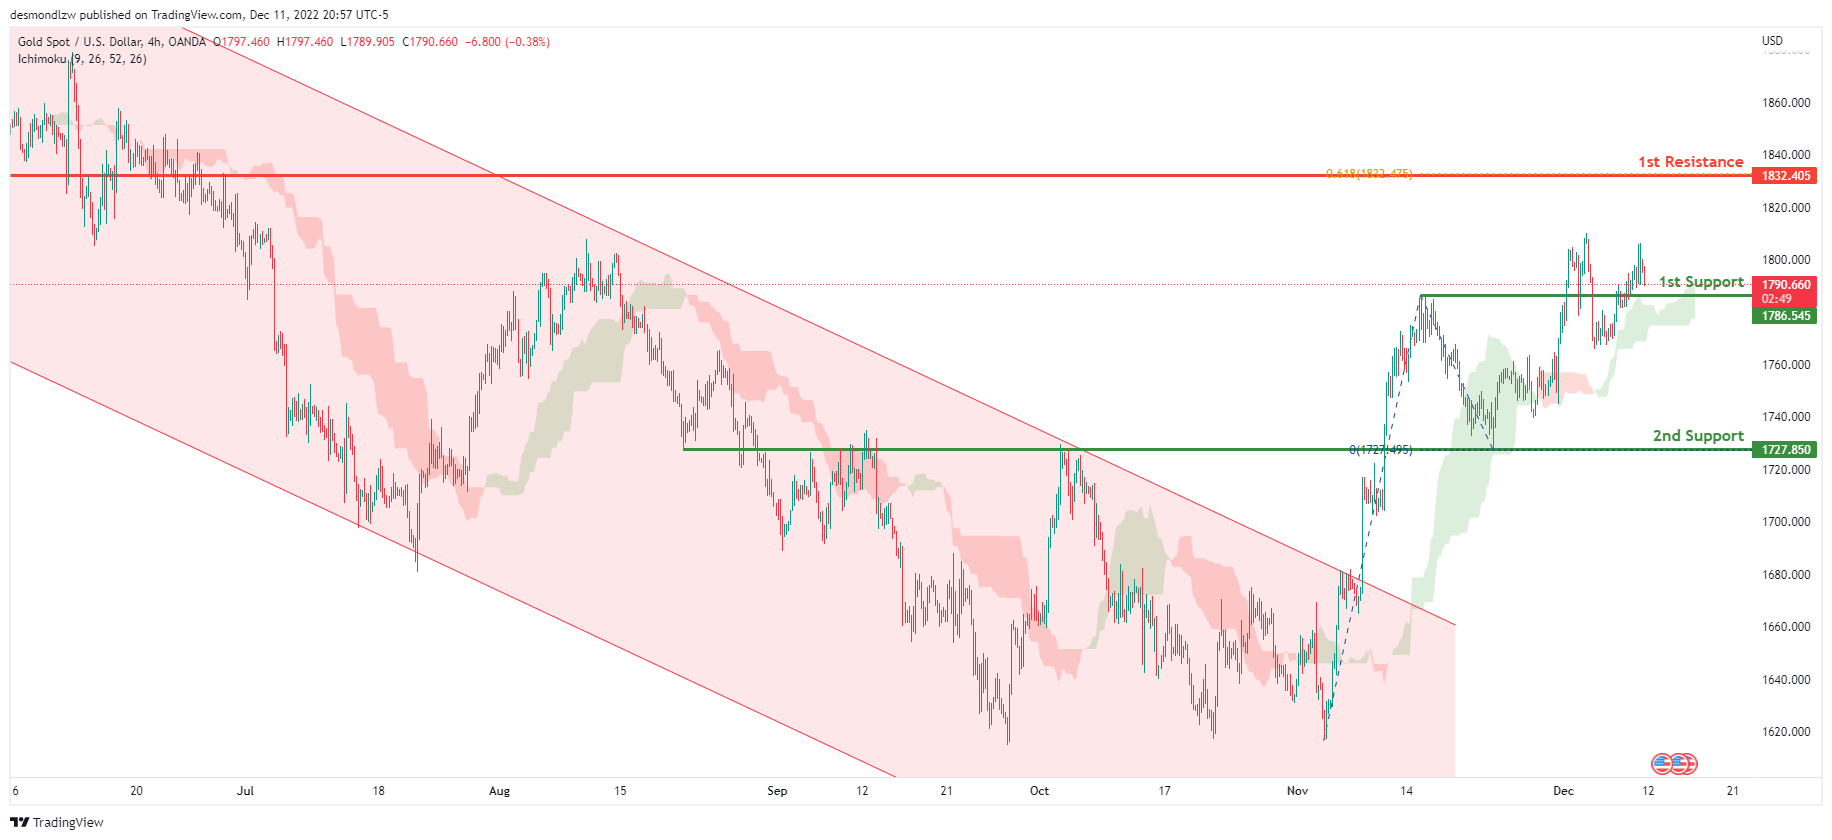
Looking at the H4 chart, my overall bias for XAUUSD is bullish due to the current price crossing above the Ichimoku cloud, indicating a bullish market. If this bullish momentum continues, expect the price to possibly head towards the 1st resistance at 1832.405, where the 61.8% Fibonacci projection line is. In an alternate scenario, price could possibly head back down towards the 1st support level at 1786.545, where the previous swing high is located
Areas of consideration:
- H4 time frame, 1st resistance at 1832.405
- H4 time frame, 1st support at 1786.545
AUD/USD:
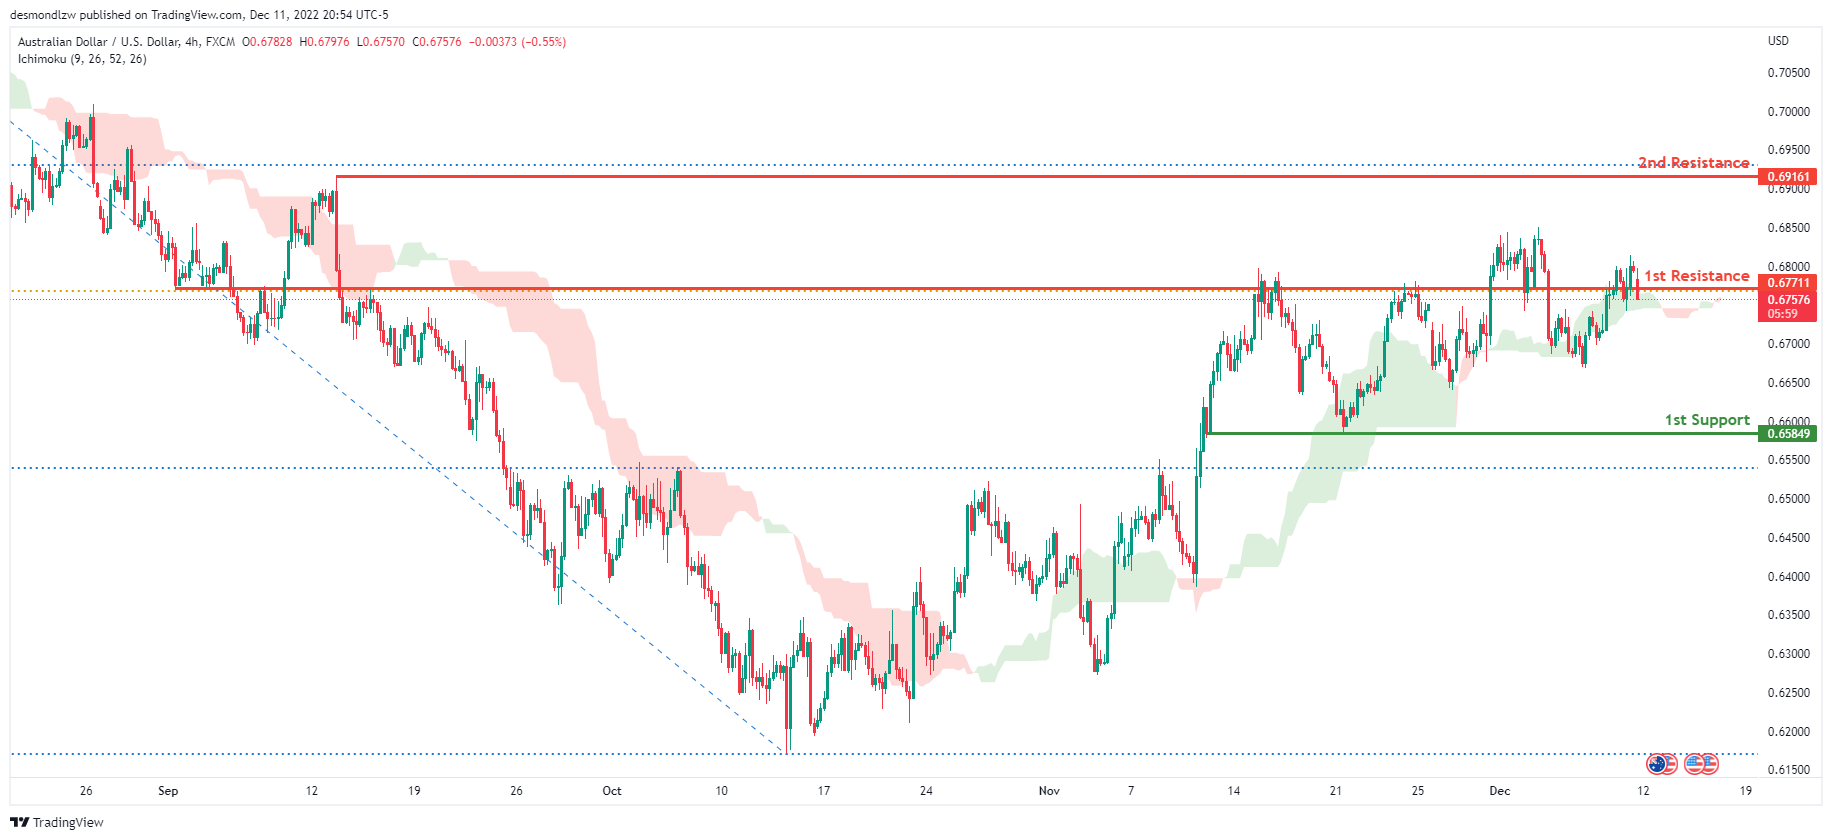
Looking at the H4 chart, my overall bias for AUDUSD is bullish due to the current price being above the Ichimoku cloud, indicating a bullish market. If this bullish momentum continues, expect the price to break the 1st resistance at 0.67711, where the 61.8% Fibonacci line is, before heading towards the 2nd resistance at 0.69161, where the 78.6% Fibonacci line is. In an alternative scenario, price could possibly head back down towards the 1st support line at 0.65849, where it is slightly above where the 38.2% Fibonacci line is.
Areas of consideration
- H4, 1st resistance at 0.67711
- H4, 2nd resistance at 0.69161
- H4, 1st support at 0.65849
NZD/USD:
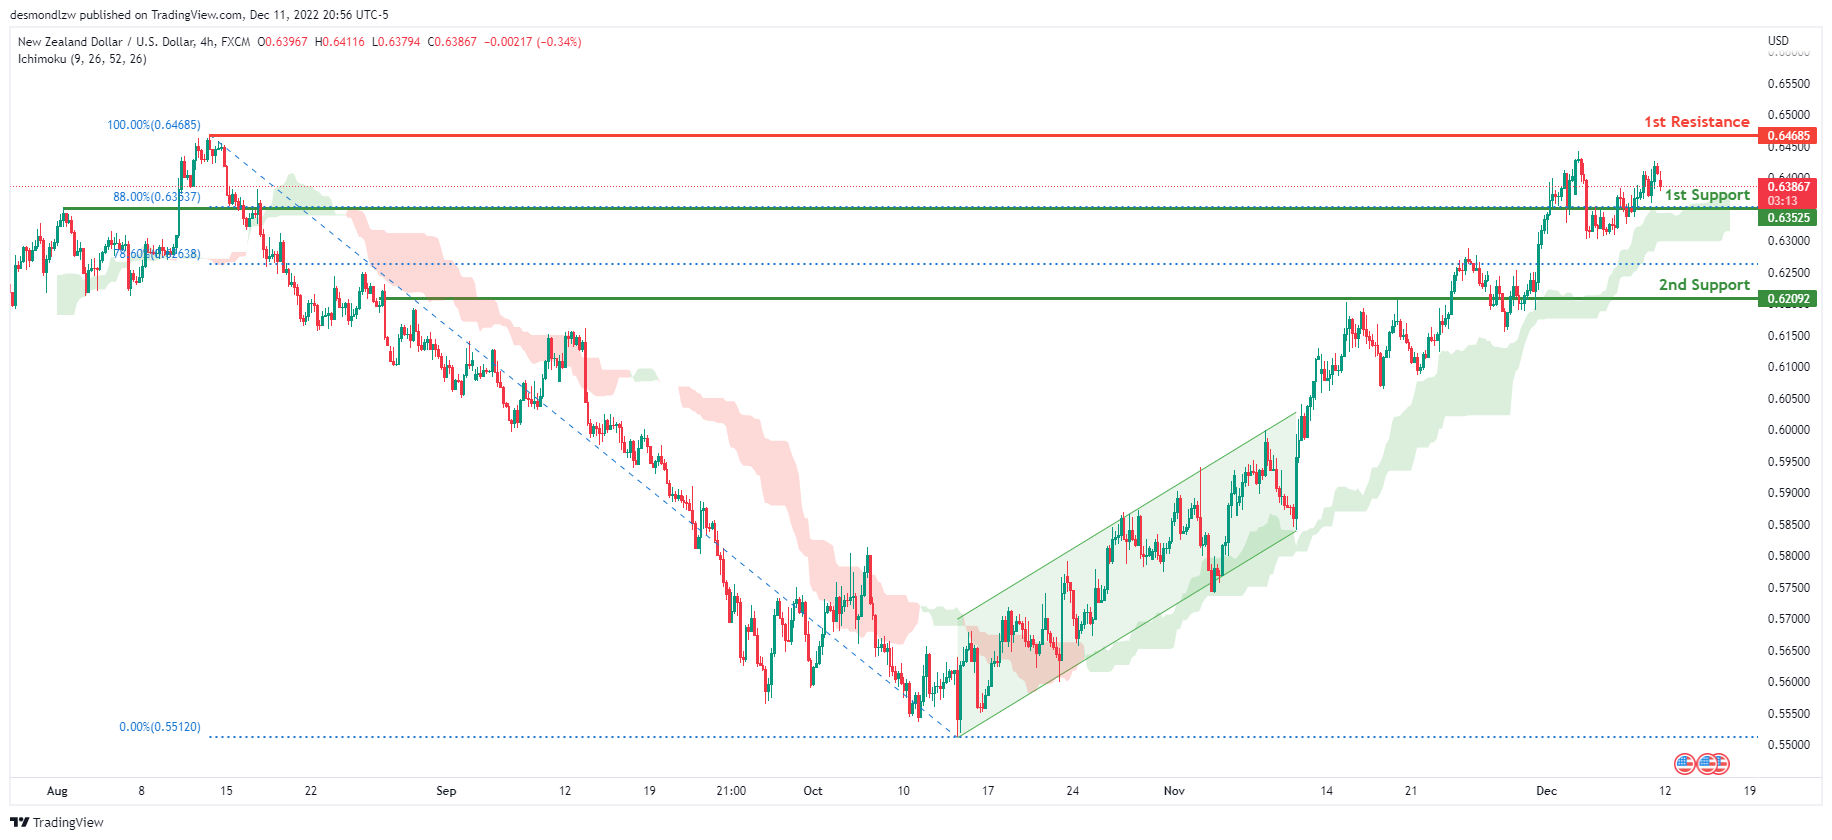
Looking at the H4 chart, my overall bias for NZDUSD is bullish due to the current price being above the Ichimoku cloud, indicating a bullish market.
To add confluence to this bias, price has broken out of the ascending channel. If this bullish momentum continues, expect the price to head up to the 1st resistance line at 0.64685, where the previous swing high is. Alternatively, the price may head back down towards the 1st support aat 0.63525, where the 88% Fibonacci line is.
Areas of consideration:
- H4 time frame, 1st resistance at 0.64685
- H4 time frame, 1st support at 0.63525
USD/CAD:
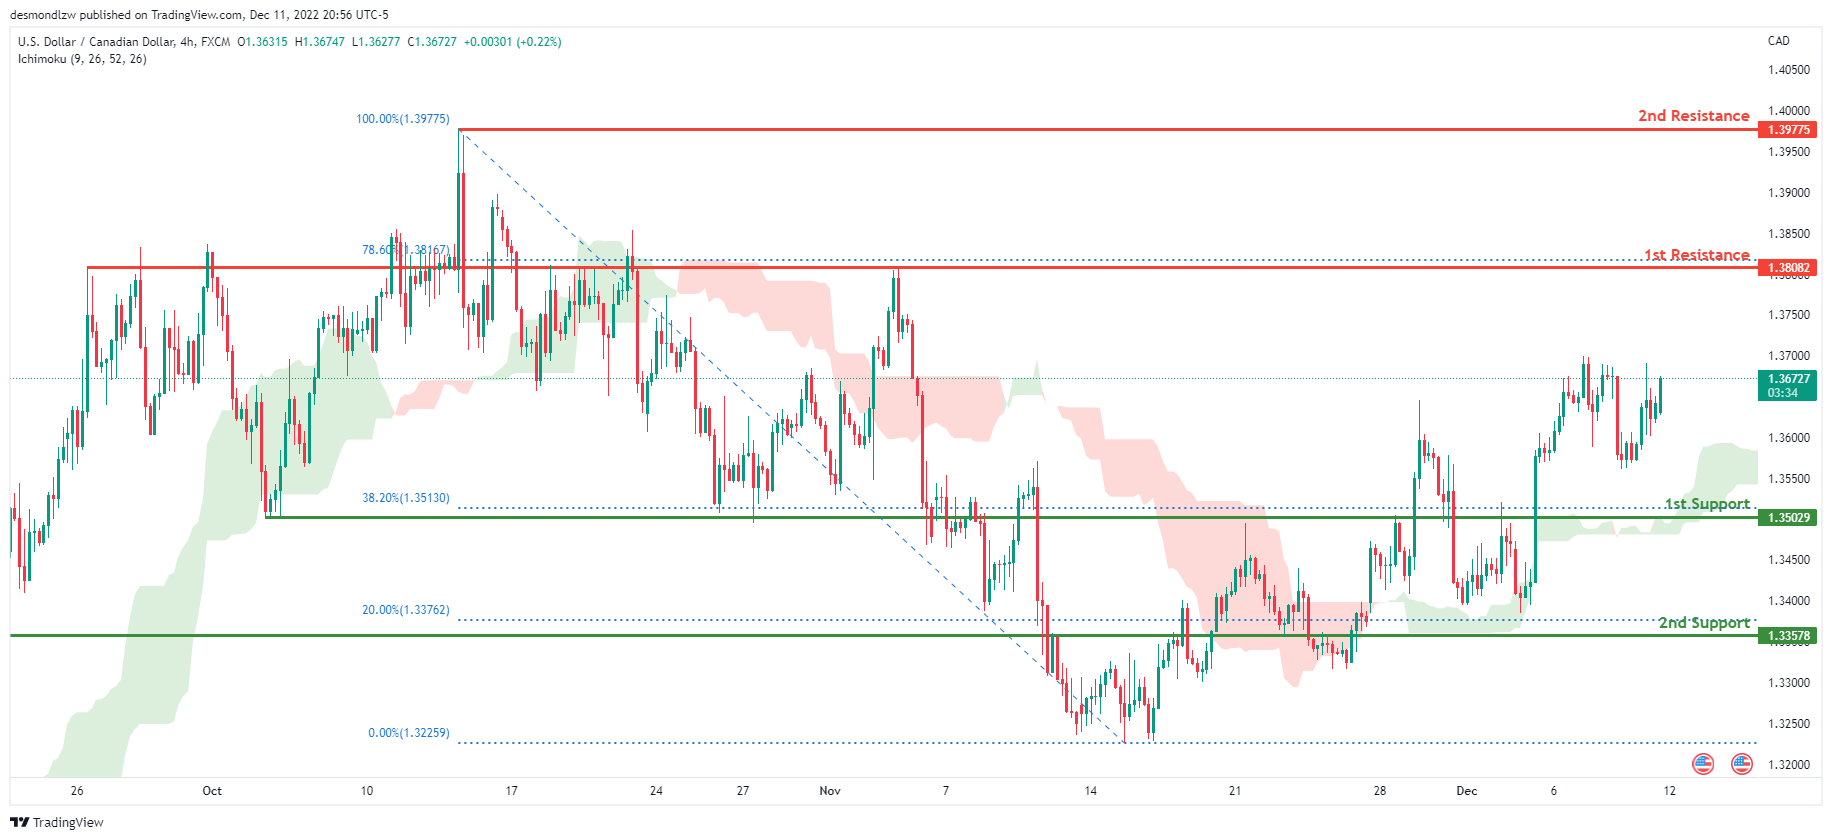
On the H4 chart, the overall bias for USDCAD is bullish. To add confluence to this, the price is above the Ichimoku cloud which indicates a bullish market. If this bullish momentum continues, expect the price to head towards 1st resistance line at 1.38082, where the 78.6% Fibonacci line is. In an alternative scenario, price could head back down to retest the 1st support at 1.35029, where the 38.2% Fibonacci line is.
Areas of consideration:
- H4 time frame, 1st resistance at 1.38082
- H4 time frame, 2nd resistance at 1.39775
- H4 time frame, 1st support at 1.35029
OIL:
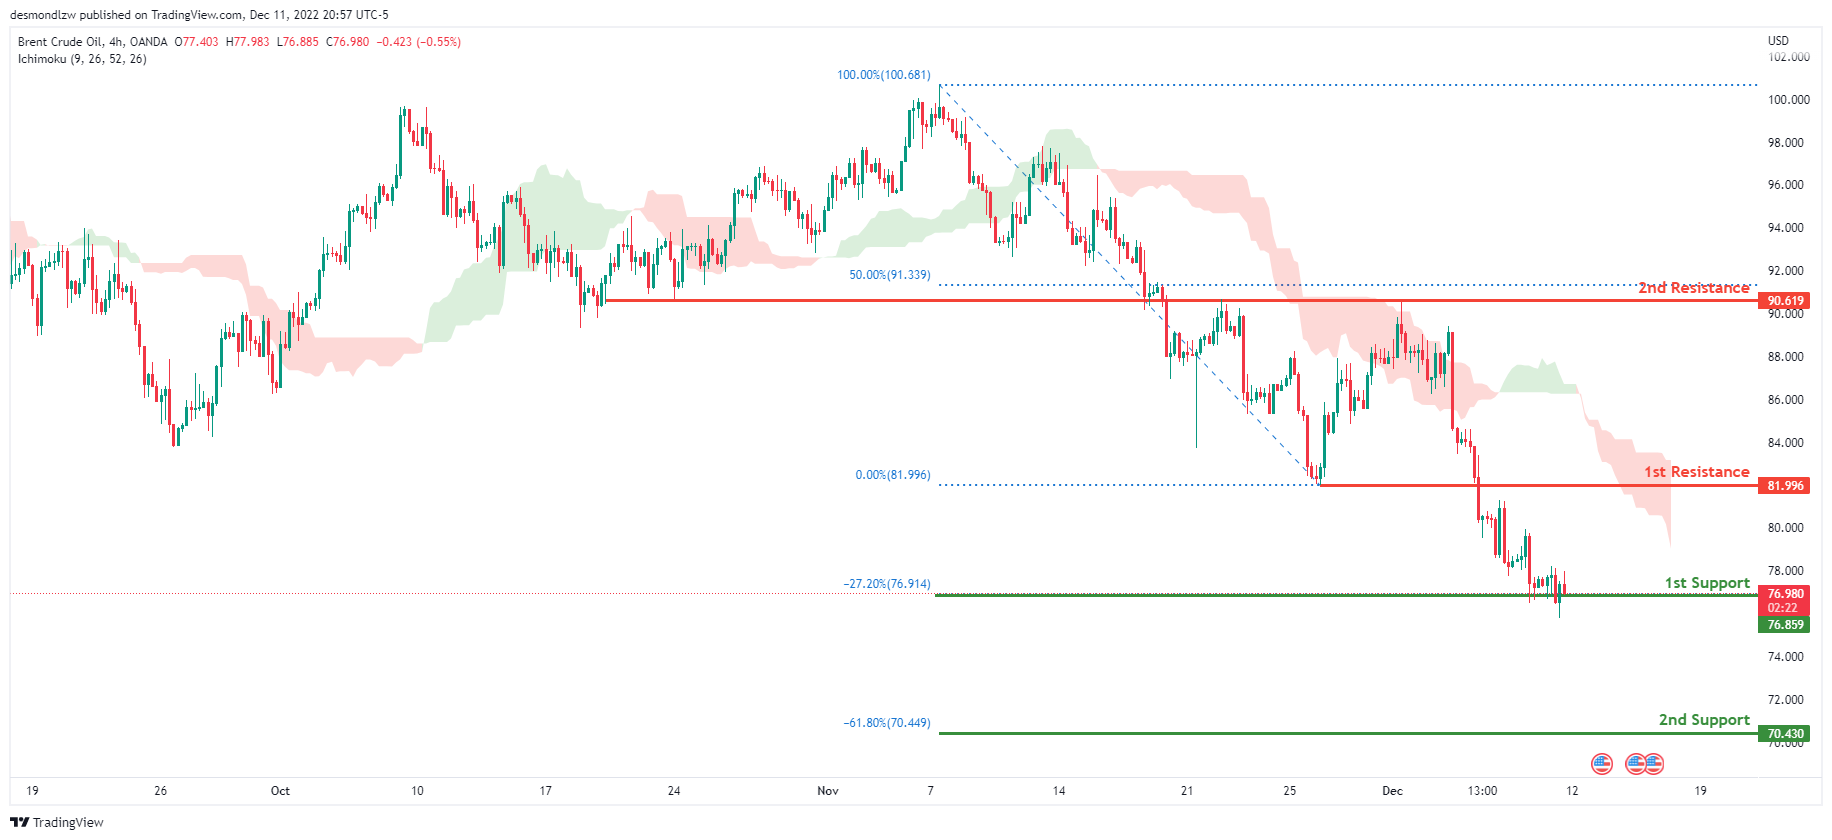
Looking at the H4 chart, my overall bias for BCOUSD is bearish due to the current price being below the Ichimoku cloud, indicating a bearish market. If this bearish momentum continues, expect price to possibly break the 1st support line at 76.859, where the -27.2% Fibonacci expansion line is, before heading towards the 2nd support at 70.430, where the -27.2% Fibonacci expansion line is. In an alternate scenario, price could possibly head back up to retest the 1st resistance line at 81.996, where the previous low is located.
Areas of consideration:
- H4 time frame, 1st resistance at 81.996
- H4 time frame, 1st support at 76.859
- H4 time frame, 2nd support at 70.430
Dow Jones Industrial Average:
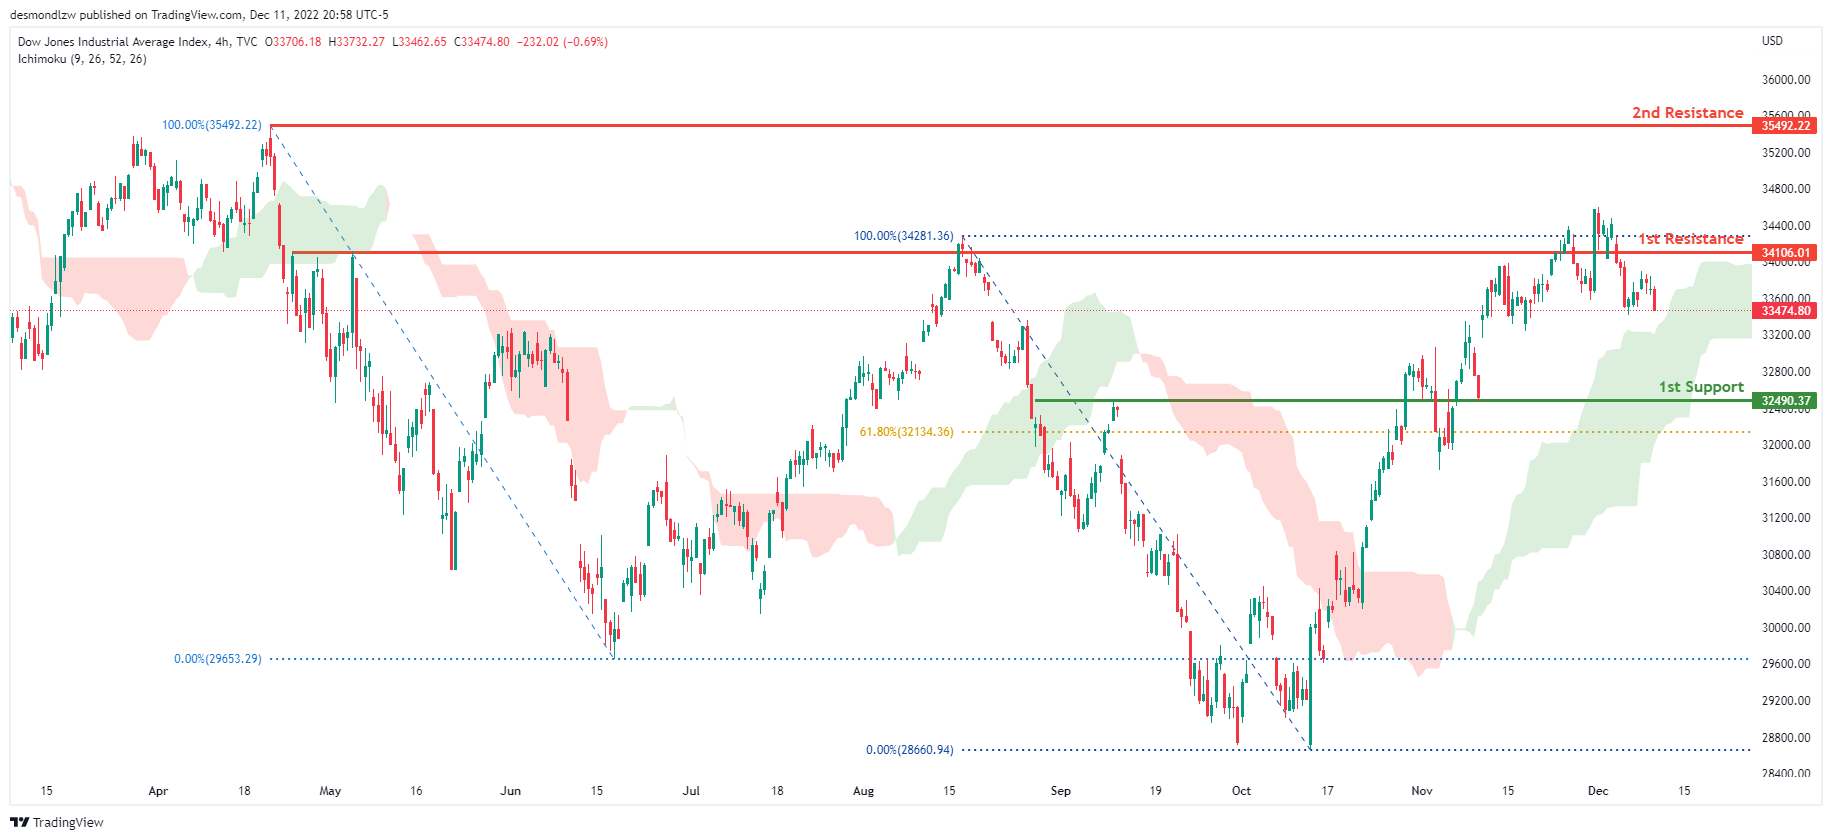
On the H4 chart, the overall bias for DJI is bullish. To add confluence to this, the price is above the Ichimoku cloud which indicates a bullish market. If this bullish momentum continues, expect the price to continue heading towards the 1st resistance line at 34106.01, where the previous swing high is. In an alternative scenario, price could head back down towards the 1st support at 32490.37, where the 61.8% Fibonacci line is.
Areas of consideration:
- H4 time frame, 1st support at 32490.37
- H4 time frame, 1st Resistance at 34106.01
DAX:
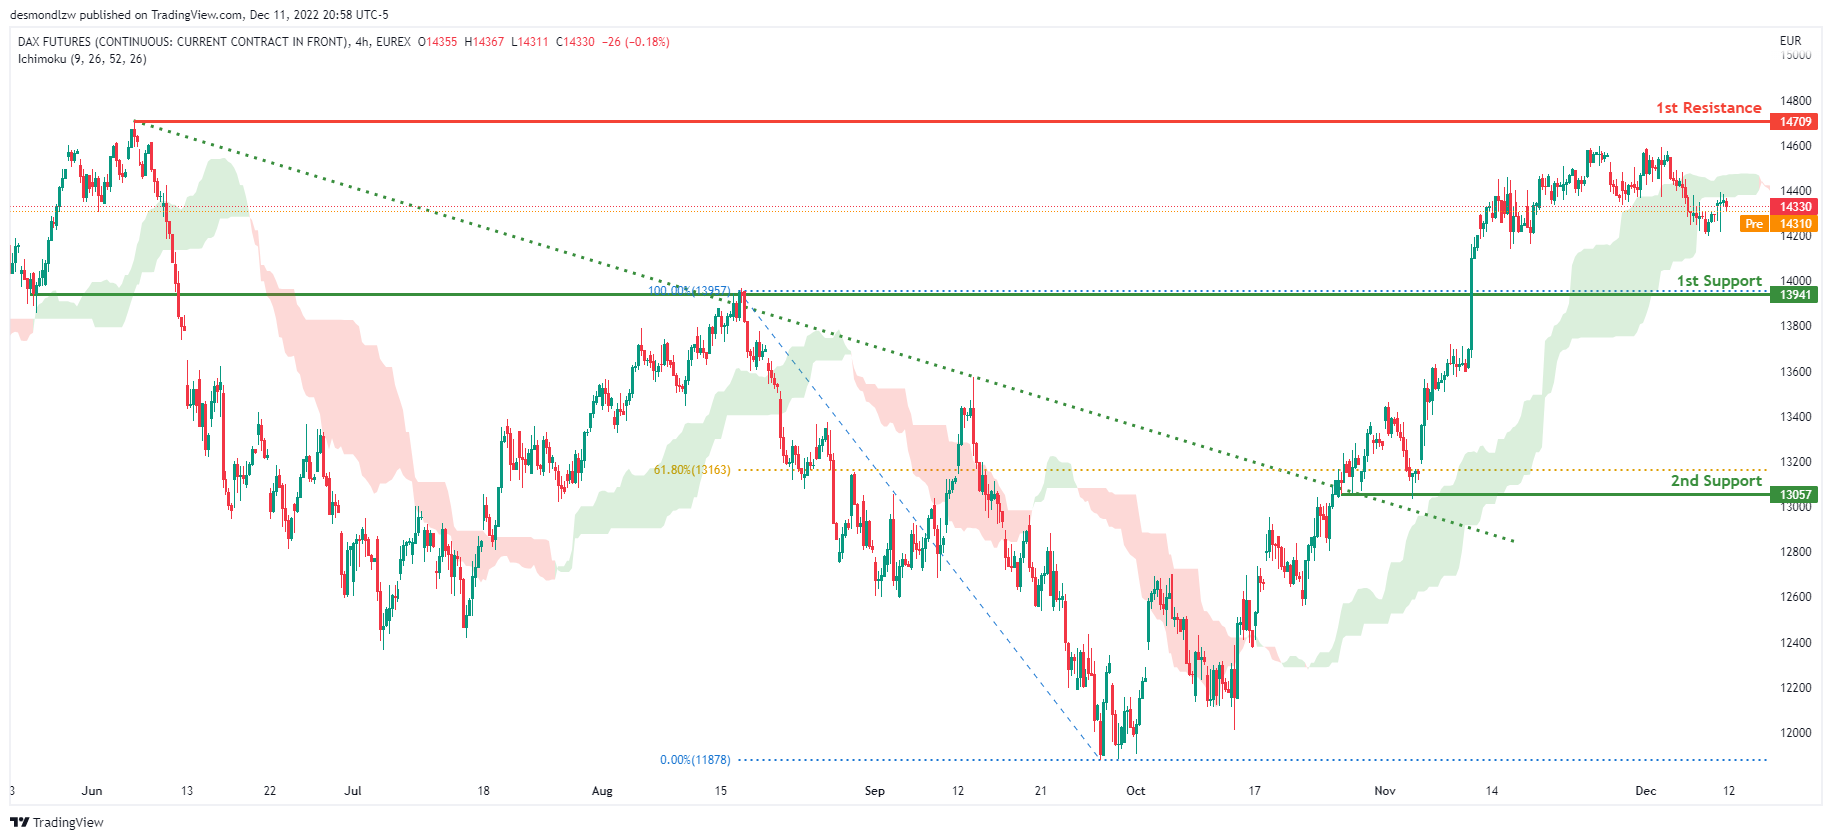
The H4 chart shows a bullish bias, with price breaking through the descending trendline and rising above the Ichimoku cloud. Price is expected to maintain its bullish momentum and rise to the first resistance level at 14709, where the previous swing high is located. Alternatively, the price could fall to the first support level at 13941, where the previous swing high was.
Areas of consideration:
- H4 time frame, 1st resistance is at 14709
- H4 time frame, 1st support is at 13941
ETHUSD:
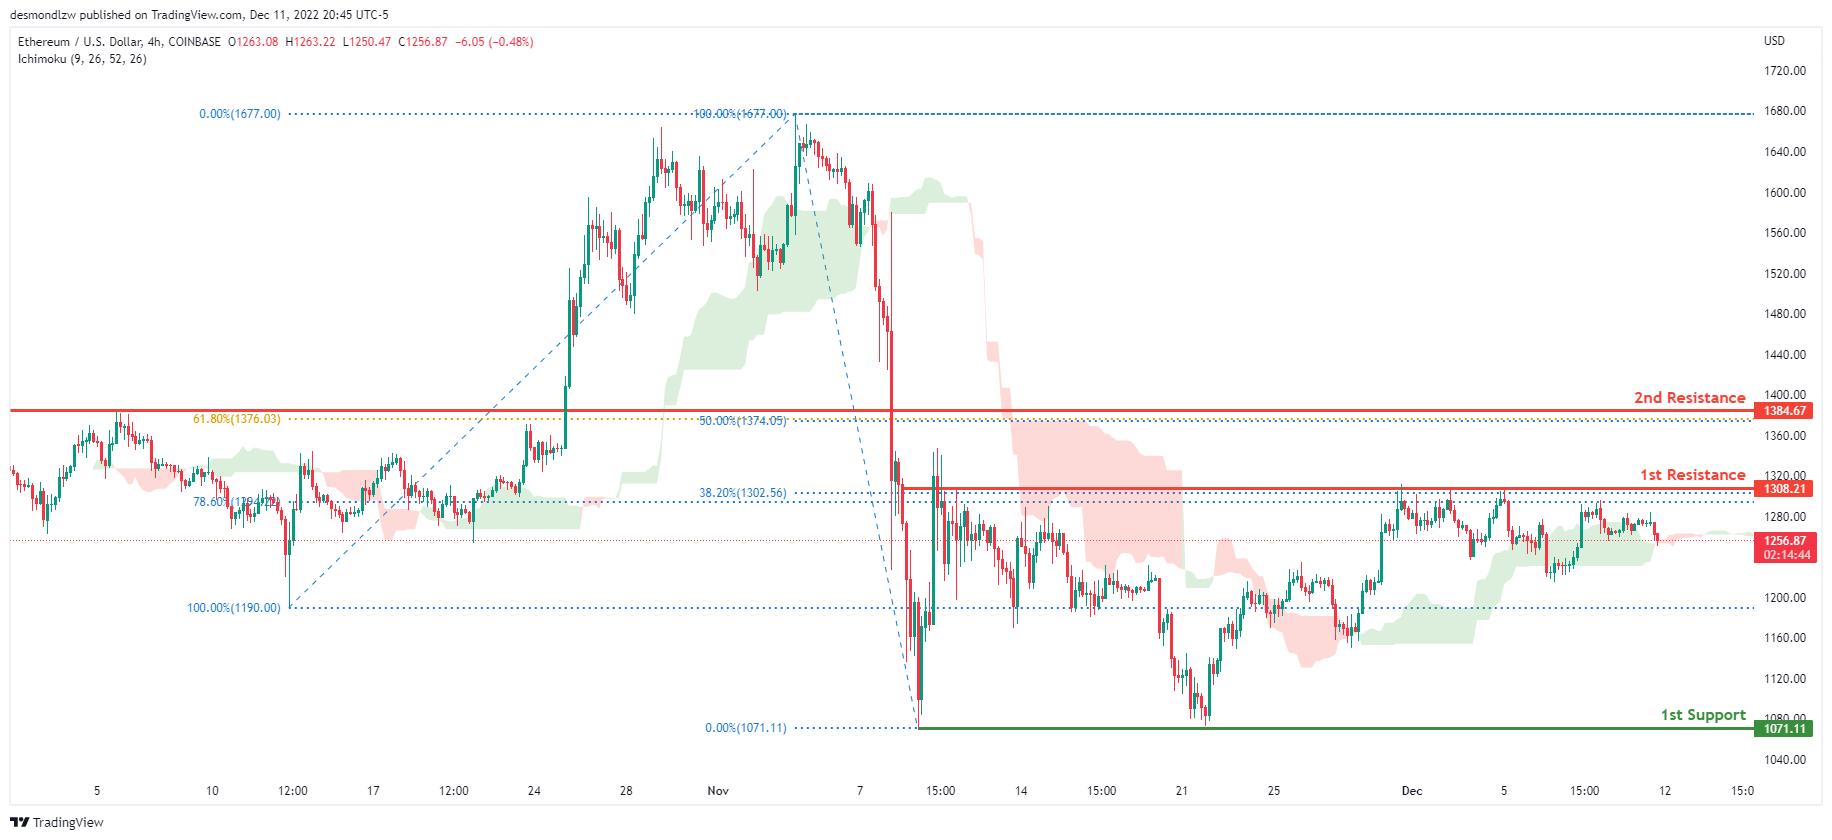
Looking at the H4 chart, my overall bias for ETHUSD is bearish due to the current price crossing above the Ichimoku cloud, indicating a bearish market. Expecting price to possibly head back down towards the 1st support at 1071.11, where the previous swing low is. In an alternative scenario, price could break the 1st resistance at 1308.21, where the 38.2% and 78.6% Fibonacci lines are before heading towards the 2nd resistance line at 1384.67, where the 50% and 61.8% Fibonacci lines are.
Areas of consideration:
- H4 time frame, 1st resistance of 1308.21
- H4 time frame, 2nd resistance of 1384.67
- H4 time frame, 1st support at 1071.11
BTCUSD:
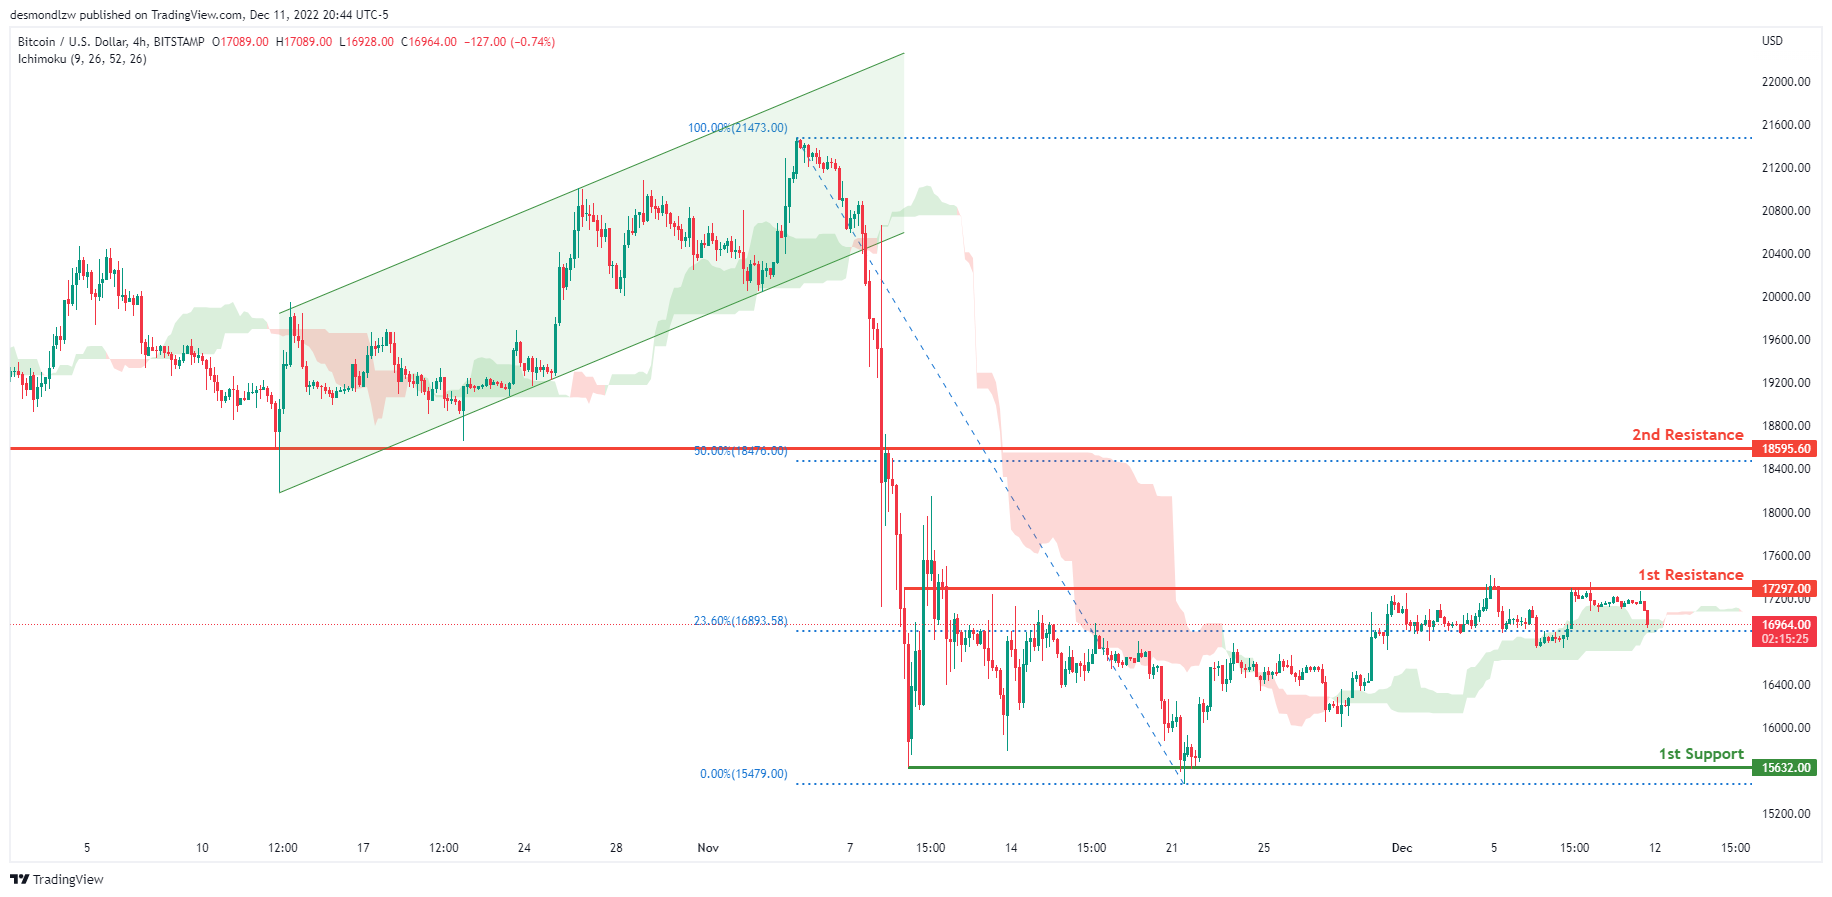
Looking at the H4 chart, my overall bias for BTCUSD is bearish due to the current price crossing below the Ichimoku cloud, indicating a bearish market. Expecting price to possibly head back down towards the 1st support at 15632.00, where the previous swing low is. In an alternative scenario, price could possibly break the 1st resistance at 17297.00, where the 23.6% Fibonacci line is before heading towards the 2nd resistance line at 18173.33, where the previous swing low is and 50% Fibonacci line are.
Areas of consideration:
- H4 time frame, 1st resistance 17297.00
- H4 time frame, 2nd resistance 18173.33
- H4 time frame, 1st support at 15632.00
S&P 500:
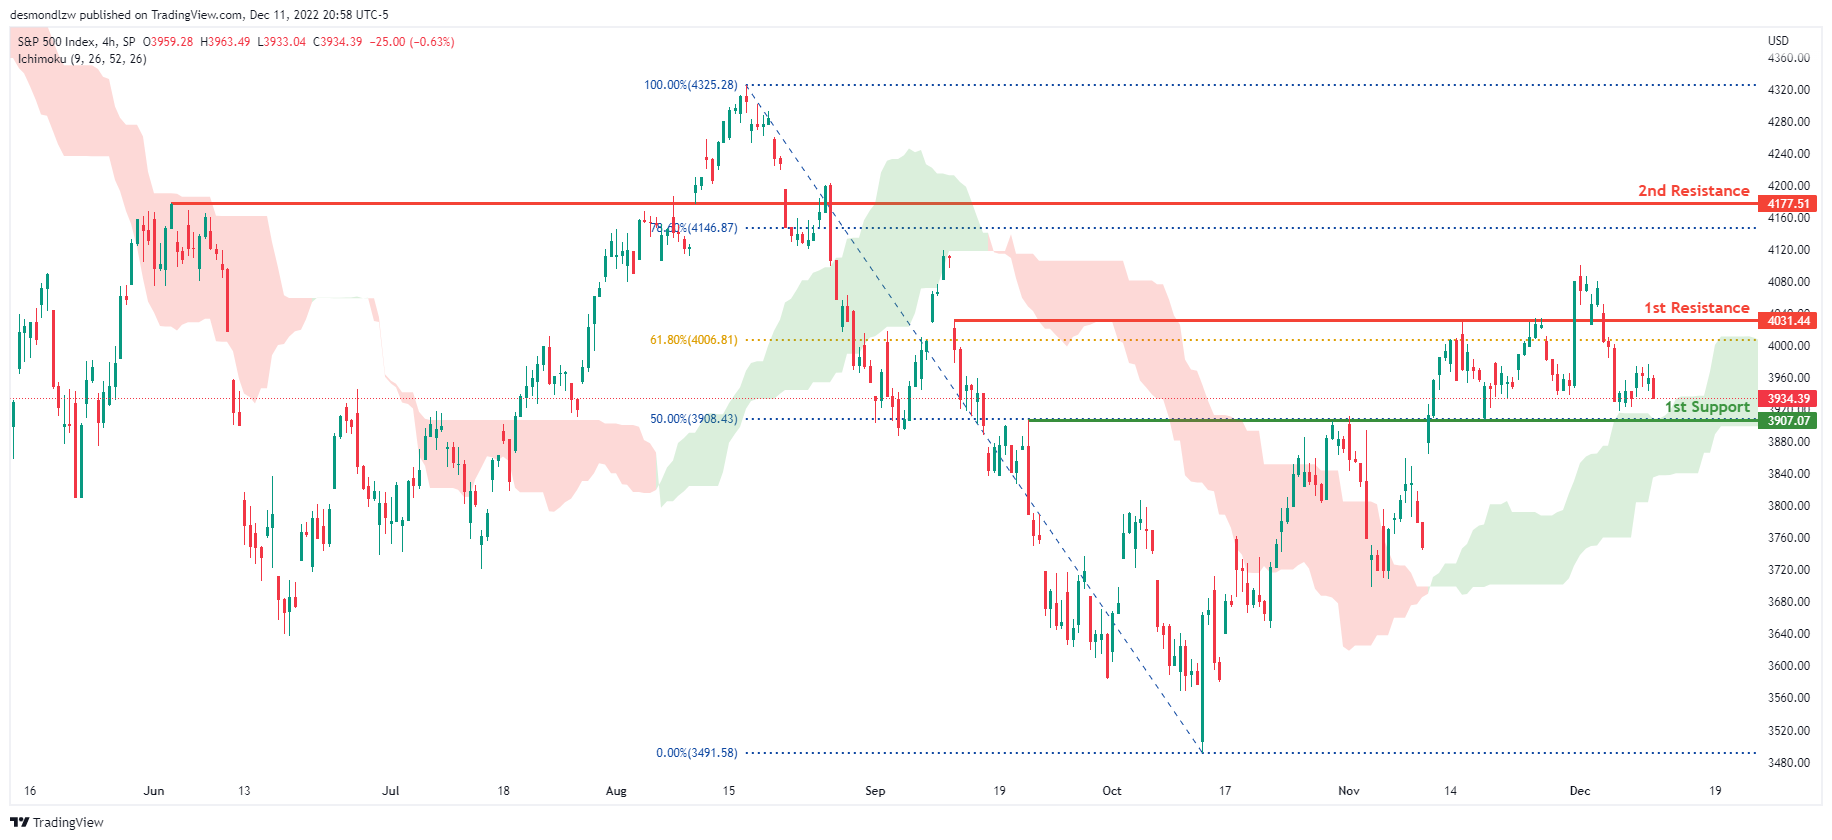
The overall bias for the S&500 on the H4 chart is bullish, with prices above the Ichimoku cloud. If the bullish momentum continues, the expected price to head towards the 1st resistance line is at 4031.44, where the 61.8% Fibonacci line is located. In an alternate scenario, price could return to the 1st support line at 3907.07, where the 50% Fibonacci line is located.
Areas of consideration:
- H4 time frame, 1st support at 3907.07
- H4 time frame, 1st resistance at 4031.44
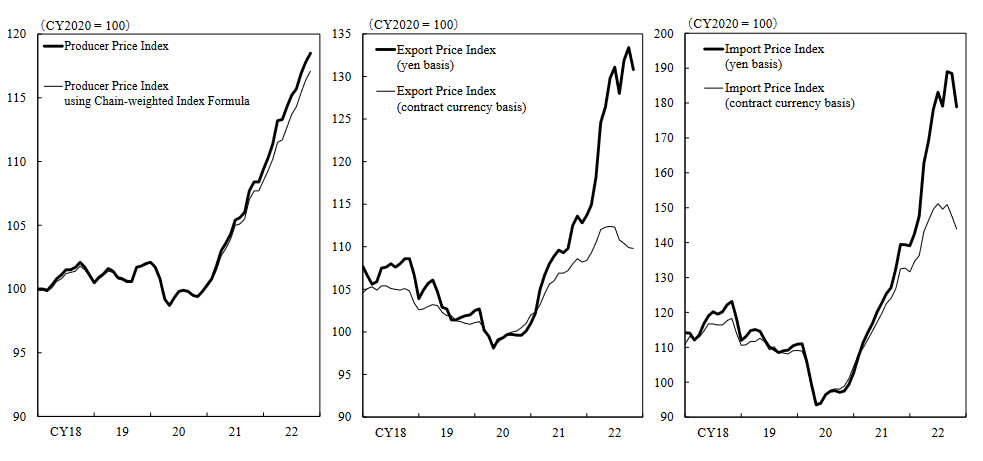
Japan PPI slowed to 9.3% yoy in Nov, global commodity prices easing
Japan corporate goods price index, PPI, slowed from 9.4% yoy to 9.3% yoy in November, above expectation of 8.9% yoy. The index, at 118.5, was a record high. Yen-based import price index slowed notably from 42.3% yoy to 28.2% yoy.
"Companies were passing on rising raw material costs for a broad range of goods. But some goods saw the impact of recent easing of global commodity prices," a BOJ official told a briefing.
Also from Japan, MoF's Business Survey Index for all large industries rose from 0.4 to 0.7 in Q4. BSI large manufacturing, however, dropped from 1.7 to -3.6. BSI large non-manufacturing improved form -0.2 to 2.7. BSI medium all industries rose from -2.2 to 4.7. BSI small all industries rose from -15.9 to -6.0.
EUR/USD Poised for Additional Gains, Oil Price Takes Hit
Key Highlights
- EUR/USD could rise further above the 1.0585 resistance zone.
- A key bullish trend line is forming with support near 1.0485 on the 4-hours chart.
- GBP/USD aims an upside break above the 1.2350 resistance zone.
- Crude oil price extended its decline below the $73.50 support.
EUR/USD Technical Analysis
The Euro started a steady increase above 1.0420 against the US Dollar. EUR/USD even traded above the 1.0500 to move into a positive zone.
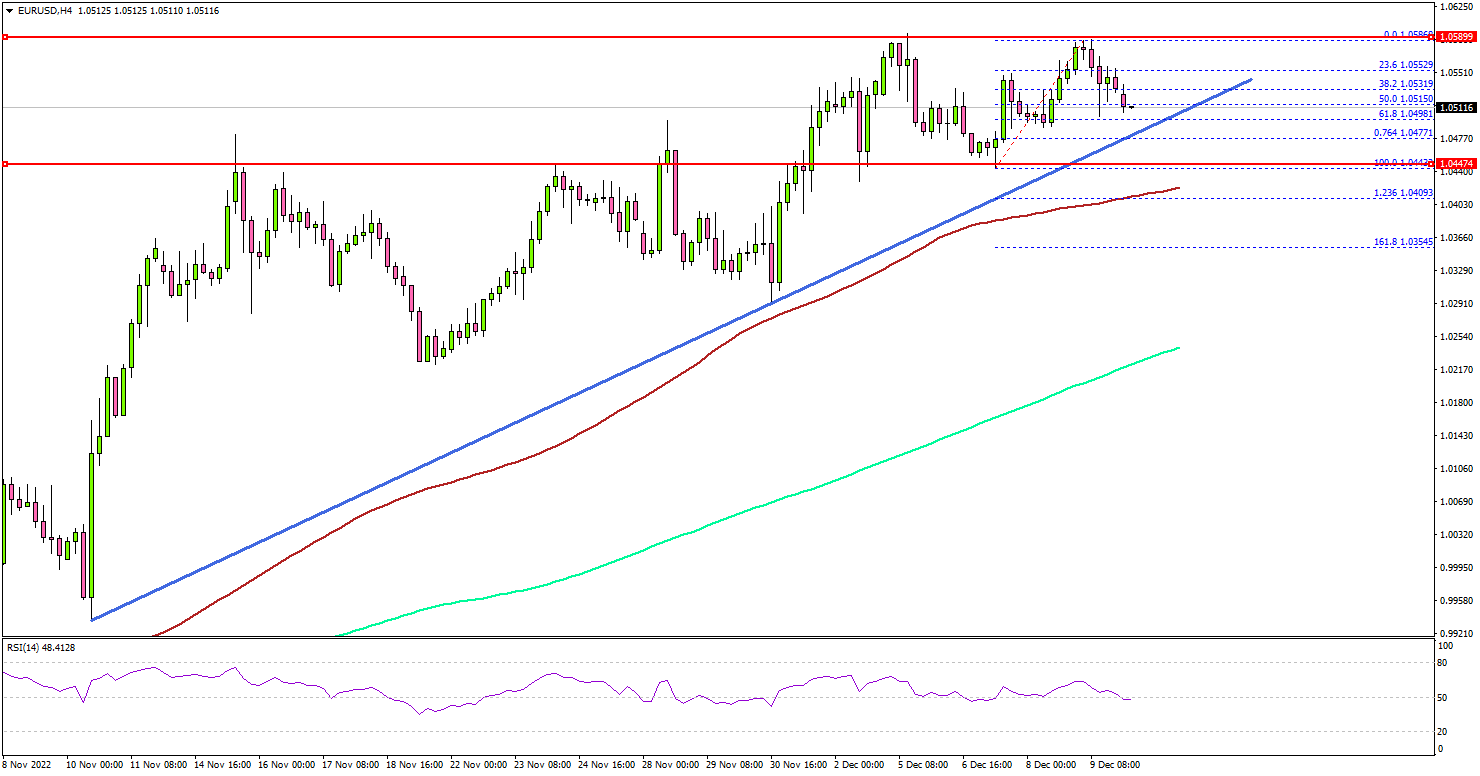
Looking at the 4-hours chart, the pair gained pace above the 1.0520 level. The pair even settled above the 1.0450 level, the 100 simple moving average (red, 4-hours), and the 200 simple moving average (green, 4-hours).
It traded as high as 1.0586 before the bears appeared. The pair is now consolidating gains above the 1.0500 level. An initial support is near the 1.0500 level. The next major support is near the 1.0480 zone.
There is also a key bullish trend line forming with support near 1.0485 on the same chart. Any more losses might send the pair towards the 1.0400 support zone and the 100 simple moving average (red, 4-hours).
On the upside, the pair is facing resistance near the 1.0550. The next major resistance may perhaps be near 1.0585. A clear move above the 1.0585 resistance might start another decent increase.
In the stated case, EUR/USD may perhaps test 1.0650. Any more gains could set the pace for a move towards the 1.0700 resistance zone.
Looking at crude oil price, there was a clear move below the $73.50 support and now there is a risk of more losses in the near term.
Economic Releases
- UK Industrial Production for Oct 2022 (MoM) - Forecast -0.3%, versus +0.2% previous.
- UK Manufacturing Production for Oct 2022 (MoM) - Forecast -0.1%, versus 0% previous.
OIL ($CL_F) Elliott Wave : Forecasting The Decline From Equal Legs Area
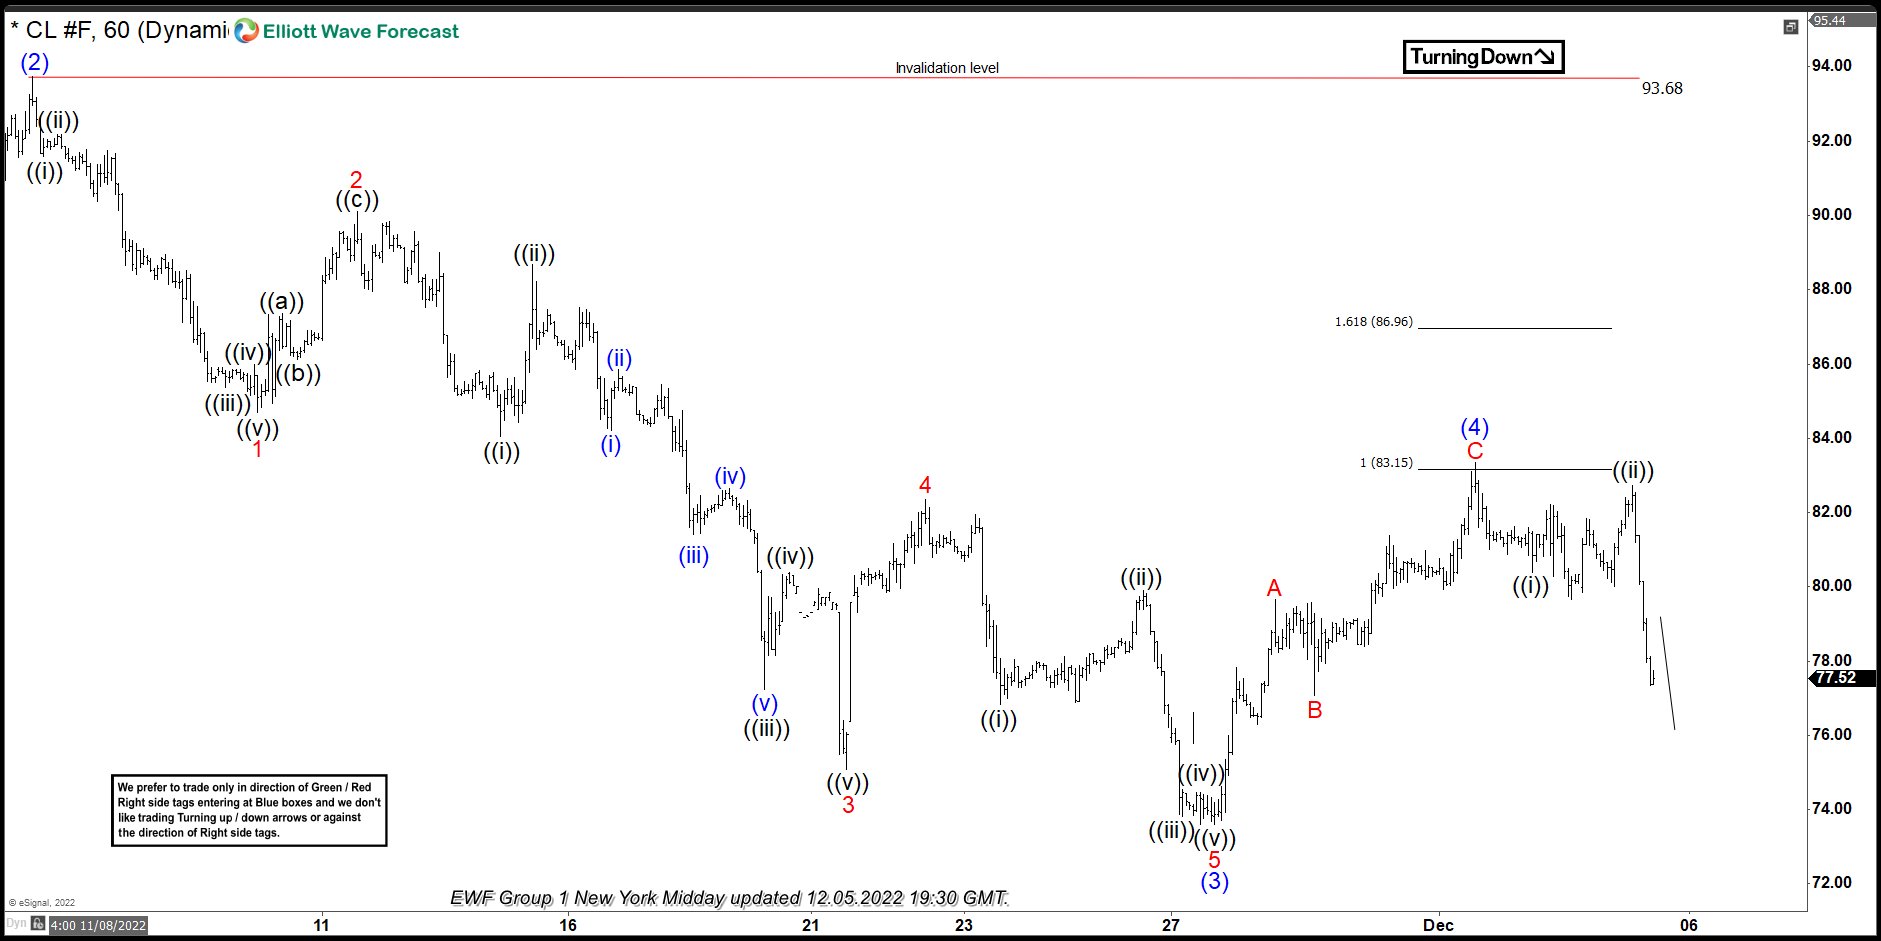
Hello fellow traders. In this technical blog we’re going to take a quick look at the Elliott Wave charts of OIL . As our members know, break of 09/27 low made incomplete bearish sequences in the cycle from the June peak. Consequently we were calling for further extension down within the cycle. Recently the commodity has given us nice 3 waves bounce which found sellers right at equal legs area as we expected. In the further text we are going to explain the Elliott Wave Forecast
OIL H1 Elliott Wave Analysis 12.01.2022
OIL is correcting the short term cycle from the 93.74 peak. Recovery looks incomplete at the moment. The price is showing higher high sequences from the low, looking for extension up toward 83.18-86.98 area. At that zone buyers should be ideally taking profits and sellers can appear again. Consequently , we expect to see reaction from the marked area. Once OIL reaches mentioned area it should ideally make either decline toward new lows or larger 3 waves pull back at least.
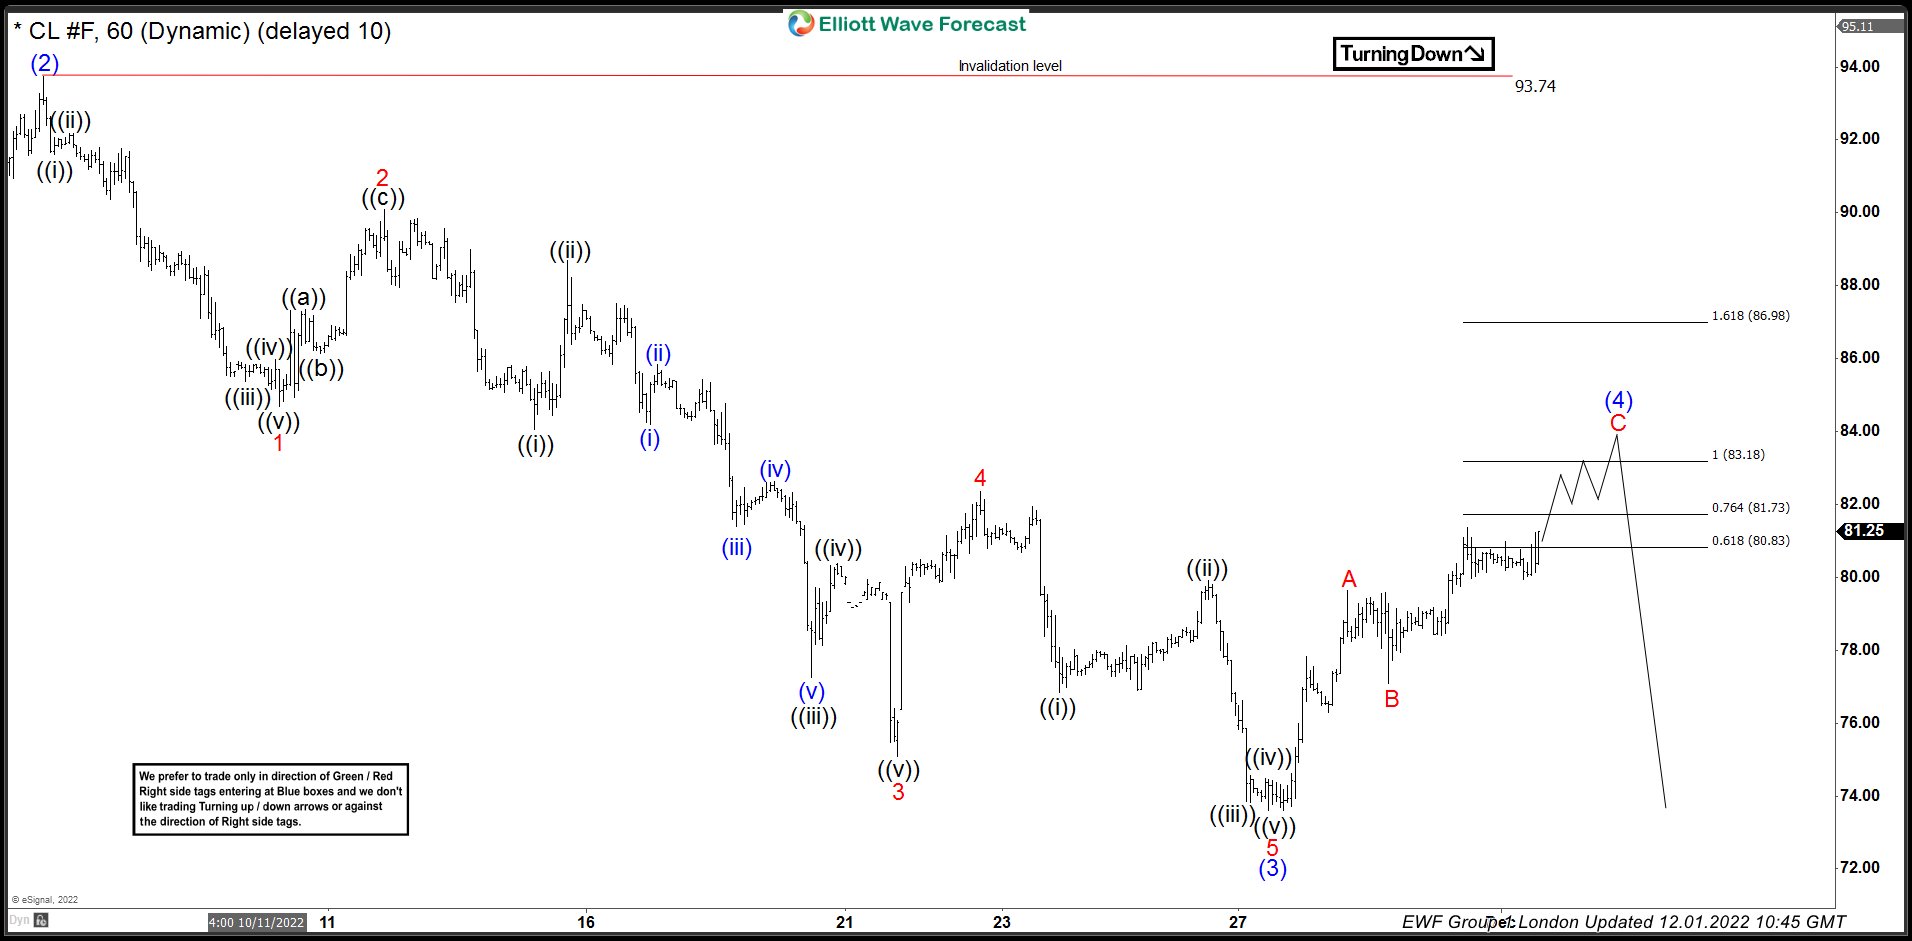
OIL H1 Elliott Wave Analysis 12.05.2022
Sellers appeared right at the marked extreme zone : 83.18-86.98 area and we got good reaction. Current view suggests (4) blue completed at 83.39 high. While below that high, we expect further decline to resume toward 71.28-67.57 area ideally.
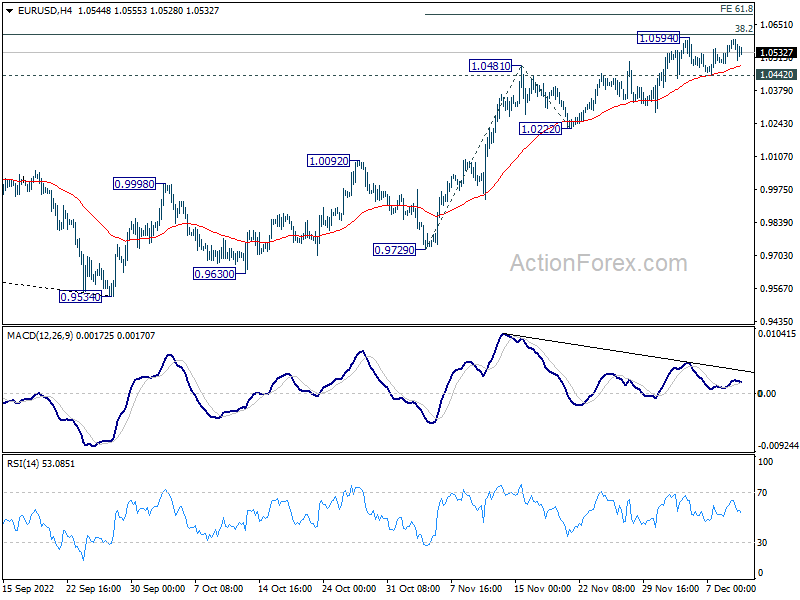
EUR/USD Weekly Outlook
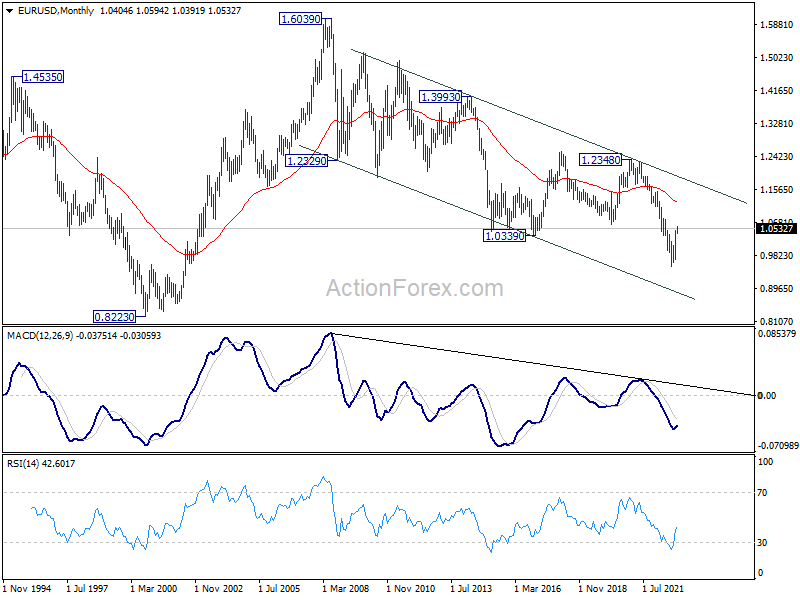
EUR/USD edged higher to 1.0594 last week but then turned sideway. Initial bias remains neutral this week first. On the downside, break of 1.0442 support will indicate rejection by 1.0609 fibonacci level. Bias will be back on the downside for 1.0222 support and below. However, firm break of 1.0594/0609 resistance zone will carry larger bullish implication. Next near term target is 61.8% projection of 0.9729 to 1.0481 from 1.0222 at 1.0687, and then 100% projection at 1.0974.
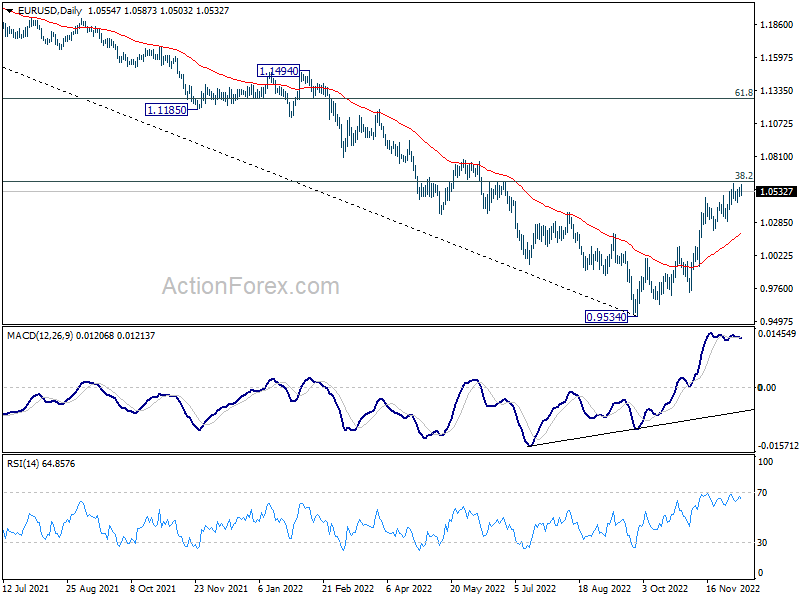
In the bigger picture, focus is now on 38.2% retracement of 1.2348 (2021 high) to 0.9534 at 1.0609. Rejection by 1.0609 will suggest that price actions from 0.9534 medium term bottom are developing into a corrective pattern. Thus, medium bearishness is retained for another fall through 0.9534 at a later stage. However, sustained break of 1.0609 will raise the chance of trend reversal and target 61.8% retracement at 1.1273.
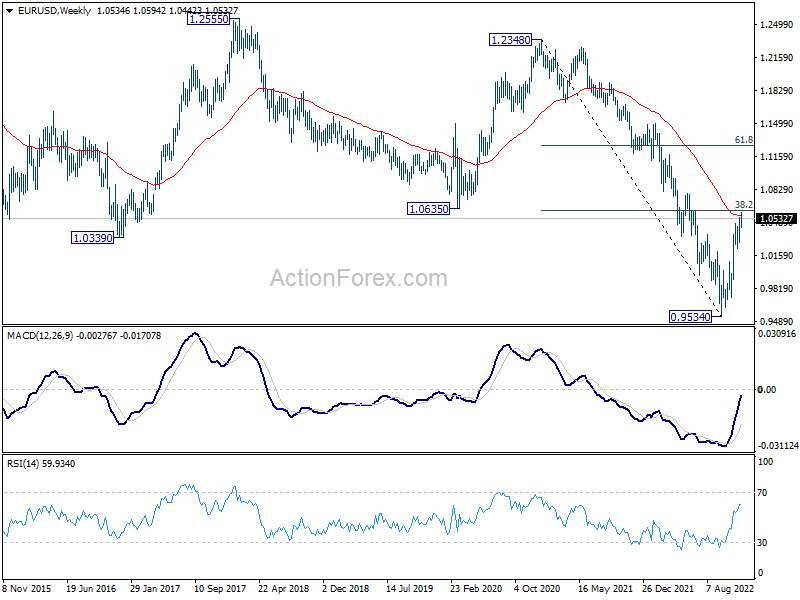
In the long term picture, as long as 1.0635 support turned resistance holds (2020 low), long term down trend from 1.6039 (2008) could still extend through 0.9534 at a later stage. However, sustained break of 1.0635 will confirm bottoming and at least turn long term outlook neutral.
USD/JPY Weekly Outlook
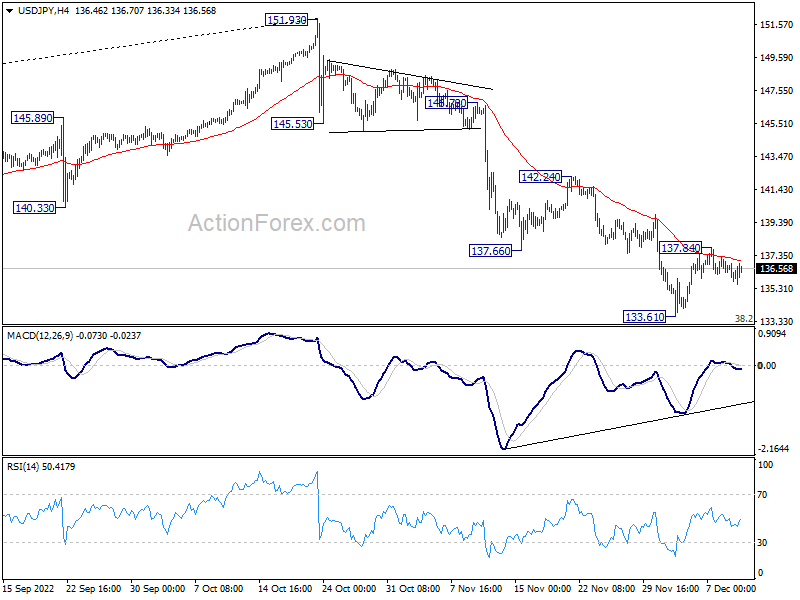
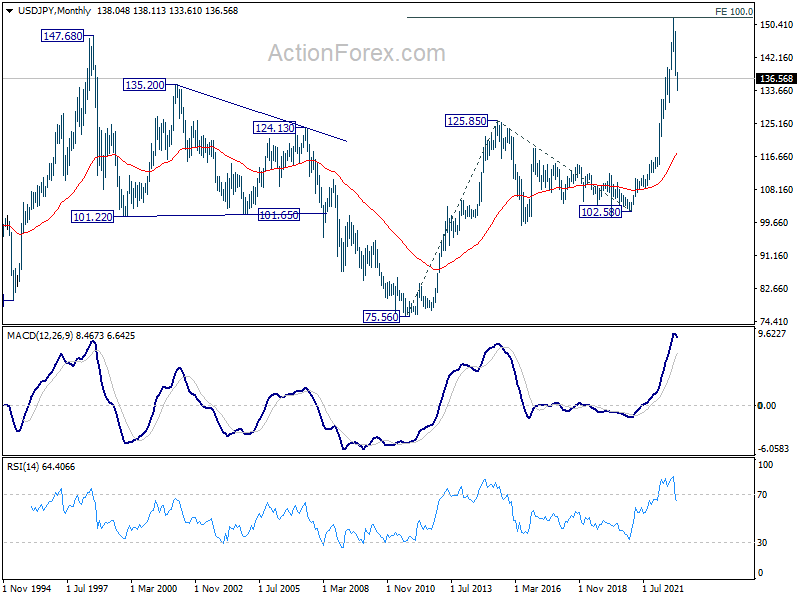
USD/JPY retreated after recovering to 137.84 but there was no clear downside momentum. Initial bias is neutral this week first. On the upside, break of 137.84 resistance will revive the case of short term bottoming at 133.61, and turn bias back to the upside for 55 day EMA (now at 141.02). However, break of 133.61 will resume the decline form 151.93 through 133.07 fibonacci level.
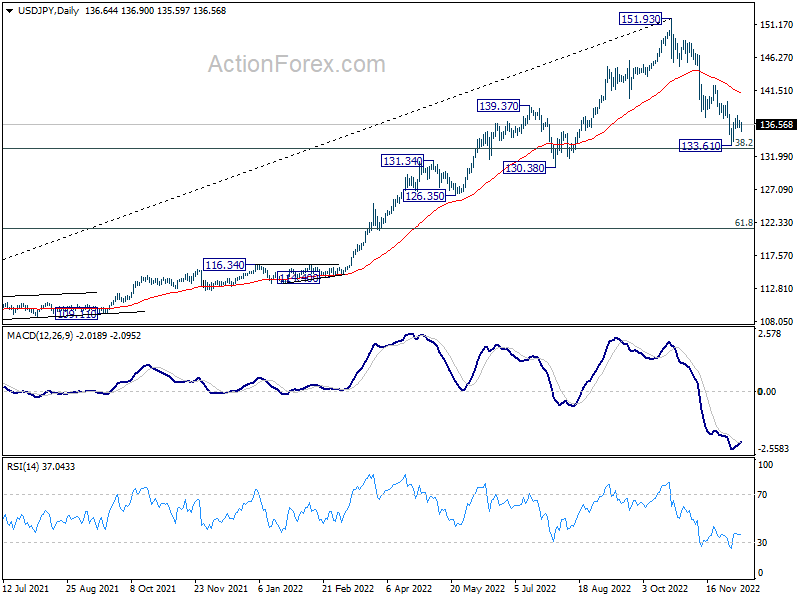
In the bigger picture, price actions from 151.93 medium term could be just a corrective pattern to up trend from 102.58 (2021 low). Strong support from 38.2% retracement of 102.58 to 151.93 at 133.07 and 55 week EMA (now at 131.52) will set the range for such corrective pattern. However, sustained break of 55 week EMA will pave the way to 61.8% retracement at 121.43.
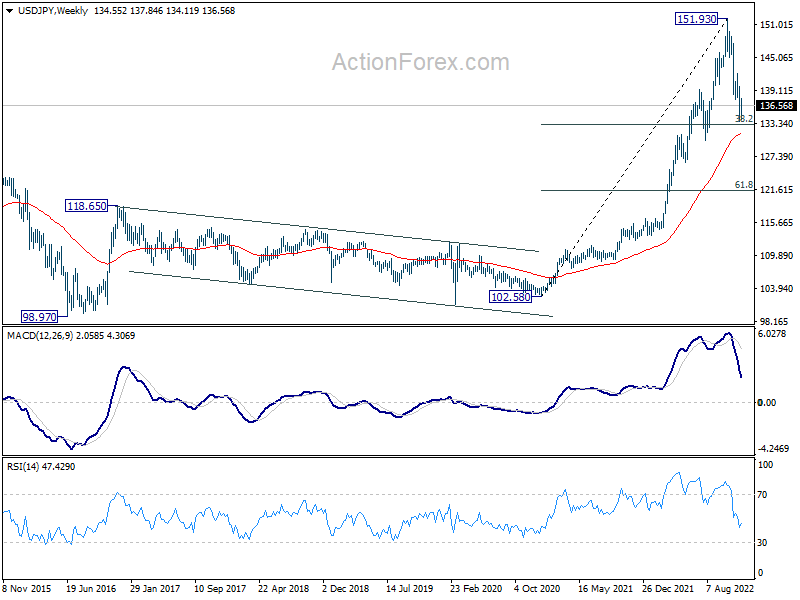
In the long term picture, rise from 102.58, as part of the up trend from 75.56 (2011 low) was put to a halt at 151.93, just ahead of 100% projection of 75.56 to 125.85 from 102.58 at 152.87. There is no clear sign of long term reversal yet. Such up trend is expected to resume at a later stage, as long as 125.85 resistance turned support holds.
GBP/USD Weekly Outlook
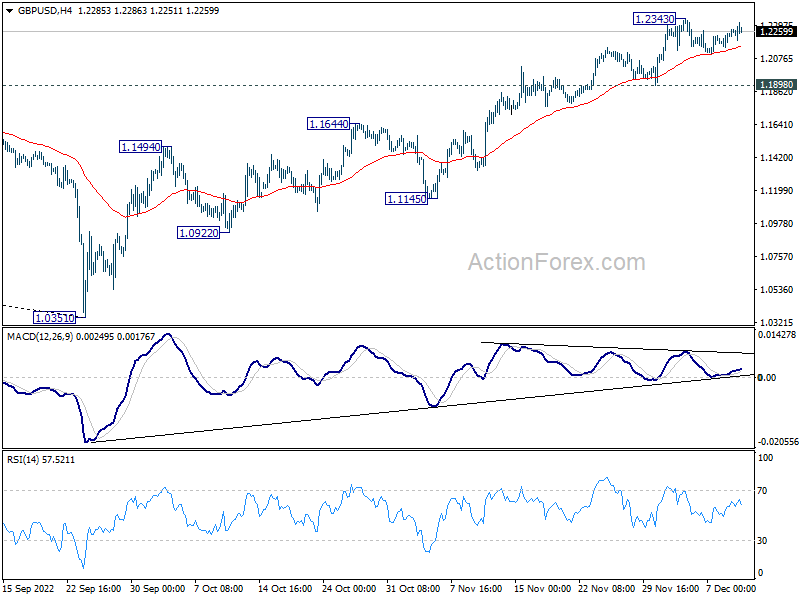
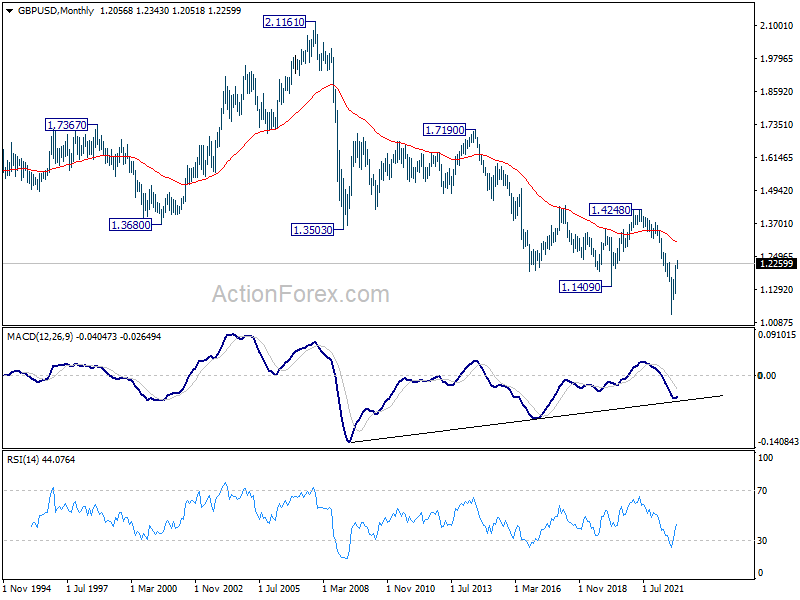
GBP/USD turned into sideway trading below 1.2343 last week. Initial bias stays neutral this week first, but further rally is expected as long as 1.1898 support holds. Break of 1.2343 will resume larger rally from 1.0351 and target 1.2759 medium term fibonacci level next. However, firm break of 1.1898 support will confirm short term topping and turn bias back to the downside.
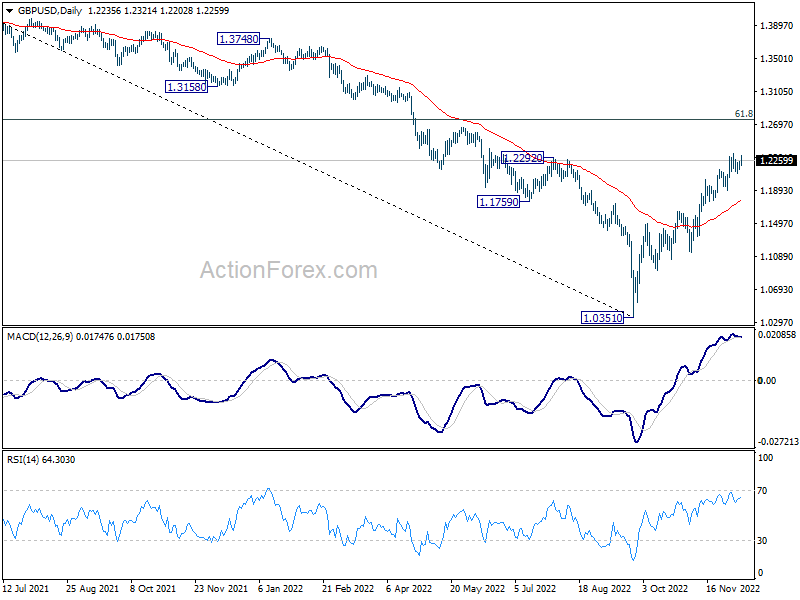
In the bigger picture, rise from 1.0351 medium term bottom is at least correcting whole down trend from 1.4248 (2021 high). Further rise is expected as long as 1.1644 resistance turned support holds. Next target is 61.8% retracement of 1.4248 to 1.0351 at 1.2759. Sustained break there will pave the way back to 1.4248.
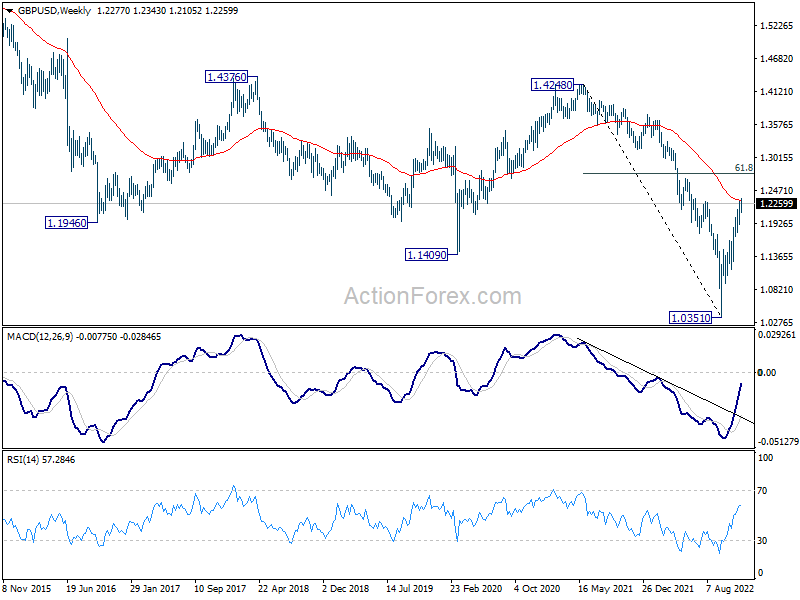
In the longer term picture, as long as 1.4248 resistance holds (2021 high), long term outlook will remain neutral at best. Down trend from 2.1161 (2007) could still resume for another low through 1.0351 at a later stage.
USD/CHF Weekly Outlook
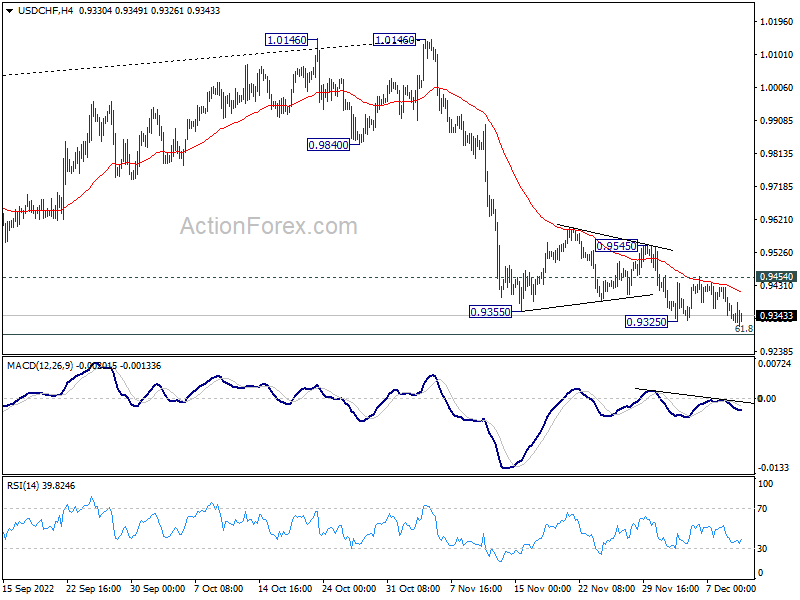
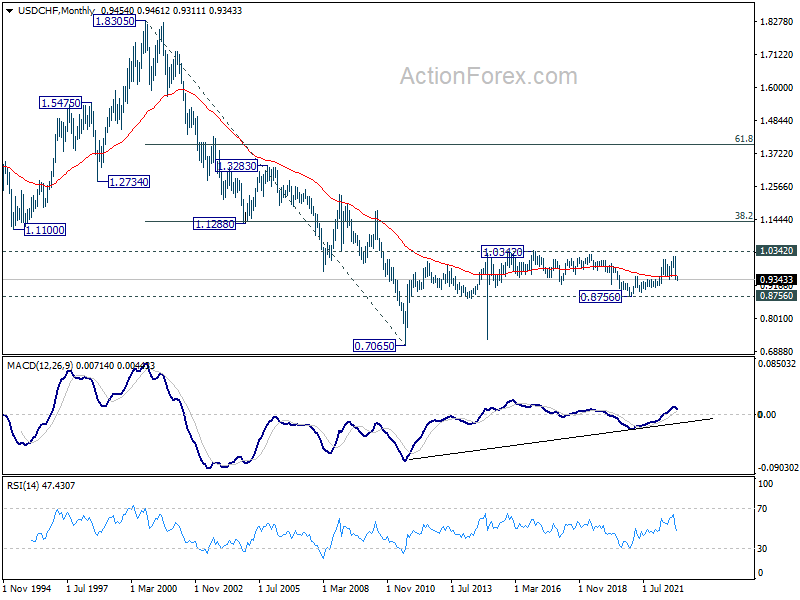
USD/CHF's fall from 1.1046 resumed by breaching 0.9325 last week. Immediate focus is now on 0.9287 fibonacci level this week. Decisive break there will target 0.9149 structural support next. On the upside, though, break of 0.9454 resistance will now indicate short term bottoming. Intraday bias will be turned back to the upside for 0.9545 resistance and above.
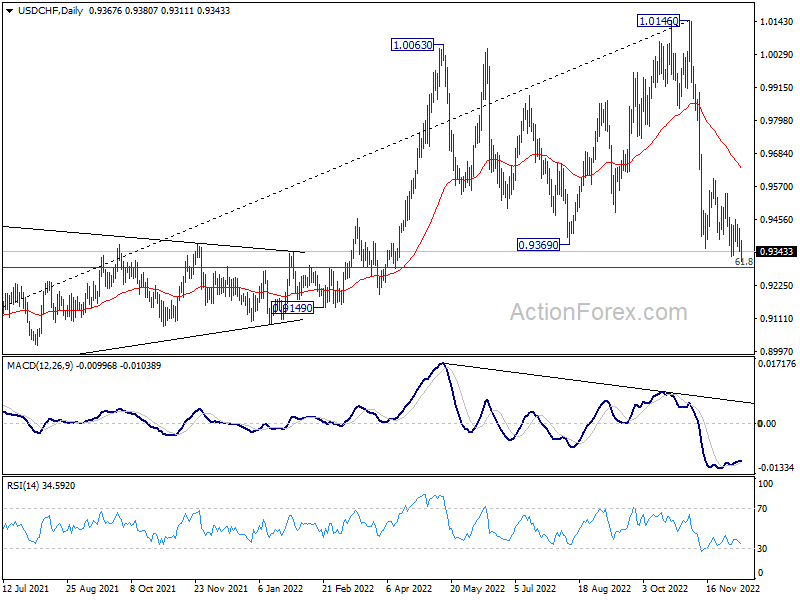
In the bigger picture, rise from 0.8756 (2021 low) has completed at 1.0146, well ahead of 1.0342 long term resistance (2016 high). Based on current downside momentum, fall from 1.0146 might be a medium term down trend itself. Sustained break of 61.8% retracement of 0.8756 to 1.0146 at 0.9287 will pave the way to 0.8756. In any case, risk will stay on the downside as long as 55 day EMA (now at 0.9630) holds.
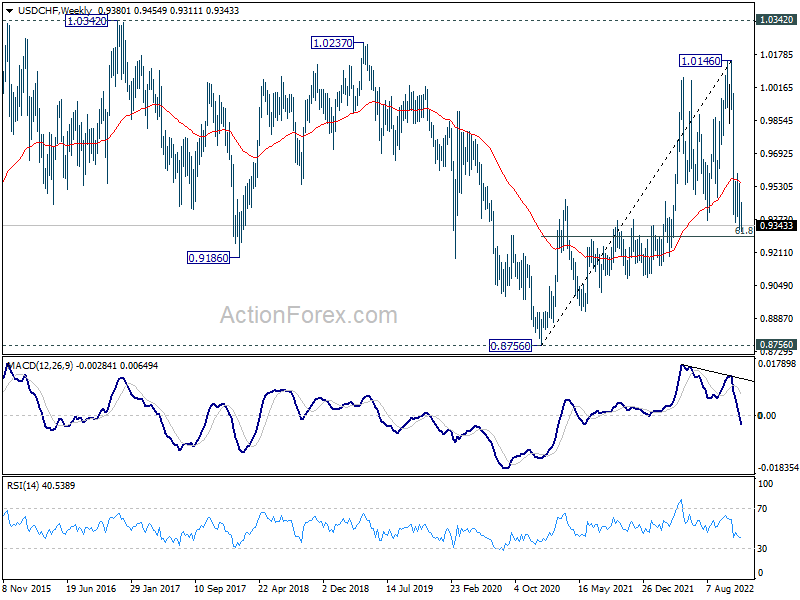
In the long term picture, long term sideway pattern from 1.0342 (2016 high) is extending and it's probably in another medium term down leg. Downside will likely be contained by 0.8756 support in case of deeper fall. Overall, range trading should continue until further development.
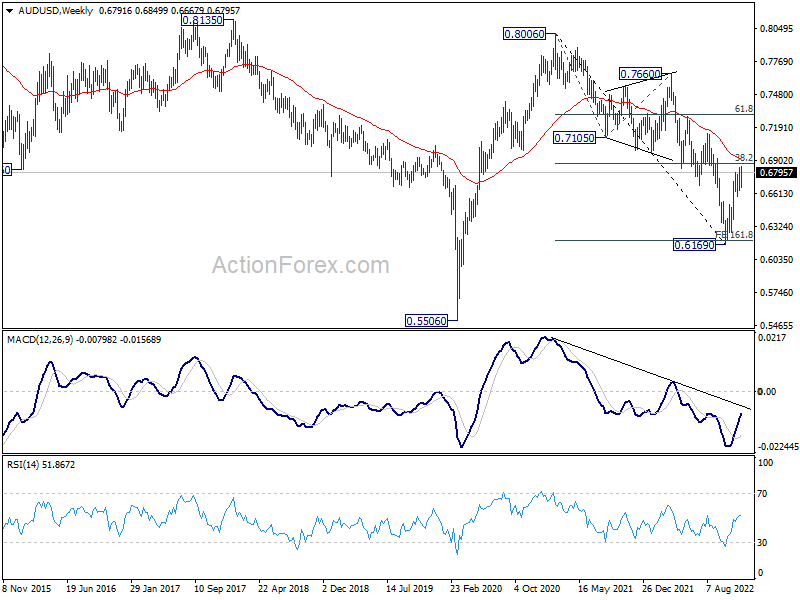
AUD/USD Weekly Outlook
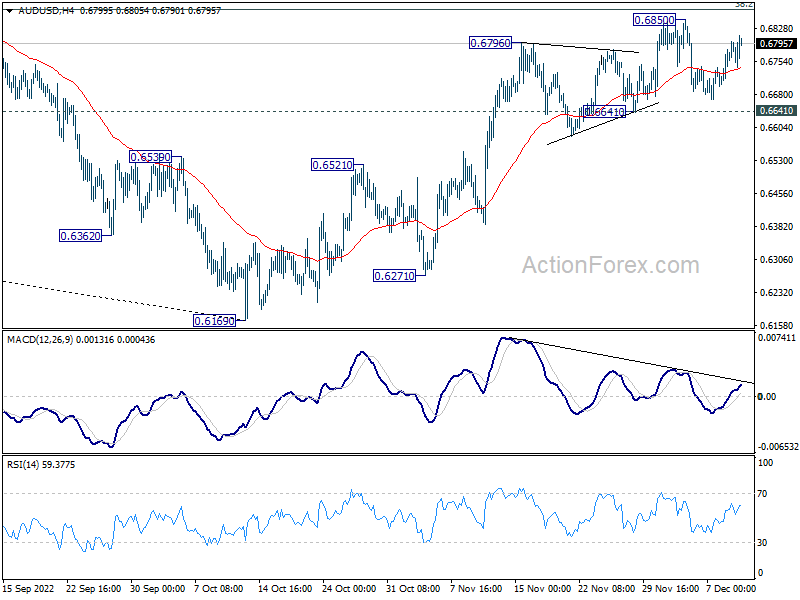
AUD/USD stayed in range of 0.6641/0.6850 last week and outlook is unchanged. Initial bias stays neutral this week first. On the downside, break of 0.6641 should confirm rejection by 0.6871 resistance. Intraday bias will be back on the downside for 0.6521 resistance turned support. However, sustained break of 0.6871 will extend the rise from 0.6169 to 55 week EMA at 0.6922.
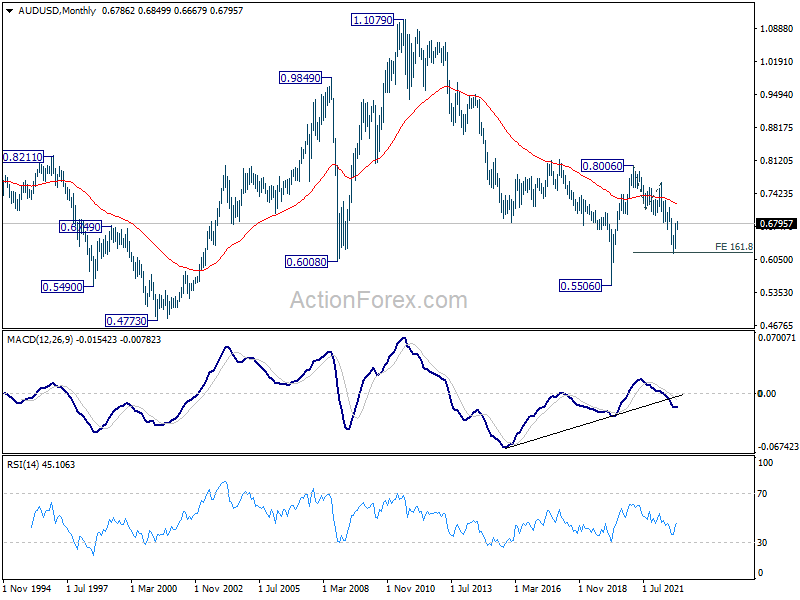
In the bigger picture, it's still unsure if price actions from 0.6169 medium term bottom are developing into a corrective pattern or trend rejection. Rejection by 38.2% retracement of 0.8006 to 0.6169 at 0.6871 will maintain medium term bearishness for another fall through 0.6169 at a later stage. However, firm break of 0.6871, and sustained trading above 55 week EMA (now at 0.6922) will raise the chance of the start of a bullish up trend.
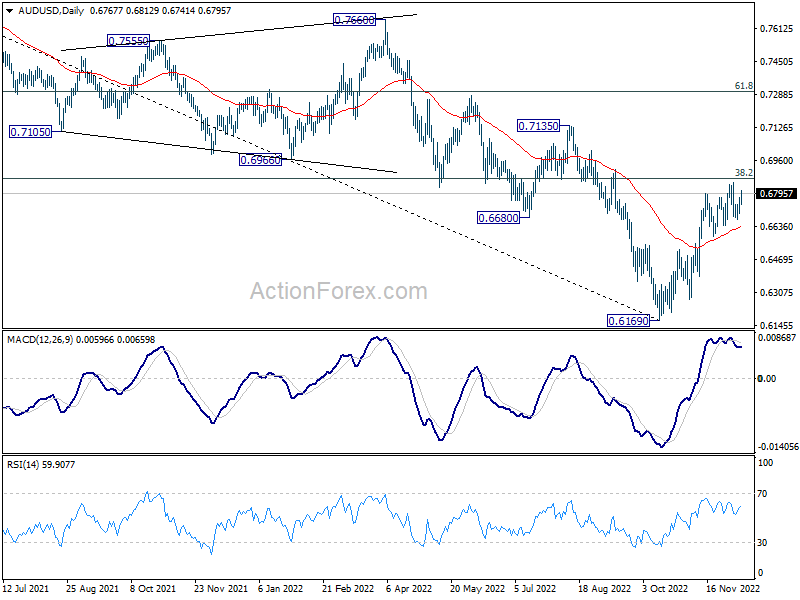
In the long term picture, the down trend from 0.8006 could still be seen as a corrective move, considering that it failed to break through 161.8% projection of 0.8006 to 0.7105 from 0.7660 at 0.6202 decisively. Strong rebound from current level will keep long term outlook neutral first. However, sustained break of 0.6202 will open up deep fall to retest 0.5506.