Sample Category Title
Trade Idea: Gold Breakdown
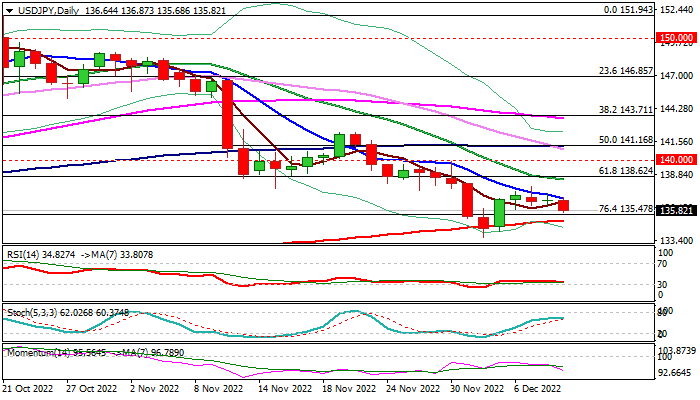
A comparative examination of the strength of the US-Dollar often gives tangible insight into the direction of Gold (XAUUSD). The chart above indicates the expectation of a bullish price reaction from the demand zone. Increased strength for the Dollar simply implies possible bearish reactions for Gold. With this in mind, let's take a look at the Gold (XauUsd) chart.
XAUUSD - DAILY
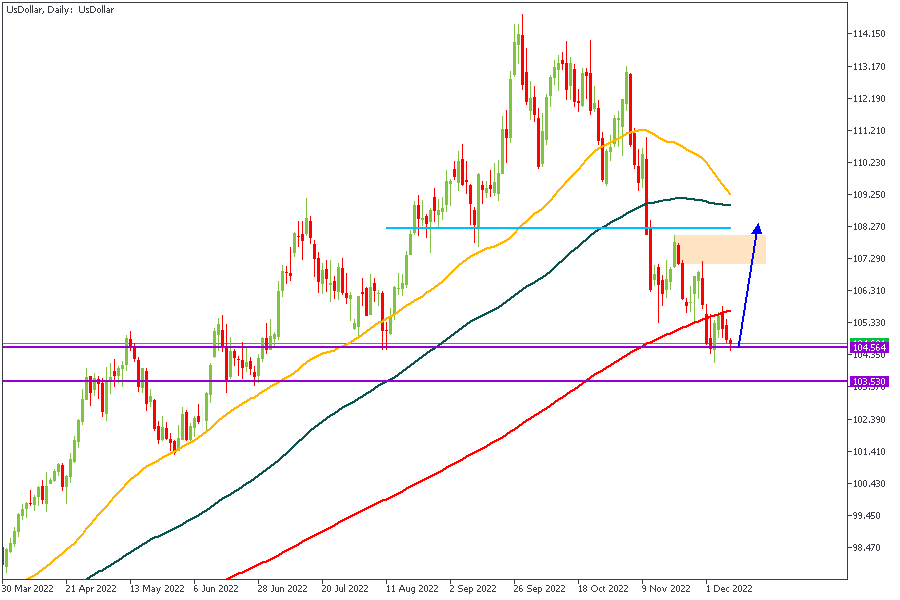
The daily timeframe presents an interesting scenario with the joint confluence of the Pivot zone and the drop-base-drop supply zone - not to forget the 200-Day Moving Average too. These factors line up perfectly in favour of a bearish reversal from the marked zone. Let's take a deeper dive into the lower timeframe price action though.
H4 TIMEFRAME
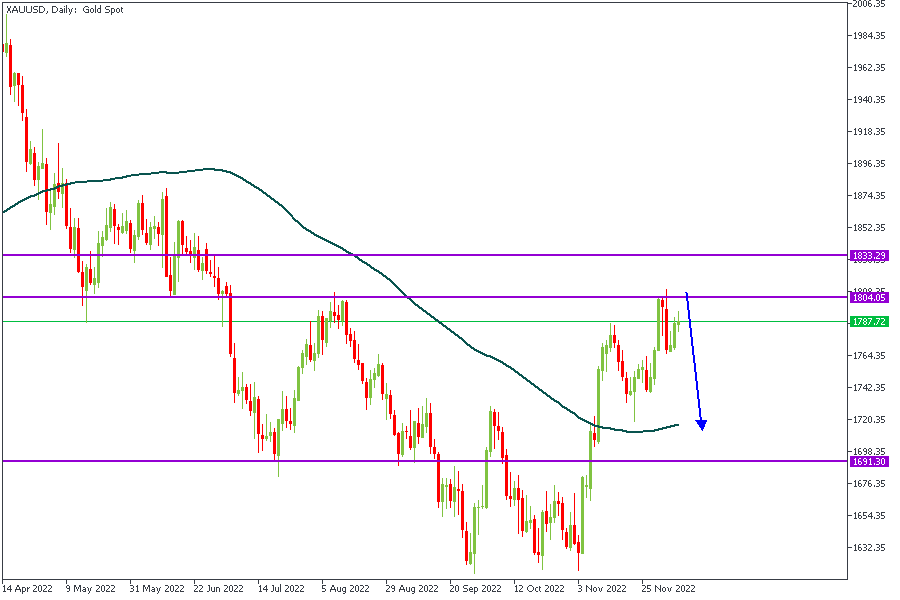
The 4-Hour timeframe shows price wedged between two trendlines but a lower timeframe view makes an even clearer impression.
H1 TIMEFRAME
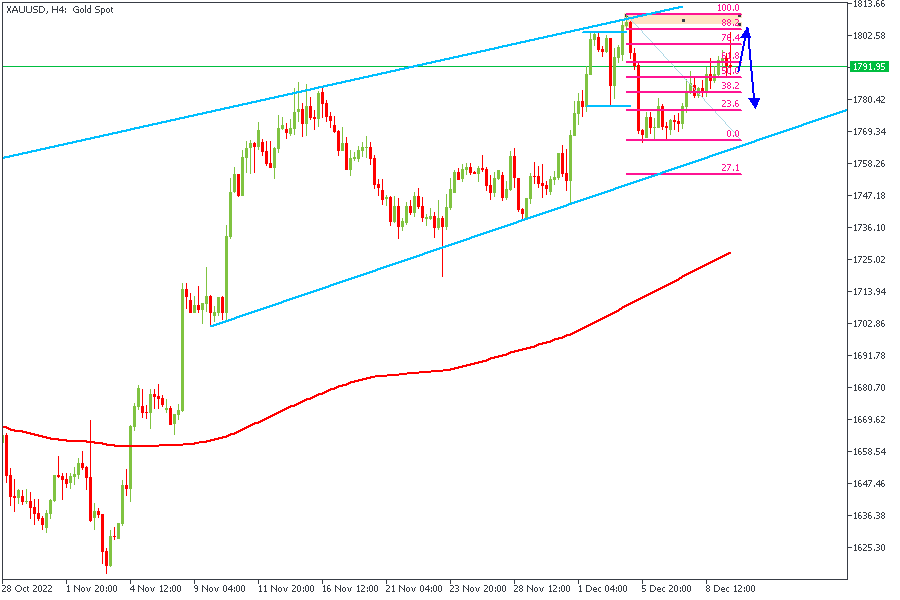
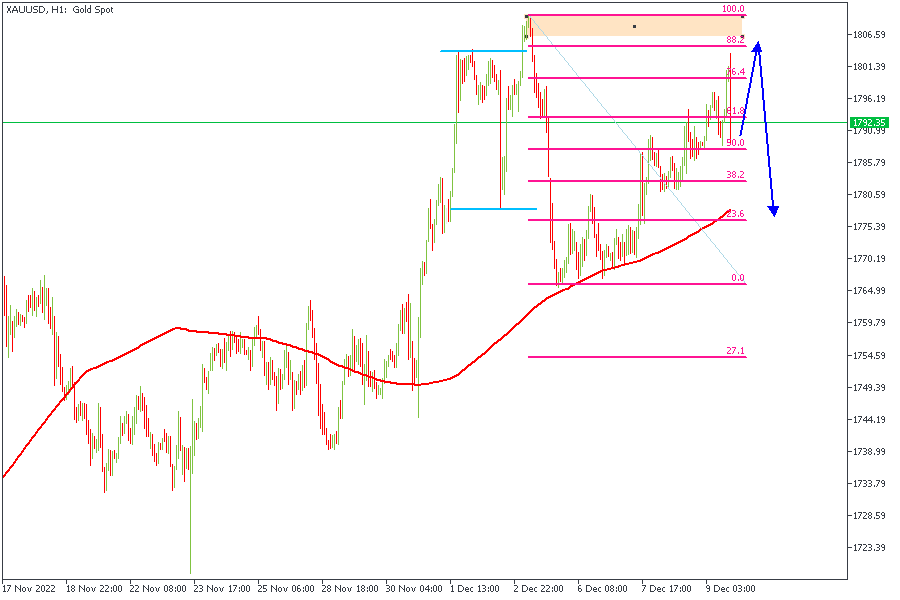
Here on the H1, price seems to be creating an AMD (Accumulation-Manipulation-Distribution) pattern over here which also serves as a bearish confirmation. Profit targets are; 1785, 1765, and 1755.
CONCLUSION
It is important to understand that the trading of CFDs comes at risk; if not properly managed, you may lose all of your trading capital. To avoid costly mistakes while you look to trade these opportunities, be sure to do your own due diligence and manage your risk appropriately.
Sunset Market Commentary
Markets
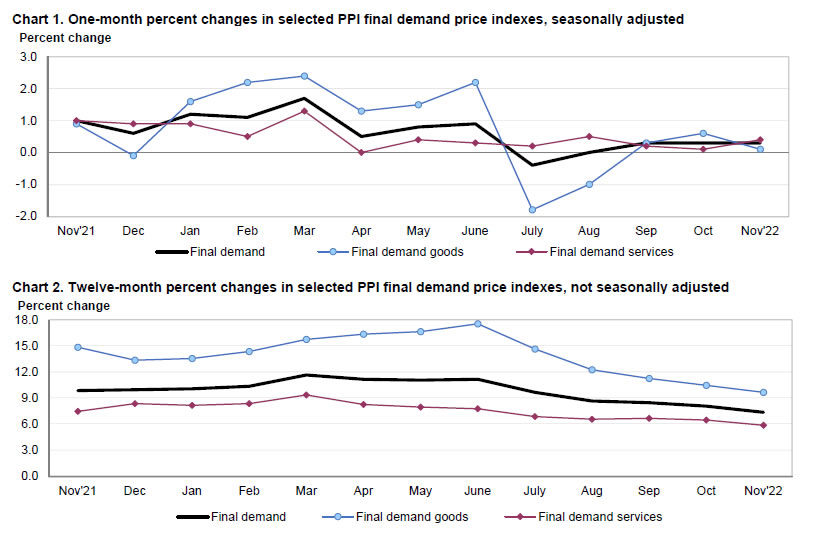
With no eco data with market moving potential scheduled for release in the EMU, European fixed income traders kept a close eye on how much TLTRO funding banks had returned at the second early repayment window since the ECB changed conditions on the loans at the October meeting. After repaying a rather modest €296 bln in November banks this week returned € 447.5 bln of loans out of an outstanding amount surpassing €1.8 tn. Together with a smaller tranche maturing this month, the outstanding amount of TLTRO’s will decline to €1.32 tn. A reduction in excess liquidity and the repayment freeing collateral in theory should reduce demand for high-grade collateral. German Bonds today indeed underperformed both US Treasuries and EMU swaps. German yields traded 5/6 bps higher across the curve at the start of the US trading session. EMU swap yields at that time gained about 2/2.5 bps across the curve. Aside from this (admittedly important) technical ‘intermezzo’, one could expect US PPI data to be more important for the directional trend on global bond markets. US traders apparently anticipated a soft figure with yields easing a few bps in the run-up to the release. However, the soft bias this time didn’t pay off. US producer prices slowed less than expected with final demand PPI rising 0.3% M/M and 7.4% Y/Y (from 8.1% but 7.2% expected). The reaction was far from impressive, but the report at least prevented a further rally in US Treasuries. US yields currently vary between +1.5 bp (2-y) and + 7 bps (30-y). The US 10-y (3.52%) moves a bit further away from the 3.42% key support. German yields are gaining between 8/9 bps across the curve. The German 10-y yield (1.90%) will avoid a weekly close below the 1.77% neckline. Equities/US futures had to return earlier gains post-PPI. The EuroStoxx50 returned gains of 0.5% to currently trade little changed. US indices opened up to 0.75% lower (Nasdaq). Oil (Brent $76.6 p/b) continues to fight an uphill battle, losing more than 10% compared to last week’s close. After finishing this report the U. of Michigan consumer confidence (including measures in inflation expectations) still might change the course of events.
On FX markets, post-PPI USD gains, if any, remain modest. USD/JPY, despite a brief uptick even declines in a daily perspective (136.20 vs open at 136.67). EUR/USD is ceding a few ticks (1.0540 vs 1.0556 open). Surprisingly, sterling outperforms, both against the dollar (cable 1.2275) and the euro, with EUR/GBP revisiting the 0.86 big figure. The 0.8647/60 support area isn’t out of reach yet.
News Headlines
Norwegian headline inflation eased more than expected in November. The multi-decade high of 7.5% Y/Y eased to 6.5% on the back of a monthly price drop of 0.3% (+0.3% expected). Core inflation, critical for the Norges Bank in setting monetary policy, unexpectedly fell too, from 5.9% to 5.7%. While both measures missed estimates, they remain well below the Norges Bank’s own 5.4% and 5% forecasts respectively due to a series of earlier upside surprises. The central bank remains on track for a 25 bps rate hike at the policy meeting next week. It will also publishes new forecasts at that December meeting. Back in September, Oslo penciled in a 3% terminal rate to be reached in the winter. After a string of topside inflation surprises, markets raised their own expectations to 3.50% only to pare them back recently to 3.25%. The fall-out on the Norwegian krone is limited with EUR/NOK hovering around 10.54. Still, the krone already lost quite some ground over the past few days, in lockstep with oil prices.
China held its annual “1+6” dialogue, involving talks with heads of the IMF, World Bank, OECD, WTO and others. Speaking after the meeting, IMF’s Georgieva said economic indicators suggest further downgrades to global growth are likely. She added that China’s recalibration of its Covid policies would help growth both domestically and elsewhere, echoing comments made by OECD’s Cormann. Malpass from the World Bank expressed concerns of a world at risk of a global recession, with a long-term crisis looming especially in developing countries. He said more needs to be done to lift the world out of stagflation and that China will have to reduce its excess stocks of food and fertilizer to alleviate shortages elsewhere. Okonjo-Iweala (World Trade Organisation) said global trade was losing momentum, expecting it to only grow 1% next year from 3.5% this year.
Trade Idea: Is the US Dollar’s Struggle Over Yet?
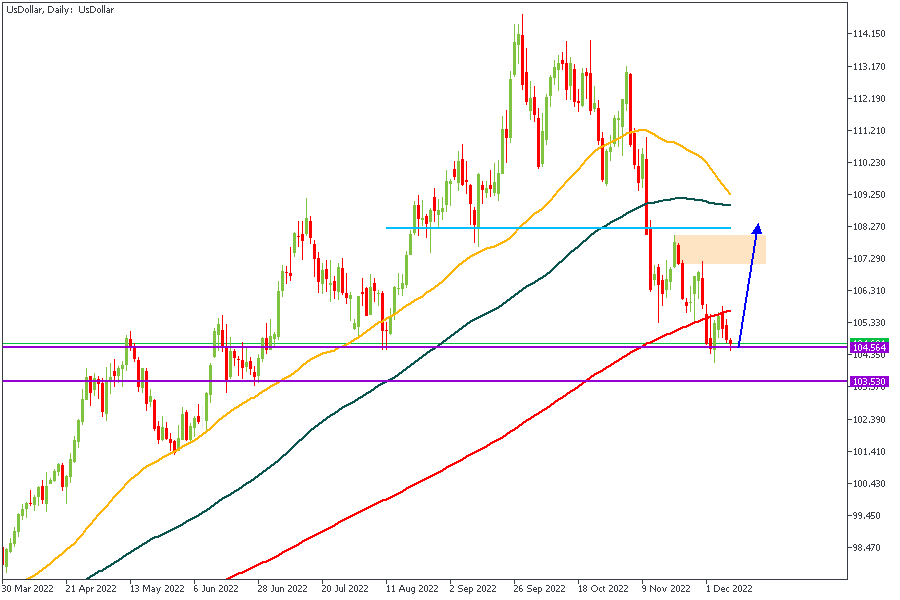
The US Dollar has been remarkably sluggish for the past few weeks despite being within a distinct Demand zone. My expectation of a springing rebound off the demand zone has not exactly played out yet, however, the zone remains unbroken. This means I can still uphold my bias for as long as the demand zone remains intact.
GBPUSD
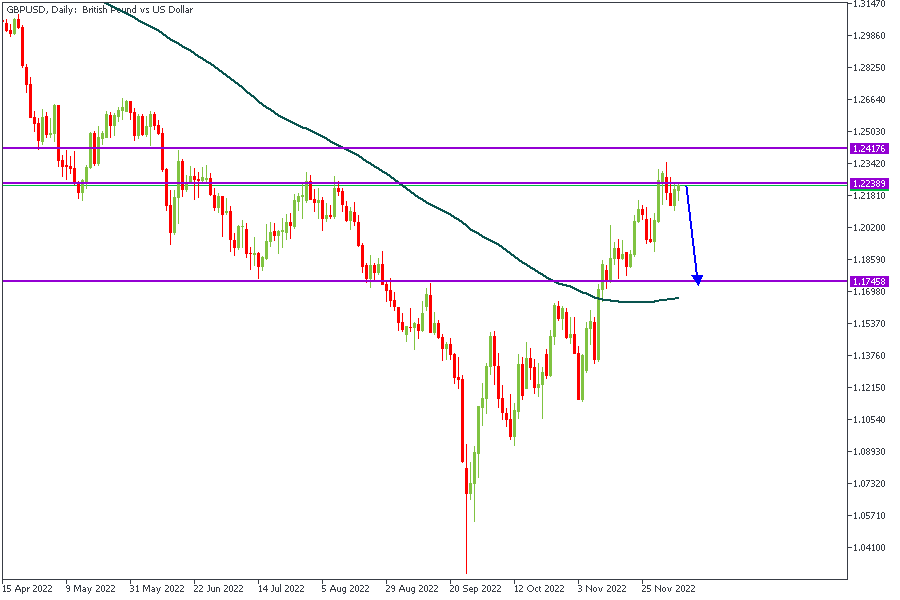
GBPUSD is still cycling around the rally-base-drop supply zone. My expectation is that price pushes down at least to the 1.20200 area - the final target being the marked line at 1.17458. It is also crucial to note that the marked supply zone doubles also as a PIVOT zone (or flip zone).
EURUSD
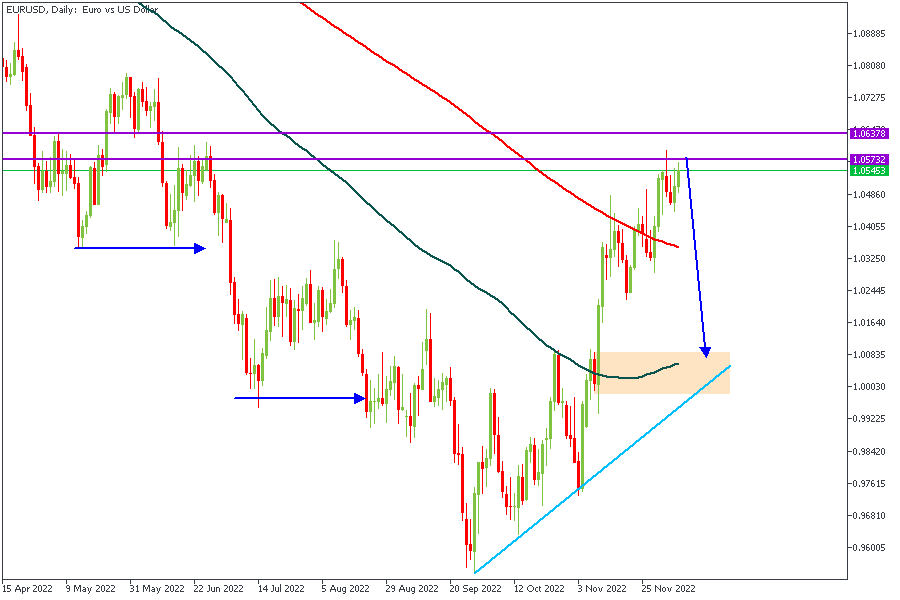
The marked zone between 1.06378 and 1.05732 constitutes the preferred point of entry. There is a visible PIVOT zone that also overlaps with the rally-base-drop supply zone from the first BoS (Break of Structure). As a result, we can expect price to drop from the area of entry with profit targets at; 1.04055, 1.03250, and finally 1.00835.
USDCAD
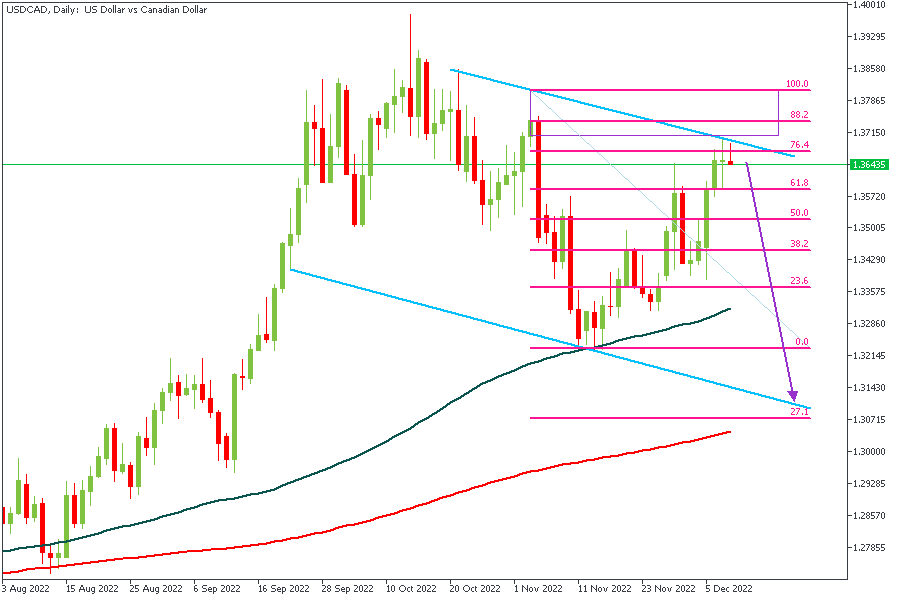
USDCAD is trading inside a descending channel on the Daily timeframe. The Fibonacci retracement level can also be seen aligning perfectly with the rally-base-drop supply zone which intersects with the trendline resistance of the descending channel. These confirmations indicate a high chance of a bearish rejection from the marked zone with targets at; 1.33650, 1.32500, and 1.30900
USDJPY
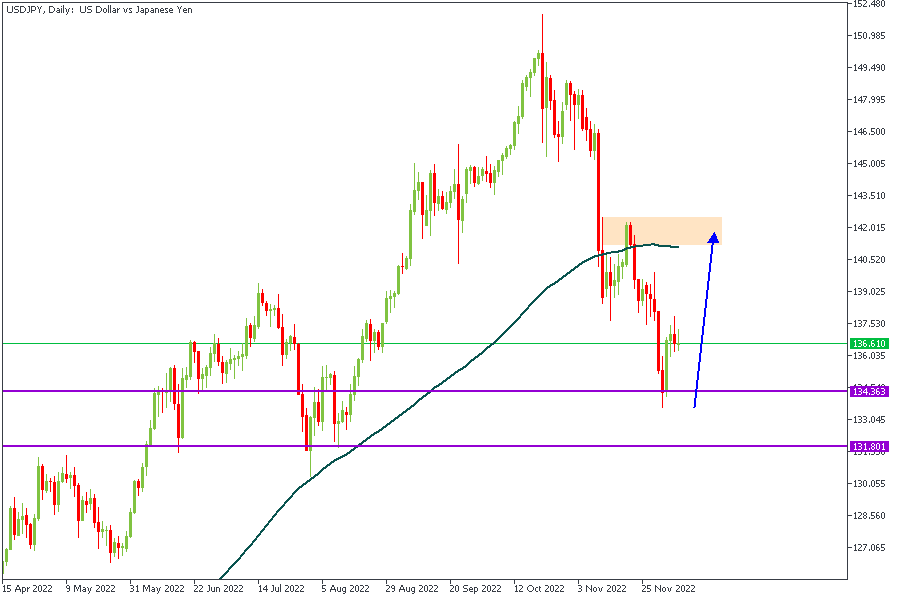
Personally, I expect to see USDJPY make a run for the highlighted zone around the 142 price area, however, the journey may not begin as plainly as it ought. Price could initially stagger back toward the demand zone before finally yielding the bull run.
USDCHF
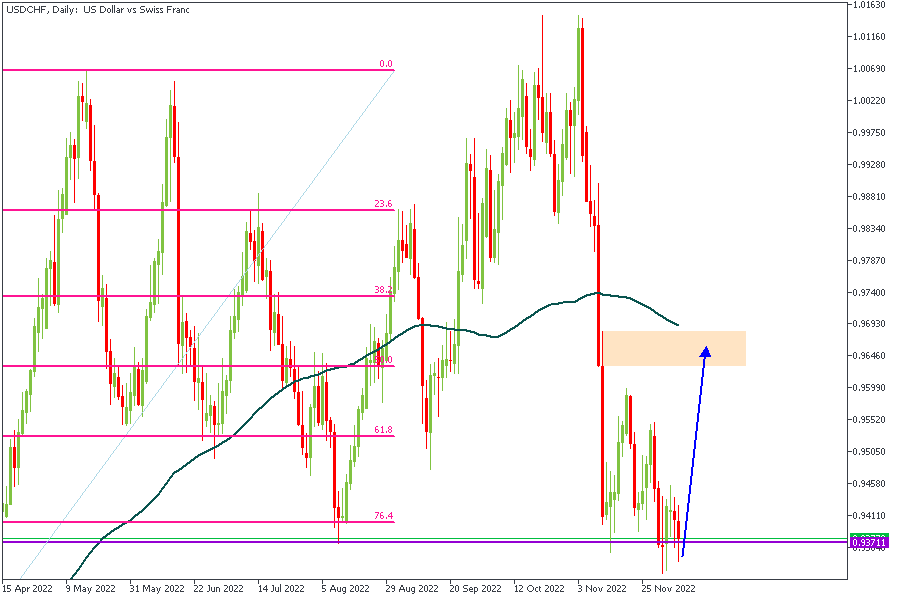
The arrow indicates my bias and expectation based on the daily timeframe price reaction from the demand zone. The major target is 0.96460.
NZDUSD
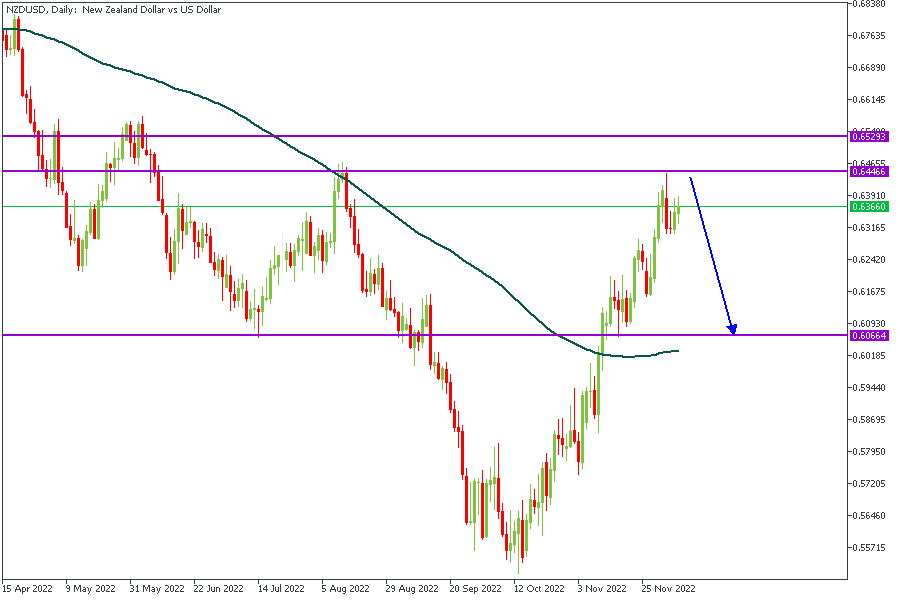
NZDUSD has reached a flip zone and is expected to dip lower toward the 100-Day Moving Average. It should also be noted that the marked supply zone is right within the vicinity of the 200-Day Moving Average.
CONCLUSION
It is important to understand that the trading of CFDs comes at risk; if not properly managed, you may lose all of your trading capital. To avoid costly mistakes while you look to trade these opportunities, be sure to do your own due diligence and manage your risk appropriately.
USD/JPY Mid-Day Outlook
Daily Pivots: (S1) 136.21; (P) 136.72; (R1) 137.20; More...
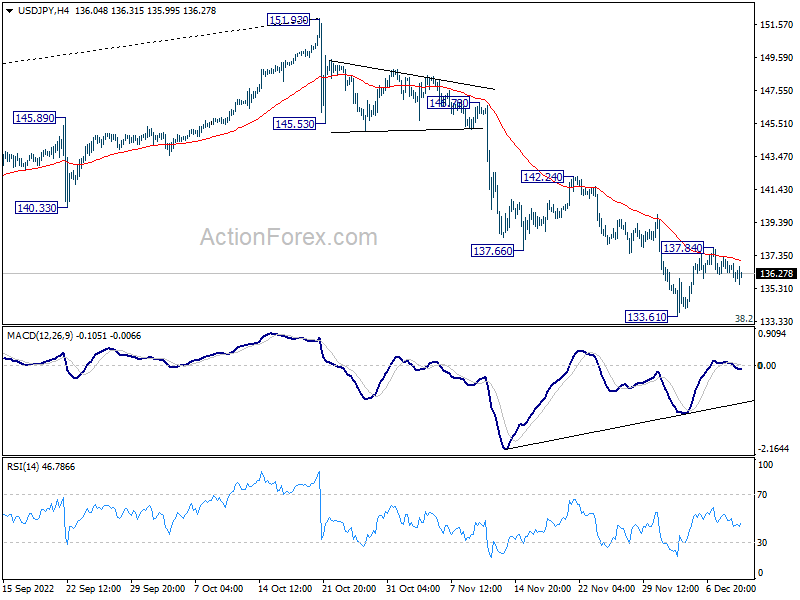
Intraday bias in USD/JPY remains mildly on the downside for retesting 133.61 low. Firm break there will resume the decline from 151.93. On the upside, above 137.84 resistance will revive the case of short term bottoming, and turn bias back to the upside for 55 day EMA (now at 141.02).
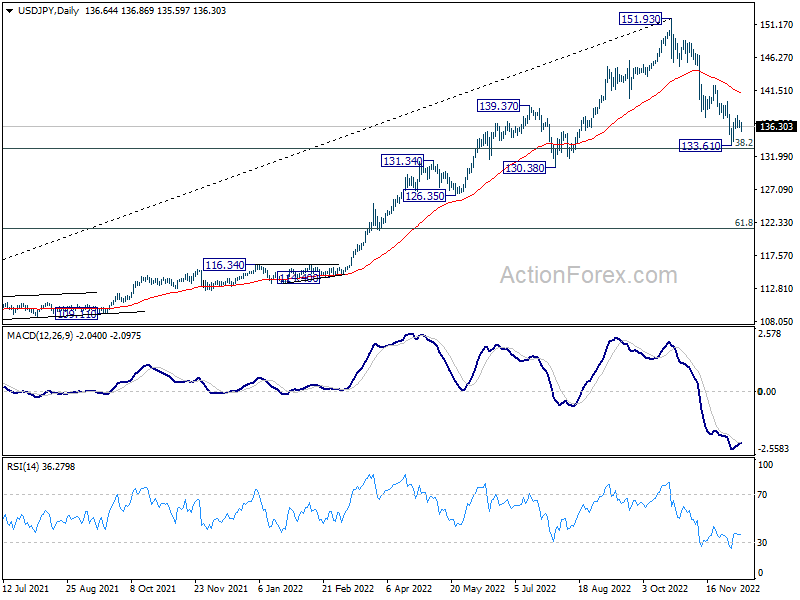
In the bigger picture, a medium term top should be formed at 151.93. Fall from there is correcting larger up trend from 102.58. It's too early to call for bearish trend reversal. But even as a corrective move, such decline should target 38.2% retracement of 102.58 to 151.93 at 133.07, or further to 55 week EMA (now at 131.33). Some support should be seen around this zone to bring rebound. However, sustained break of 55 week EMA will pave the way to 61.8% retracement at 121.43.
USD/CHF Mid-Day Outlook
Daily Pivots: (S1) 0.9329; (P) 0.9378; (R1) 0.9412; More...
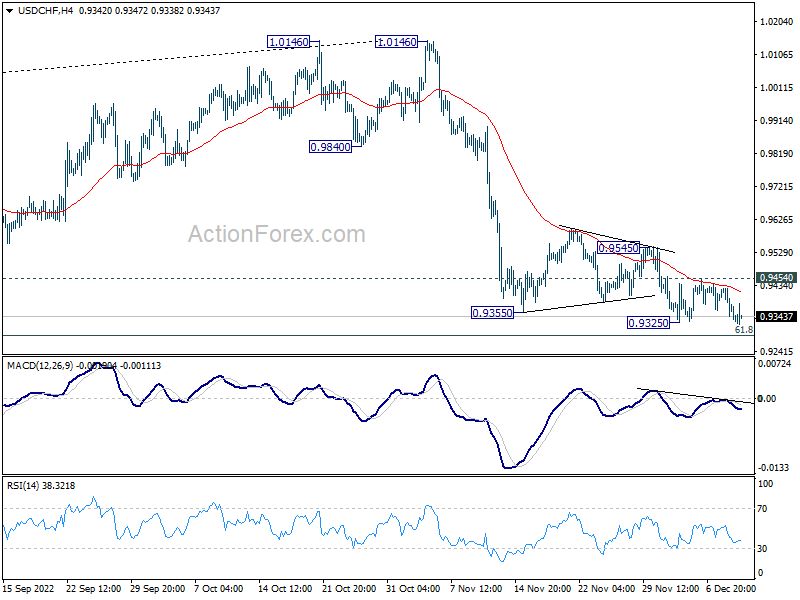
Outlook in USD/CHF is unchanged. Intraday bias stays neutral with focus on 0.9325 support. Firm break there will resume larger decline to 0.9287 fibonacci level. On the upside, however, break of 0.9454 resistance will now indicate short term bottoming. Intraday bias will be turned back to the upside for 0.9545 resistance and above.
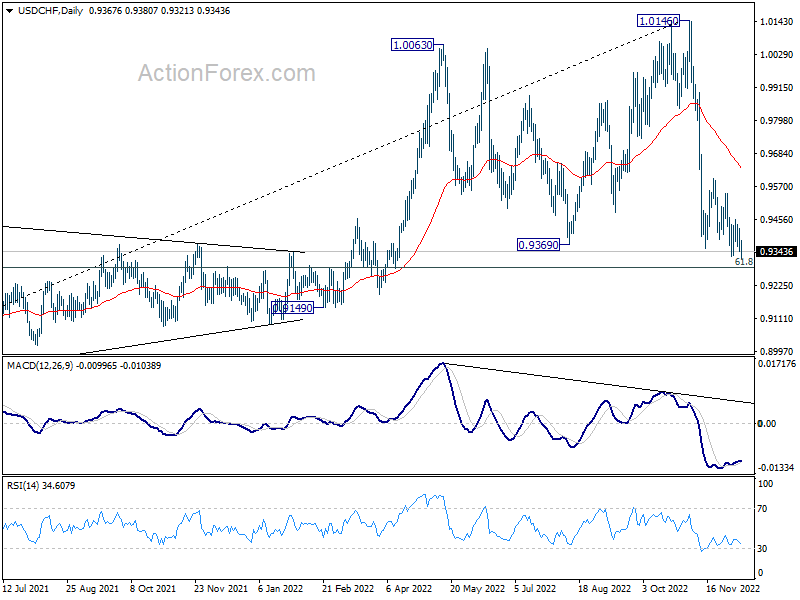
In the bigger picture, rise from 0.8756 (2021 low) has completed at 1.0146, well ahead of 1.0342 long term resistance (2016 high). Based on current downside momentum, fall from 1.0146 might be a medium term down trend itself. Break of 61.8% retracement of 0.8756 to 1.0146 at 0.9287 will pave the way to 0.8756. In any case, risk will stay on the downside as long as 55 day EMA (now at 0.9630) holds.
EUR/USD Mid-Day Outlook
Daily Pivots: (S1) 1.0508; (P) 1.0537; (R1) 1.0583; More...
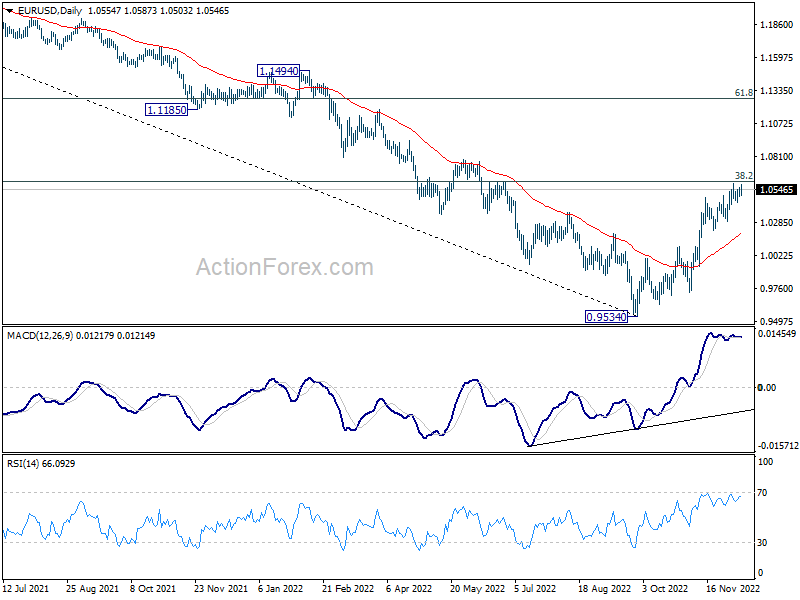
Intraday bias in EUR/USD remains neutral and outlook is unchanged. Firm break of 1.0594/0609 resistance zone will carry larger bullish implication. Next near term target is 61.8% projection of 0.9729 to 1.0481 from 1.0222 at 1.0687, and then 100% projection at 1.0974. Nevertheless, on the downside, break of 1.0442 support should confirm short term topping and turn bias back to the downside for 1.0222 support.
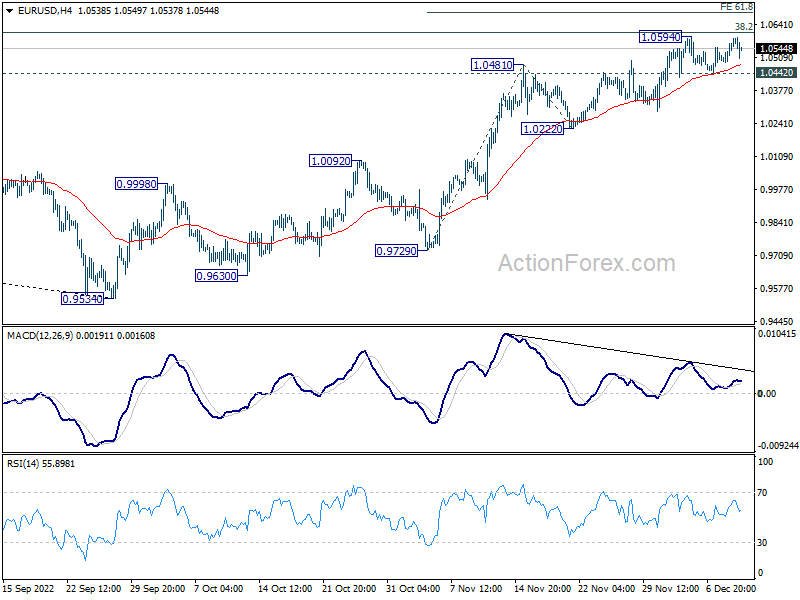
In the bigger picture, a medium term bottom was in place at 0.9534, on bullish convergence condition in daily MACD. Even as a corrective rise, rally from 0.9534 should target 38.2% retracement of 1.2348 (2021 high) to 0.9534 at 1.0609. Sustained trading above 55 week EMA (now at 1.0557) will raise the chance of trend reversal and target 61.8% retracement at 1.1273. However, rejection by 1.0609 will retain medium term bearishness for down trend resumption at a later stage.
GBP/USD Mid-Day Outlook
Daily Pivots: (S1) 1.2178; (P) 1.2213; (R1) 1.2271; More...
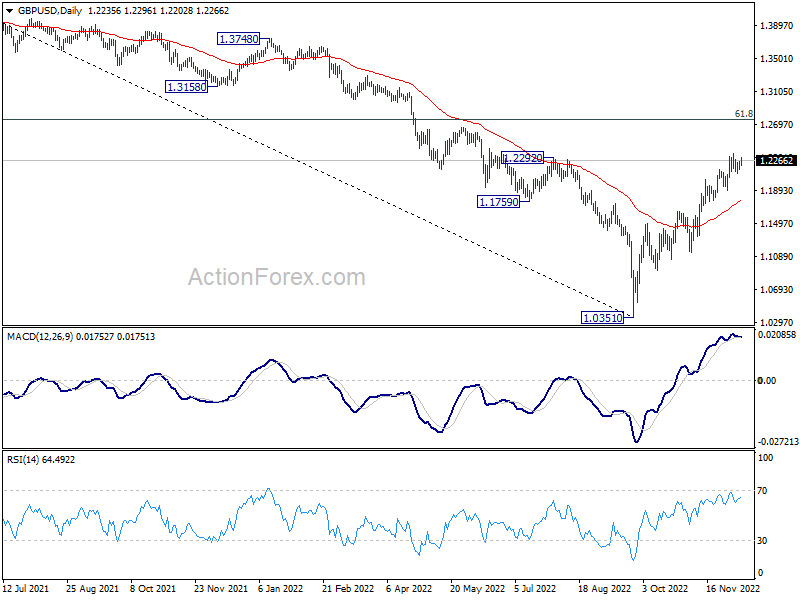
Intraday bias in GBP/USD remains neutral. Consolidation from 1.2343 could extend. But further rise remains mildly in favor as long as 1.1898 support holds. On the upside, break of 1.2343 will resume the rally from 1.0351 and target 1.2759 medium term fibonacci level next. However, firm break of 1.1898 support will confirm short term topping and turn bias back to the downside.
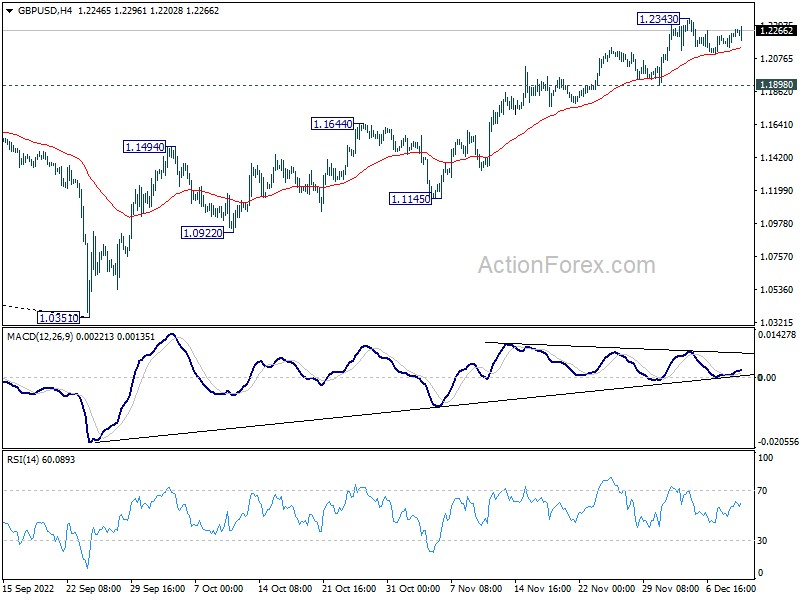
In the bigger picture, rise from 1.0351 medium term bottom is at least correcting whole down trend from 1.4248 (2021 high). Further rise is expected as long as 1.1644 resistance turned support holds. Next target is 61.8% retracement of 1.4248 to 1.0351 at 1.2759. Sustained break there will pave the way back to 1.4248.
Dollar Holding On in Subdued Trading
Dollar is trying to recover in early US session, with help from 10-year yield which reclaims 3.5% handle. Yet again there is now clear follow through buying. News flow is slow today, without much surprise from US PPI data. As Fed is already in a blackout period, there is no comment from US monetary policy makers. Trading would likely remain subdued, until FOMC rate decision and economic projections next week.
In Europe, at the time of writing, FTSE is down -0.10%. DAX is up 0.31%. CAC is up 0.01%. Germany 10-year yield is up 0.0683 at 1.886. Earlier in Asia, Nikkei rose 1.18%. Hong Kong HSI rose 2.32%. China Shanghai SSE rose 0.30%. Singapore Strait Times rose 0.31%. Japan 10-year JGB yield dropped -0.0006 to 0.256.
US PPI up 0.3% mom, 7.4% yoy in Nov
US PPI for final demand rose 0.3% mom in November, above expectation of 0.1% mom. PPI services rose 0.4% mom while PPI goods rose 0.1% mom. PPI less foods, energy, and trade services rose 0.3% mom.
For the 12 months ended in November, PPI rose 7.4% yoy, down from October's 8.1% yoy, matched expectations. PPI less foods, energy, and trade services rose 4.9% yoy,
China CPI slowed to 1.6% yoy in Nov, core CPI down -0.6% yoy
China CPI slowed from 2.1% yoy to 1.6% yoy in November, below expectation of 1.7% yoy. Core CPI, excluding food and energy, was down -0.6% yoy, unchanged from October. Food prices slowed from 7.0% yoy to 3.7% yoy. Non-food prices were unchanged at 1.1% yoy.
"In November, due to the domestic epidemic, seasonal factors, and a higher base of comparison in the same period last year, CPI turned from rising to falling month on month and fell back year on year," said chief NBS statistician Dong Lijuan.
PPI was unchanged at -1.3% yoy, above expectation of -1.5% yoy. "In November, PPI rose slightly month on month as a result of price increases in coal, oil and non-ferrous metals, and continued to fall year on year due to a high base of comparison from the same period last year," added Dong.
GBP/USD Mid-Day Outlook
Daily Pivots: (S1) 1.2178; (P) 1.2213; (R1) 1.2271; More...
Intraday bias in GBP/USD remains neutral. Consolidation from 1.2343 could extend. But further rise remains mildly in favor as long as 1.1898 support holds. On the upside, break of 1.2343 will resume the rally from 1.0351 and target 1.2759 medium term fibonacci level next. However, firm break of 1.1898 support will confirm short term topping and turn bias back to the downside.
In the bigger picture, rise from 1.0351 medium term bottom is at least correcting whole down trend from 1.4248 (2021 high). Further rise is expected as long as 1.1644 resistance turned support holds. Next target is 61.8% retracement of 1.4248 to 1.0351 at 1.2759. Sustained break there will pave the way back to 1.4248.
Economic Indicators Update
| GMT | Ccy | Events | Actual | Forecast | Previous | Revised |
|---|---|---|---|---|---|---|
| 23:50 | JPY | Money Supply M2+CD Y/Y Nov | 3.10% | 3.00% | 3.10% | |
| 01:30 | CNY | CPI Y/Y Nov | 1.60% | 1.70% | 2.10% | |
| 01:30 | CNY | PPI Y/Y Nov | -1.30% | -1.50% | -1.30% | |
| 13:30 | CAD | Capacity Utilization Q3 | 82.60% | 83.00% | 83.80% | 82.80% |
| 13:30 | USD | PPI M/M Nov | 0.30% | 0.10% | 0.20% | 0.30% |
| 13:30 | USD | PPI Y/Y Nov | 7.40% | 7.40% | 8.00% | 8.10% |
| 13:30 | USD | PPI Core M/M Nov | 0.40% | 0.30% | 0.00% | 0.10% |
| 13:30 | USD | PPI Core Y/Y Nov | 6.20% | 6.00% | 6.70% | |
| 15:00 | USD | Michigan Consumer Sentiment Index Dec P | 53.3 | 56.8 | ||
| 15:00 | USD | Wholesale Inventories Oct F | 0.80% | 0.80% |
US PPI up 0.3% mom, 7.4% yoy in Nov
US PPI for final demand rose 0.3% mom in November, above expectation of 0.1% mom. PPI services rose 0.4% mom while PPI goods rose 0.1% mom. PPI less foods, energy, and trade services rose 0.3% mom.
For the 12 months ended in November, PPI rose 7.4% yoy, down from October's 8.1% yoy, matched expectations. PPI less foods, energy, and trade services rose 4.9% yoy,
USD/JPY: Pullback Acceleration Adds to Signals of Reversal
The USDJPY accelerated lower on Friday after a triple daily Doji, adding to signals that short recovery from 133.62 (Dec 2 low, the lowest since Aug 16) might be over.
Fresh bears hit 50% retracement of 133.62/137.85 upleg and eyeing key 200DMA (135.03) for retest, after attacks on Dec 2/5 failed to register a clear break lower.
Rising negative momentum and most of moving averages being in bearish setup on daily chart, add to negative signals.
Weekly close below 200DMA would be a minimum requirement to keep renewed bears in play and neutralize signals from formation of inverted hammer, reversal signal, on weekly chart.
Res: 136.81; 137.85; 138.40; 140.00.
Sup: 135.47; 135.03; 134.41; 133.62.