Sample Category Title
AUD/USD Daily Report
Daily Pivots: (S1) 0.6637; (P) 0.6693; (R1) 0.6745; More...
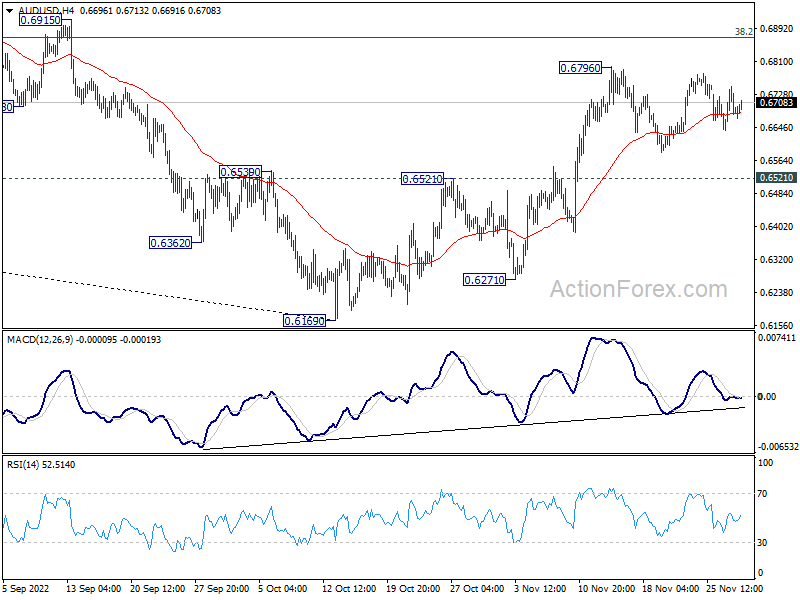
Intraday bias in AUD/USD remains neutral as consolidation from 0.6796 is extending. Further rise is expected as long as 0.6521 resistance turned support holds. On the upside, break of 0.6796 will resume the rise from 0.6169 to 0.6871 fibonacci level. However, sustained break of 0.6521 will argue that whole rebound from 0.6169 is over, and bring deeper fall to retest this low.
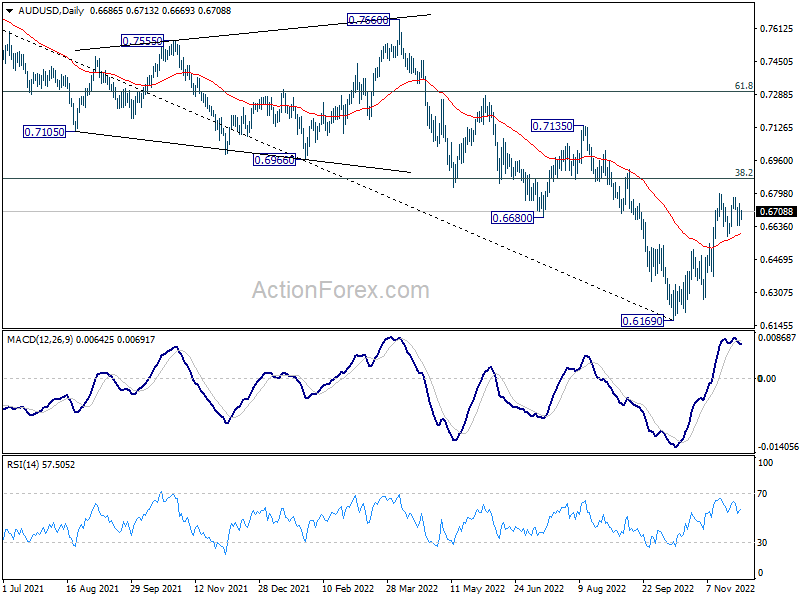
In the bigger picture, a medium term bottom is in place at 0.6160 already. But it's too early to call for trend reversal. Nevertheless, even as a corrective move, rise from 0.6169 should target 38.2% retracement of 0.8006 to 0.6169 at 0.6871. Sustained trading above 55 week EMA (now at 0.6927) will raise the chance of the start of a bullish up trend. This will now remain the favored case as long as 0.6521 resistance turned support holds.
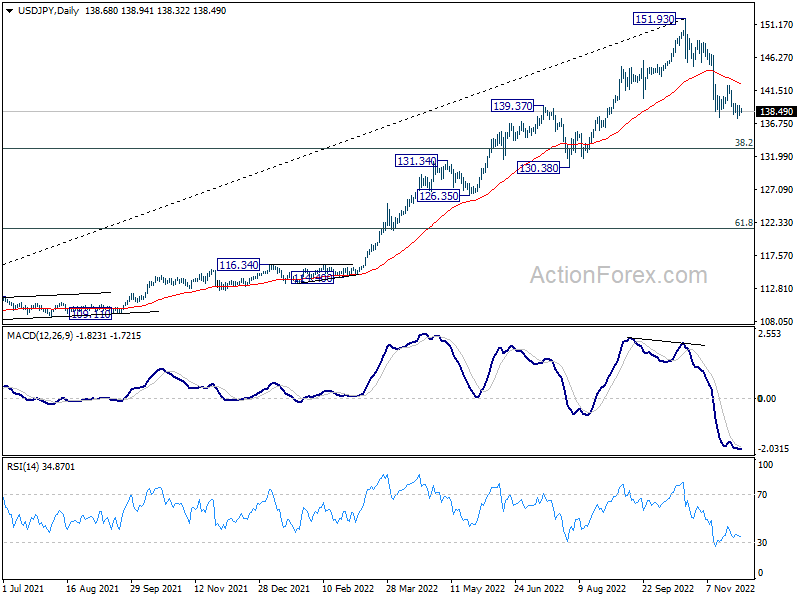
USD/JPY Daily Outlook
Daily Pivots: (S1) 137.93; (P) 138.64; (R1) 139.42; More...
Intraday bias in USD/JPY stays mildly on the downside for the moment. Fall form 151.93 should be resuming for 100% projection of 146.78 to 137.66 from 142.24 at 133.12, which is close to 133.07 medium term fibonacci level. For now, near term outlook will remain bearish as long as 142.24 resistance holds, in case of recovery.
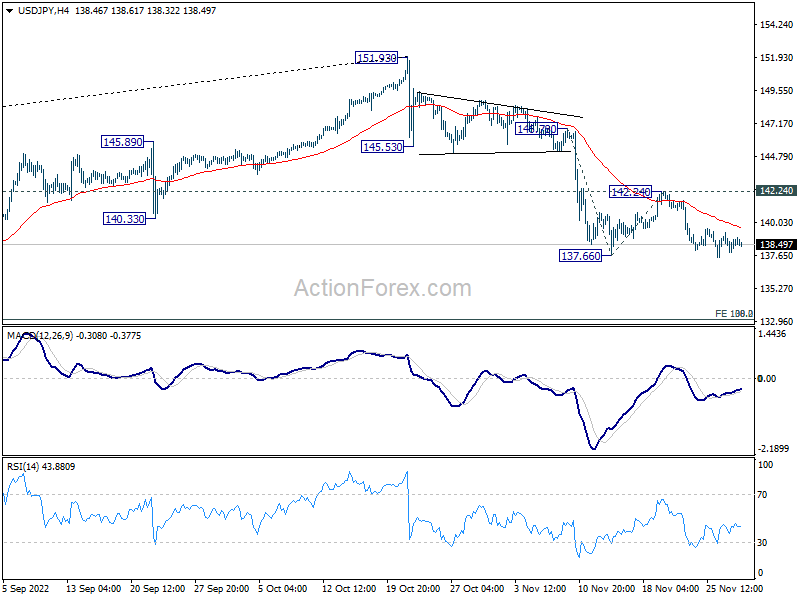
In the bigger picture, a medium term top should be formed at 151.93. Fall from there is correcting larger up trend from 102.58. It's too early to call for bearish trend reversal. But even as a corrective move, such decline should target 38.2% retracement of 102.58 to 151.93 at 133.07, or further to 55 week EMA (now at 131.22).
USD/CHF Daily Outlook
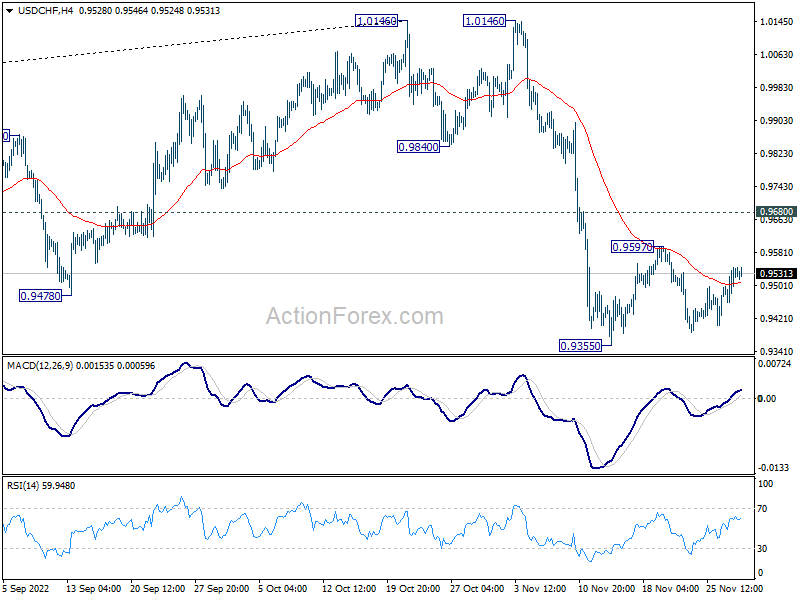
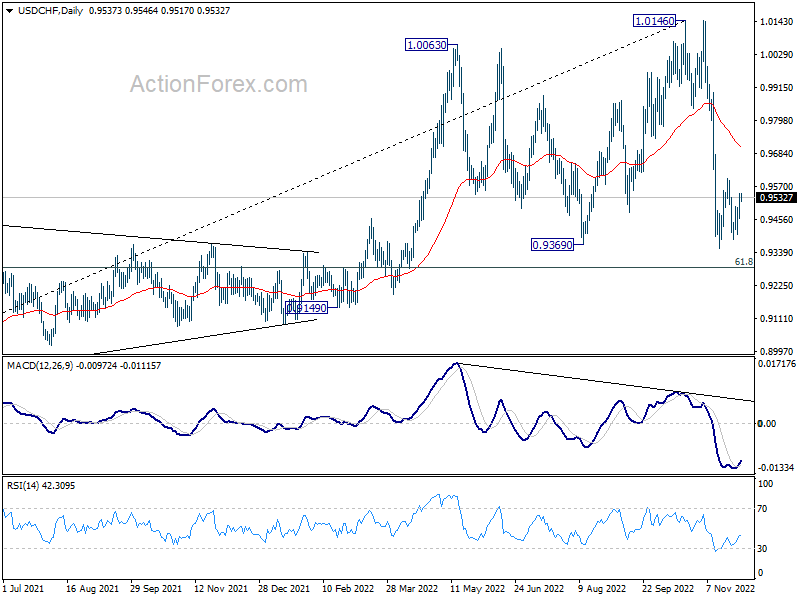
Daily Pivots: (S1) 0.9485; (P) 0.9515; (R1) 0.9571; More...
USD/CHF's consolidation from 0.9355 is in progress and intraday bias remains neutral at this point. On the downside, firm break of 0.9355 will resume the decline from 1.0146 to 0.9287 fibonacci level. Near term outlook will remain bearish as long as 0.9680 minor resistance holds, in case of another recovery.
In the bigger picture, rise from 0.8756 (2021 low) has completed at 1.0146, well ahead of 1.0342 long term resistance (2016 high). Based on current downside momentum, fall from 1.0146 might be a medium term down trend itself. Break of 61.8% retracement of 0.8756 to 1.0146 at 0.9287 will pave the way to 0.8756. In any case, risk will stay on the downside as long as 55 day EMA (now at 0.9726) holds.
GBP/USD Daily Outlook
Daily Pivots: (S1) 1.1911; (P) 1.1987; (R1) 1.2029; More...
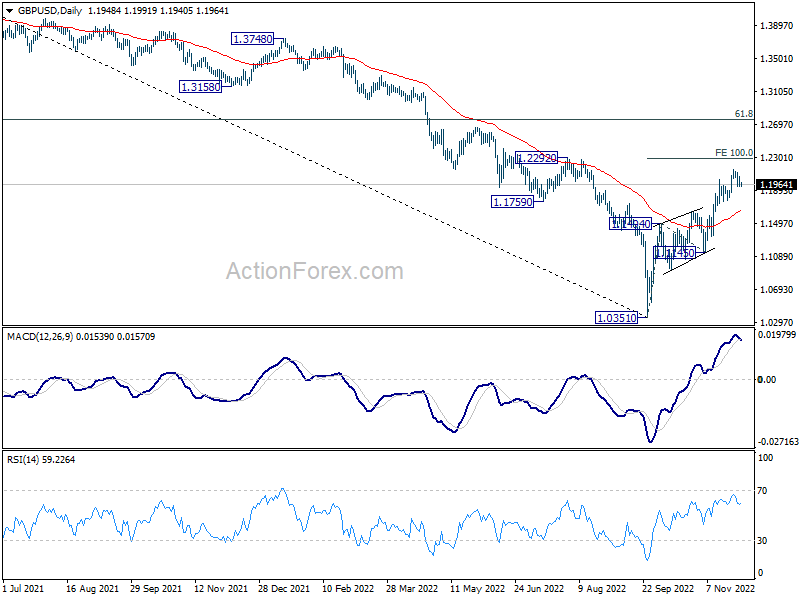
Intraday bias in GBP/USD remains neutral for the moment and consolidation from 1.2152 could extend further. Further rally is expected with 1.1777 support intact. Break of 1.2152will target 100% projection of 1.0351 to 1.1494 from 1.1145 at 1.2288 first. Sustained break there will pave the way to 1.2759 medium term fibonacci level.
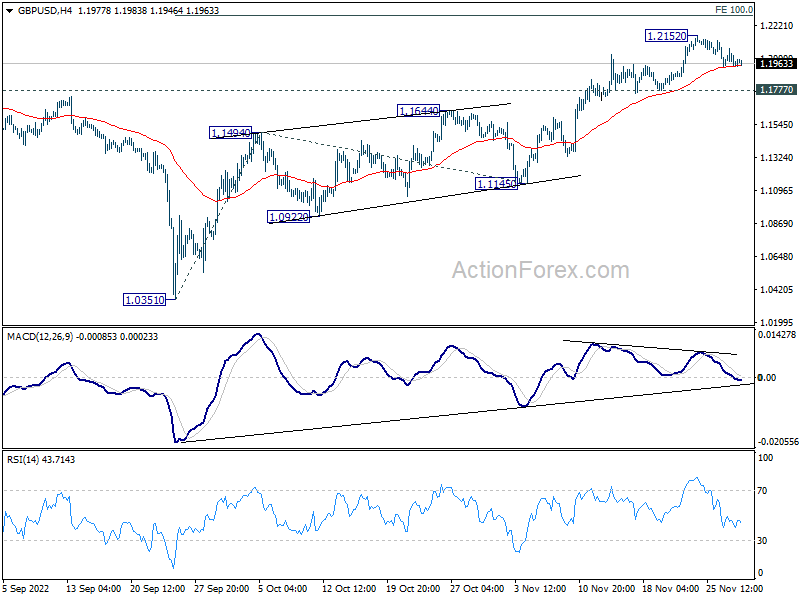
In the bigger picture, rise from 1.0351 medium term bottom is at least correcting whole down trend from 1.4248 (2021 high). Further rise is expected as long as 1.1145 support holds. Next target is 61.8% retracement of 1.4248 to 1.0351 at 1.2759. Sustained break there will pave the way back to 1.4248.
Powell is Not Here to Make Equity Investors Happy
Appetite in Asian equities improved on hints that China could ease the excessive Covid curbs as a response to angry anti-Covid protests.
Nasdaq’s Golden Dragon China index rallied 5% yesterday, even though appetite for the rest of the stocks remained limited, as few wanted to take a bet before Federal Reserve (Fed) head Jerome Powell’s speech due today.
What will Jerome Powell say?
Well, he will say that the pace of the US rate hikes will slow. But he will also say that the Fed is not done fighting inflation and that the terminal Fed rate will likely be higher.
Weakening data is good news for the Fed
The US home prices have weakened the most since the 2007/2008 subprime crisis, and the weakness in home prices should have an easing effect on inflation numbers.
The US yield curve remains inverted, and the spread between the US 3-month and 10-year yield continues widening, hinting that an upcoming recession in the US could further help easing inflationary pressures.
Beyond the US, the global yield curve also prints the first inversion since at least 2000, which also hints at recession, and eventually weaker global inflation.
Finally, the latest consumer confidence data in the US shows further weakness, though it just weakened by around 2 points to 100.2 in November, and a number above 90 is generally considered as healthy.
Bad news is the US 1-year inflation expectations advanced to 7.2% in November from 6.9% printed a month earlier – warning that inflation will certainly not be on a steady downward path; there will be bumps along the way.
A deluge of economic data
Besides Powell’s speech, investors will be watching the update on US GDP, expected to be revised slightly higher, the US job openings, expected to remain above 10 million and hinting at a still solid job environment, and the November ADP report, expected to reveal around 200’000 new private jobs added during last month.
On Thursday, the Fed’s favorite inflation gauge PCE data will show how much inflation eased in October.
Then on Friday, the NFP figures will reveal the strength of the US jobs market.
It’s a lot of data to process, but the simple rule of thumb is, strong inflation data would fuel the hawkish Fed expectations and have a positive impact on the US yields and the dollar, and a negative impact on equities.
Likewise, strong growth, income, spending and solid jobs data would also fuel the hawkish Fed expectations on idea that the US economy remains strong enough to withstand aggressive Fed tightening.
What we want is, soft growth – but not too soft because recession fears are also bad for the market mood.
And what we really, really want is soft spending and inflation data before all.
But in all cases, it’s possible that we won’t see US equities extend gains by much, because both scenarios are not ideal. Strong economic data, like strong growth and strong jobs means that the Fed will continue its aggressive tightening and could aim for relatively higher terminal rates. That’s bad for stock valuations. And soft inflation figures and softening spending are good for the Fed expectations, but they will boost recession odds, which is obviously not good for the stock valuations either.
As a result, we have certainly hit a top in the latest S&P500 rally, and the 200-DMA, which stands around 4050 – which also coincides with the year-to-date descending channel top should mark the end of the latest bear rally, with the expectation of a further fall to potentially around the 3400 mark. I’m sorry.
Surprise fall in EZ inflation?
Good news is that both a softer Fed due to a potentially softening inflation, or soft economic data in the US, should be negative for the US dollar, and could finally help the dollar ease against major currencies, hence ease the strong-dollar-led-high-inflation in the rest of the world.
German inflation slowed to 11.3% in November, according to the data released yesterday, from 11.6% printed a month earlier, while inflation in Spain unexpectedly fell below 7%.
Do we celebrate? Not just yet. The figures are still very much above the ECB’s 2% target, but it’s at least going in the right direction.
Due today, investors will have their eyes set on the Eurozone’s preliminary inflation data for November. Who knows, maybe we will see a figure below 10%, in which case, the EURUSD could make another attempt above the 200-DMA which stands near 1.0370.
But as I always say, the US data, and Jerome Powell will say the last word on the overall direction in currency markets. Strong US data, and hawkish Fed comments could immediately turn the winds in favour of a stronger dollar yet again.
Research US – 50 or 75bp? Fed’s December Checklist
Research US - 50 or 75bp? Fed's December Checklist
- While consensus is overwhelmingly in favour of a 50bp hike in the FOMC's December meeting, we do not think a larger hike is a zero-probability event.
- Latest rise in short-term real interest rates, weak PMIs and lower-than-expected October CPI support more moderate pace of hikes.
- Tight labour markets, resilient hard data and elevated consumer inflation expectations could still tilt the balance towards another 75bp hike.
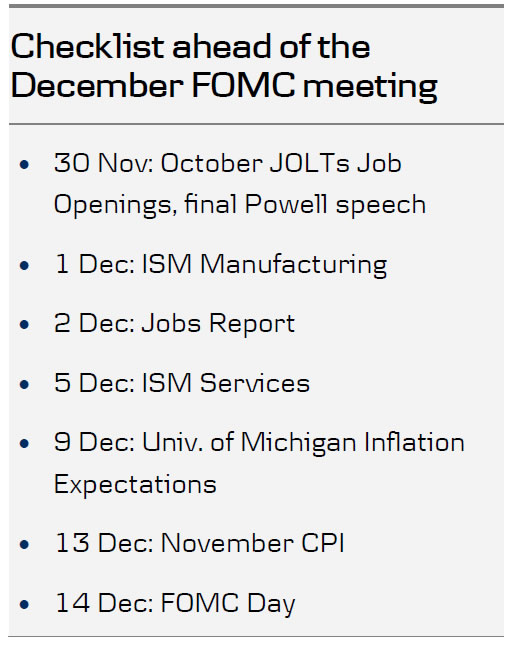
Fed's December meeting is two weeks away and consensus is overwhelmingly in favour of a 50bp move. Yet, we do not think a larger 75bp hike is a zero-probability event, and markets seem to agree with around 59bp priced in at the time of writing.
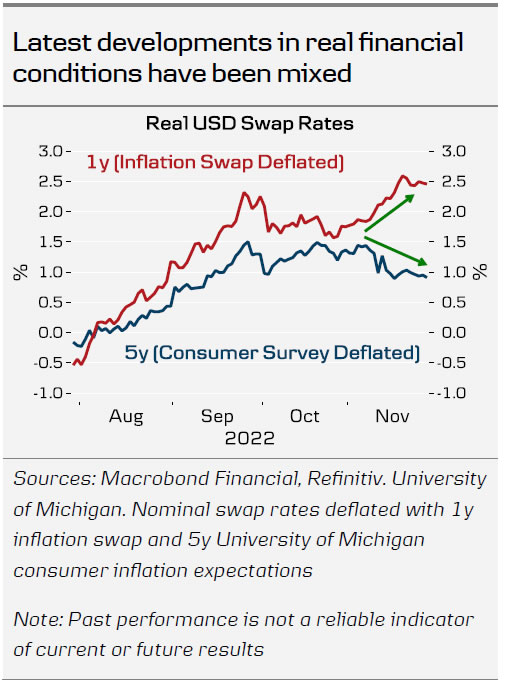
Admittedly, most of the recent data has supported moderating the pace of hikes. We have argued that Fed needs to push real interest rates to positive, restrictive levels in order to close the output gap. The recent decline in commodity prices has eased market-based short-term inflation expectations, and as a result the real interest rate curve is now inverted above zero - a clear contrast to the challenge ECB is facing currently. Consumer survey based inflation expectations give less room for optimism, however.
November Flash PMIs and the continuous cooling in housing markets suggest that the tighter financial conditions are having an impact on aggregate demand. Both manufacturing and service indices are now consistent with declining activity, and while we still forecast modest private consumption growth for Q4, the economy seems headed to the right direction from Fed's perspective.
The weakness in leading indicators has not yet been reflected in hard data, however. October retail sales suggested real consumption volumes have continued to grow. In this light, the upcoming ISM Services release will be the key to gauging if economic momentum has truly cracked. ISM has illustrated clearly less negative picture so far in 2022 compared to its PMI counterpart (and one that has been better consistent with reality).
Labour market conditions remain tight as well, even though markets reacted positively to the October Jobs Report amid the weak household survey. For Fed, the combination of faster-than-expected employment growth, declining labour force participation and accelerating wage inflation was anything but positive. While most leading indicators have a poor record of predicting Jobs Report outcomes, the PMI employment indices did not signal a rapid deterioration of labour market conditions in November either.
As illustrated back in June, Fed could adjust the rate hike pace very close to the actual meeting, and the CPI release a day before the FOMC rate decision could potentially spark rapid repricing this time as well. Cleveland Fed is nowcasting a rebound in Core CPI to 0.5% m/m and we also wrote earlier about some of the reasons why the low October print could have been a one-off (see Research US - Inflation risks are not over yet, 11 November)
While we stand ready to adjust our hawkish call for a 75bp hike in December if warranted by the incoming data, we think consensus underestimates the risk of a larger hike.
Eurozone Inflation Takes Centre Stage
Market movers today
In the euro area, flash HICP figures for November will be the market highlight. Country figures from Spain and Germany point to an easing of headline inflation from October's 10.6%, on the back of lower energy inflation. Signs of peaking underlying inflation are less clear-cut, but core inflation holding steady at 5.0% might be just enough for ECB to slow the hiking pace to 50bp in December.
In the US we get Chicago PMI, pending home sales and Fed chairman Powell will speak tonight on the economic outlook and the labour market.
China will release Caixin PMI manufacturing overnight which comes on the back of the official Chinese PMIs this morning falling short of expectations on both manufacturing and non-manufacturing.
The 60 second overview
Markets: It has been fairly quiet overnight with markets barely reacting to the set of weaker-than-expected official PMIs out of China. Instead focus remains on yesterday's more forward-looking news that the Chinese authorities are working on gradually easing its tough zero-Covid policy (see next). Major equity futures and bonds yields are roughly flat this morning and the USD is only marginally weaker. Also oil prices have stabilised overnight after a drop yesterday afternoon on speculations that OPEC+ might not cut back production after all later this week. In Australia inflation surprised to the downside leaving 2Y AUD swap rates close to 10bp lower while the AUD exchange rate was little changed.
China Covid-policy: China has reached a point where the economic and social costs have become too big and now outweigh the health costs from a gradual opening, which will lead to a rise in deaths. For markets, households and companies, what is important is that they can now see an end to the zero-Covid policy and an improvement of the economy on the other side of the short-term chaos that could arise from a sharp rise in the virus spreading. We still do not think we will see a full reopening until the warmer season over the summer and the elderly are fully vaccinated. But the conviction that China will leave the zero-Covid policy and pave the way for an economic rebound in H2 2023 has increased. A rebound where pent-up demand in consumption and the property sector is unleashed. We look for growth in 2024 to rebound to 5.3%.
50bp or 75bp December hike from Fed: Yesterday, the US Conference Board's survey signalled weakening consumer confidence and business outlook, but also rising inflation expectations and that strong labour market conditions continued into November. Today, focus turns to ADP and JOLTs data, as especially the latter has been a key forward-looking indicator for wage growth. Also Powell will be on the wires discussing the economic outlook and labour markets for the last time before the blackout period. In other words, a potentially very important occasion for him to guide markets.
This morning, we published an article reviewing the key arguments and data releases for determining Fed's hiking pace in the December meeting. While consensus is clearly in favour of a 50bp hike, we do not think a larger 75bp move is a zero-probability event, see Research US - 50 or 75bp? Fed's December Checklist, 30 November.
Equities were generally lower, and Nordic losses escalated into the US session. Hot inflation numbers, Chinese reopening and rising oil prices sent the US 10y back to 3.75%. As a result, defensives outperformed cyclicals and high multiple names suffered the most (Sinch -6%, Hexagon -2%). On the other hand, energy and materials companies outperformed (Boliden +4). S&P 500 -0.2% and Nordics -0.6%. US futures are higher this morning though.
FI: European rates markets recorded a strong rally of 10bp in the morning hours after the Spanish and regional Germany inflation prints came in lower than consensus expected. However, later the German headline figure was stronger than what was anticipated by markets, whereby half of the rally was reversed and core rates therefore ended only 6bp lower on the day. Italian bonds also caught a bid with the Italian-German spread now standing at 190bp.
As a result of the repricing of rates and lower headline inflation, the December ECB pricing is now just 56bp although today's underlying inflation print for the euro area will be important for that decision. On Monday, markets priced the Dec meeting as a coin toss for 50bp or 75bp. With the country releases for Germany, Spain and Belgium easing on the headline compared to October and core set to hold steady at 5.0% it might be just enough for ECB to slow the hiking pace to 50bp in two weeks' time.
FX: The antipodeans and NOK balanced between supporting commodities and risk off, while CAD underperformed within G10 which according to Bloomberg reports could be related to M&A flows. In yesterday's session EUR/SEK and EUR/NOK were slightly bid and EUR/USD slightly offered ahead of this week's major central bank event, Jerome Powell's speech at Brookings Institution 19:30 CET. If he comes across as hawkish it should weigh on equities, EUR/USD and Scandies alike.
Credit: Overall the credit market had a relatively calm day with iTraxx main tightening 1bp to 91bp and Xover tightening 4bp to 459bp. However, under the surface two interesting stories unfolded:
1) Danish based Orsted issued a new EUR500m Green hybrid bond with very significant interest. In fact the order book was around EUR5bn - hence the issue was around 10x over-subscribed! The huge interest made it possible for Orsted to lower the final spread to 5.25% from the initial price talks of 5.875-6.0%. Clearly the corporate bond market has appetite for high quality issuers.
2) On the contrary some negative news hit the bond market as German real estate company Around Town announced that it had no intention to call its outstanding hybrid bond with first call in January 2023. Furthermore Around Town stated that it would consider its option to defer coupon payments as the company gets closer to the interest payment day. Later yesterday another real estate company Grand City Properties SA announced that it would not call its EUR200m hybrid bond with call date in January 2023. Naturally these statements had negative read-overs to the Nordic real estate bond segment - and especially for those real estate companies with outstanding hybrid bonds. To say the least it will be interesting to follow the news flow from the real estate companies in the coming weeks.
EUR/USD Daily Outlook
Daily Pivots: (S1) 1.0302; (P) 1.0348; (R1) 1.0376; More...
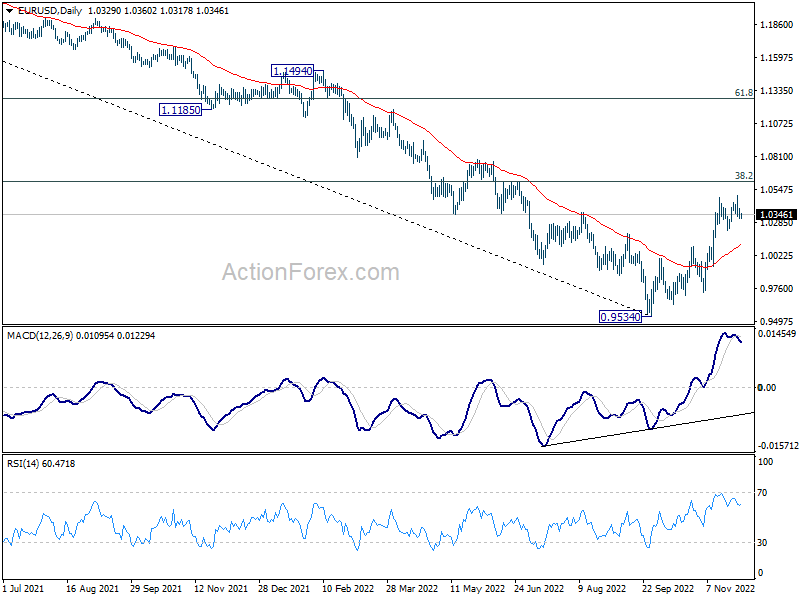
EUR/USD is still bounded in range trading and intraday bias remains neutral first. Further rally is expected as long as 1.0222 support holds. Break of 1.0496 will resume the rise from 0.9534 to 1.0609 fibonacci level. However, firm break of 1.0222 will turn bias back to the downside for 1.0092 resistance turned support.
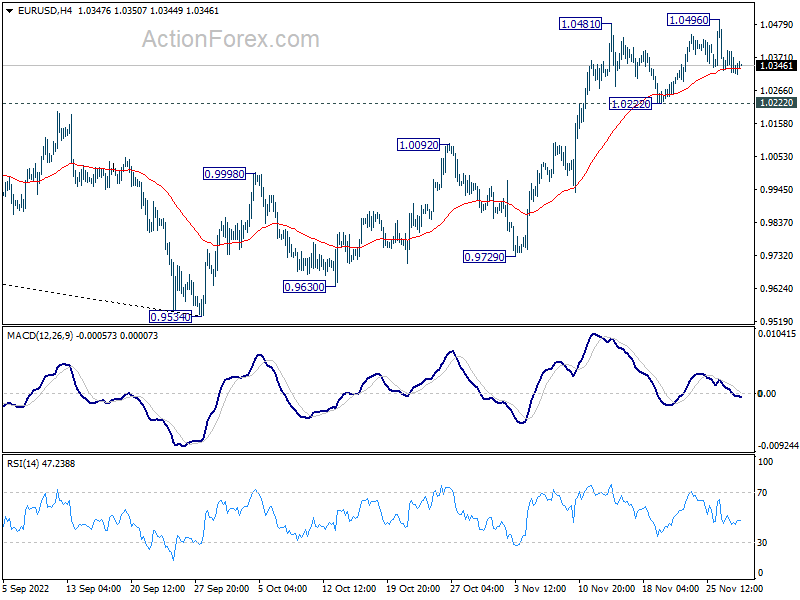
In the bigger picture, a medium term bottom was in place at 0.9534, on bullish convergence condition in daily MACD. Even as a corrective rise, rally from 0.9534 should target 38.2% retracement of 1.2348 (2021 high) to 0.9534 at 1.0609. Sustained trading above 55 week EMA (now at 1.0566) will raise the chance of trend reversal and target 61.8% retracement at 1.1273. This will now remain the favored case as long as 1.0092 resistance turned support holds.
Markets Cautious, Awaiting Eurozone CPI and Development in China
Overall, the forex markets are very cautious for now, awaiting the key events of the week, including Eurozone CPI flash today and US non-farm payrolls on Friday. There is no breakthrough in the unrest in China, with reports of escalation in protests in manufacturing center of Guangzhou. Yen and Dollar are now the stronger ones fro the week, followed by Euro. Canadian Dollar is the worst performer, following the selloff overnight. Sterling and Aussie are the next weakest.
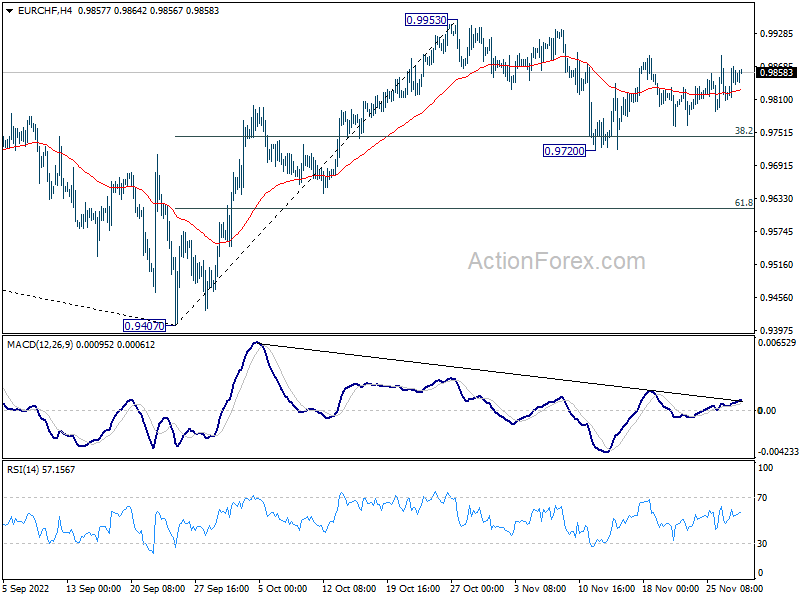
Technically, EUR/CHF is worth a watch today with Eurozone CPI featured. The price actions from 0.9720 are corrective looking so far, suggesting that it's merely the second leg of the corrective pattern from 0.9953 short term top. That is, in case of further rise, upside would likely be capped by 0.9953 to bring the third leg. In case of deeper decline, some support might be seen around 0.9720 to contain downside. That is, range trading should continue for a while, unless, something substantial happens.
In Asia, at the time of writing, Nikkei is down -0.37%. Hong Kong HSI is up 0.84%. China Shanghai SSE is up 0.18%. Singapore Strait Times is up 0.03%. Japan 10-year JGB yield is up 0.003 at 0.257. Overnight, DOW rose 0.01%. S&P 500 dropped -0.16%. NASDAQ dropped -0.59%. 10-year yield rose 0.045 to 3.748.
China PMI manufacturing dropped to 48.0, non-manufacturing down to 46.7
China NBS PMI Manufacturing dropped from 49.2 to 48.0 in November, below expectation of 49.2. PMI Non-Manufacturing dropped from 48.7 to 46.7, below expectation of 48.0. Both readings were the lowest in seven months.
"In November, impacted by multiple factors including the wide and frequent spread of domestic outbreaks, and the international environment becoming more complex and severe, China's purchasing managers' index fell," NBS senior statistician Zhao Qinghe said in a statement.
Zhao said domestic outbreaks in November caused "production activity to slow down and product orders to fall", noting "increased fluctuation in market expectations".
Japan industrial production dropped -2.6% mom in Oct, but bounce back expected
Japan industrial production dropped -2.6% mom in October, worse than expectation of -1.8% mom.
The seasonally adjusted production index for the manufacturing and mining sectors stood at 95.9 against 100 for the base year of 2015. The shipment index stood at 94.1, down -1.1%, and the inventory index at 103.0, down -0.8%.
The Ministry of Trade, Economy and Industry expects production to rise 3.3% in November and then 2.4% in December.
METI cut its assessment of industrial output for the first time in five months, saying "production is gradually picking up, but some weaknesses are observed."
Australia monthly CPI slowed to 6.9% yoy in Oct, food inflation eased
Australia monthly CPI slowed from 7.3% yoy to 6.9% yoy in October. The most significant contributors to the annual rise were new dwellings (+20.4%), automotive fuel (+11.8%) and fruit and vegetables (+9.4%).
"High levels of building construction activity and ongoing shortages of labour and materials contributed to the rise in new dwellings" Michelle Marquardt, ABS Head of Prices Statistics said.
Automotive fuel prices accelerated from 10.1% to 11.8% as the government's temporary cut to the fuel excise ended on September 29. Annually, prices for fruit and vegetables rose by 9.4%, down from 17.4% in September.
NZ ANZ business confidence dropped to -57.1, strain showing for businesses
New Zealand ANZ Business Confidence dropped from -42.7 to -57.1 in November. Looking at some details, own activity outlook dropped from -2.5 to -13.7, just 8 pts shy of 2009 lows. Export intentions dropped from -4.3 to -5.4. Investment intentions dropped from 1.1 to -8.1. Employment intentions dropped from 5.0 to -4.0. Pricing intentions dropped from 64.5 to 58.5. Cost expectations ticked up from 88.6 to 88.7. Inflation expectations rose from 6.13 to 6.39.
ANZ said, "The strain is showing for kiwi businesses. Cost increases remain relentless and margins are squeezed, firms are chronically understaffed, and they're waiting for the hammer to fall as the impact of relentless monetary policy tightening eventually kicks in. There are a lot of dark clouds on the horizon, and this month's survey reflects that."
Looking ahead
France GDP and consumer spending, Swiss KOF, Germany unemployment and Eurozone CPI flash will be released in European session.
Later in the day, US will release ADP employment, GDP revision, goods trade balance, Chicago PMI and pending home sales.
EUR/USD Daily Outlook
Daily Pivots: (S1) 1.0302; (P) 1.0348; (R1) 1.0376; More...
EUR/USD is still bounded in range trading and intraday bias remains neutral first. Further rally is expected as long as 1.0222 support holds. Break of 1.0496 will resume the rise from 0.9534 to 1.0609 fibonacci level. However, firm break of 1.0222 will turn bias back to the downside for 1.0092 resistance turned support.
In the bigger picture, a medium term bottom was in place at 0.9534, on bullish convergence condition in daily MACD. Even as a corrective rise, rally from 0.9534 should target 38.2% retracement of 1.2348 (2021 high) to 0.9534 at 1.0609. Sustained trading above 55 week EMA (now at 1.0566) will raise the chance of trend reversal and target 61.8% retracement at 1.1273. This will now remain the favored case as long as 1.0092 resistance turned support holds.
Economic Indicators Update
| GMT | Ccy | Events | Actual | Forecast | Previous | Revised |
|---|---|---|---|---|---|---|
| 21:45 | NZD | Building Permits M/M Oct | -10.70% | 3.80% | 3.60% | |
| 23:50 | JPY | Industrial Production M/M Oct P | -2.60% | -1.80% | -1.70% | |
| 00:00 | NZD | ANZ Business Confidence Nov | -57.1 | -42.7 | ||
| 00:01 | GBP | BRC Shop Price Index Y/Y Oct | 7.40% | 6.60% | ||
| 00:30 | AUD | Private Sector Credit M/M Oct | 0.60% | 0.60% | 0.70% | |
| 00:30 | AUD | Building Permits M/M Oct | -6.00% | -2.00% | -5.80% | -8.10% |
| 00:30 | AUD | Construction Work Done Q3 | 2.20% | 2.00% | -3.80% | -2.00% |
| 01:00 | CNY | Manufacturing PMI Nov | 48 | 49.2 | 49.2 | |
| 01:00 | CNY | Non-Manufacturing PMI Nov | 46.7 | 48 | 48.7 | |
| 05:00 | JPY | Housing Starts Y/Y Oct | -1.80% | -0.50% | 1.00% | |
| 07:45 | EUR | France Consumer Spending M/M Oct | 0.70% | 1.20% | ||
| 07:45 | EUR | France GDP Q/Q Q3 | 0.20% | 0.20% | ||
| 08:00 | CHF | KOF Leading Indicator Nov | 89.5 | 90.9 | ||
| 08:55 | EUR | Germany Unemployment Change Nov | 10K | 8K | ||
| 08:55 | EUR | Germany Unemployment Rate Nov | 5.50% | 5.50% | ||
| 09:00 | CHF | Credit Suisse Economic Expectations Nov | -53.1 | |||
| 10:00 | EUR | Eurozone CPI Y/Y Nov P | 10.40% | 10.60% | ||
| 10:00 | EUR | Eurozone CPI Core Y/Y Nov P | 4.90% | 5.00% | ||
| 13:15 | USD | ADP Employment Change Nov | 195K | 239K | ||
| 13:30 | USD | GDP Annualized Q3 P | 2.60% | 2.60% | ||
| 13:30 | USD | GDP Price Index Q3 P | 4.10% | 4.10% | ||
| 13:30 | USD | Wholesale Inventories Oct P | 0.50% | 0.60% | ||
| 13:30 | USD | Goods Trade Balance (USD) Oct P | -90.2B | -92.2B | ||
| 14:45 | USD | Chicago PMI Nov | 45.4 | 45.2 | ||
| 15:00 | USD | Pending Home Sales M/M Oct | -5.80% | -10.20% | ||
| 15:30 | USD | Crude Oil Inventories | -3.2M | -3.7M |
Technical Outlook and Review
USD/JPY:
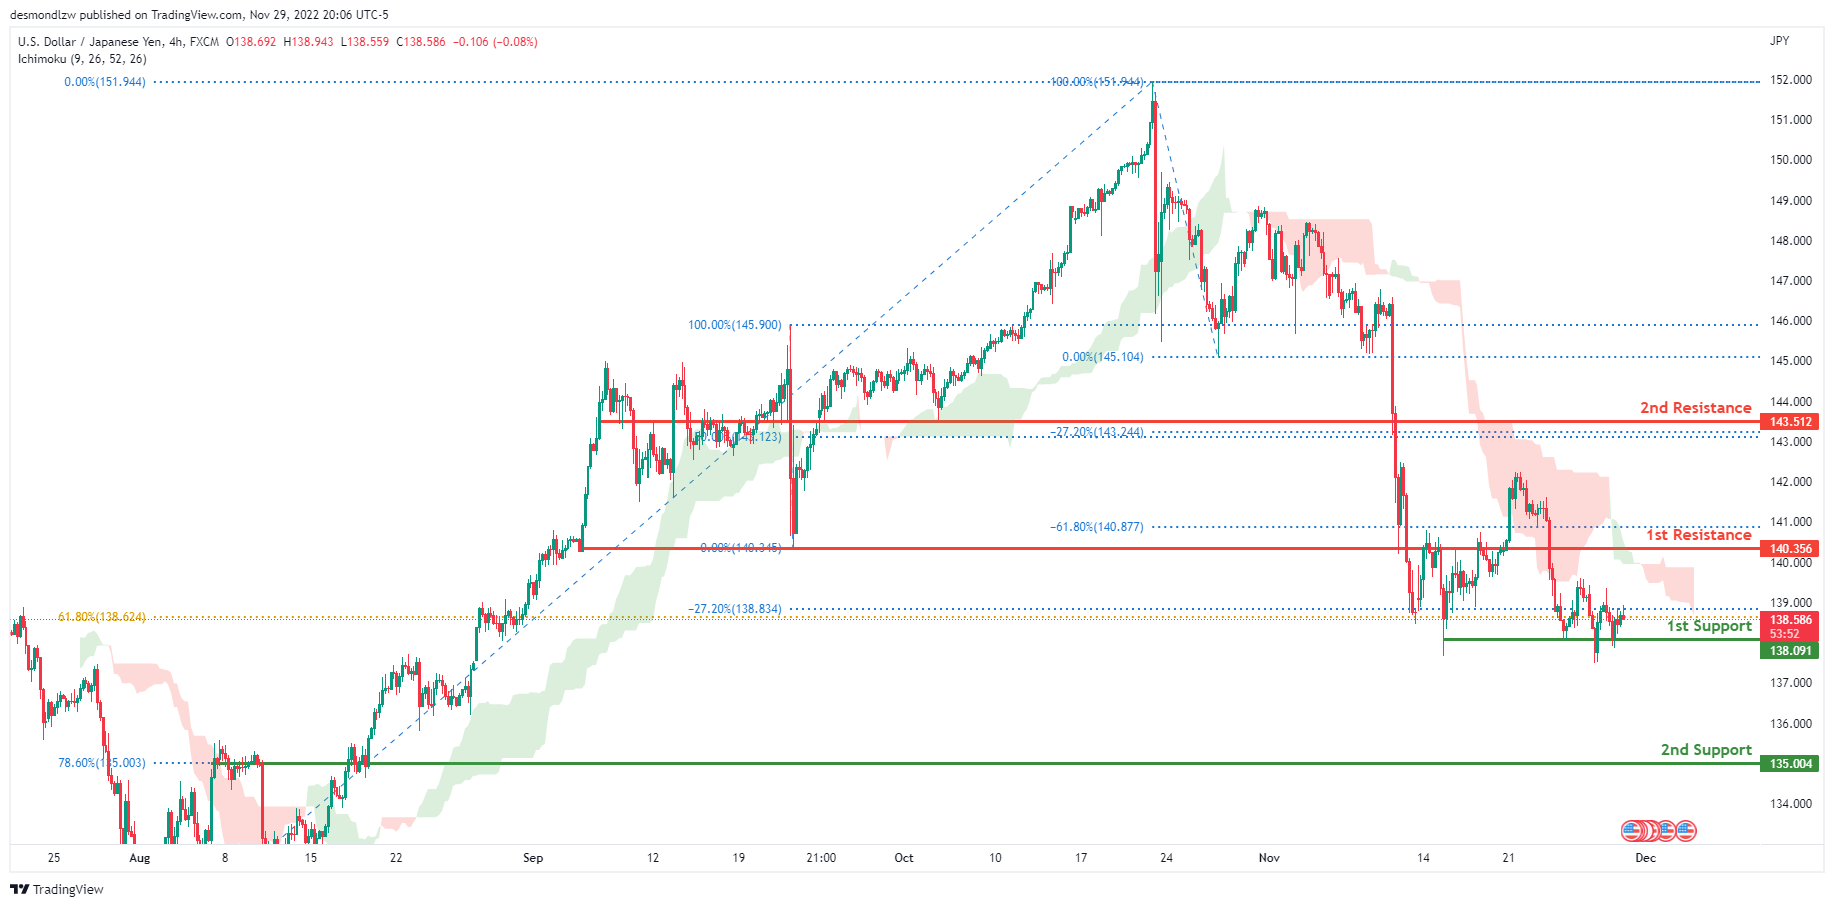
The current general bias for USDJPY on the H4 chart is bearish. To add confluence to this, the price is under the Ichimoku cloud which indicates a bearish market. If the bearish momentum continues, expect USDJPY to head towards the 1st support line at 138.091, where the –27.2% Fibonacci expansion line is located. In an alternative scenario, price could go up to retest the 1st resistance line at 140.356, where the -61.8% Fibonacci expansion line and previous low are located.
Areas of consideration:
- H4 time frame, 1st resistance at 140.356
- H4 time frame, 1st support at 138.091
DXY:
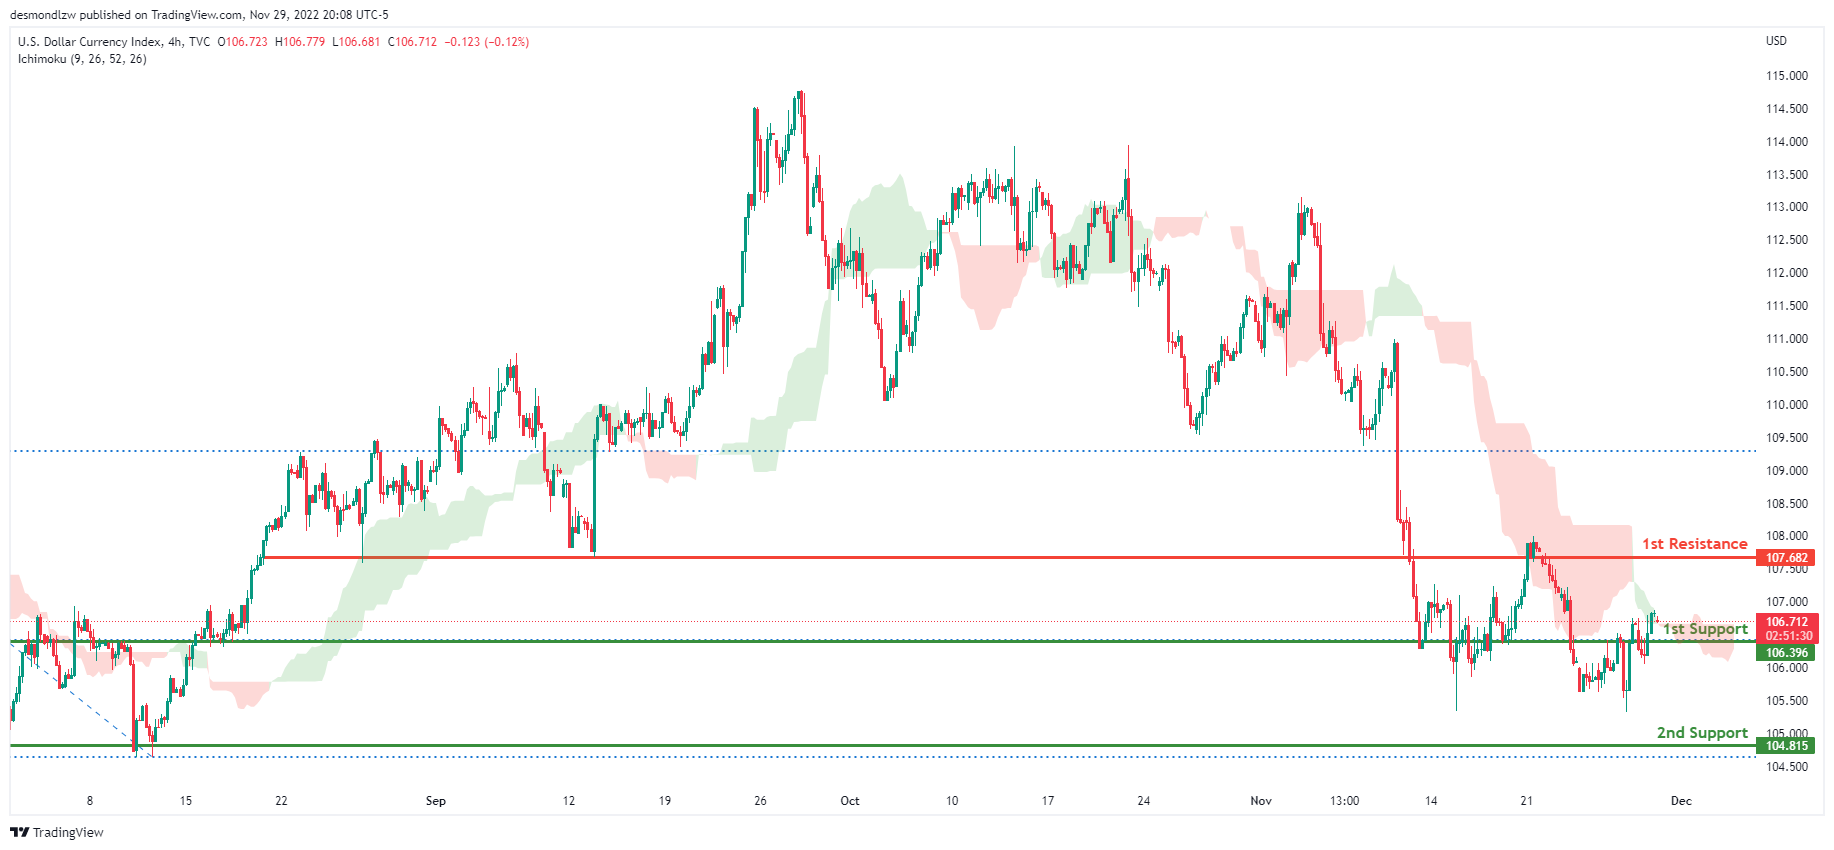
On the H4 chart, the overall bias for DXY is bearish. To add confluence to this, the price is crossing below the Ichimoku cloud which indicates a bearish market. If this bearish momentum continues, expect the price to break the 1st support line at 106.396 where the 38.2% Fibonacci line is located, before heading towards the 2nd support at 104.815, where the previous swing low is. In an alternative scenario, price could head back up and retest the 1st resistance line resistance at 107.682, where the previous swing low lies.
Areas of consideration:
- H4 time frame, 1st resistance at 107.682
- H4 time frame, 1st support at 106.396
- H4 time frame, 2nd support at 104.815
EUR/USD:
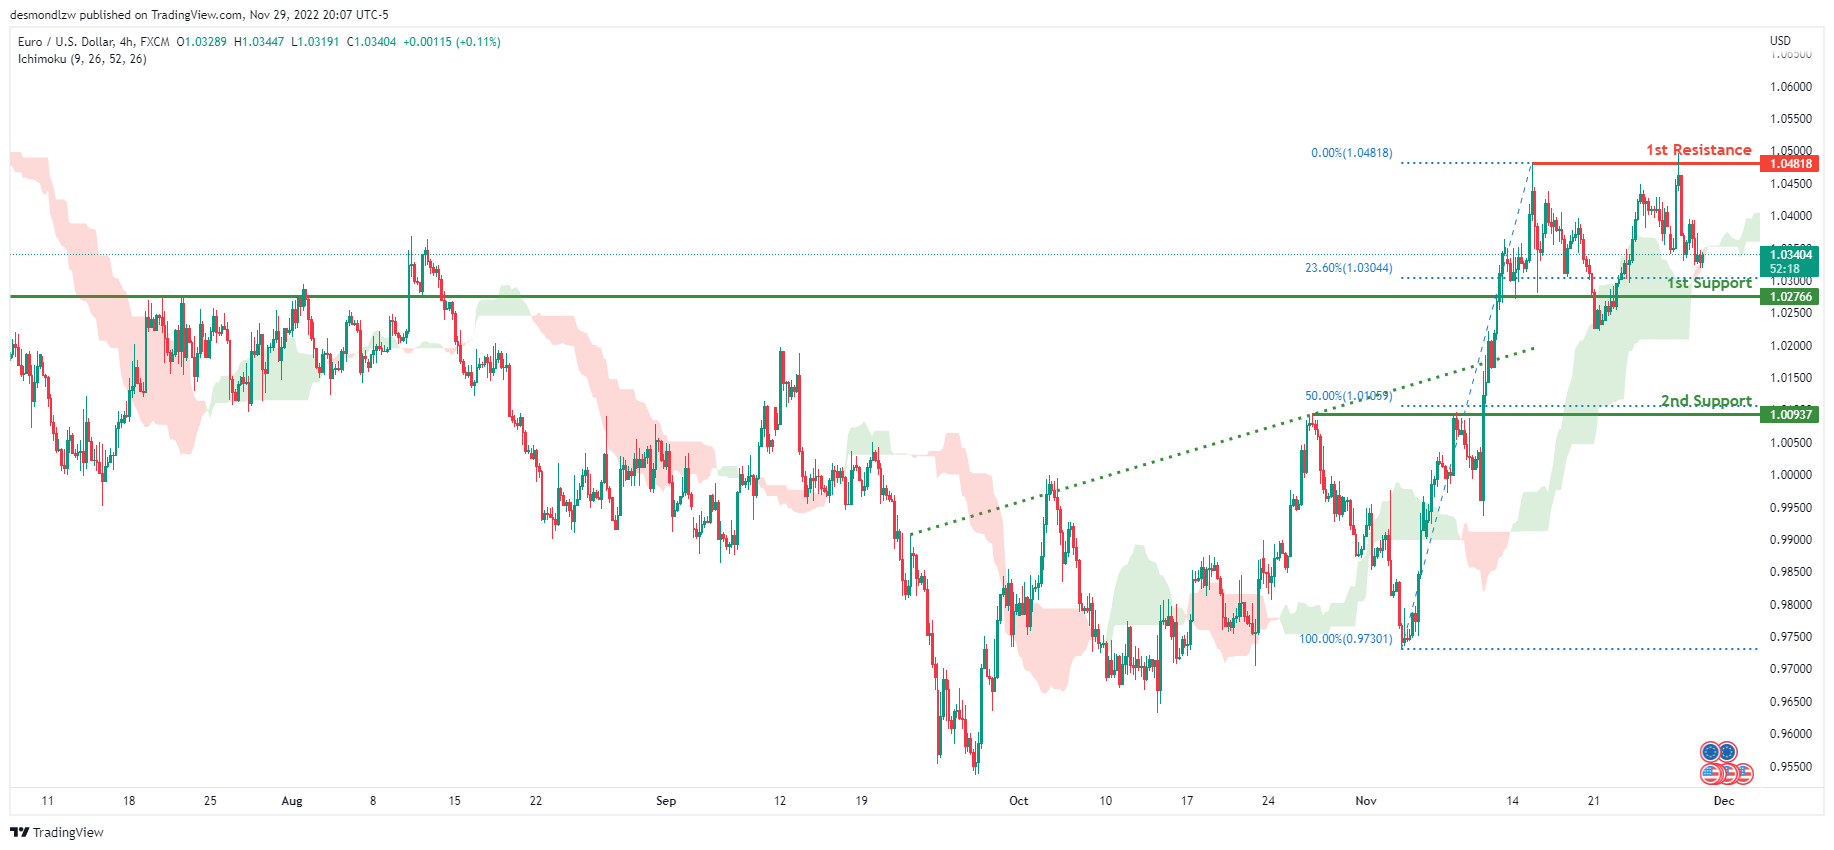
Looking at the H4 chart, my overall bias for EURUSD is bullish due to the current price being above the Ichimoku cloud, indicating a bullish market. To add confluence to this bias, price has also broken above the ascending trend line. If this bullish momentum continues, expect the price to possibly head towards the 1st resistance at 1.04818, where the previous swing high is located. In an alternate scenario, price could possibly head back down towards the 1st support level at 1.02766, where the 23.6% Fibonacci line is located, before heading towards the 2nd support at 1.00937, where the 50% Fibonacci line is.
Areas of consideration :
- H4 1st resistance at 1.04818
- H4 1st support at 1.02766
- H4 2nd support at 1.00937
GBP/USD:
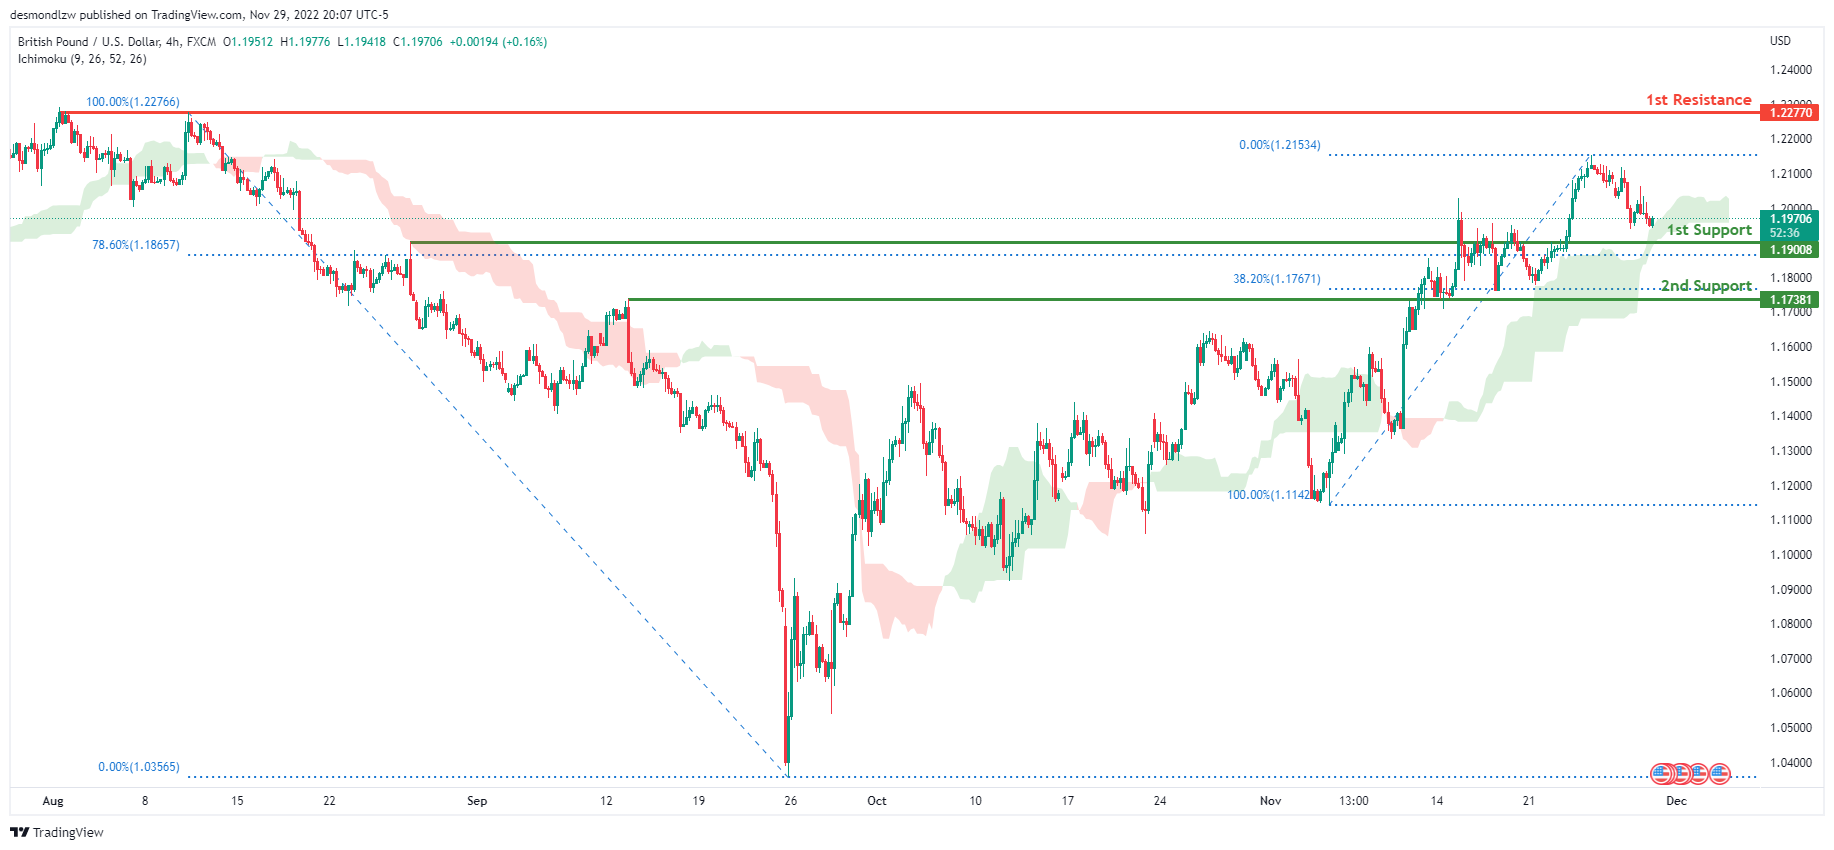
Looking at the H4 chart, my overall bias for GBPUSD is bullish due to the current price being above the Ichimoku cloud, indicating a bullish market. Expecting price to possibly head towards the 1st resistance line at 1.22770, where the previous swing high is. In an alternative scenario, price could possibly head back down to retest the 1st support line at 1.19008, where the 78.6% Fibonacci line is.
Areas of consideration:
- H4 1st resistance at 1.22770
- H4 1st support at 1.19008
USD/CHF:
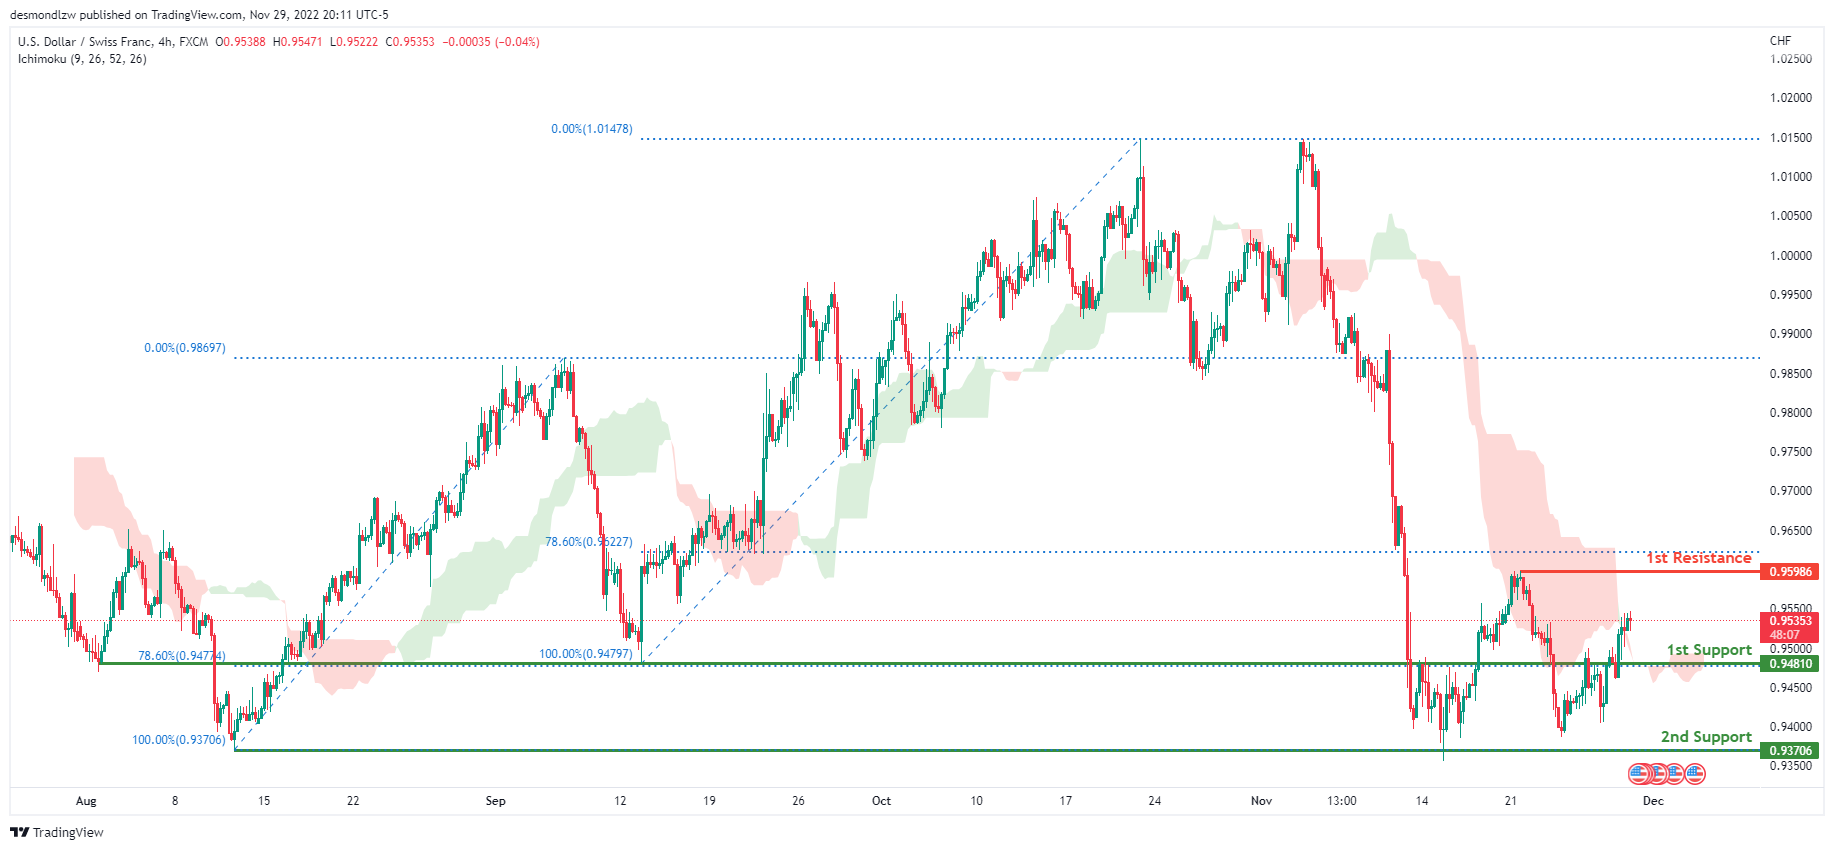
The overall bias for USDCHF on the H4 chart is bearish. In addition, the price is crossing below the Ichimoku cloud, indicating a bearish market. If the current bearish trend continues, expect price to continue heading towards the 1st support line at 0.94810 where the 78.6% Fibonacci line is. IN an alternative scenario, price could possibly head back up towards the 1st resistance line at 0.95986, where the previous swing high is.
Areas of consideration
- H4 1st support at 0.94810
- H4 1st resistance at 0.95986
XAU/USD (GOLD):
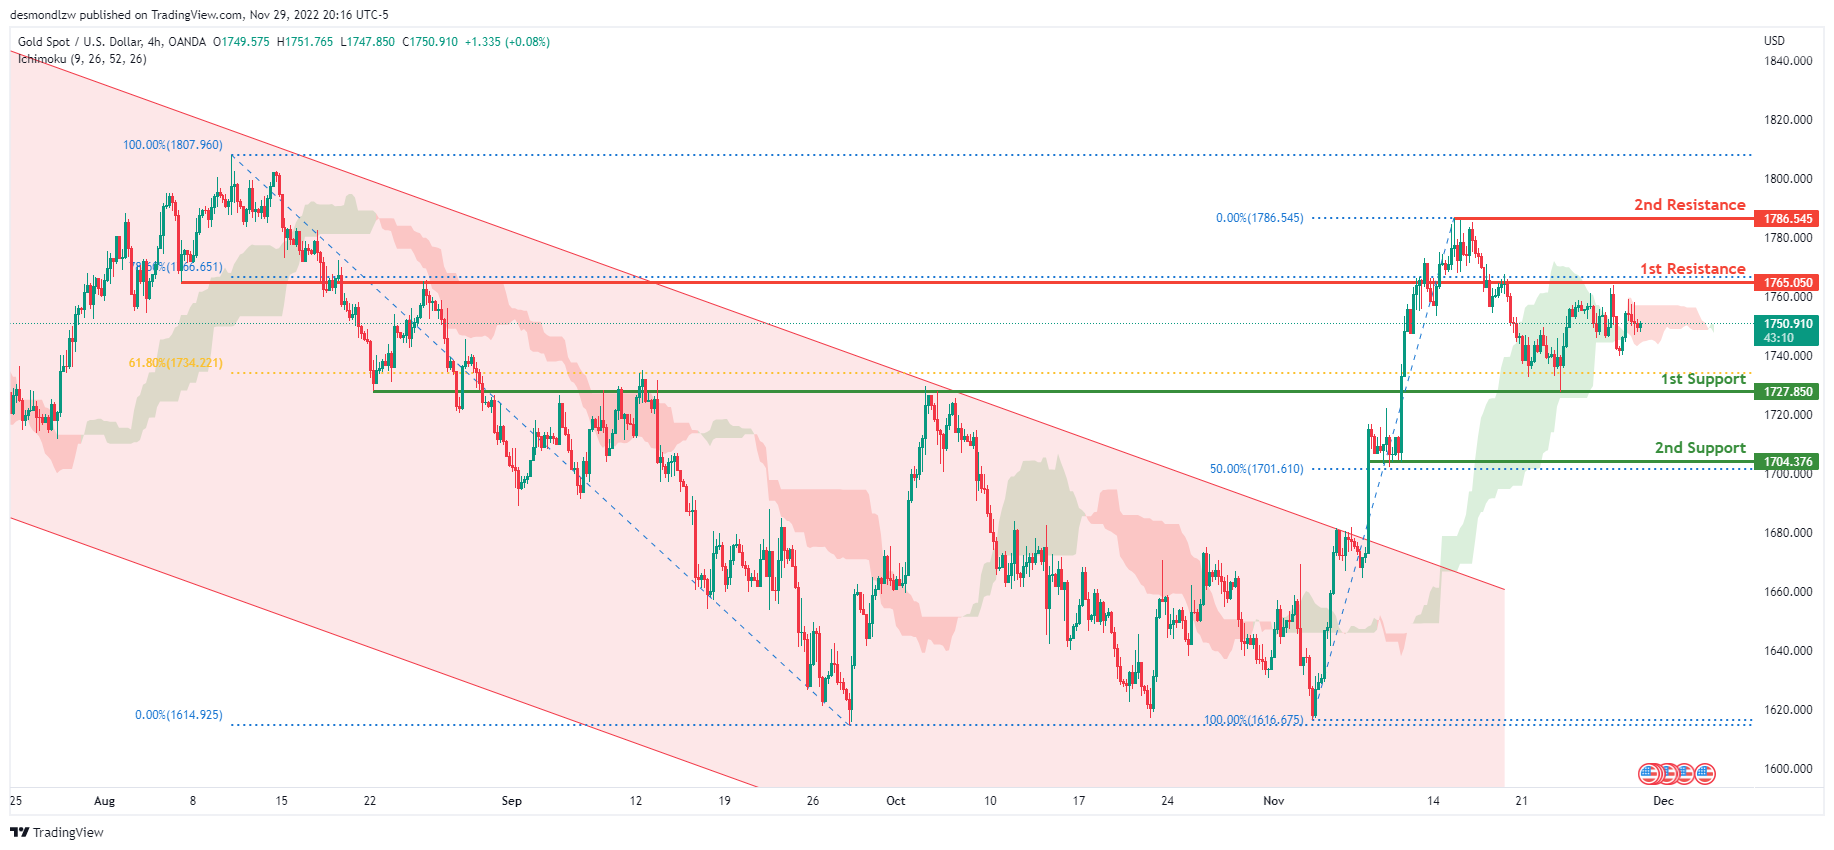
Looking at the H4 chart, my overall bias for XAUUSD is bullish due to the current price crossing above the Ichimoku cloud, indicating a bullish market. If this bullish momentum continues, expect the price to possibly head back up towards the 1st resistance at 1765.050, where the 78.6% Fibonacci line is located. In an alternate scenario, price could possibly head back down towards the 1st support level at 1727.850, where the 38.2% and 61.8% Fibonacci lines are located.
Areas of consideration:
- H4 time frame, 1st resistance at 1765.483
- H4 time frame, 1st support at 1727.850
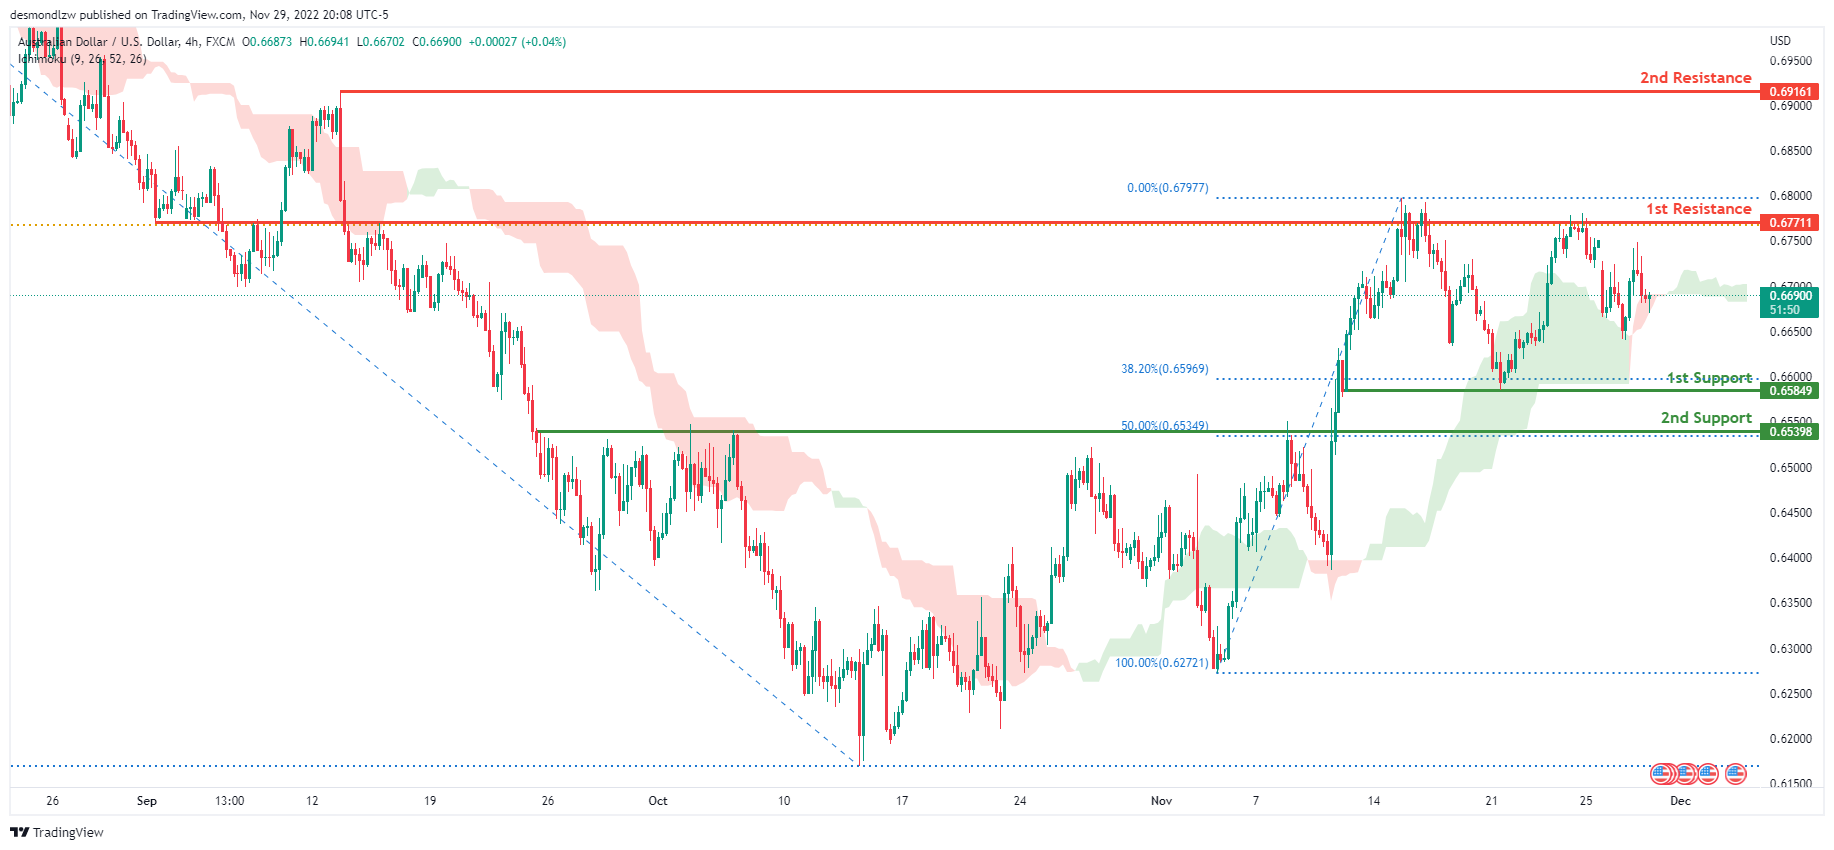
AUD/USD:
Looking at the H4 chart, my overall bias for ADUSD is bullish due to the current price being above the Ichimoku cloud, indicating a bullish market. Expecting price to continue heading towards the 1st resistance at 0.67711 where the 61.8% Fibonacci line is. If this 1st resistance line is broken, expect the price to head towards the 2nd resistance at 0.69161, where the previous swing high is. In an alternative scenario, price could possibly head back down to retest the 1st support line at 0.65849 where the 38.2% Fibonacci line is.
Areas of consideration
- H4, 1st resistance at 0.67711
- H4, 2nd resistance at 0.69161
- H4, 1st support at 0.65849
NZD/USD:
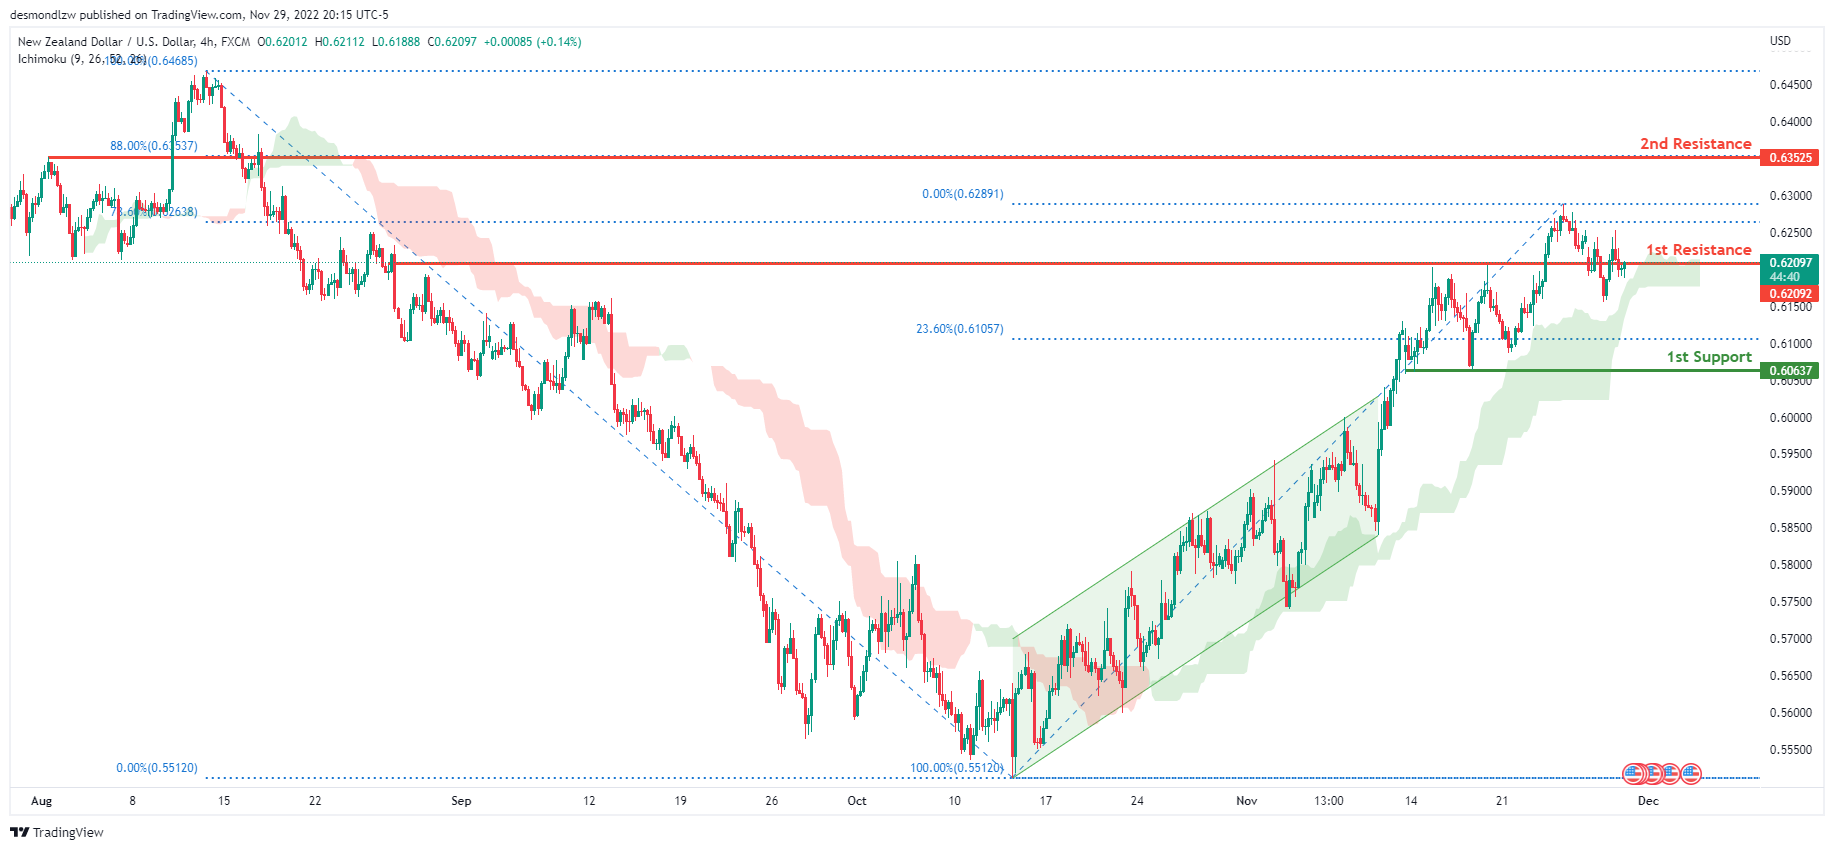
On the H4 chart, we have a bullish bias with the price moving above the Ichimoku cloud and has broken out of the ascending channel. If this bullish momentum continues, expect the price to break the 1st resistance line at 0.62092, slightly below where the 78.6% Fibonacci line is before heading towards the 2nd resistance at 0.63525 where the 88% Fibonacci line is. Alternatively, the price may head back down and retest the 1st support at 0.60637, where the previous swing low is.
Areas of consideration:
- H4 time frame, 1st resistance at 0.62092
- H4 time frame, 2nd resistance at 0.63525
- H4 time frame, 1st support at 0.60637
USD/CAD:
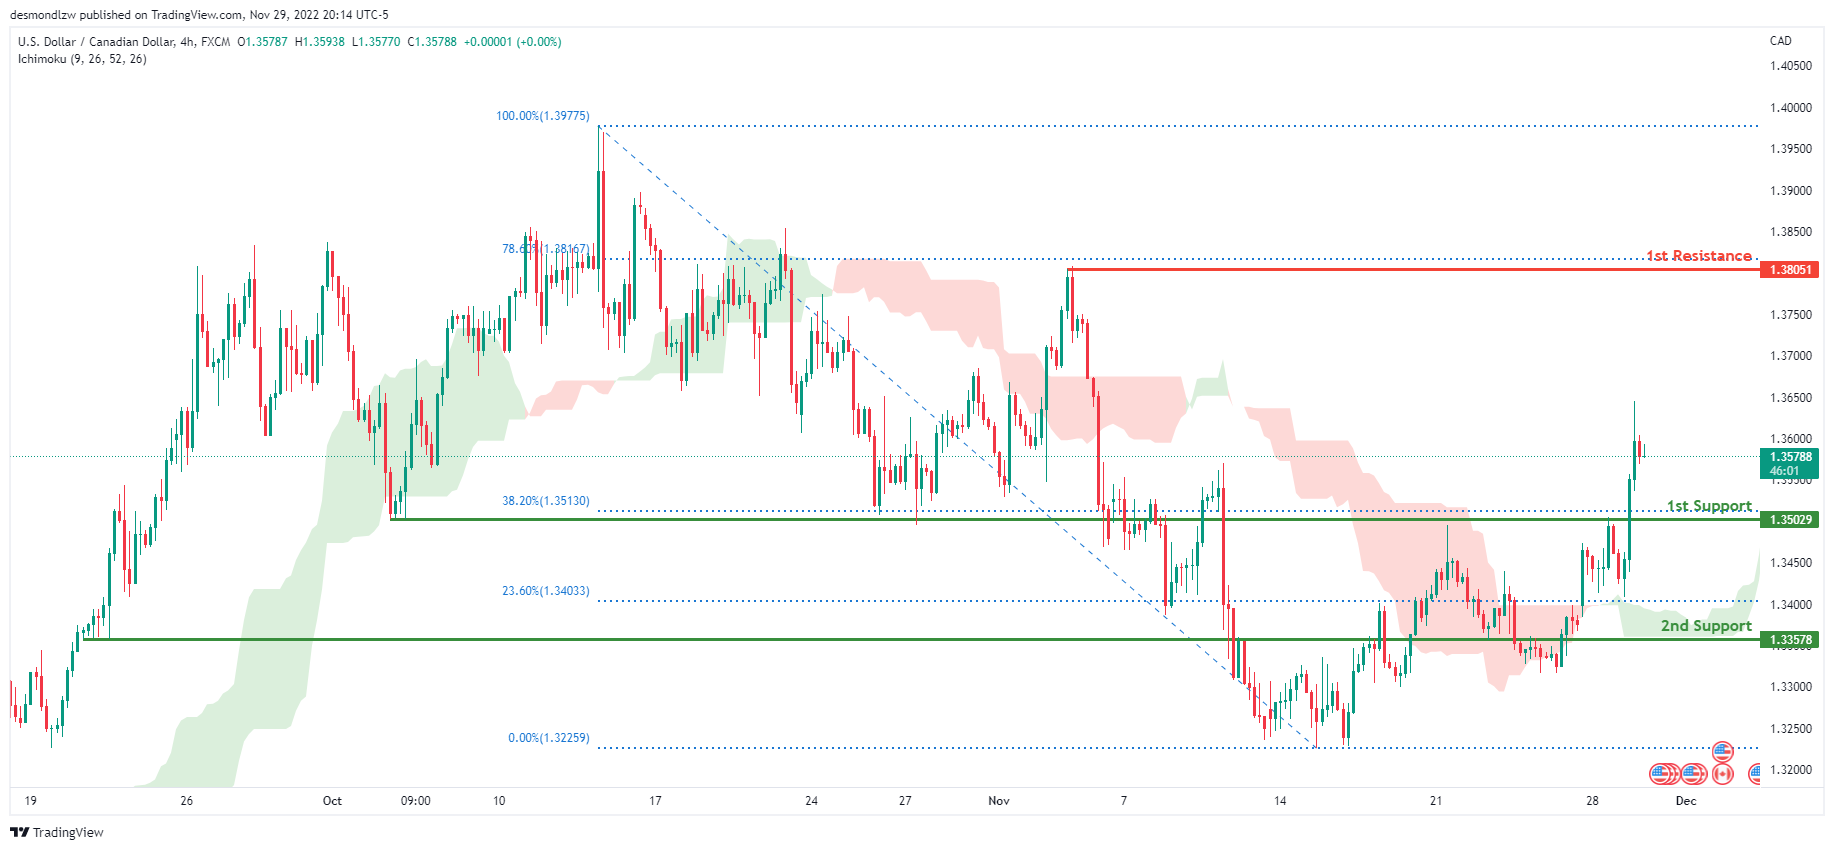
On the H4 chart, the overall bias for USDCAD is bullish. To add confluence to this, the price is above the Ichimoku cloud which indicates a bullish market. If this bullish momentum continues, expect the price to continue heading towards the 1st resistance at 1.38051, where the 78.6% Fibonacci line is. In an alternative scenario, price could head back down to retest the 1st support at 1.35029, where the 38.2% Fibonacci line is.
Areas of consideration:
- H4 time frame, 1st resistance at 1.38051
- H4 time frame, 1st support at 1.35029
OIL:
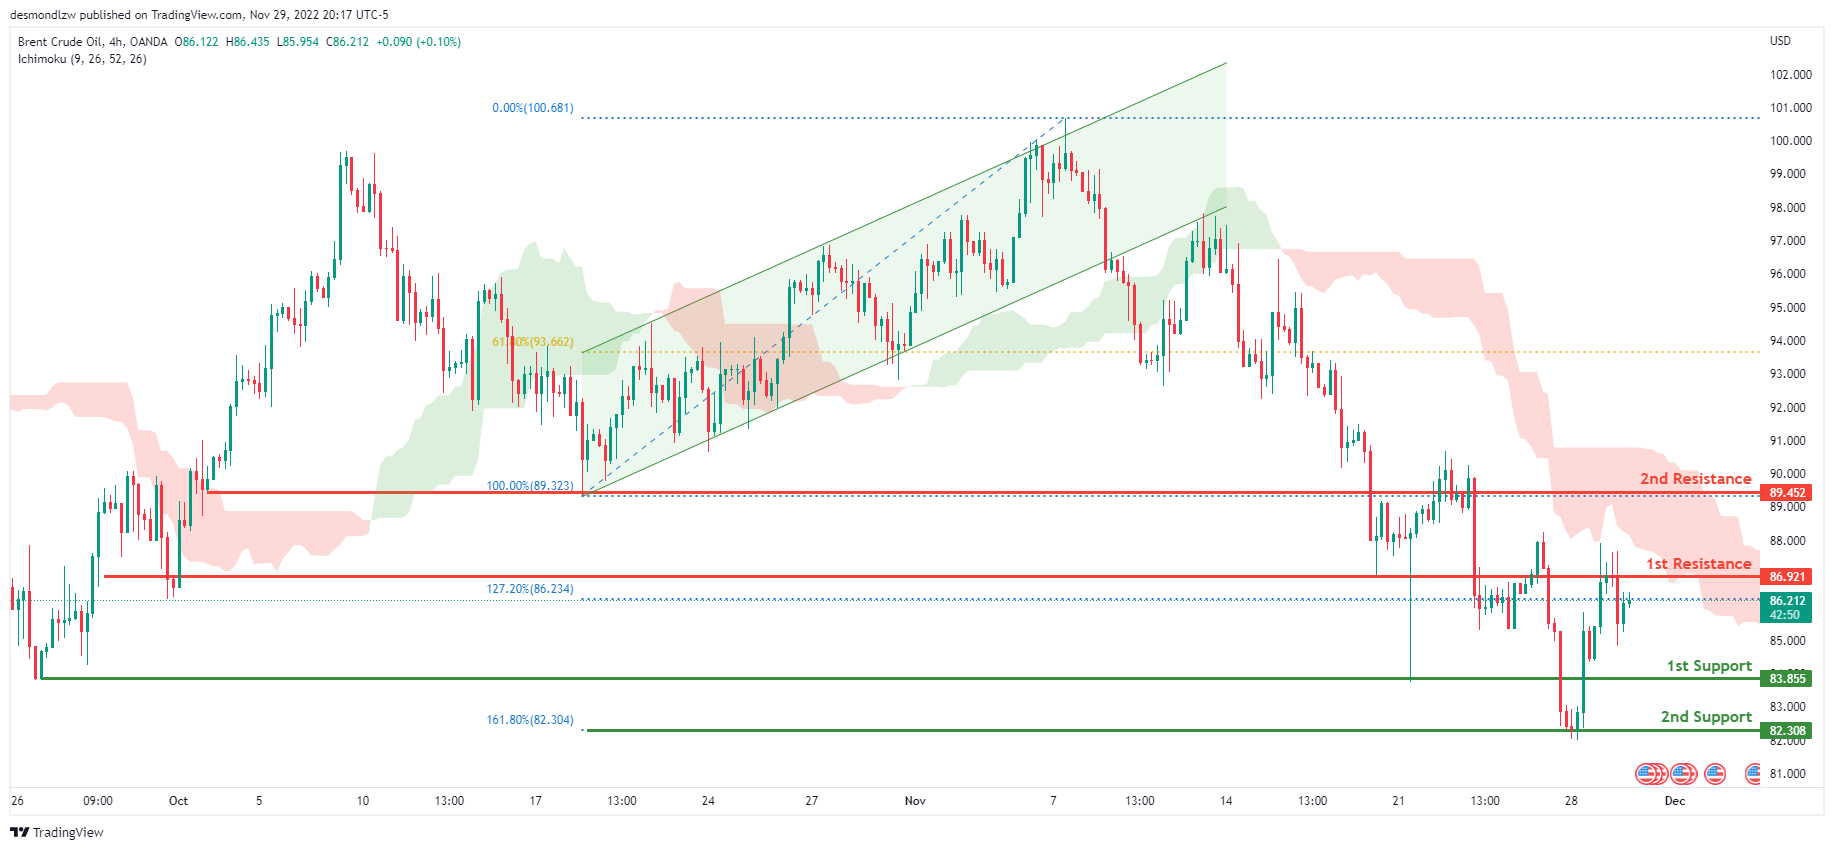
Looking at the H4 chart, my overall bias for BCOUSD is bearish due to the current price being below the Ichimoku cloud, indicating a bearish market. If this bearish momentum continues, expect price to possibly break the 1st support at 83.855, where the previous swing low is located, before heading towards the 2nd support at 82.308, where the 161.8% Fibonacci extension line is. In an alternate scenario, price could possibly head back up to retest the 1st resistance level at 86.921, where the 127.2% Fibonacci extension line is located. If this 1st resistance line is broken, expect the price to head towards the 2nd resistance line at 89.452, where the previous swing low is.
Areas of consideration:
- H4 time frame, 1st resistance at 86.921
- H4 time frame, 2nd resistance at 89.452
- H4 time frame, 1st support at 83.855
- H4 time frame, 2nd support at 82.308
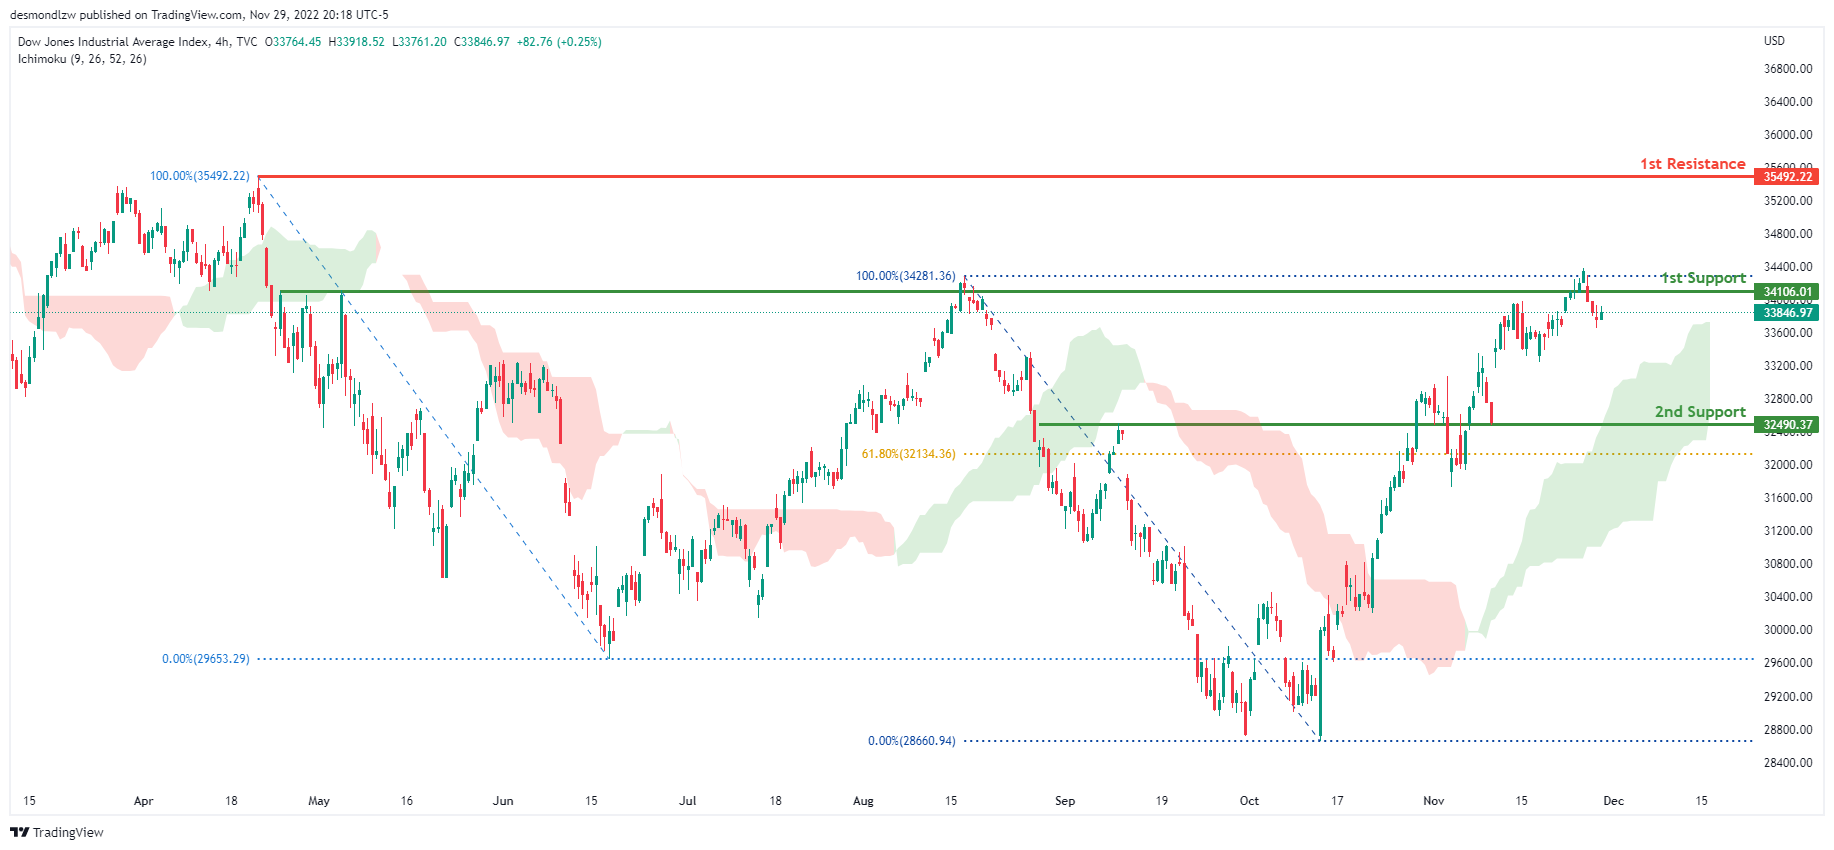
Dow Jones Industrial Average:
On the H4 chart, the overall bias for DJI is bullish. To add confluence to this, the price is above the Ichimoku cloud which indicates a bullish market. If this bullish momentum continues, expect the price to continue heading towards the 1st resistance line at 35492.22, where the previous swing high is. In an alternative scenario, price could head back down breaking the 1st support line at 34106.01, where the previous swing high is before heading towards the 2nd support at 32490.37, where the 61.8% Fibonacci line is.
Areas of consideration:
- H4 time frame, 1st support at 34106.01
- H4 time frame, 2nd support at 32490.37
- H4 time frame, 1st Resistance at 35492.22
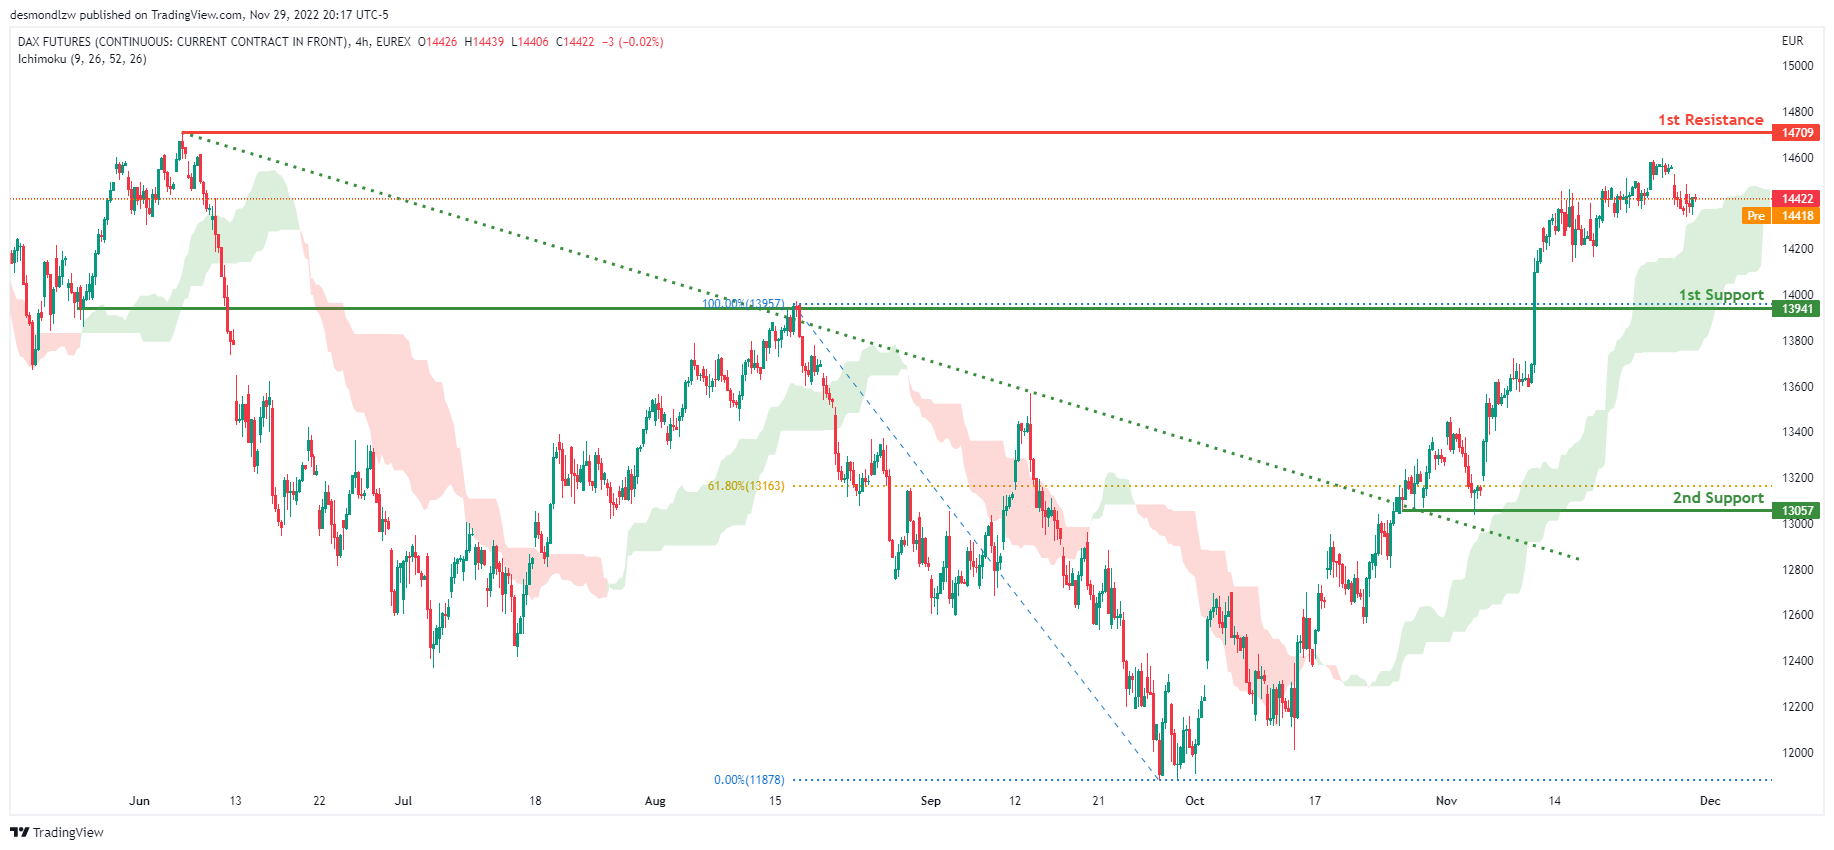
DAX:
The H4 chart shows a bullish bias, with price breaking through the descending trendline and rising above the Ichimoku cloud. Price is expected to maintain its bullish momentum and rise to the first resistance level at 14709, where the previous swing high is located. Alternatively, the price could fall to the first support level at 13941, where the previous swing high was.
Areas of consideration:
- H4 time frame, 1st resistance is at 14709
- H4 time frame, 1st support is at 13941
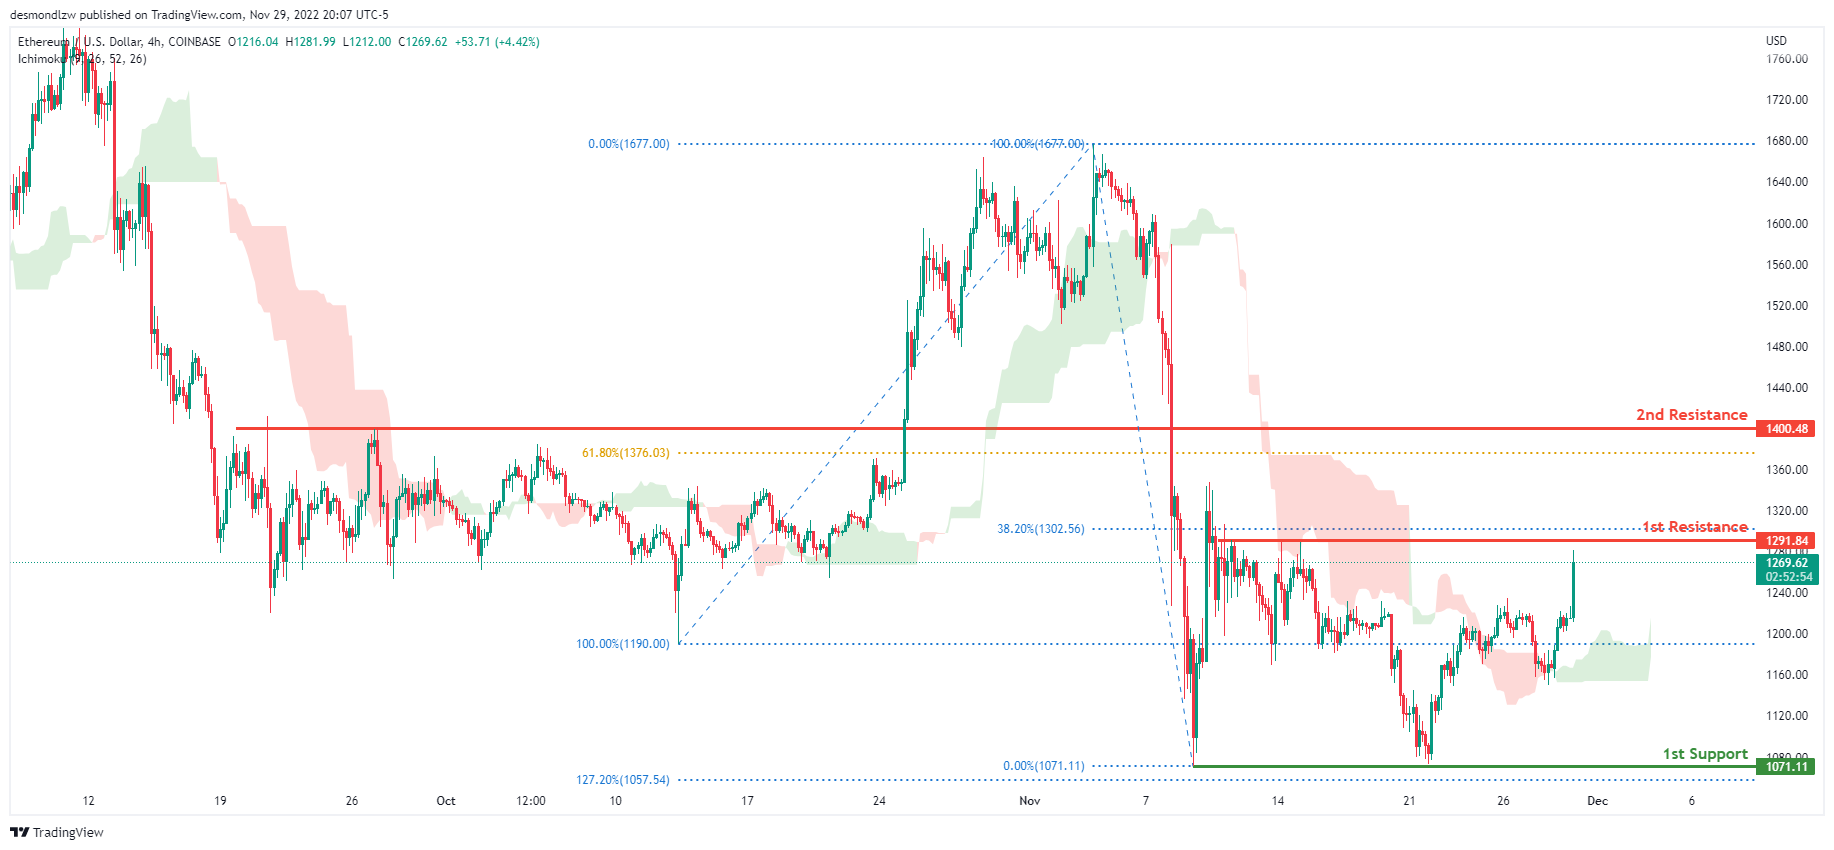
ETHUSD:
Looking at the H4 chart, my overall bias for ETHUSD is bearish due to the current price being below the Ichimoku cloud, indicating a bearish market .If this bearish momentum continues, expect price to possibly head towards the 1st support at 1071.11, where the -previous swing low is located. In an alternate scenario, price could possibly head back up towards the 1st resistance level at 1291.84, where the 38.2% Fibonacci line is located.
Areas of consideration:
- H4 time frame, 1st resistance of 1291.84
- H4 time frame, 1st support at 1071.11
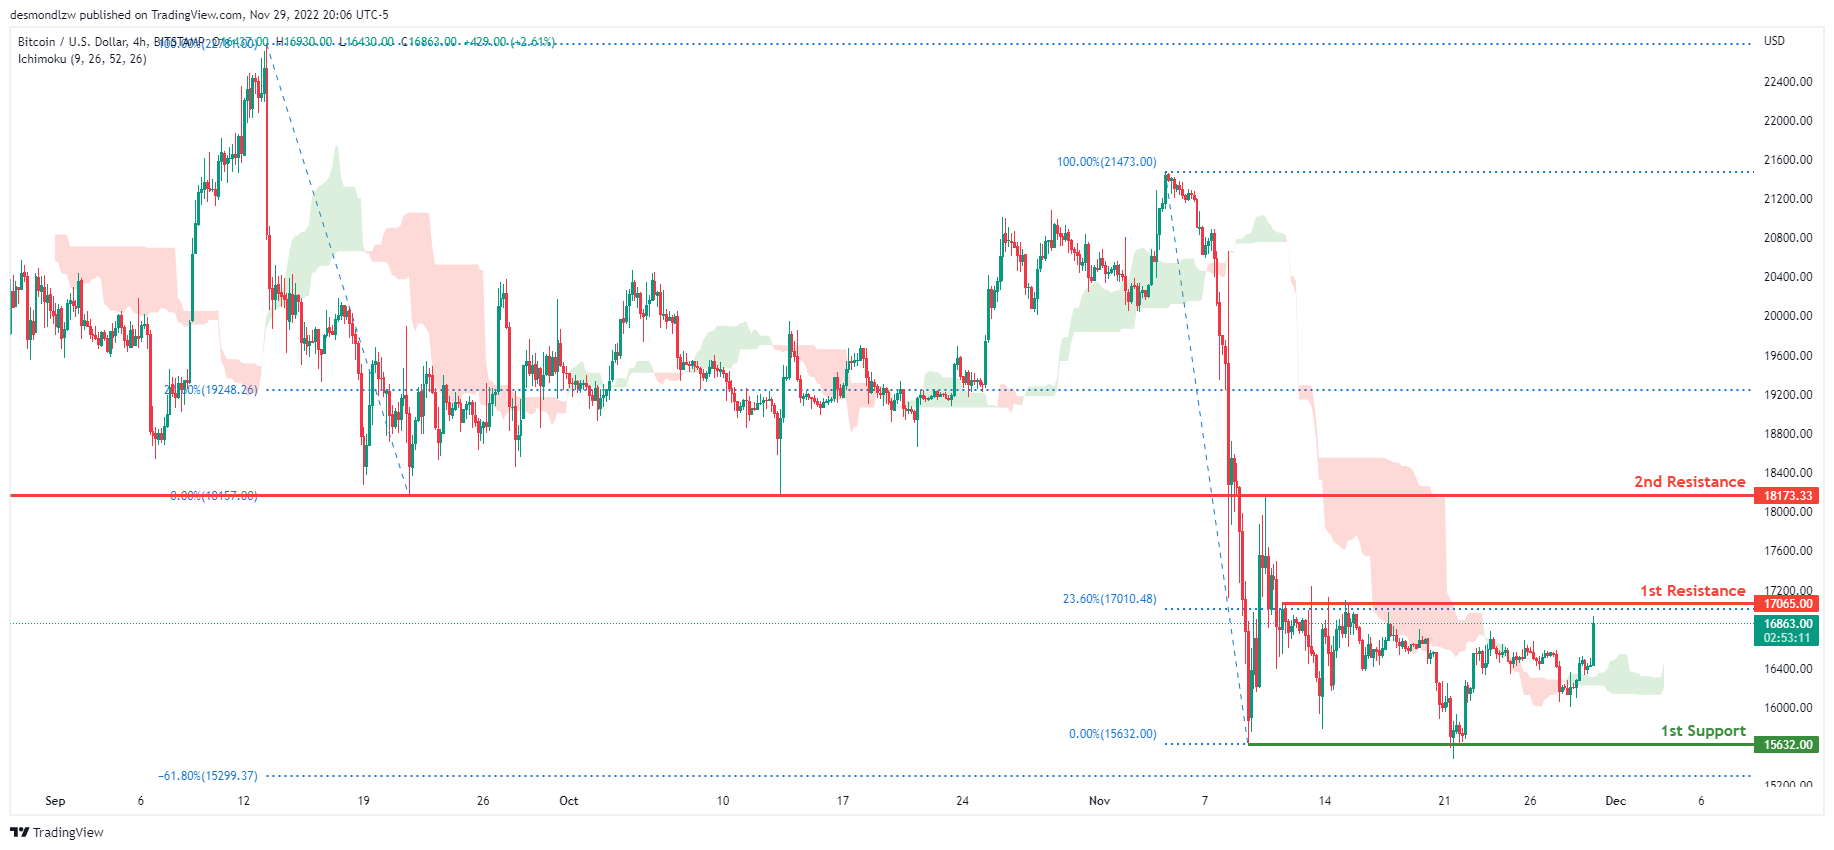
BTCUSD:
On the H4 chart, the overall bias for BTCUSD is bearish. To add confluence to this, the price is below the Ichimoku cloud which indicates a bearish market. If this bearish momentum continues, expect the price to head towards the 1st support line at 15632.00, where the previous swing low is located. In an alternative scenario, price could head back up to retest the 1st resistance line at 17065.00, where the 23.6% Fibonacci line is located.
Areas of consideration:
- H4 time frame, 1st resistance 17065.00
- H4 time frame, 1st support at 15632.00
S&P 500:
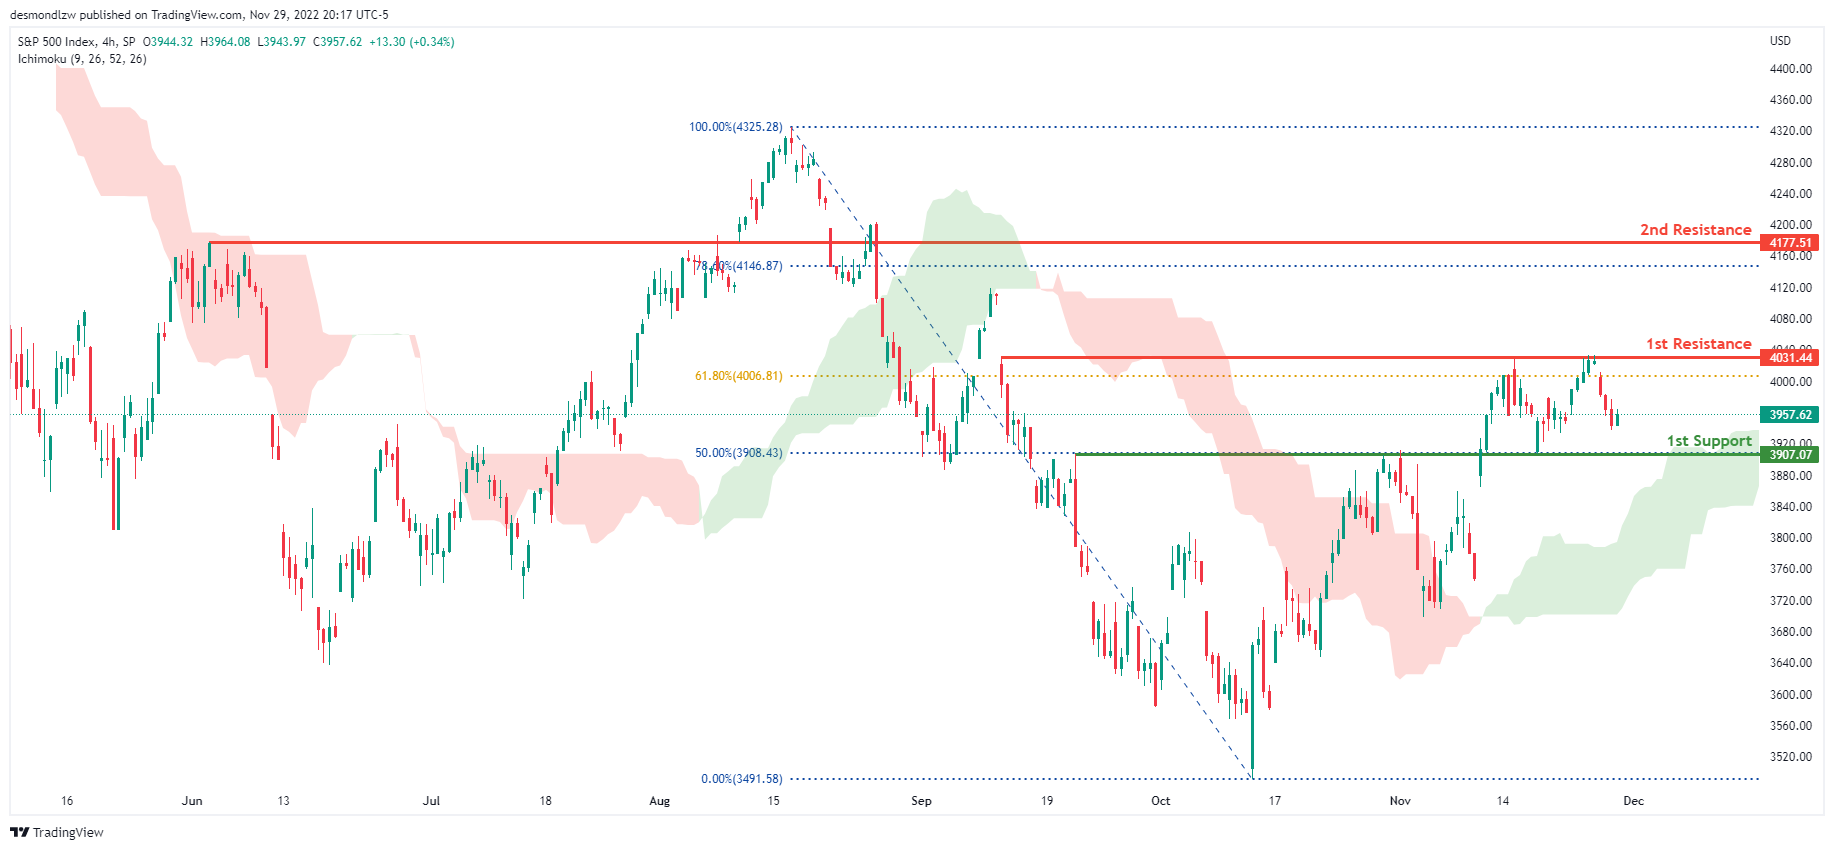
The overall bias for the S&500 on the H4 chart is bullish, with prices above the Ichimoku cloud. If the bullish momentum continues, the price will rise to the first resistance line at 4031.44, where the 61.8% Fibonacci line is located. If the first resistance line is broken, the second resistance line is at 4119.28, which is the previous swing high and the 78.6% Fibonacci line. In an alternate scenario, price could return to the first support line at 3907.07, where the 50% Fibonacci line is located.
Areas of consideration:
- H4 time frame, 1st support at 3907.07
- H4 time frame, 1st resistance at 4031.44
- H4 time frame, 2nd resistance at 4119.28