Sample Category Title
Sunset Market Commentary
Markets
Have we seen the peak in headline (EMU) inflation? No, if we follow yesterday’s guidance by ECB Lagarde. Yes, if we look at today’s market reaction following some national inflation readings. Spanish inflation fell by 0.5% M/M with the annual pace decelerating from 7.3% Y/Y to 6.8% Y/Y. Lower fuel and utility prices were the main culprit. Spanish headline inflation peaked back in July, but is more exception than rule in Europe. Core inflation (6.3% Y/Y) remained strong – and rising -though due to above-average monthly price gains in services and core goods. ECB vice-president de Guindos recently said that core inflation is the signal to follow for the ECB. The same divergence between headline and core inflation is visible in Belgium: the headline number fell by 0.23% M/M with the Y/Y-pace down to 10.63% from 12.27%. Core inflation accelerated from 6.5% Y/Y in October to 7.16% in November. Finally, German inflation stabilized on a monthly basis with the Y/Y-reading as expected down to 11.3% from 11.6%. Beyond package holidays and energy, the underlying picture remains one of persistently high price pressures. The topping off of headline inflation convinced final doubters on the outcome of the mid-December ECB policy meeting: it will be a slowdown to a 50 bps rate hike, bringing the ECB deposit rate at 2% instead of sticking with the current 75 bps pace. New inflation forecasts will nevertheless still be upwardly revised for at least 2023. It implies that the central bank will start 2023 still with a tightening bias, as policy rate hikes will be complemented with the start of the balance sheet reduction (running down APP portfolio). European money markets currently discount a second 50 bps rate hike in February, followed by two 25 bps moves in March and May after which the ECB reaches its peak policy rate. We continue to err on the hawkish side of these forecasts as inflationary pressures won’t abide in 2023.
German yields today lose 3.8 bps (30-yr) to 7.3 bps (2-yr). The euro swap curve turns less inverse with yields up to 6.2 bps lower at the front end and flat at the very long end. German Bunds clearly outperform US Treasuries with YS yields 2 to 3 bps higher across the curve today. The single currency for most of the European session held strong despite the loss of interest rate support. EUR/USD mostly changed hands near 1.0350. As US trading got going, new dollar strength entered the equation, pulling the pair to the low 1.03 area. Yesterday’s hawkish Fed comments might still be at play with several Fed governors pushing back against current market expectations which all of a sudden seem rather dovish given this month’s correction lower in yields. Fed Chair Powell speaks tomorrow.
News Headlines
Overall Belgian CPI declined 0.23% M/M, slowing the headline figure from 12,27% Y/Y in October to 10.63% Y/Y this month. In a Y/Y perspective, energy prices remain a major contributor (36.07% Y/Y rise, 3.62 ppt contribution). Food inflation still accelerates, rising 14.48% Y/Y and adding 2.76 ppt to overall inflation. Due to a further rise in inflation of processed food and services, core inflation rose accelerated from 6.50% to 7.16%. Services inflation also rose from 5.22% to 5.49% Y/Y. The most significant price increases on a monthly basis were registered for alcoholic beverages, clothing, travels abroad, vegetables, restaurants and cafés, dairy products and bread and cereals. However, electricity, natural gas, holiday villages, non-durable household goods and maintenance charges in multi-occupied buildings had a decreasing effect on the index.
Canadian Q3 GDP rose a stronger than expected 2.9% Q/Q (annualized) down from 3.2% in Q2, but beating expectations for a more modest growth of about 1.5%. Details were mixed. Final consumption expenditure rose 0.8% Q/Qa, but this was due to non-profit consumption and government consumption (5.3%). Household consumption declined 1.0%. Gross fixed capital formation also turned negative (-5.0% ) for the second consecutive quarter with residential structures investment falling 15.4% Q/Qa. Inventories added slightly to growth (0.23 ppt). Net exports added 3.38 ppts, with exports rising 8.6% and imports contracting 1.5%. The household savings rate rose from 5.1% to 5.7%. Households disposable income increased by 3.3% Q/Qa, from 3.8% in Q2. The monthly GDP indicator for October suggests a further cooling, easing to 0.1% M/M from 0.3%. The loonie lost further ground with USD/CAD extending its recent rebound to 1.355. The 2-y yield (3.93%) rises marginally (+1.5 bps) in line with the US.
EUR/USD Mid-Day Outlook
Daily Pivots: (S1) 1.0281; (P) 1.0389; (R1) 1.0448; More...
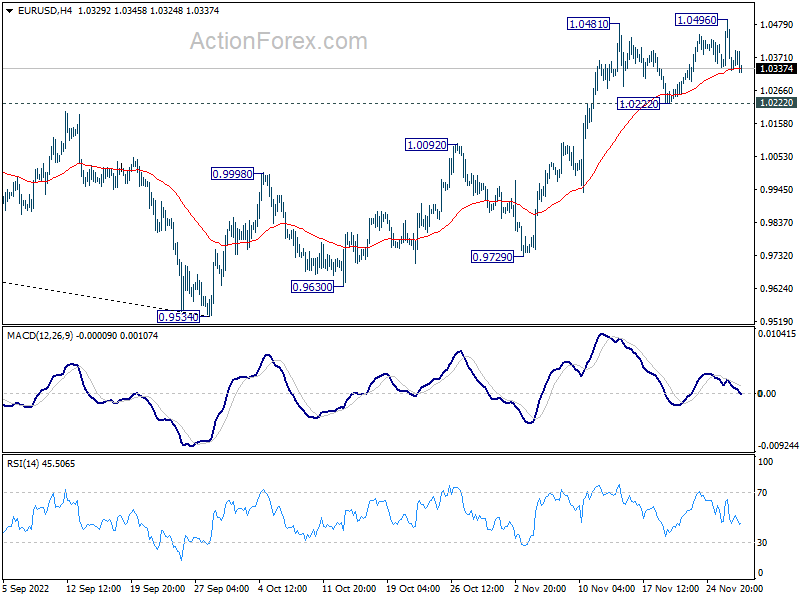
Intraday bias in EUR/USD stays neutral for the moment and more consolidations could be seen. Further rally is expected as long as 1.0222 support holds. Break of 1.0496 will resume the rise from 0.9534 to 1.0609 fibonacci level. However, firm break of 1.0222 will turn bias back to the downside for 1.0092 resistance turned support.
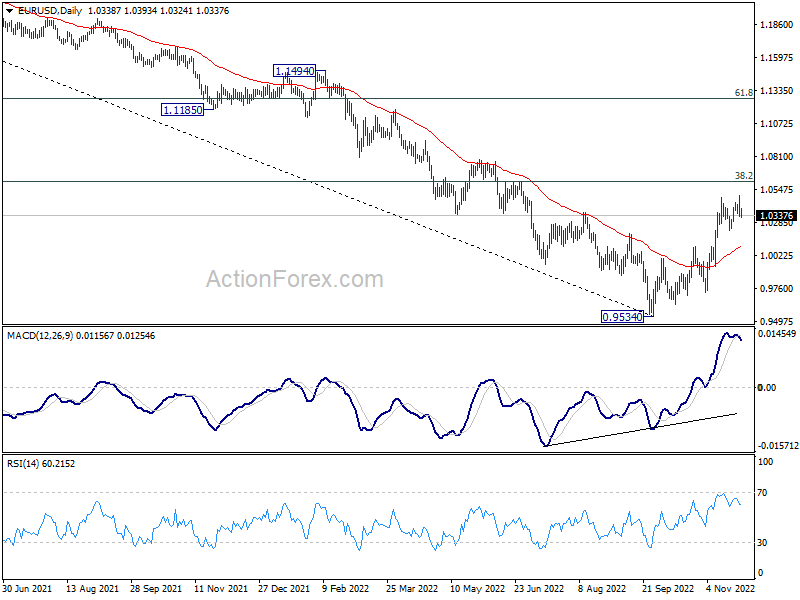
In the bigger picture, a medium term bottom was in place at 0.9534, on bullish convergence condition in daily MACD. Even as a corrective rise, rally from 0.9534 should target 38.2% retracement of 1.2348 (2021 high) to 0.9534 at 1.0609. Sustained trading above 55 week EMA (now at 1.0566) will raise the chance of trend reversal and target 61.8% retracement at 1.1273. This will now remain the favored case as long as 1.0092 resistance turned support holds.
GBP/USD Mid-Day Outlook
Daily Pivots: (S1) 1.1893; (P) 1.2006; (R1) 1.2070; More...
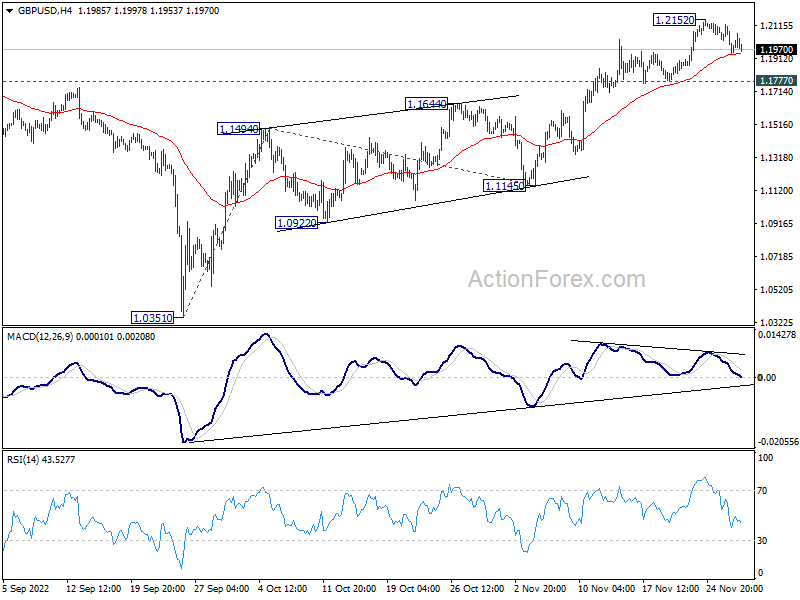
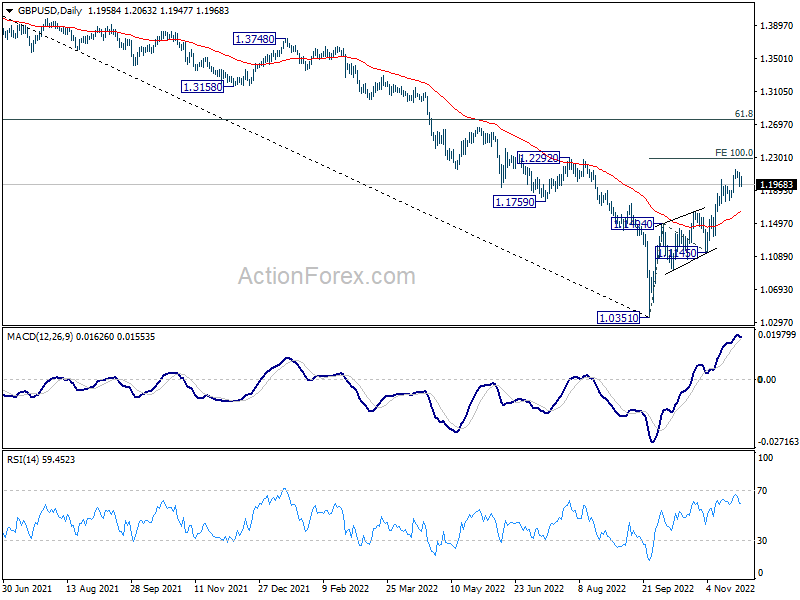
GBP/USD's consolidation from 1.2152 is extending and intraday bias stays neutral. Further rally is expected with 1.1777 support intact. Break of 1.2152will target 100% projection of 1.0351 to 1.1494 from 1.1145 at 1.2288 first. Sustained break there will pave the way to 1.2759 medium term fibonacci level.
In the bigger picture, rise from 1.0351 medium term bottom is at least correcting whole down trend from 1.4248 (2021 high). Further rise is expected as long as 1.1145 support holds. Next target is 61.8% retracement of 1.4248 to 1.0351 at 1.2759. Sustained break there will pave the way back to 1.4248.
USD/CHF Mid-Day Outlook
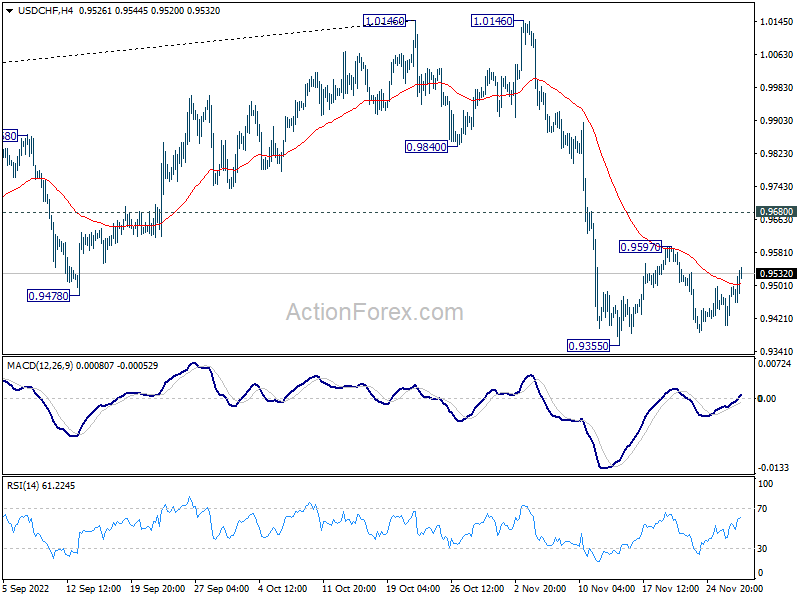
Daily Pivots: (S1) 0.9431; (P) 0.9465; (R1) 0.9523; More...
Intraday bias in USD/CHF remains neutral as range trading continues. On the downside, firm break of 0.9355 will resume the decline from 1.0146 to 0.9287 fibonacci level. Near term outlook will remain bearish as long as 0.9680 minor resistance holds, in case of another recovery.
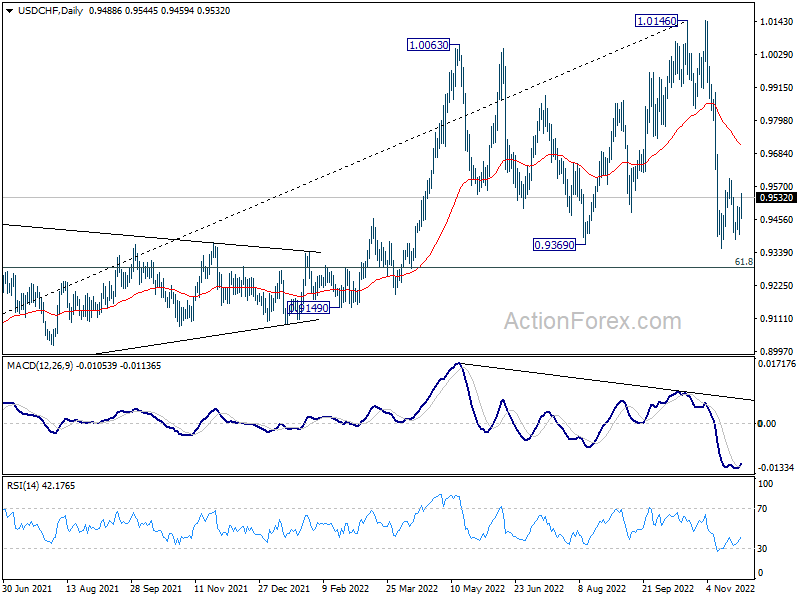
In the bigger picture, rise from 0.8756 (2021 low) has completed at 1.0146, well ahead of 1.0342 long term resistance (2016 high). Based on current downside momentum, fall from 1.0146 might be a medium term down trend itself. Break of 61.8% retracement of 0.8756 to 1.0146 at 0.9287 will pave the way to 0.8756. In any case, risk will stay on the downside as long as 55 day EMA (now at 0.9726) holds.
USD/JPY Mid-Day Outlook
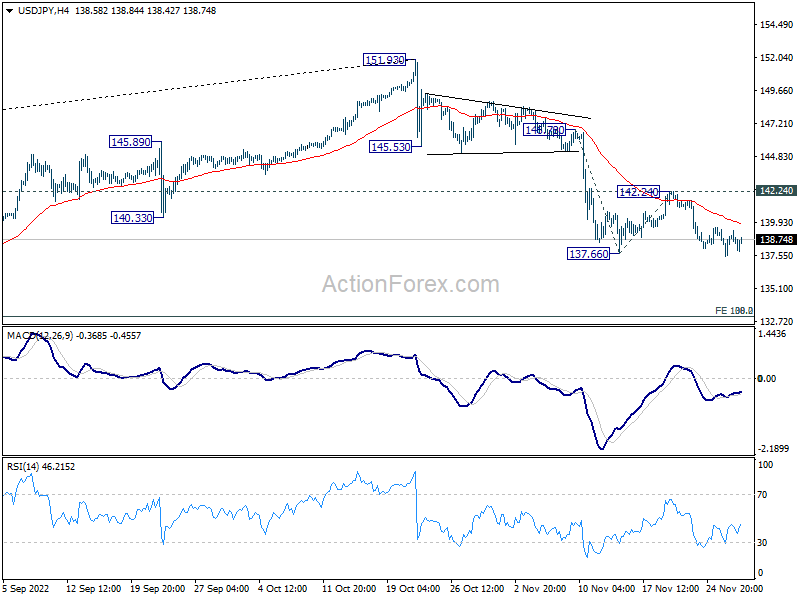
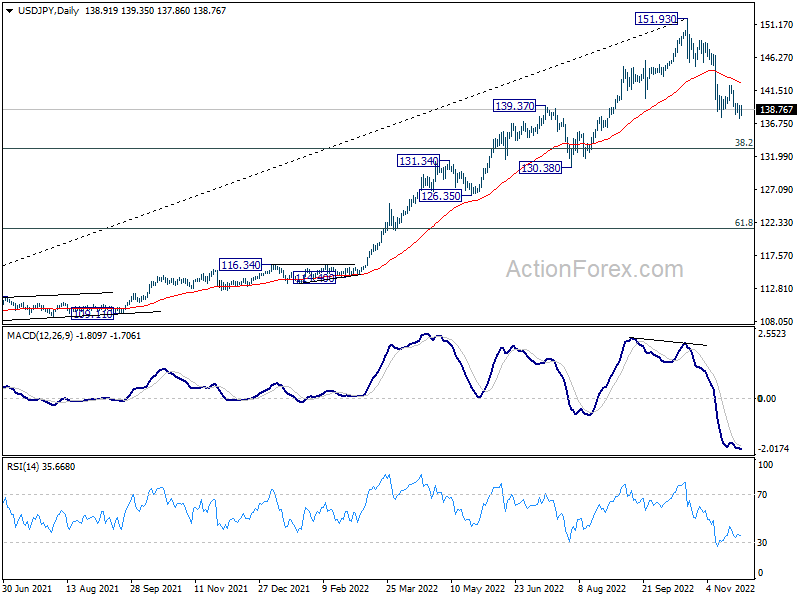
Daily Pivots: (S1) 137.79; (P) 138.62; (R1) 139.74; More...
Outlook is USD/JPY is unchanged as fall from 151.93 is resuming. Intraday bias stays mildly on the downside. Next target is 100% projection of 146.78 to 137.66 from 142.24 at 133.12, which is close to 133.07 medium term fibonacci level. For now, near term outlook will remain bearish as long as 142.24 resistance holds, in case of recovery.
In the bigger picture, a medium term top should be formed at 151.93. Fall from there is correcting larger up trend from 102.58. It's too early to call for bearish trend reversal. But even as a corrective move, such decline should target 38.2% retracement of 102.58 to 151.93 at 133.07, or further to 55 week EMA (now at 131.22).
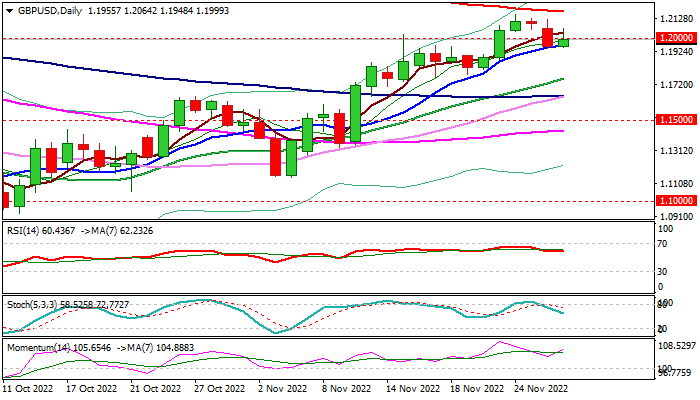
GBP/USD: Bullish Near-Term Bias above 10DMA
Cable regained traction on improved risk sentiment and probes above 1.20 after recent pullback from a multi-month high (1.2153) found footstep at 1.1957 (rising 10DMA).
Larger uptrend remains intact but pausing after a failure on approach on falling 200DMA (1.2166).
Strong bullish momentum on daily chart and Tenkan-sen/Kijun-sen in bullish configuration add to positive near-term outlook, with the action holding above 10DMA seen as a minimum requirement and lift above 1.2000/48 (psychological / 50% retracement of 1.3748/1.0348) to confirm bullish stance for renewed attack at 200DMA, violation of which would signal bullish continuation.
Caution on loss of 10DMA handle which would signal deeper pullback and put bulls on hold.
Res: 1.2048; 1.2166; 1.2200; 1.2286
Sup: 1.1940; 1.1872; 1.1753; 1.1647
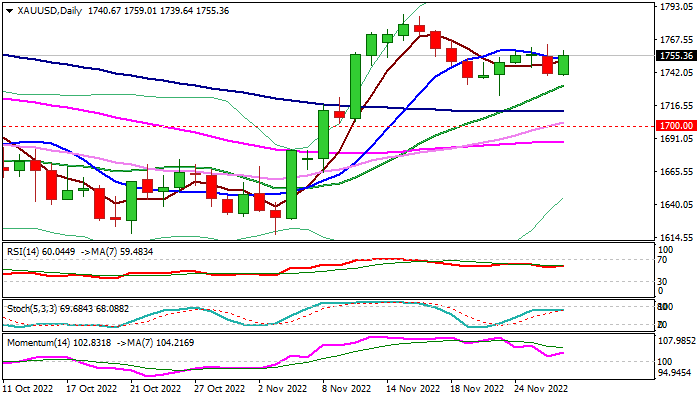
Gold Regains Traction But Near-term Direction Will Depend on Signals of Fed’s Next Steps
Gold jumped nearly 1% on Tuesday, fully reversing Monday’s drop, sparked by hawkish comments from Fed officials on interest rate hikes.
The dollar lost traction quickly after news, providing fresh support for the metal, though gains are still fragile as traders await Wednesday’s speech of Fed Chair Powell, to get more clues about the central bank’s next steps.
If Powell indicates that the end of rate hike cycle is close, gold would receive strong boost, while the metal’s price would come under fresh pressure on signs that Fed remains on course for further policy tightening, but the pace of future rate hikes would also play important role.
Near-term structure remains positive as daily moving averages are in bullish setup and positive momentum is rising, though the action needs to clear pivotal barriers at $1762/63 (Fibo 61.8% of $1786/$1723 Monday’s high) to signal a higher low ($1723) and shift near-term focus towards key barriers at $1786/$1800 (Nov 15 high / 200DMA / psychological).
Conversely, loss of temporary higher base at $1739 would weaken near-term structure and expose key supports at $1723/21 (Nov 23 spike low / Fibo 38.2% of $1616$1786 rally).
Res: 1763; 1771; 1786; 1800
Sup: 1746; 1739; 1731; 1721
Canada’s GDP Continues to Grow Above Trend
The Canadian economy expanded by 2.9% quarter/quarter annualized (q/q) in Q3 2022. However, the flash estimate for October showed no change.
Loosening supply chains and demand for commodities spurred GDP. Exports (+8.6%) were driven by high demand for "crude oil and bitumen, and farm and fishing products", while inventories surged to their highest level on record on the back of "manufacturing, wholesale trade, and retail trade sectors."
In contrast, spending by households fell by 1% q/q annualized. Statistics Canada noted that this was driven by a significant decline in spending on goods, with reduced outlays on "new trucks, vans and sport utility vehicles, furniture and furnishings, and pharmaceutical products." Spending on services was positive (+3.8% q/q), partly driven by still elevated spending on travel.
Housing investment contracted again, down 15.4% q/q. The impact of higher interest rates continues to weigh on the housing sector as resale activity and renovation spending fell.
Key Implications
Canada's economy continues its streak of above trend growth in the third quarter, but there are worrying trends under the headline. Going into today's report, we were looking for the impact of loosening supply chains and the push to develop Canada's infrastructure to take advantage of our abundance of natural resources. This showed up in strong export growth and continued investment of machinery, equipment, and non-residential structures. However, rising interest rates and high inflation have weighed on consumer spending, a trend which has started earlier than expected, but should last through next year.
Canadian bond yields are moving higher this morning, with the CA 2-year and 10-year at 3.97% and 3.0%. It is expected that the BoC will continue to hike its policy rate by 50 basis points in December, though we believe an end to the hiking cycle is coming. The interest rate sensitive sectors have retrenched, with residential investment down 15.3% in Q3. This is flowing to the consumer side of the economy, which will force the BoC to soon pause and wait for the impact of past interest rate hikes to have their effect on the economy.
A Promising Response to Protests
Investors in Europe remain in a cautious mood on Tuesday as they await a huge influx of economic data in the coming days, while US futures are also pointing to modest gains ahead of the open.
Stocks in China soared after a difficult start to the week, on the hope that the country's zero-Covid policy stance may be relaxed further. That had been the expectation in recent weeks, with a modest softening recently seen being followed by a more substantial shift in the spring.
But protests in recent days on the back of record Covid cases and tighter restrictions could have gone either way and that made investors extremely anxious on Monday. While I can imagine the path from zero-Covid to zero restrictions will be long and full of potholes and hurdles, the response to the unrest has appeared more promising than feared.
It may well be that the leadership had already been gauging the public mood on restrictions and had, as has been rumoured, already been planning its exit strategy which recent comments align with. Either way, it appears zero-Covid has reached a crossroads and the direction of travel now will determine investor appetite toward Chinese stocks going into 2023. Today's rebound suggests there's some optimism.
So much uncertainty in the oil markets
It's already been a very volatile week in oil markets and that's unlikely to change over the coming days given the immense uncertainty over the Russian price cap, China's Covid stance, and the OPEC+ meeting. The market is being led by speculation and leaks, of which there have been plenty and will likely be much more, which makes for very lively conditions given the wide array of possible outcomes.
And as you'd expect, all of the above are linked to varying degrees. A record surge in Covid cases is leading to tightening restrictions weighing on activity, spurring protests, and forcing a rethink of the country's zero-Covid policy. They've also weighed heavily on prices with China being the world's second-largest economy which will impact the demand forecasts from OPEC+ unless the group opts to hold on and await more clear signals and data.
Also influencing the group's analysis will be Russian sanctions, most notably the price cap which is yet to be fully agreed upon. The latest rumours suggest the cap could be agreed to as low as $62 which is much lower than the $65-70 previously leaked and could therefore have a bigger impact on Russian output. And of course, Russia itself is a key member of the OPEC+ alliance, just to complicate matters further and could throw its weight around in those discussions and make an agreement harder and more uncertain.
Oh and the EU does have a tendency to make full use of deadlines, with the next sanctions due to come into force the day after OPEC+ meets, which is of course on a Sunday for some reason. Not that the alliance always comes to quick agreements and on this occasion, you could easily forgive them for not. Needless to say, this is certainly a recipe for volatile trading conditions.
Volatile and awaiting key US data
Gold is rallying again on Tuesday on the back of a softer dollar but has only largely wiped out Monday's losses leaving it basically net even on the week. I expect to see plenty more volatility in the coming days given the amount of US economic data that are being released including inflation, GDP, and the jobs report. That sets us up nicely as we move into the final month of the year with only a couple of weeks to go until the hotly anticipated CPI inflation report and Fed meeting.
Choppy and vulnerable
Bitcoin has also reversed its Monday losses, rallying 1.5% so far today. The cryptocurrency has remained volatile in the aftermath of another plunge following the FTX collapse and now trades more than 75% from its highs just over a year ago. Even now it remains vulnerable as we continue to discover what the full contagion effect will be and what else will be uncovered.
USD/CAD Mid-Day Outlook
Daily Pivots: (S1) 1.3420; (P) 1.3462; (R1) 1.3539; More....
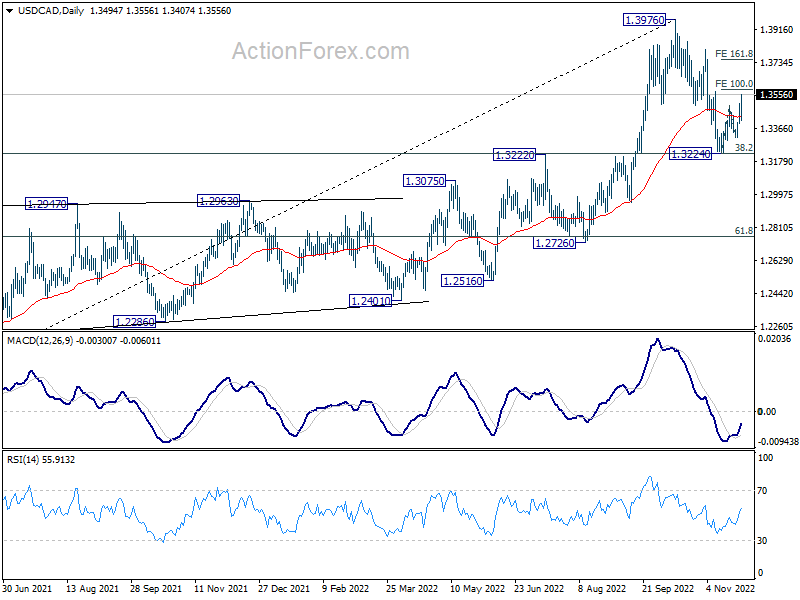
USD/CAD's rise from 1.3224 resumed by breaking through 1.3494 resistance finally. The development adds to the case that correction from 1.3976 has completed at 1.3224. Intraday bias is now back on the upside. Further break of 100% projection of 1.3224 to 1.3494 from 1.3315 at 1.3585 should prompt upside acceleration to 161.8% projection at 1.3752. This will now remain the favored case as long as 1.3315 support holds, in case of retreat.
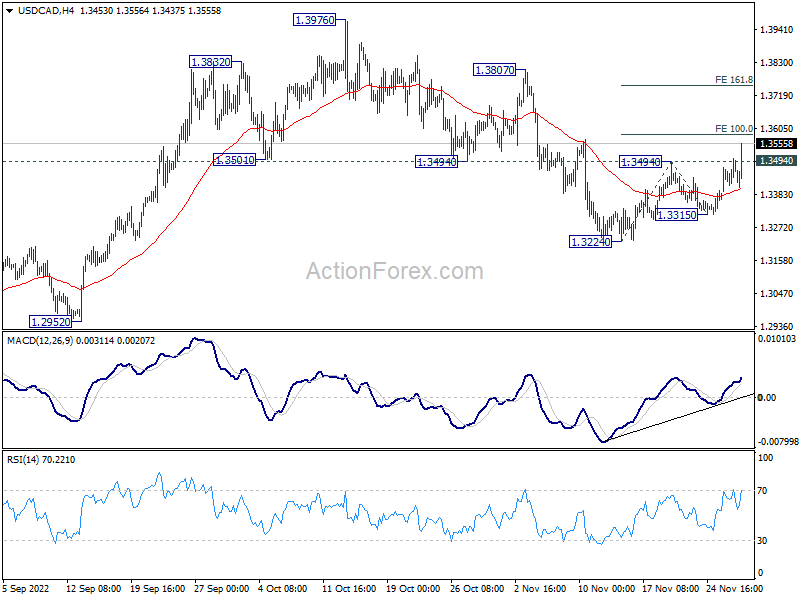
In the bigger picture, as long as 1.3222 cluster support (38.2% retracement of 1.2005 to 1.3976 at 1.3223) holds, larger up trend from 1.2005 (2021 low) is still expected to resume through 1.3976 high at a later stage. However, firm break of 1.3222/3 will indicate that the trend might have reversed. Deeper fall would be seen to next cluster support at 1.2726 (61.8% retracement at 1.2758).