Sample Category Title
USDJPY Trades Flat as Latest Rebound Falters
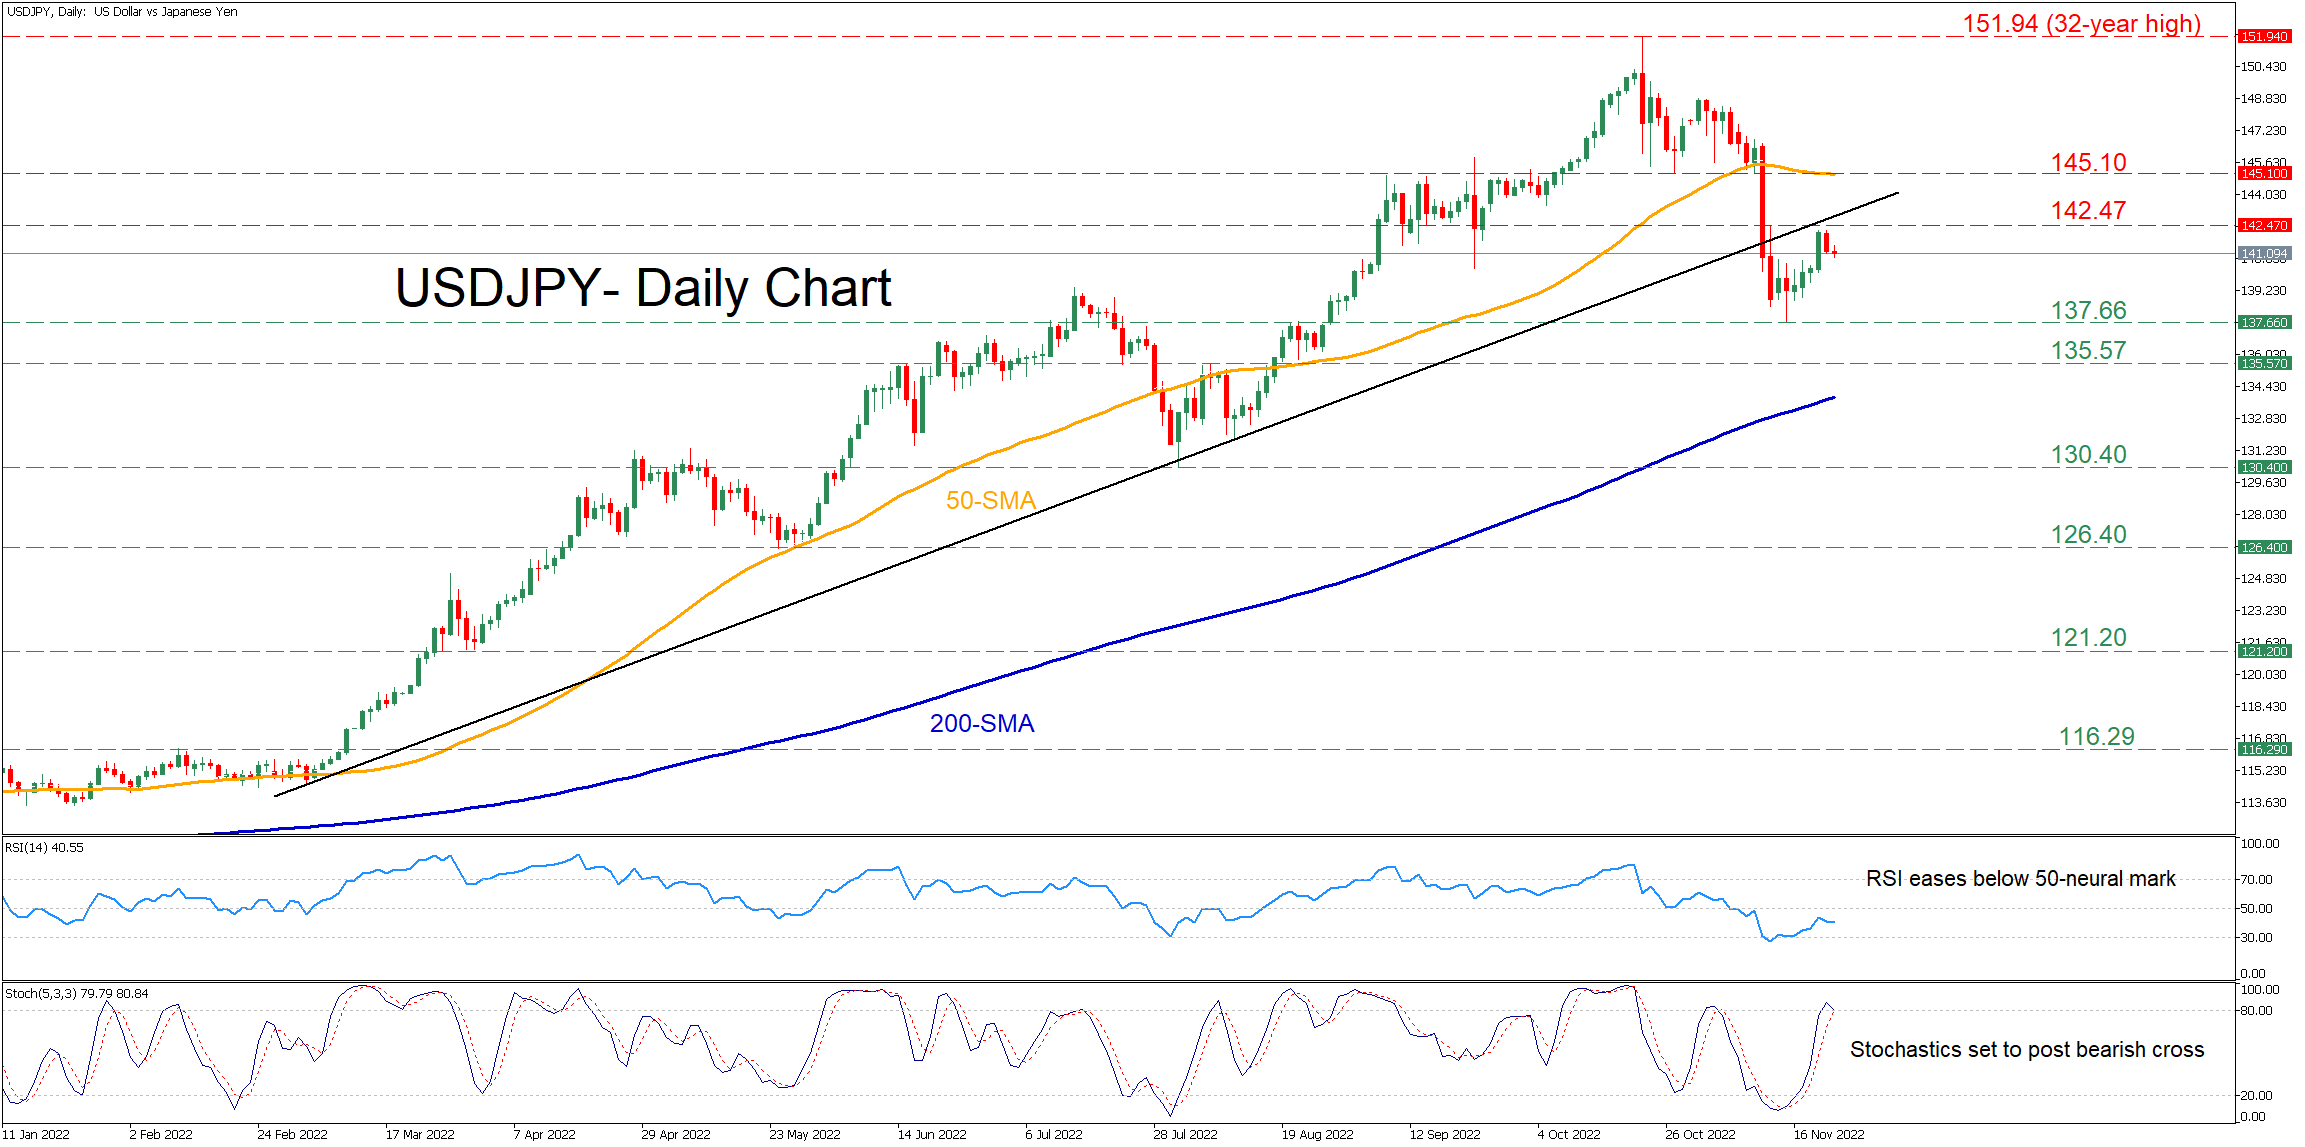
USDJPY has been in a prolonged uptrend for almost two years, crossing above its historical resistance levels to post a 32-year high of 151.94 in October. Even though the pair declined moderately from its recent multi-year peak, it has been attempting a rebound in the last few daily sessions.
The momentum indicators currently suggest that bearish forces are in control. Specifically, the RSI is hovering below its 50-neutral mark, while the stochastic oscillator is set to post a bearish cross near the overbought area.
If sellers push the price lower, initial support could be found at the recent low of 137.66. Should that floor collapse, the bears might aim for 135.57, which has acted both as resistance and support in the previous months. Failing to halt there, the August low of 130.40 could provide further downside protection.
To the upside, bullish actions could come to a halt at the recent resistance of 142.47. Breaking above that zone, the price could then ascend to challenge the 50-day simple moving average (SMA), currently at 145.10. An upside violation of the latter may set the stage for the 32-year high of 151.94.
In brief, it appears that USDJPY’s latest rebound is running out of steam. Therefore, a break below the 137.66 could validate the continuation of the pair’s short-term downtrend.
NZDUSD Needs to Surpass 0.6200 for More Bullish Actions
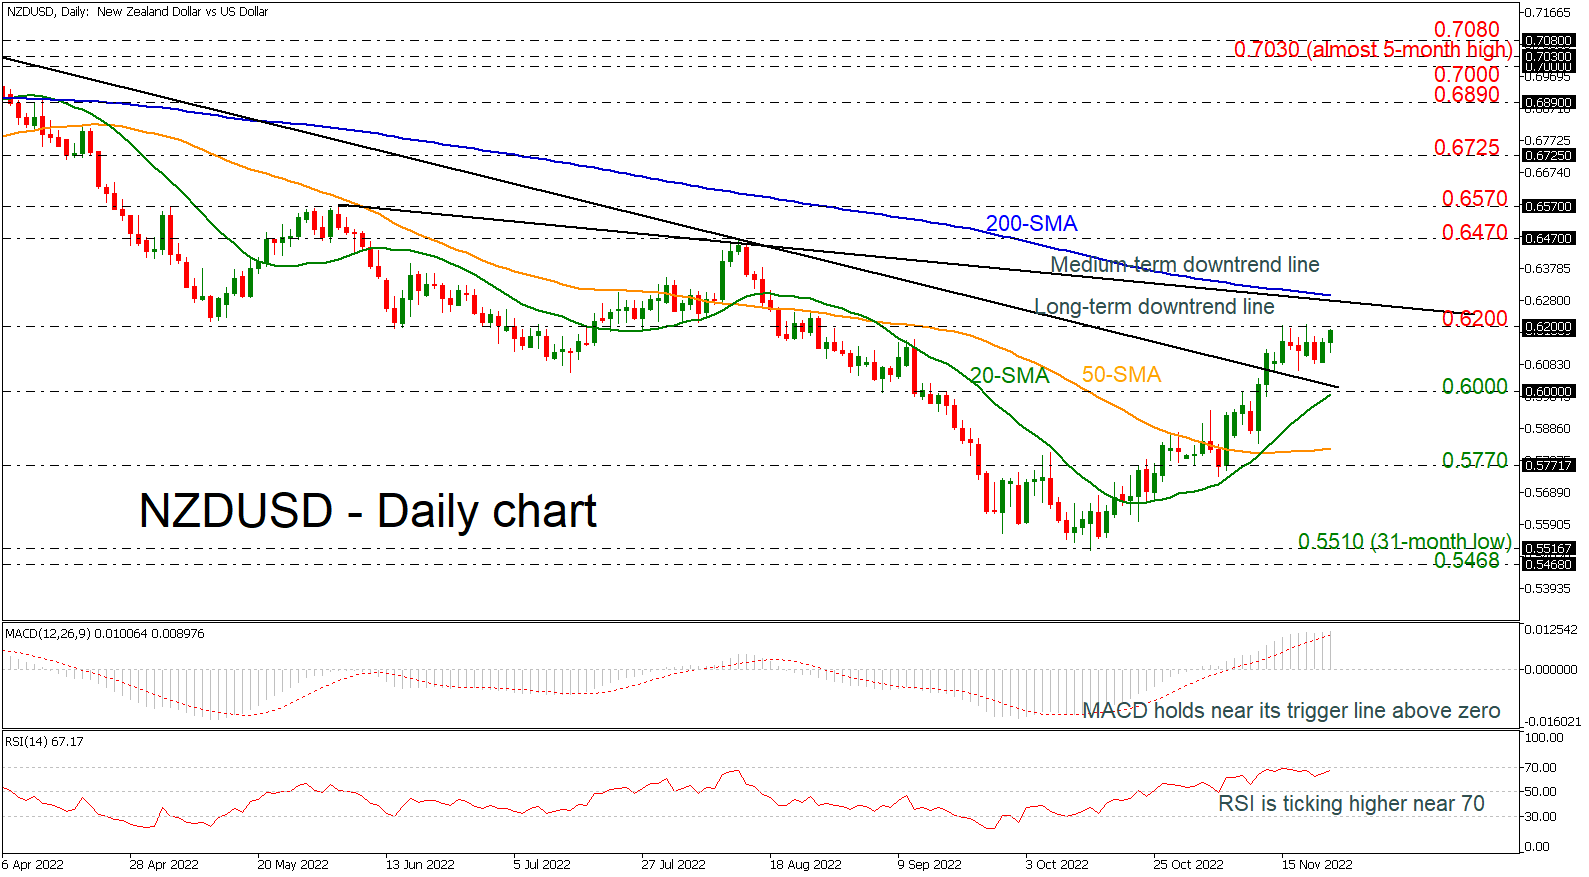
NZDUSD is testing the 0.6200 psychological mark once again after it broke the long-term descending trend line to the upside.
The bullish bias in the short-term may be endorsed if there is a climb above the medium-term downtrend line and the 200-day simple moving average (SMA) at 0.6290. The MACD oscillator is mirroring the several tests for more bullish actions as the oscillator is moving sideways near its trigger line. However, the RSI is heading north approaching the 70 level.
To the upside, an initial important resistance region at 0.6200 must be penetrated to hit the 200-day SMA at 0.6290. Conquering this, the 0.6470 barrier could halt the climb towards the 0.6570 level, a break of which would shift the outlook to positive.
Otherwise, if sellers manage to close decisively below the long-term falling line and the 0.6000 handle, which overlaps with the 20-day SMA, the 50-day SMA at 0.5820 may challenge bears’ efforts to revisit the 0.5770 support level.
All in all, NZDUSD needs some more boost to surpass the immediate resistance of 0.6200 and the 200-day SMA to keep the bias to the upside.
France PMI composite dropped to 48.8, vital support from services ended
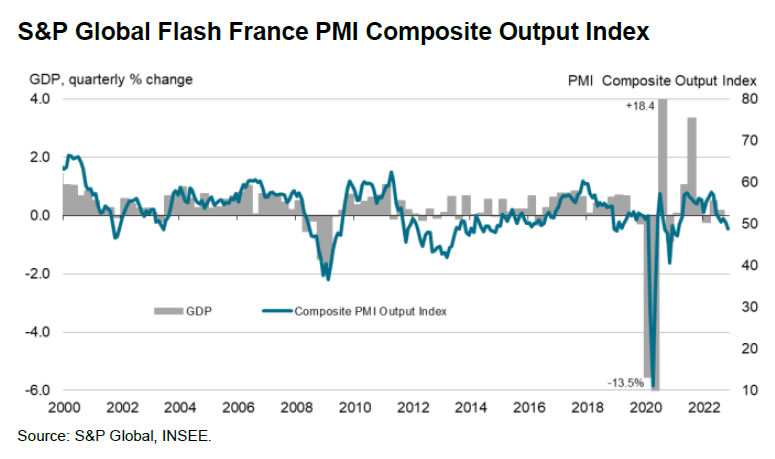
France PMI Manufacturing improved from 47.2 to 49.1 in November. But PMI Services dropped from 51.7 to 49.4, a 20-month low. PMI Composite dropped from 50.2 to 48.8, a 21-month low.
Joe Hayes, Senior Economist at S&P Global Market Intelligence said:
"Although France's manufacturing sector has been in a downturn since the start of the second half of 2022, overall economic activity levels throughout this period had been propped up by continued growth in services. This vital support for the economy looks to have ended as service sector output fell for the first time in just over a year-and-a-half in November. As a consequence, 'flash' PMI data pointed to the first reduction in French economic activity since February 2021.
EUR/USD Extends Yesterday’s Advance, Count Down to the November PMIs
Markets
Risk-on held the upper hand during an initially choppy trading session yesterday. Stocks finished 0.5-1.4% higher in Europe and the US despite the grim economic picture painted by the OECD. Core bonds gained ground with US Treasuries outperforming Bunds. The likes of Fed’s Mester and George continued to strike a hawkish tone but US markets for now show little appetite to push up the expected terminal rate beyond the 5% currently priced in. ECB’s Holzmann repeated his support for a 75 bps move, based on current data, in December while Nagel said he’ll push for a start of QT early next year. US yields fell 3.8 bps at the front and more than 7 bps from the 5y through the long end. German yields eased no more than 2 bps. The dollar declined across the board. EUR/USD rose from 1.024 to the 1.03 big figure. USD/JPY eased to 141.23, losing one big figure on the day. Sterling’s performance was disappointing given the risk mood. EUR/GBP rebounded from intraday lows near 0.863 after closing in on the Aug-Oct upward sloping trend line to finish marginally higher around 0.867. Brent oil pared gains after testing the $90/b level but still closed slightly higher at $88.36. Bloomberg later reported the EU is likely to water down its sanctions proposal for a price cap on Russian oil by delaying the full implementation and softening key shipping provisions. Gas was not impressed by Europe’s suggestion either to cap prices at €275/MWh, a level only seen in August when prices soared beyond €300/MWh.
Asian-Pacific stocks have another green session this morning. South Korea outperforms with an 1.87% advance. Japanese markets are closed. China ekes out a small gain even as violent protests broke out in Zhengzhou. Tensions boiled as the city is now almost one month under tough corona restrictions, highlighting how the zero-Covid strategy is testing its limits. The yuan lost a tad after Bloomberg ran the story. USD/CNY rises to 7.15 currently. The kiwi dollar and yields increase following the RBNZ’s record 75 bps hike and upgraded terminal rate forecasts (see below). Other dollar pairs trade mixed. EUR/USD extends yesterday’s advance to 1.0327 as European investors count down to the November PMIs. Consensus expects a further, controlled decline to 46 for the manufacturing and 48 for the services sector, bringing the composite to 47 (from 47.3 in October). Risks are two-sided with (stagflation) details from the October reading foretelling another weaker-than-expected November figure. But rapidly falling gas prices in recent weeks may have acted as a counterbalancing factor. In the current market environment, any positive surprise in any case would have to be material enough to jolt German/European yields. The reaction in EUR/USD, however, is also dependent on the FOMC meeting minutes, published tonight. US money markets currently have found a short-term equilibrium around a 5% peak policy rate. Investors will be looking for clues whether that’s what Powell had in mind when he said the “ultimate level of interest rates will be higher than previously expected” at the Nov 2 meeting.
News Headlines
The Reserve Bank of New Zealand accelerated its tightening cycle this morning, raising the policy rate for the first time by 75 bps, from 3.5% to 4.25%. The central bank agrees that frontloading its actions are necessary to ensure inflation returns to target (2% with 1% tolerance band). Too high core CPI, employment beyond maximum sustainable levels and rising near-term inflation expectations left the RBNZ no other choice. They even contemplated hiking by 100 bps. In its new quarterly monetary policy report, they significantly raised their peak policy rate forecast from 4% to 5.50/5.75% with the peak rate remaining above 5% during fiscal (March) years 2024 and 2025. Inflation forecasts over the policy horizon are raised to 7.5% for FY 2023 (from 5.3% in August), 3.8% for 2024 (from 3.1%) and 2.4% for 2025 (from 2%). The RBNZ is willing to go the extra mile in its inflation fight even as it comes at a significant economic cost: FY 2024 and 2025 growth is expected to average 0.1% (from 0.8% & 1% in August) with the unemployment rate rising to 5.7% in FY 2025 (from 5%). The hawkish RBNZ goes against the market trend of expecting central banks to slow it down to safeguard growth. NZD swap rates rise by 10 bps (20y) to 25 bps (2y) with the curve inverting further. The kiwi dollar fails to profit from the yield support. NZD/USD spike from 0.614 to 0.619 (November high resistance) on the release before paring gains to 0.617.
Elliott Wave View: Silver (XAGUSD) 5 Waves Down Suggests Further Downside
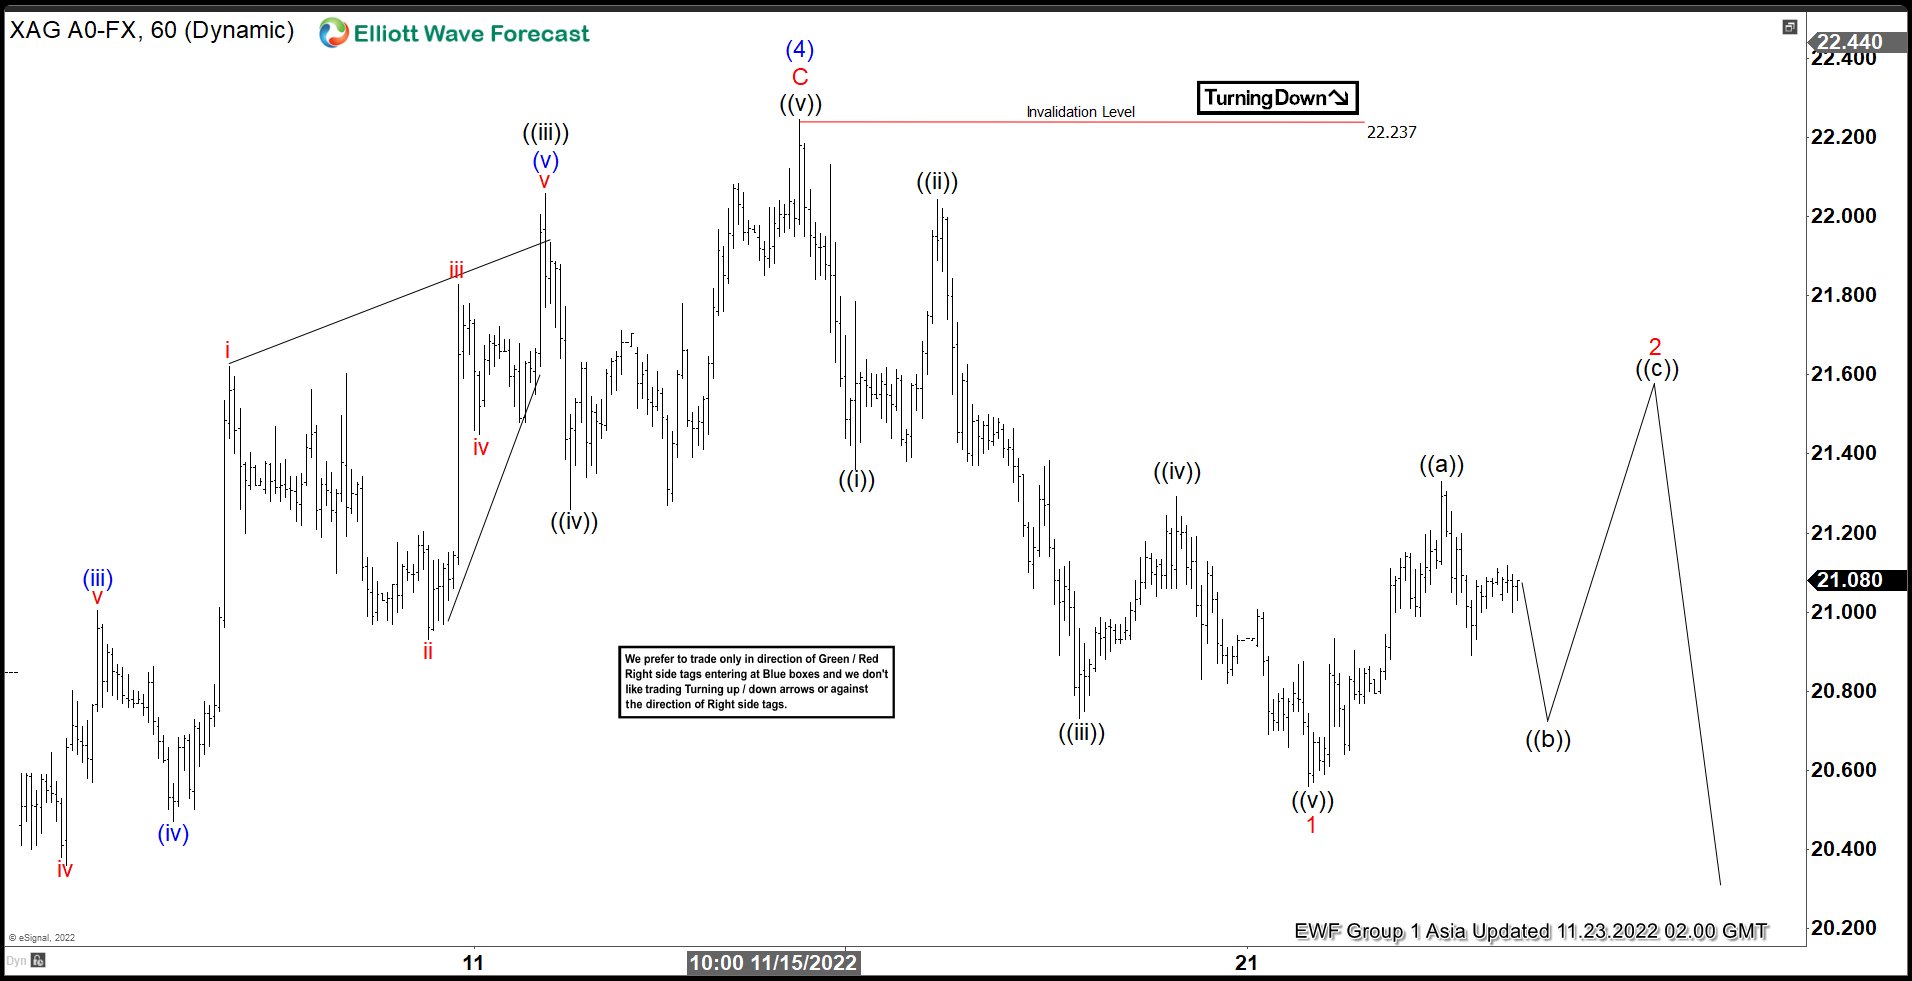
Short term Elliott Wave View in Silver (XAGUSD) suggests cycle from 7.14.2022 low completed as a flat structure. Up from 7.14.2022 low, wave A ended at 20.86 and pullback in wave B ended at 18.07 as another flat correction. Up from there, Index rallied in another 5 waves in lesser degree. Wave ((i)) ended at 18.94 and wave ((ii)) ended at 18.26. Silver resumed higher in wave ((iii)) towards 22.06, dips in wave ((iv)) ended at 21.26, and final wave ((v)) ended at 22.25 which completed wave C of (4).
From here, XAGUSD dropped in wave (5) forming an impulse in lesser degree. Down from wave (4), wave ((i)) ended at 21.36 and wave ((ii)) ended at 22.05. Silver continue lower ended wave ((iii)) at 20.73, bounce in wave ((iv)) ended at 21.29. Last wave ((v)) finished at 20.56 to complete the impulse as wave 1. Wave 2 rally is in progress as a zigzag structure. Up from wave 1, wave ((a)) ended at 21.329. Expect wave ((b)) pullback then another leg higher in wave ((c)) to end wave 2. As far as the metal stays below 22.25, we expect the rally to fail and the metal to resume lower in wave 3.
Silver (XAGUSD) 60 Minutes Elliott Wave Chart
No Recession, But Slow and Low Growth
The OECD said the global economy will avoid a recession this year, and next year, and that unemployment rates won’t skyrocket. That was the good news.
But growth will be low and slow, and inflation will remain high, keeping central bank policies tight. That was the bad news
The S&P500 gained 1.36% yesterday, while Nasdaq added almost 1.50%. Strong earnings from retailers improved sentiment before Thanksgiving.
Energy stocks performed well on the back of a sustained recovery in crude oil. Exxon Mobil jumped almost 3%, as US crude consolidated near the $80pb in the wake of a dive after the WSJ reported that OPEC+ considered half a million-barrel increase in production, that Saudi rapidly denied.
Plus, the European gas futures are headed higher on news that Gazprom now threatens to cut gas supplies to Europe next week via the last remaining pipeline… and the timing is excellent, as we just start to feel the cold of the winter. Higher nat gas futures are also a positive factor for oil.
One piece of news that could soften the bull’s hand is the EU that could soften its plan regarding the Russian oil price cap. They propose a 45-day transition period, and a potentially higher price level than the $40-60 range markets are looking for. The Europeans will be discussing all that today. What the Europeans want is to keep the Russian oil in the market to avoid a price spike, but to prevent Russians from earning too much of their oil sales.
Goodbye Shell
Shell rallied 5% on announcement that the company will be reviewing its investment in the UK to avoid paying windfall taxes to the British government. BP rallied 6.52%.
The rally in energy stocks helped FTSE gain more than 1%, along with the less aggressive recession prediction from the OECD, compared to the Brits themselves.
FTSE futures hint at a slightly positive start on Wednesday.
RBNZ raises by 75bp
The Reserve Bank of New Zealand (RBNZ) raised its rates by 75bp as expected today. In total, the RBNZ raised the rates by 400bp since October last year, but the kiwi didn’t benefit from higher RBNZ rates, as the US dollar has been, and is, the only driver of value in the FX markets right now.
The US dollar softened yesterday allowing some majors to breathe. The EURUSD rebounded past 1.0320 in the middle of mixed comments about what the European Central Bank (ECB) should do at its next meeting.
The expectation is tilted toward a 50bp hike in the December meeting, as the latest Reuters poll showed that more than 70% of the participants expect a 50bp hike next month, instead of a 75bp hike.
Will that slow the euro’s recovery? It depends on the US dollar. If the dollar extends losses, the EURUSD will do fine. The thing is, the outlook for the US dollar remains positive on the back of a still hawkish Fed, which will fight inflation until the last drop of blood.
In precious metals, gold slid yesterday despite a softer US dollar, and softer yields. The yellow metal eased to $1732 an ounce, and the hawkish Fed expectations should further pressure the price toward the $1720 target, to meet the 100-DMA.
Elsewhere, the Chinese stocks are not looking good as Beijing and Shanghai put stricter rules to slow the Covid contagion, again! But Alibaba rebounded almost 4% in HK today, on news that Ant Group would pay a fine over a billion USD, which would end a regulatory overhaul, and help the company go on with its life, and secure the much-awaited financial company holding license.
In cryptocurrencies, traders remain on the edge, on news that a ‘substantial amount’ of FTX assets have either been stolen or are missing. Bitcoin however resists. The price of a coin recovered above $16K yesterday, but risks remain tilted to the downside.
EU Proposes Gas Price Cap
Market movers today
The most important data releases today will be the November Flash PMIs from the euro area, UK and US. We expect the figures to provide further evidence of GDP contraction in the euro area already during Q4, while we still see the US economy continuing its modest growth.
From the US, October durable goods orders and new home sales as well as the latest MBA mortgage figures will be released. While the broader economy is still in decent shape, especially the housing market has already showed clear signs of weakness.
Finally, FOMC minutes will be released tonight, and markets will naturally pay close attention to any hints about the future rate hike outlook.
The 60 second overview
The global economy should avoid a recession next year despite a long lasting inflation problem. That is the overall picture from the OECD's new economic outlook. The euro area and the US slows to 0.5% growth next year. At least for the euro area that looks like a good case scenario with inflation remaining at very high levels in the outlook.
Consumers: Euro area consumer confidence increased in November for the second month straight, as fiscal measures combined with falling natural gas and electricity prices looks to have broken the downward trend. Despite the recovery, confidence remains at deeply recessionary levels and still points to a significant decline in private consumption during Q4.
Gas price cap: After months of wrangling and fraught negotiations, the Commission proposed a cap level of 275 euros per megawatt-hour, well above current levels of about 120 euros, but below the highs the continent suffered in the summer. The proposal still needs approval from national governments and will be discussed by energy ministers at their emergency meeting in Brussels on Thursday, see euronews.
Record rate hike: The Reserve Bank of New Zealand (RBNZ) hiked the official cash rate by 75bp overnight to 4.25%, in line with our expectations. Markets were divided between 50 and 75bp ahead of the meeting, but RBNZ had discussed hiking by even 100bp, which together with the overall hawkish communication supported NZD FX. Earlier in the fall RBNZ was already eyeing the end of its hiking cycle, but the clear upside surprise in the Q3 underlying inflation combined with the recent rise in inflation expectations forced it to up the hiking pace from the earlier 50bp instead. We have highlighted similar risks of further tightening pressures elsewhere as well, especially in the US. Despite RBNZ also now forecasting a recession (GDP -1%) in 2023, markets currently price in the terminal rate at 5.5%.
Equities: Equities higher yesterday with defensives outperforming cyclicals for the fifth day in a row. VIX also lower for the fifth consecutive session just as value outperforming growth for the fifth session in a row. Yields lower and hence the negative correlation between yields and equities continuing. In US Dow +1.2%, S&P 500 +1.4%, Nasdaq +1.4% and Russell 2000 +1.2%. Asian stocks higher this morning with New Zealand going against the trend after the RBNZ lifted yields by 75bp overnight. European futures are higher while US futures are mixed this morning.
FI: Global bond yields keep declining and the curves continue to invert as the market braces for more rate hikes and increasing risk of a recession. 10Y Treasuries fell by 6bp, and the slope of the 2Y-10Y US curve is -75bp, a level not seen since 1981.
FX: The USD has erased part of its recent gains with EUR/USD bouncing back to the 1.03 level. NOK had a strong session yesterday with EUR/NOK now back in the low end of the recent range while EUR/SEK has settled just south of the 11-mark ahead of Thursday's Riksbank meeting. After the recent decline in EUR/GBP, the cross yesterday stabilised just north of 0.8650.
Credit: Credit indices improved yesterday and we saw decent activity in both primary and secondary markets. ITraxx Main tightened 3.2bp to 92.4bp and iTraxx Xover tightened 15.8bp to 461.2bp. The latter is the tightest closing level we have seen in over 5 months.
GBP/JPY Daily Outlook
Daily Pivots: (S1) 167.34; (P) 167.83; (R1) 168.30; More...
Intraday bias in GBP/JPY stays mildly on the upside as rebound from 163.02 is still in progress. Correction from 172.11 might have completed at 163.20, after hitting 38.2% retracement of 148.93 to 172.11 at 163.25. Further rise would be seen to retest 172.11 high. On the downside, however, below 166.08 minor support will turn intraday bias neutral again first.
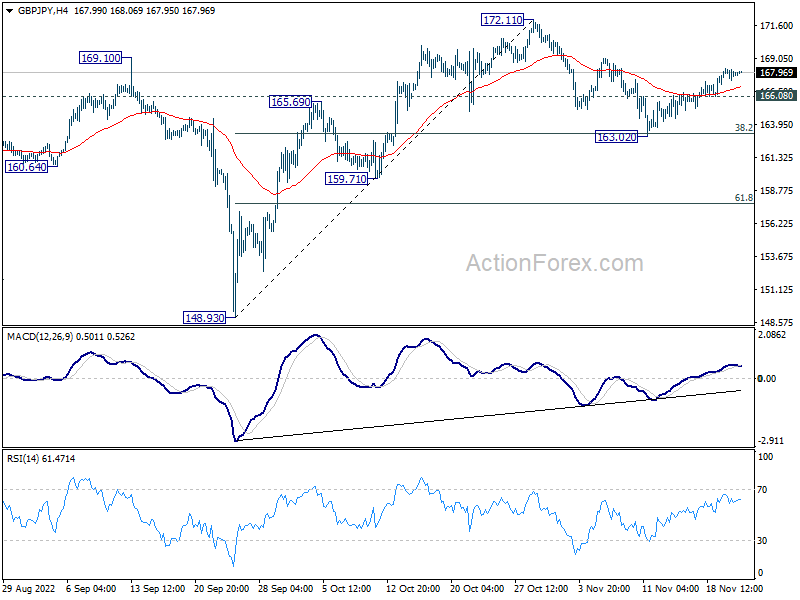
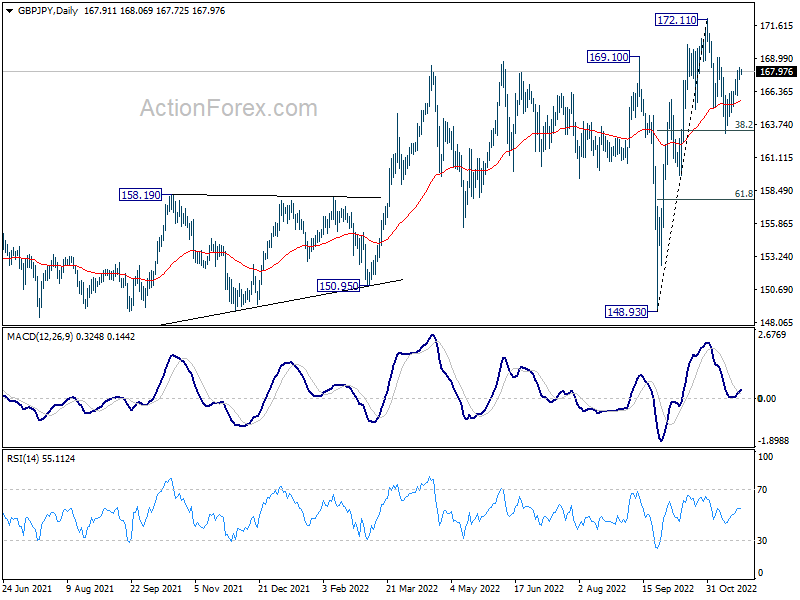
In the bigger picture, there is no clear sign of medium term topping yet. Up trend from 123.94 (2020 low) could still resume through 172.11 high at a later stage. However, firm break of 159.71 support will argue that it's already in correction to the up trend from 123.94, and deeper decline would be seen back towards 148.93 support.
EUR/JPY Daily Outlook
Daily Pivots: (S1) 145.02; (P) 145.37; (R1) 145.83; More....
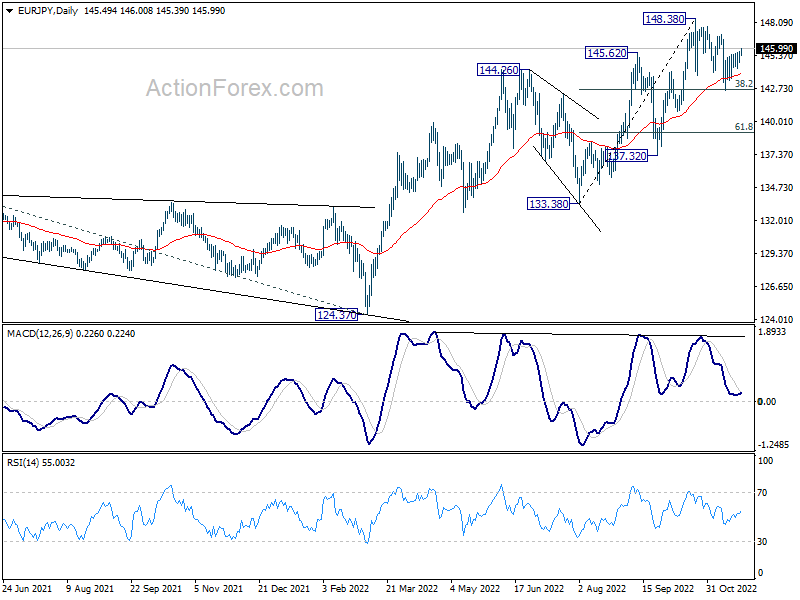
As EUR/JPY's recovery from 142.54 extends, focus is back on 147.09 minor resistance. As noted before, correction from 148.38 might have completed at 142.54. Break of 147.09 resistance will indicate that larger up trend is ready to resume through 148.38 high. However, break of 144.32 minor support will dampen this case and bring retest of 142.54 support instead.
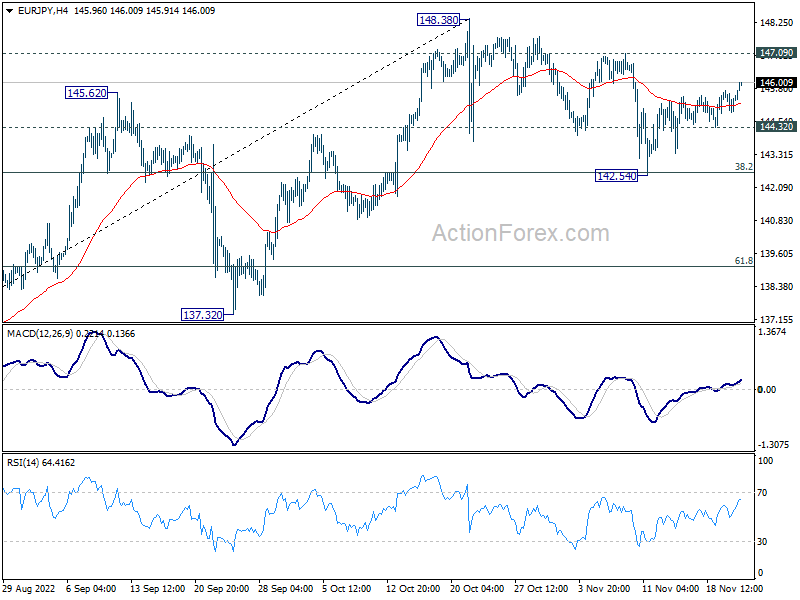
In the bigger picture, there is no clear sign of medium term topping yet. Up trend from 114.42 (2020 low) could still resume through 148.38 to 149.76 (2014 high). However, break of 137.32 support argue that a medium term correction has already started to correct the whole up trend from 114.42.
EUR/GBP Daily Outlook
Daily Pivots: (S1) 0.8640; (P) 0.8661; (R1) 0.8691; More...
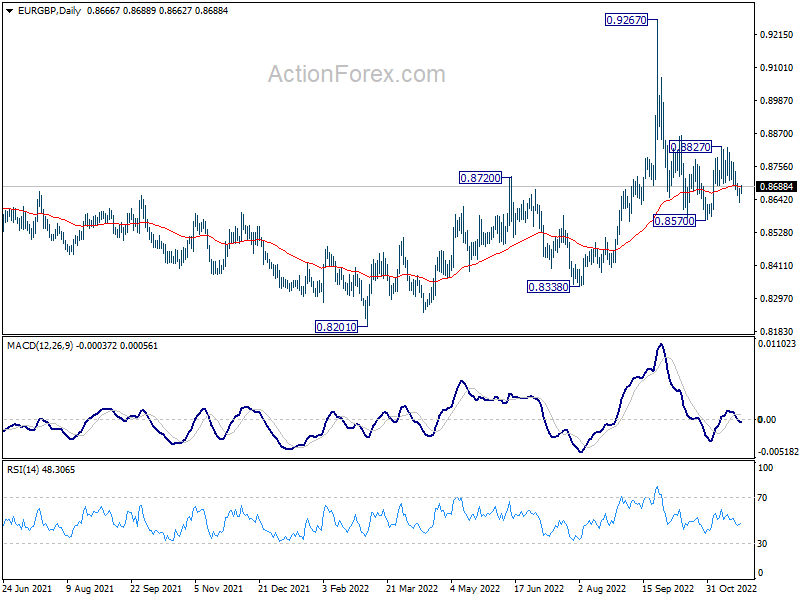
EUR/GBP lost downside momentum well ahead of 0.8570 support, as seen in 4 hour MACD. Intraday bias is turned neutral again first. On the downside, firm break of 0.8570 will resume the whole decline form 0.9267, towards 0.8338 support. On the upside, above 0.8827 will resume the rebound from 0.8570 and flip bias back to the upside instead.
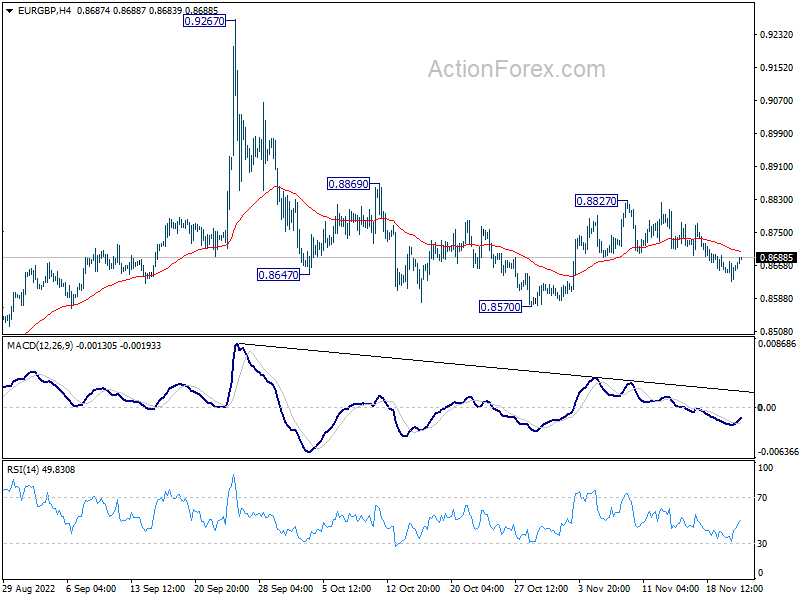
In the bigger picture, current development suggests that fall from 0.9267 is a down leg inside long term range pattern. Deeper fall could be seen towards 0.8201/8338 support zone. But strong support should be seen there to bring reversal. Nevertheless, firm break of 0.8869 resistance will turn favor to the case that such decline is merely a correction in the up trend from 0.8201. That is, further rally would be seen at a later stage through 0.9267.