Sample Category Title
USD/JPY Reaches Key Support, US GDP Improves
Key Highlights
- USD/JPY declined and tested the key 145.00 support zone.
- A major bearish trend line is forming with resistance near 147.20 on the 4-hours chart.
- EUR/USD surpassed 1.0000 and GBP/USD attempted an upside break above 1.1640.
- The US Gross Domestic Product grew 2.6% in Q3 2022 (Preliminary), up from -0.6%.
USD/JPY Technical Analysis
The US Dollar started a major decline after it tested the 152.00 resistance against the Japanese Yen. USD/JPY declined below 150.00 and 149.50 to move into a short term bearish zone.
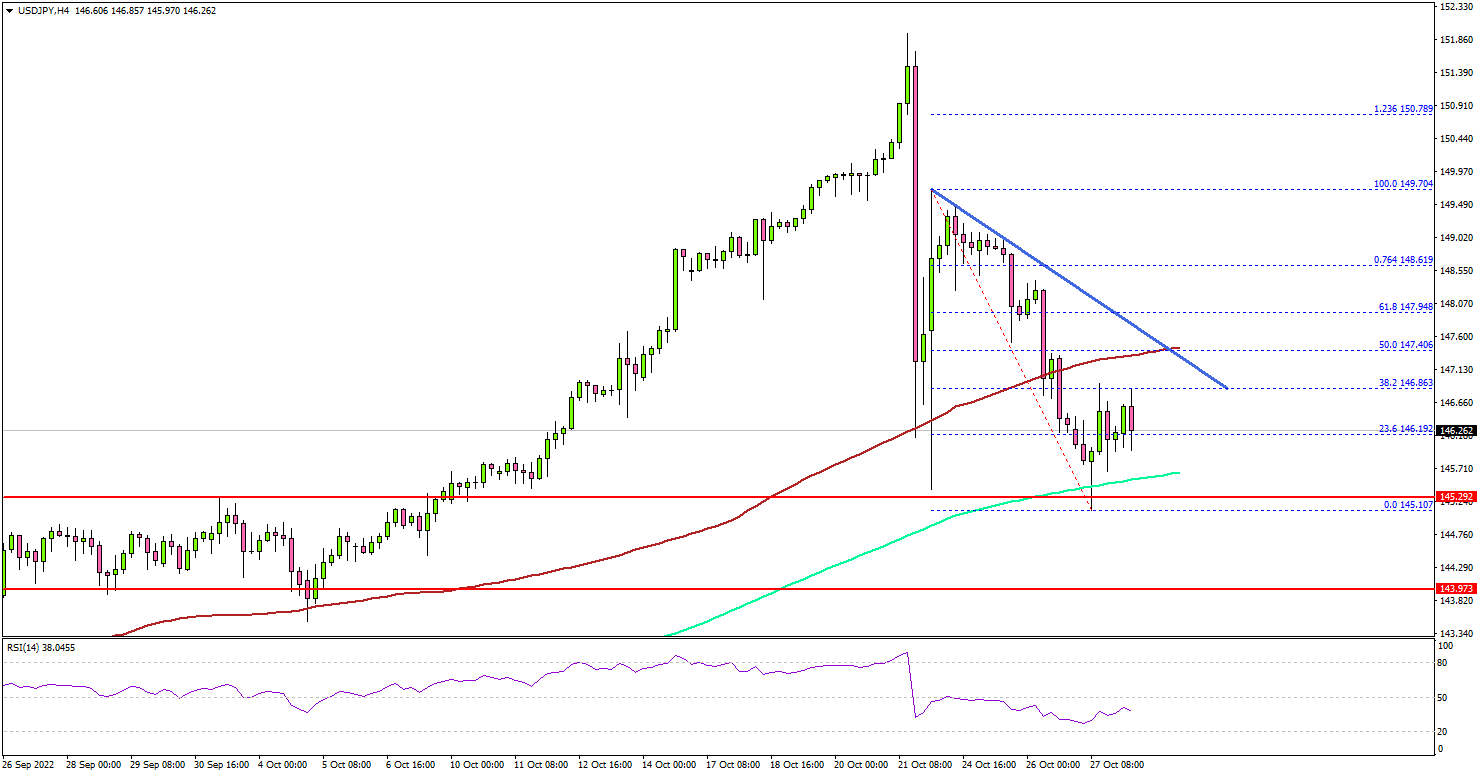
Looking at the 4-hours chart, the pair gained pace below the 148.00 level and the 100 simple moving average (red, 4-hours). This past week, there was a recovery wave, but the pair failed to climb back above the 150.00 resistance.
A high was formed near 149.70 before there was a fresh decline. The pair declined over 300 pips and tested the 145.00 support zone.
A low is formed near 145.10 and the pair is now consolidating losses. On the upside, it is facing a major resistance near the 147.00 zone. There is also a major bearish trend line forming with resistance near 147.20 on the same chart.
The next major resistance may perhaps be near 148.00 or the 100 simple moving average (red, 4-hours). Any more gains could set the pace for a move towards the 150.00 level.
An initial support is near the 145.70 level and the 200 simple moving average (green, 4-hours). The next major support is near the 145.00 zone. A downside break below the 145.00 zone could push the pair further into a bearish zone.
Fundamentally, the US Gross Domestic Product report for Q3 2022 (prelim) was released yesterday by the US Bureau of Economic Analysis. The market was looking for the GDP to increase by 2.4%.
The actual result was better than the forecast, as the US Gross Domestic Product grew 2.6% in Q3 2022, up from the last decline of 0.6%.
Looking at EUR/USD, there was a move above the 1.0000 resistance, but the pair seems to be losing bullish momentum and might decline below 0.9950.
Economic Releases
- German Consumer Price Index for Oct 2022 (YoY) (Prelim) – Forecast +10.1%, versus +10.0% previous.
- German Consumer Price Index for Oct 2022 (MoM) (Prelim) – Forecast +0.6%, versus +1.9% previous.
- US Personal Income for Sep 2022 (MoM) - Forecast +0.3%, versus +0.3% previous.
Cliff Notes: An Event Filled Week
This week, the second Australian Federal Budget for 2022 and the Q3 CPI report gave the market a lot to consider regarding Australia’s outlook. The same was true offshore, with the Bank of Canada and ECB respectively delivering ‘dovish’ 50bp and 75bp hikes as US Q3 GDP made clear US private demand growth is slowing rapidly.
Beginning with October Budget 2022. Our Bulletin and conversation with Chief Economist Bill Evans provides a full view of the new Government’s priorities and their economic expectations for the next four years. Most notable is that, while the starting point for October Budget 2022 is materially improved, the economy is expected to be weaken while spending grows rapidly, particularly interest costs and funding for the NDIS. As a result, net debt is forecast to continue rising to 2025/26, the last year of the forward estimates. Consistent with the policies Labor took to the election, October Budget 2022 focuses on providing cost of living relief for families through support for childcare; improving essential services, particularly aged care; and also commits to long-term investment in Australia’s capacity and productivity.
The day after Budget 2022, the Q3 CPI print came in well above the market’s expectation and our own. Critically, not only did headline inflation print at a challenging 1.8% (7.3%yr), so did the trimmed mean core (1.8%; 6.1%yr). Key contributors to the rise were housing (utilities and dwelling construction) and food. However, there was evidence of robust-to-strong inflation across the rest of the consumer basket.
In our view, it is therefore appropriate for the RBA to increase the cash rate by 50bps at the November meeting, and to follow that move with a further 75bps of cumulative tightening at the next three meetings to a peak of 3.85% in March (previously 3.60%). An on-hold posture will then be required over the remainder of 2023 to suppress inflation expectations and related risks. Chief Economist Bill Evans’ bulletin provides a detailed assessment of our expectations regarding the RBA.
Turning to the US. The Q3 GDP outcome was, more or less, as we anticipated, with a circa 3ppt contribution from net exports masking a continued deterioration in private demand growth. From 2.2% annualised in Q1, private demand growth has slowed to just 0.6%. As the service sector re-opening fades and durable purchases come under greater pressure from interest rates and cost of living, this downtrend will persist – note that in Q3, dwelling construction declined at a 26% annualised rate and business investment growth was sub-par.
We remain of the view that the US is likely to see cumulative GDP growth of only 0.5% through 2022 and 2023, with risks skewed to the downside. It will be interesting to see whether the FOMC take a more cautious view on the outlook for the economy at their November meeting next week as they deliver another outsized 75bp hike. For the US, inflation risks are still acute, but the probability of a hard landing in 2023 is on the rise.
Regarding the forward view for monetary policy globally, both the Bank of Canada and ECB delivered what were perceived to be ‘dovish’ extraordinary hikes this week, the Bank of Canada (BoC) raising 50bps and the European Central Bank (ECB) 75bps. For the BoC, growth in 2023 is clearly at risk, but excess demand remains and inflation is yet to show definitive signs of slowing. Ergo, further measured hikes are expected to prove necessary. Meanwhile in Europe, the ECB affirmed their resolve to combat inflation whilst being cognisant of the immediate and medium-term risks to growth. There is still a need to raise interest rates, but with domestic demand already showing clear signs of weakening in H2 2022 under the weight of historic inflation and collapsed confidence, a slowing in the pace of rate hikes is becoming increasingly likely. We expect another 75bp of rate hikes into early 2023, leaving the refi rate at a peak of 2.75% through the rest of that year and into early 2024.
Finally then to China. The end of the National Party Congress was as expected, with President Xi being confirmed for a third term and the Standing Committee re-shaped to cement his authority. The initial reaction of markets was unfavourable, though this has dissipated somewhat. The hold that President Xi has over the party, China’s development and COVID management is unnerving for many market participants. That said, the GDP and partial data for Q3 points to underlying economic strength.
In Q3, growth was more than a percentage point stronger than the market’s expectation, the 3.9% gain reversing Q2’s 2.7% loss. Year-to-date growth consequently bounced back to 3.0%, we expect on its way to 3.5% for the full year to be followed by 6.0% growth in 2023. From the GDP detail and monthly partial data, it is clear COVID management continues to pressure consumption and that residential construction is only starting to form a base after the provision of considerable stimulus. Supporting growth currently is fixed asset investment ex-housing and trade.
While trade with the US and Europe is under pressure as these economies stall and/or enter recession, Asia has capacity to offset. Not only does China stand to benefit from the region’s organic growth, they are also looking to take a greater share of these markets for both consumer and industrial goods. China’s decision to invest in and promote their own brands domestically over the past decade provides a strong foundation for their nascent Asian export expansion. So too the capital, production and know-how they are developing with respect to the green transition – a process Asia stands to benefit materially from. Of course, the greater China’s interest in Asia becomes, the stronger their footing on the global stage. Geopolitical uncertainty is then expected to persist and potentially escalate in the years ahead.
Elliott Wave View: USDJPY Looking for Double Correction
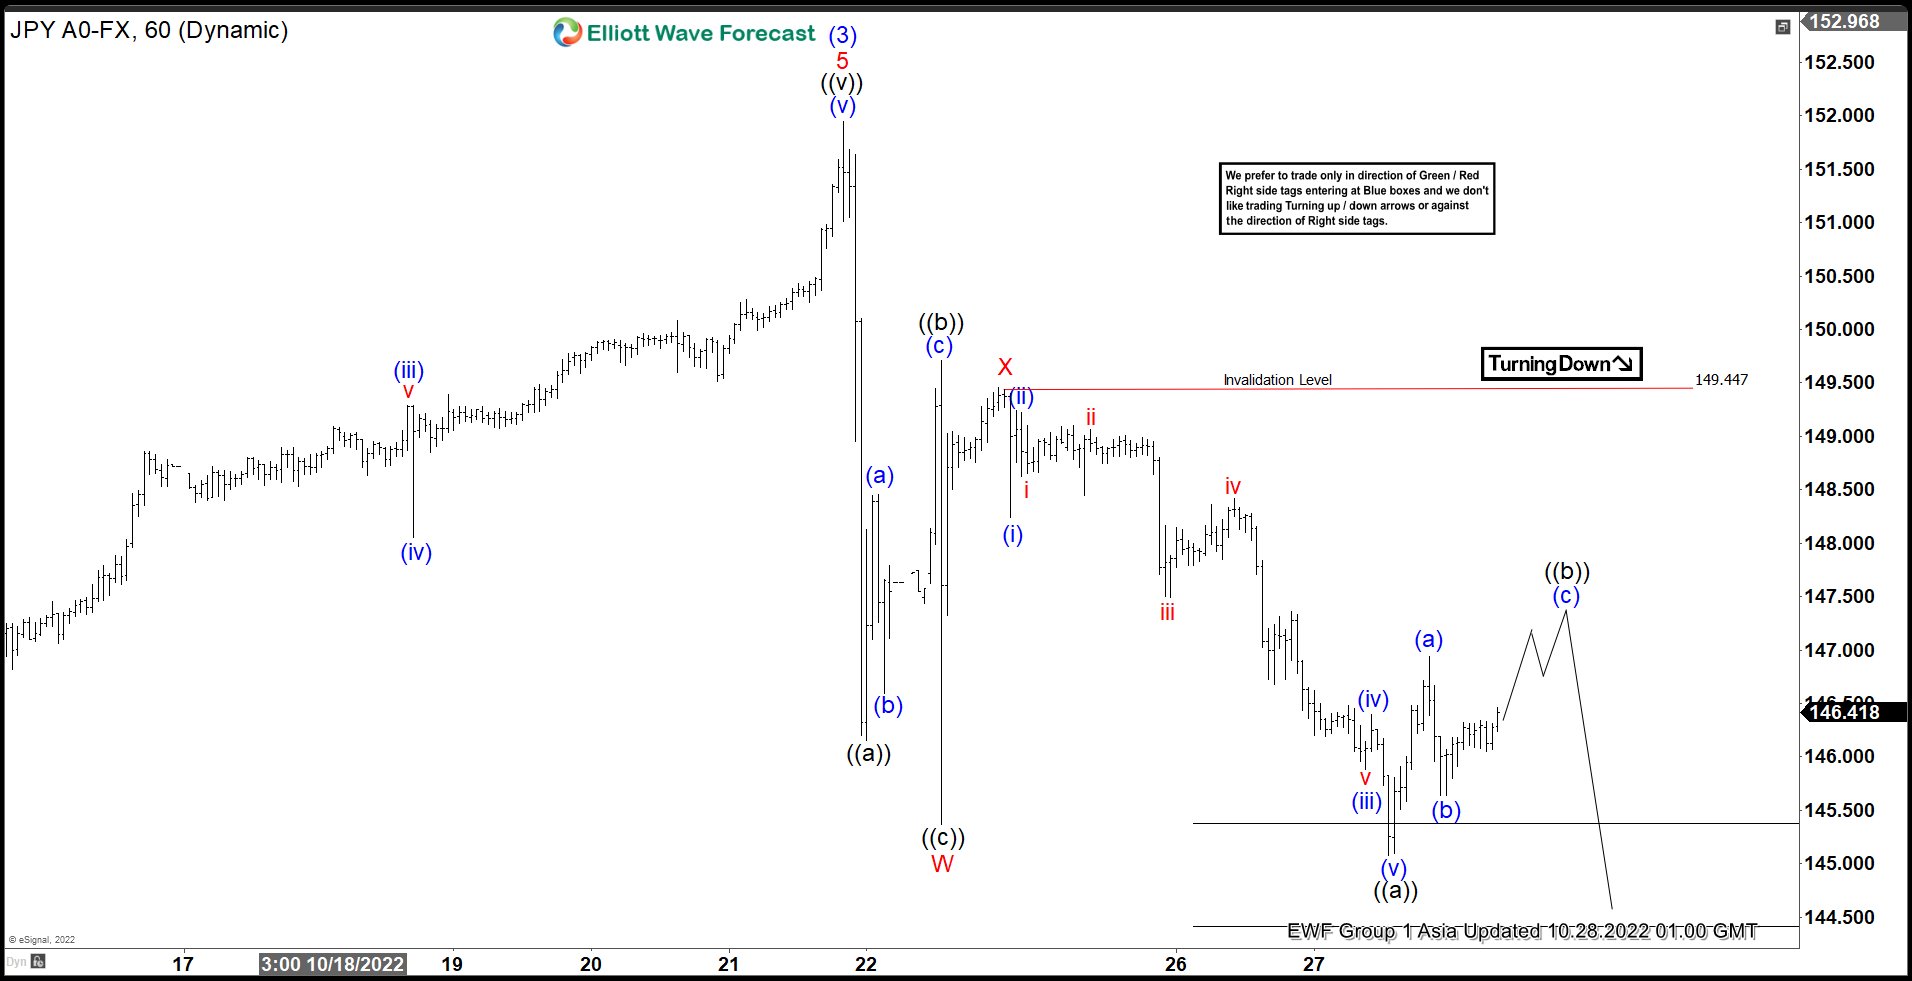
Short Term Elliott Wave structure of USDJPY shows a 5 swing sequence from 10.21.2022 high. This suggests the decline can extend lower into a 7 swing double three structure. Rally to 10.21.2022 high at 151.94 ended wave (3). Pullback in wave (4) is in progress with subdivision as a double three Elliott Wave structure. Down from wave (3), wave ((a)) ended at 146.15, rally in wave ((b)) ended at 149.71, and wave ((c)) lower ended at 145.37. This completed wave W.
Corrective rally in wave X ended at 149.44 and the pair has resumed lower. Wave Y is now in progress as a zigzag structure. Down from wave X, wave (i) ended at 148.24, and rally in wave (ii) ended at 149.24. Pair resumes lower in wave (iii) towards 145.88 and wave (iv) ended at 146.39. Final leg wave (v) ended at 145.08 which completed wave ((a)). Wave ((b)) rally is in progress to correct cycle from 10.24.2022 high in 3, 7, or 11 swing before the decline resumes. Near term, as far as pivot at 149.44 holds, expect rally to fail for further downside towards 141.3 – 142.8 area to end wave (4). This area, if reached, should see buyers for the next leg higher.
USDJPY 60 Minutes Elliott Wave Chart
CHFJPY Wave Analysis
- CHFJPY reversed from resistance level 150.40
- Likely to fall to support level 146.00
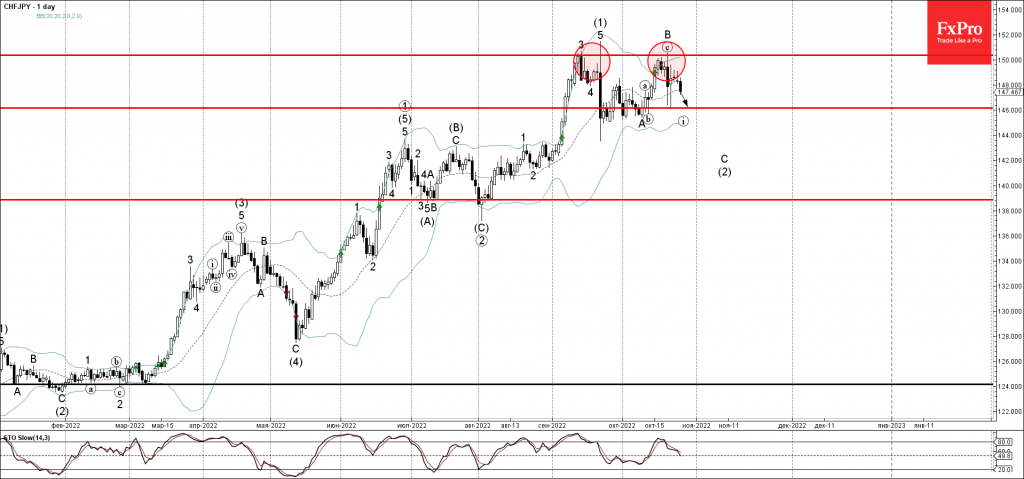
CHFJPY currency pair recently reversed down from the key resistance level 150.40 (which has been steadily reversing the pair from the start of September) strengthened by the upper daily Bollinger Band.
The downward reversal from the resistance level 150.40 started the active impulse waves (i) and (C) – which belong to the intermediate ABC wave (2) from the middle of September.
CHFJPY can be expected to fall further toward the next support level 146.00 (which stopped the earlier minor wave A at the start of October).
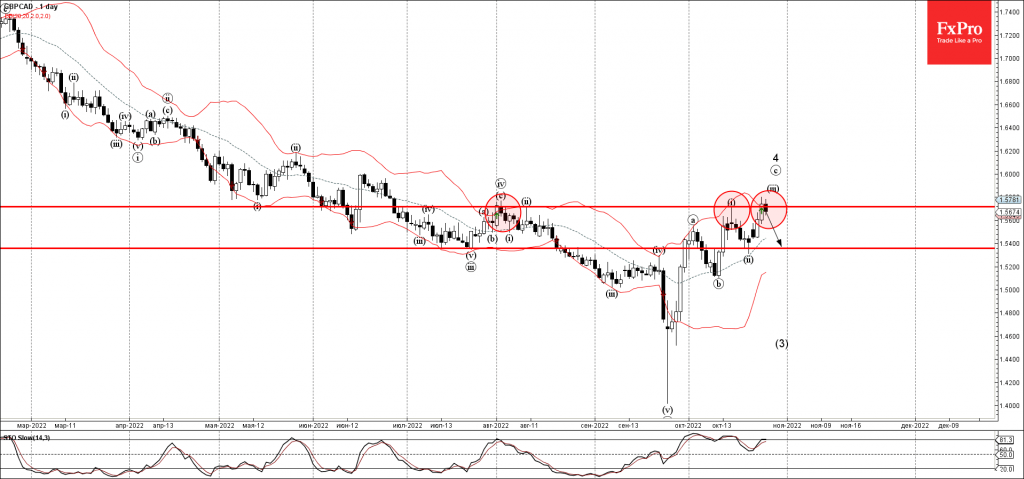
GBPCAD Wave Analysis
- GBPCAD reversed from resistance level 1.5720
- Likely to fall to support level 1.5360
GBPCAD recently reversed down from the key resistance level 1.5720 (which has been steadily reversing the pair from the start of August) intersecting with the upper daily Bollinger Band.
The downward reversal from the resistance level 1.5720 stopped the previous impulse waves (iii) and (c).
Given the clear bearish divergence on the daily Stochastic indicator, GBPCAD can be expected to fall further toward the next key support level 1.5360.
Key Central Banks Preparing for Slowdown in Rate Hikes – Now Also ECB
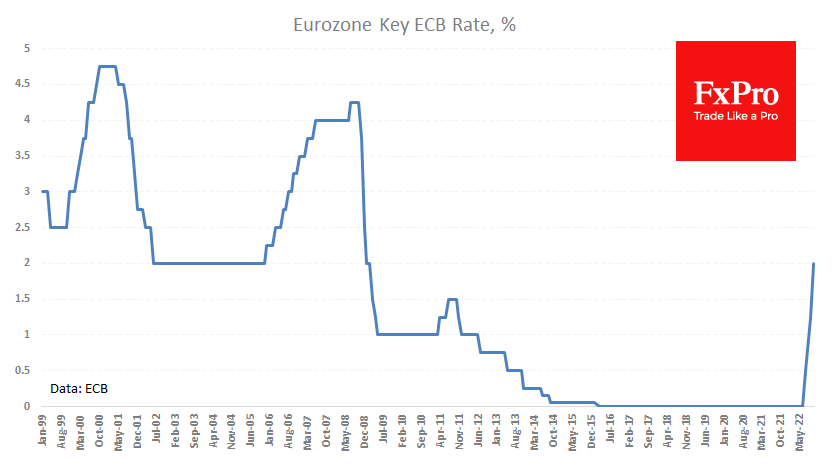
As most observers assumed, the ECB raised its key rate by 75 points to 2.0%. These are low rates by modern standards, but the eurozone last saw such rates 14 years ago.
Furthermore, the central bank indicated its intention to withdraw liquidity from the banking system to combat record inflation. Amongst other signals, there is a comparatively dovish guide to further policy tightening. The ECB is signalling its intention to raise the rate further to ensure that inflation returns to the 2% target.
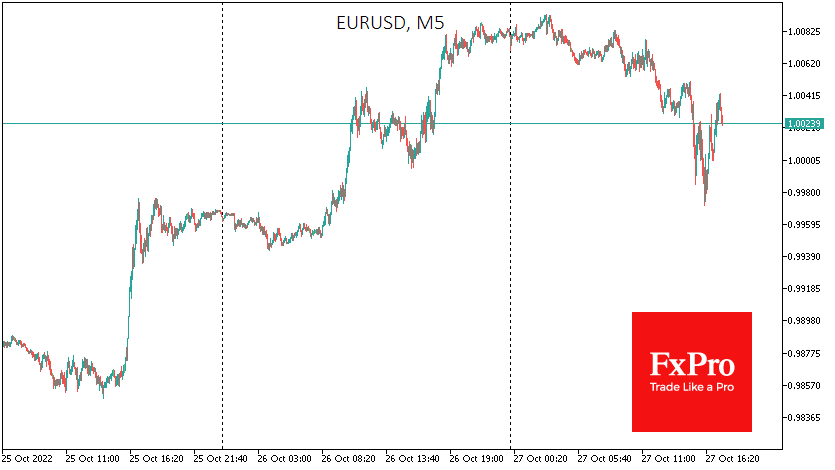
We recall that official inflation was 9.9% YoY in September, and average forecasts suggest a further, albeit slight, acceleration in October. Such a message, in our view, indicates that the ECB remains on the side of the economy and maintains a catch-up role regarding inflation and other CBs (excluding the Bank of Japan). The first impulsive market reaction was to sell the euro and European debt securities, sending EURUSD temporarily below parity.
Nevertheless, this is another signal in the piggy bank that key central banks are already coming out to slow the pace of rate hikes. The Bank of Canada did it yesterday, the Reserve Bank of Australia did it before that, the ECB warned of a slowdown today, and the Fed is signalling that along with a 75-point hike next week, we will hear a signal of further rate slowing.
Having seen a pullback in commodity and agricultural prices and having done some work on policy tightening, the key global central banks seem to be synchronising their policies and preparing to move to a finer tuning. This is a relatively positive shift for equity markets and an additional reason to correct the one-and-a-half-year rally in the dollar.
EUR/USD: Euro Eases on Overbought Condition But Bias to Remain Bullish Above Parity
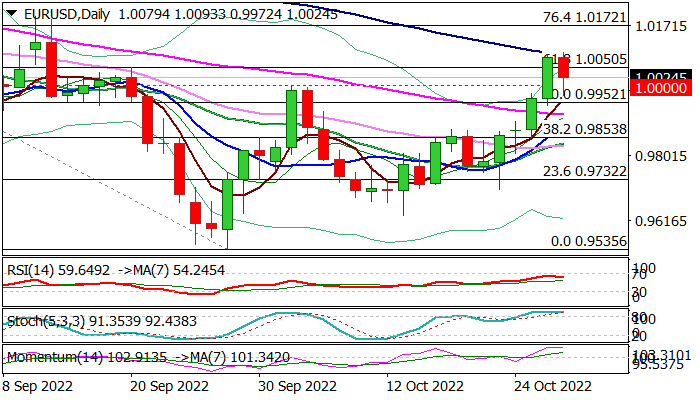
The Euro pulls back from new six-week high, as traders collected profits from a steep six-day rally, after the action was repeatedly capped by falling 100DMA and daily cloud top, while overbought daily studies contributed to the decision.
Dip below parity (to 0.9972) was so far short-lived, signaling that bullish sentiment remains strong, however daily stretched indicators (momentum and stochastic) are turning south, keeping in play risk of extend consolidation / correction.
Ability to hold above parity would signal strong bullish bias and keep in focus key barriers at 1.0088/1.0090 (10DMA / daily cloud top) clear break of which would signal bullish continuation and expose targets at 1.0172/97 (Fibo 76.4% of 1.0368/1.0535 descend / Sep 12 lower top).
Caution on close below parity (also near daily cloud base) and 0.9984 (Fibo 23.6% of 0.9631/1.0093) that would weaken near-term structure and revive risk of deeper pullback.
Res: 1.0050; 1.0093; 1.0172; 1.0197
Sup: 1.0000; 0.9984; 0.9917; 0.9862
USD/JPY Mid-Day Outlook
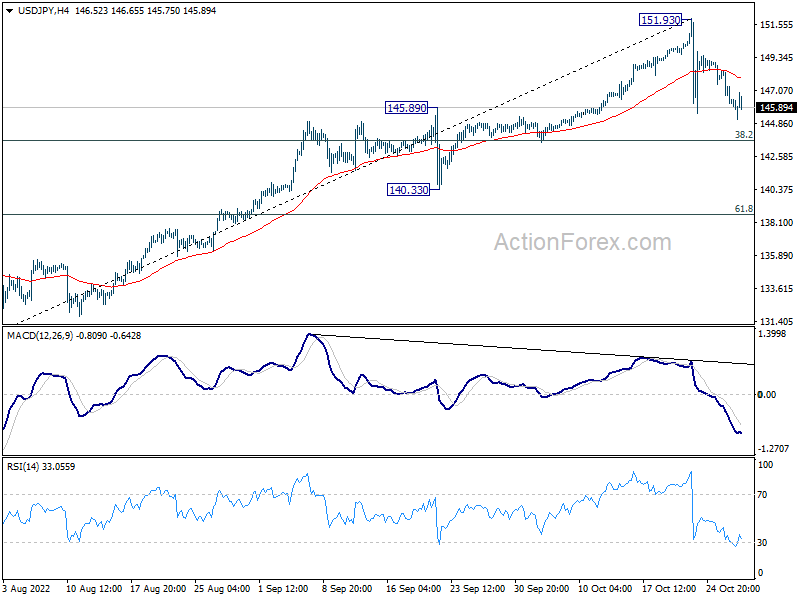
Daily Pivots: (S1) 145.62; (P) 147.01; (R1) 147.80; More...
Intraday bias in USD/JPY stays neutral as consolidation form 151.93 is still extending. Deeper fall might be seen but downside should be contained by 38.2% retracement of 130.38 to 151.93 at 143.69 to bring rebound. Upside of rally attempt should be limited by 151.39 resistance.
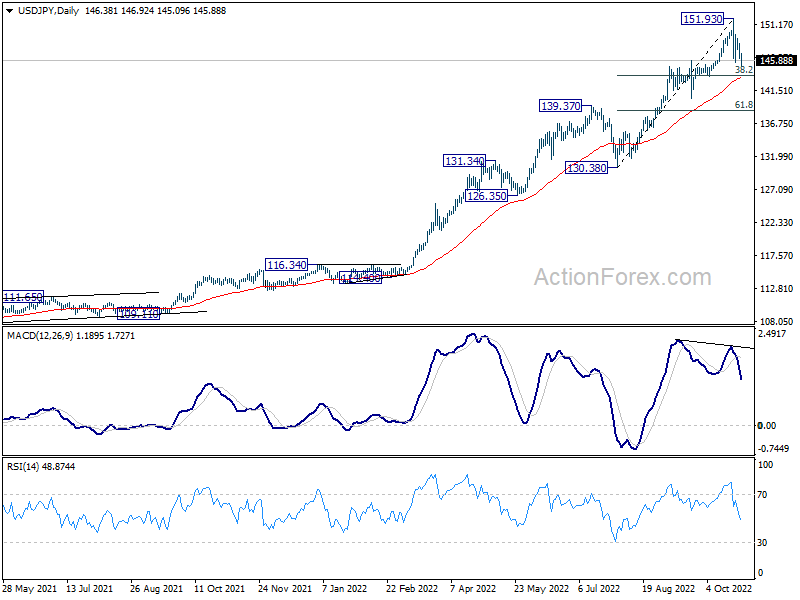
In the bigger picture, up trend from 101.18 is still in progress, as part of the whole up trend from 75.56 (2011 low). 147.68 (1998 high) was already met and there is no clearly sign of topping yet. In any case, break of 140.33 support is needed to be the first sign of medium term topping. Otherwise, further rise is in favor to next target at 160.16 (1990 high).
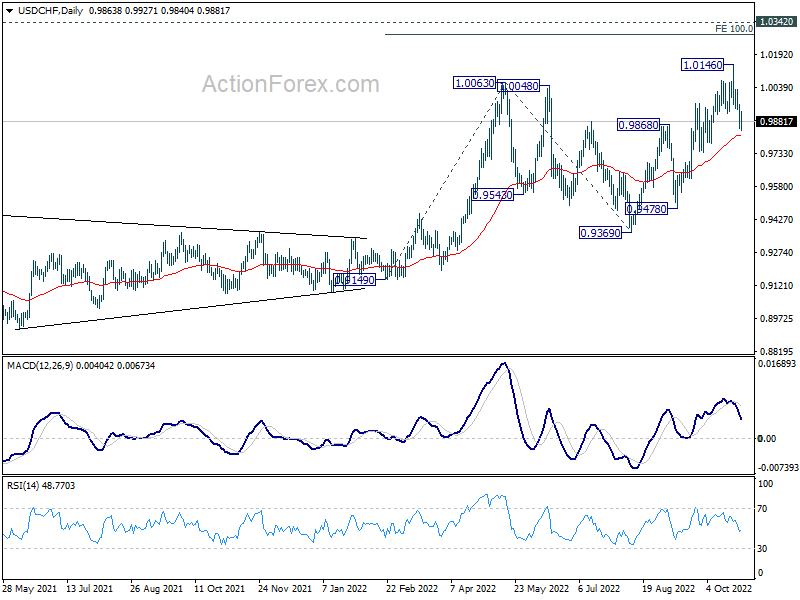
USD/CHF Mid-Day Outlook
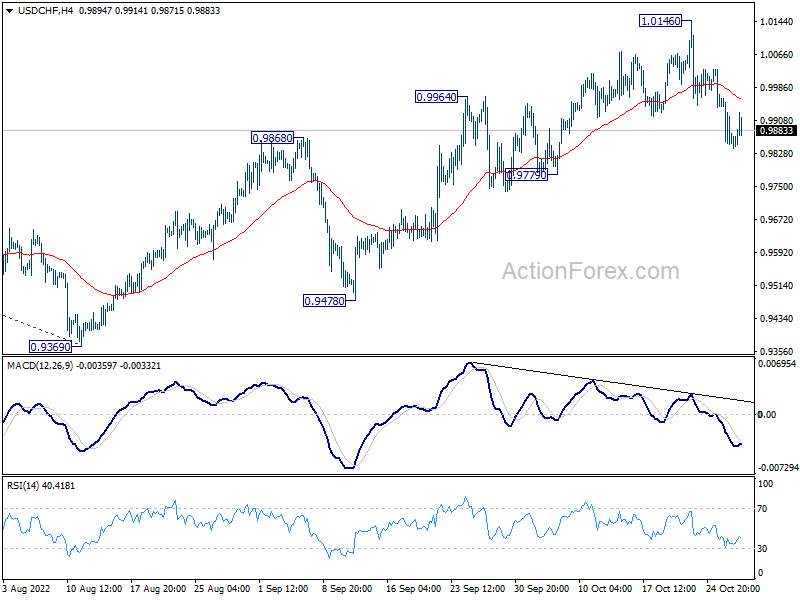
Daily Pivots: (S1) 0.9822; (P) 0.9893; (R1) 0.9932; More...
Outlook in USD/CHF remains unchanged and intraday bias stays neutral. Further rally will remain in favor as long as 0.9779 support holds. On the upside, break of 1.0146 will resume larger up trend to 1.0283 projection level. However, firm break of 0.9779 will be a sign of reversal, and bring deeper decline back to 0.9478 support instead.
In the bigger picture, current development suggests that up trend from 0.8756 (2021 low) is still in progress. Sustained break of 1.0063 will target 100% projection of 0.9149 to 1.0063 from 0.9369 at 1.0283, and then 1.0342 (2016 high). For now, this will remain the favored case as long as 0.9779 support holds, even in case of deep pull back.