Sample Category Title
Bitcoin rises with Dollar selloff, heading to 22-23k?
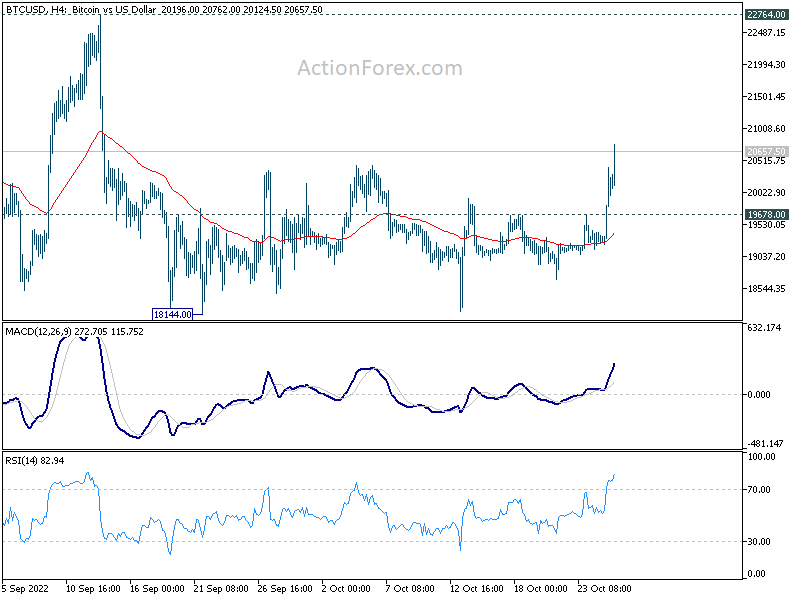
Bitcoin rises notably today, following intensified selloff in Dollar in general. The break of 55 day EMA is a positive development for the near term. For now further rise expected as long as 19678 resistance turned support holds. Next target is 22764 resistance.
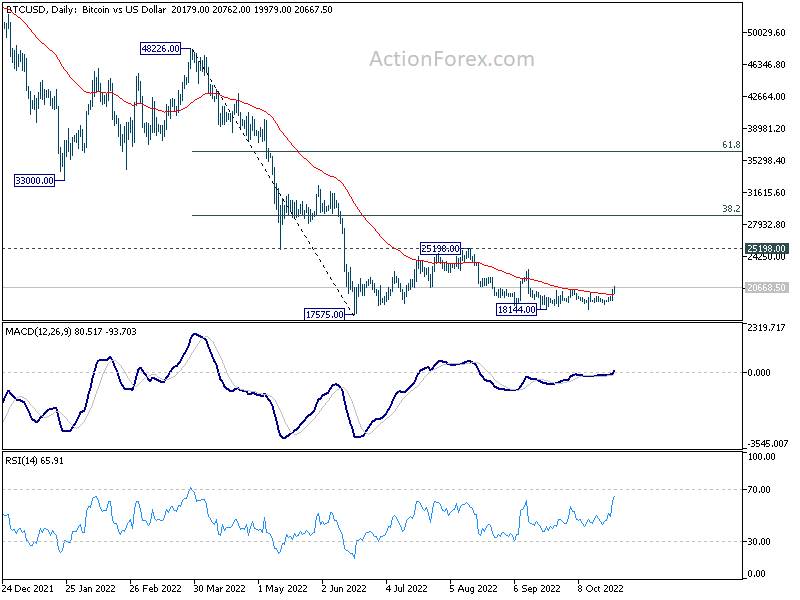
As for the larger outlook, current rise from 18144 could either be the third leg of the consolidation pattern from 17575, or the start of an up trend. It's too early to tell. Yet, a take on 25198 resistance is possible on break of 22764. The key resistance level is in 38.2% retracement of 48226 to 17575 at 29283. As long as this fibonacci level holds, medium term outlook will be neutral at best.
Aussie Extends Rally as Inflation Outperforms
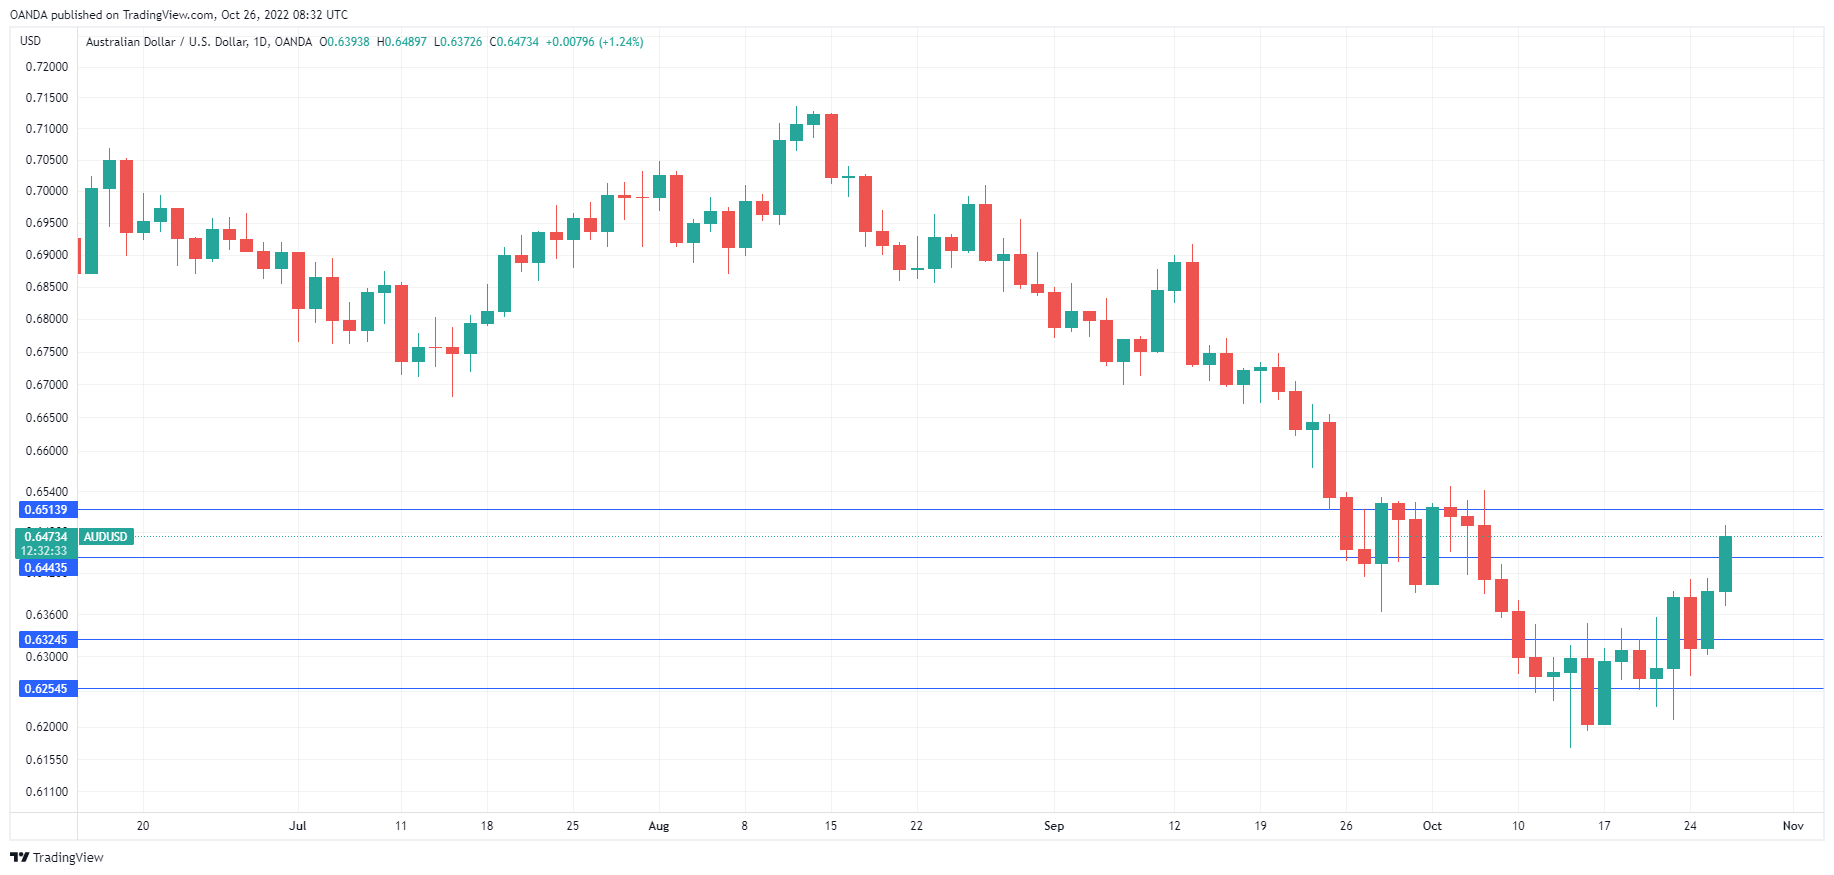
AUD/USD is sharply higher for a second straight day. In the European session, the Australian dollar is trading at 0.6484, up 1.412. After losing over 1% on Monday, the Aussie has roared back with gains of over 2.7%.
Australia’s inflation jumps to 7.3%
Australia’s inflation report is the driver behind today’s gains, as third-quarter inflation was stronger than expected. Headline CPI jumped 7.3%, its highest level since 1990. This was way up from 6.1% in Q2 and above the consensus of 7.0%. The key core inflation indicator climbed to 6.1%, up from 4.9% and above the consensus of 5.6%.
The unexpected rise in inflation upsets the apple cart for the RBA, which lowered its October rate hike to 0.25%, after four straight increases of 0.50%. The RBA would have liked to continue with a small hike at next week’s meeting and there has even been talk of a pause in rate hikes. The hot inflation report changes this thinking dramatically. It’s difficult to see how the RBA can ignore the jump in inflation, which is a painful reminder that inflation is yet to peak. The central bank will likely have to respond with a 0.50% increase, and the Australian dollar has soared today as a result. As the inflation report is the last key release before next week’s meeting, the RBA won’t have any additional data which could temper the need for a 0.50% hike.
The RBA will have little choice but to continue with oversize rates until inflation is beaten, which could take a while yet. The central has projected that inflation will hit 7.5%, with some analysts expecting it to rise closer to 8.0%. That means that the cash rate, which is currently at 2.6%, is unlikely to peak until it rises to 3.5% or slightly higher.
AUD/USD Technical
- AUD/USD continues to test support at 0.6250. The next support level is 0.6121
- There is resistance at 0.6331 and 0.6460
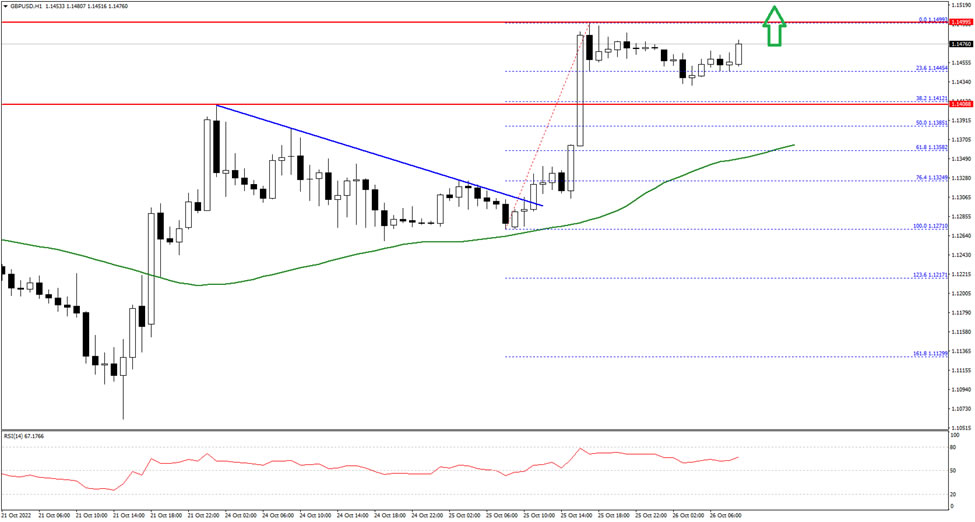
GBP/USD Pair is Consolidating Near 1.1475
The British Pound started a fresh increase from the 1.1220 support zone against the US Dollar. The GBP/USD pair gained pace for a move above the 1.1350 resistance zone.
The pair even settled above the 1.1400 level and the 50 hourly simple moving average. It is now consolidating near the 1.1475 level, with an immediate resistance at 1.1500.
If there is a clear upside break above the 1.1500 resistance, the pair could rise steadily towards the 1.1550 level in the near term. The next major resistance sits near 1.1680 on FXOpen.
On the downside, the first major support is near the 1.1410 level. The main support is forming near the 1.1385 level and the 50 hourly simple moving average. A break below the 1.1385 support could even push the pair below the 1.1350 support.
NZDUSD Eyes a Bullish Break; Caution Required
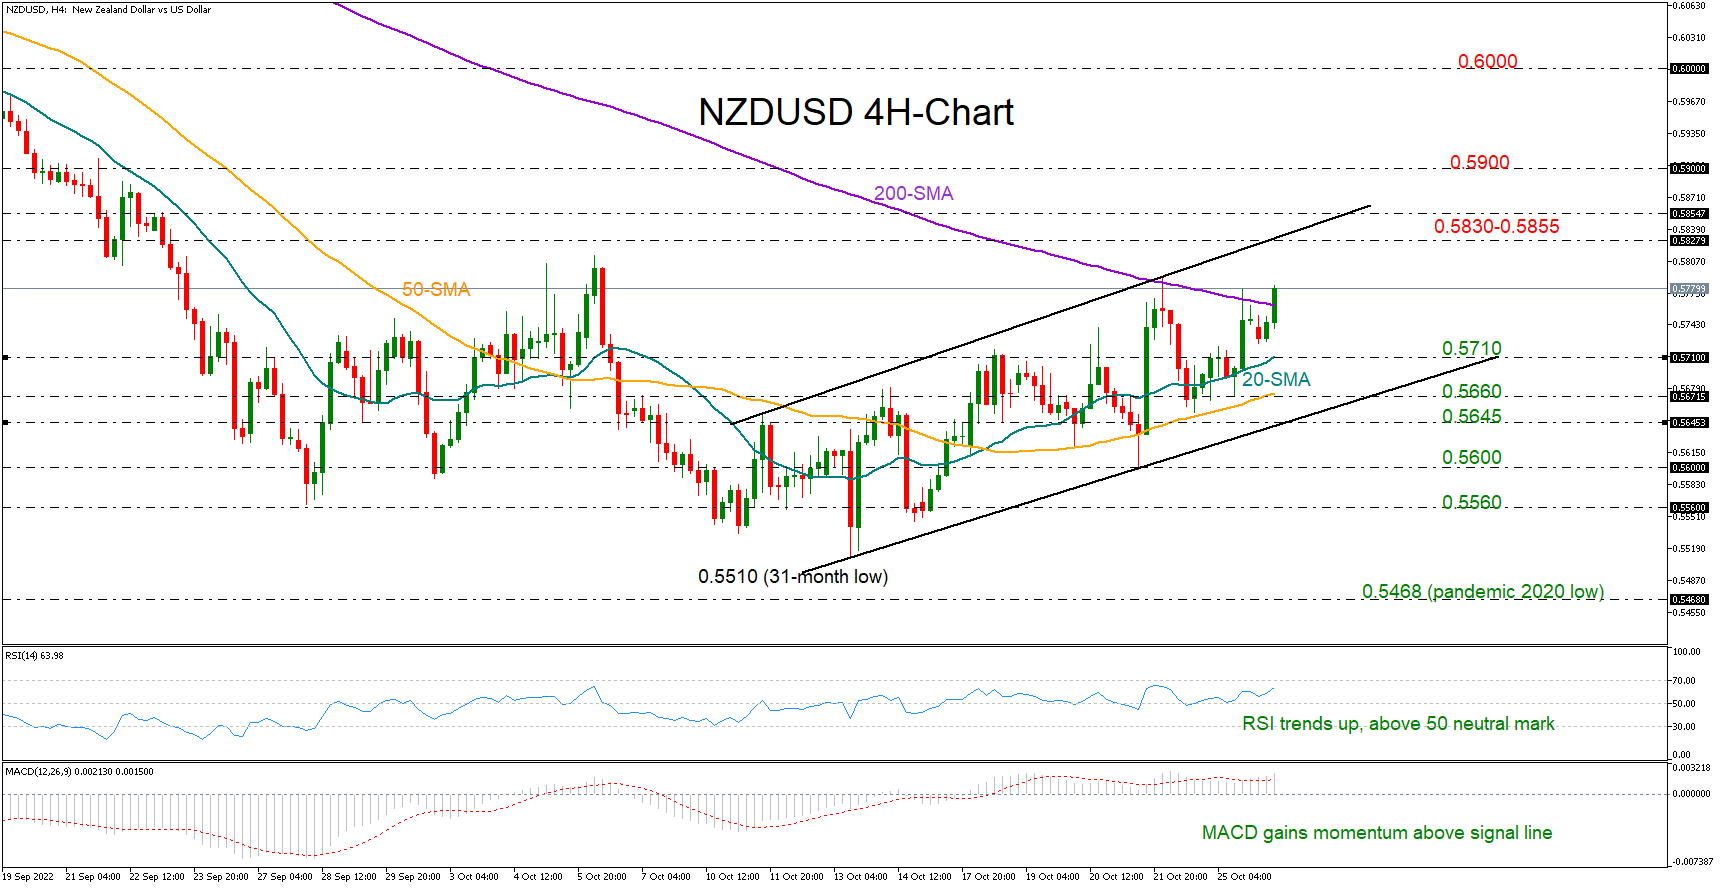
NZDUSD is testing the 200-period simple moving average (SMA) in the four-hour chart for the first time since August at 0.5764.
The pair has been gently trending up following the drop to 0.5510, the lowest since March 2020. From a technical perspective, the positive trajectory in the RSI and the MACD is signaling additional gains ahead, though any advances could prove limited if the channel’s upper boundary halts the recovery within the 0.5830-0.5860 region. The 0.5900 psychological mark might be another hurdle, preventing a sharp rally to 0.6000.
Should selling pressures resurface, pushing the price below the 200-period SMA, the 20-period SMA could immediately come to the rescue at 0.5710. Slightly lower, the pair may retest the 50-period SMA around 0.5660 before meeting the channel’s lower band near 0.5645. If the latter gives way, the decline could pick up steam towards the 0.5600-0.5560 restrictive area.
In brief, NZDUSD has the potential for more upside in the coming sessions, with traders awaiting a clear close above the 200-period SMA to raise their buying orders. Yet, whether any advance will be sustainable remains to be seen.
USDJPY Fails to Improve Bullish Outlook But Still Above 20-day SMA
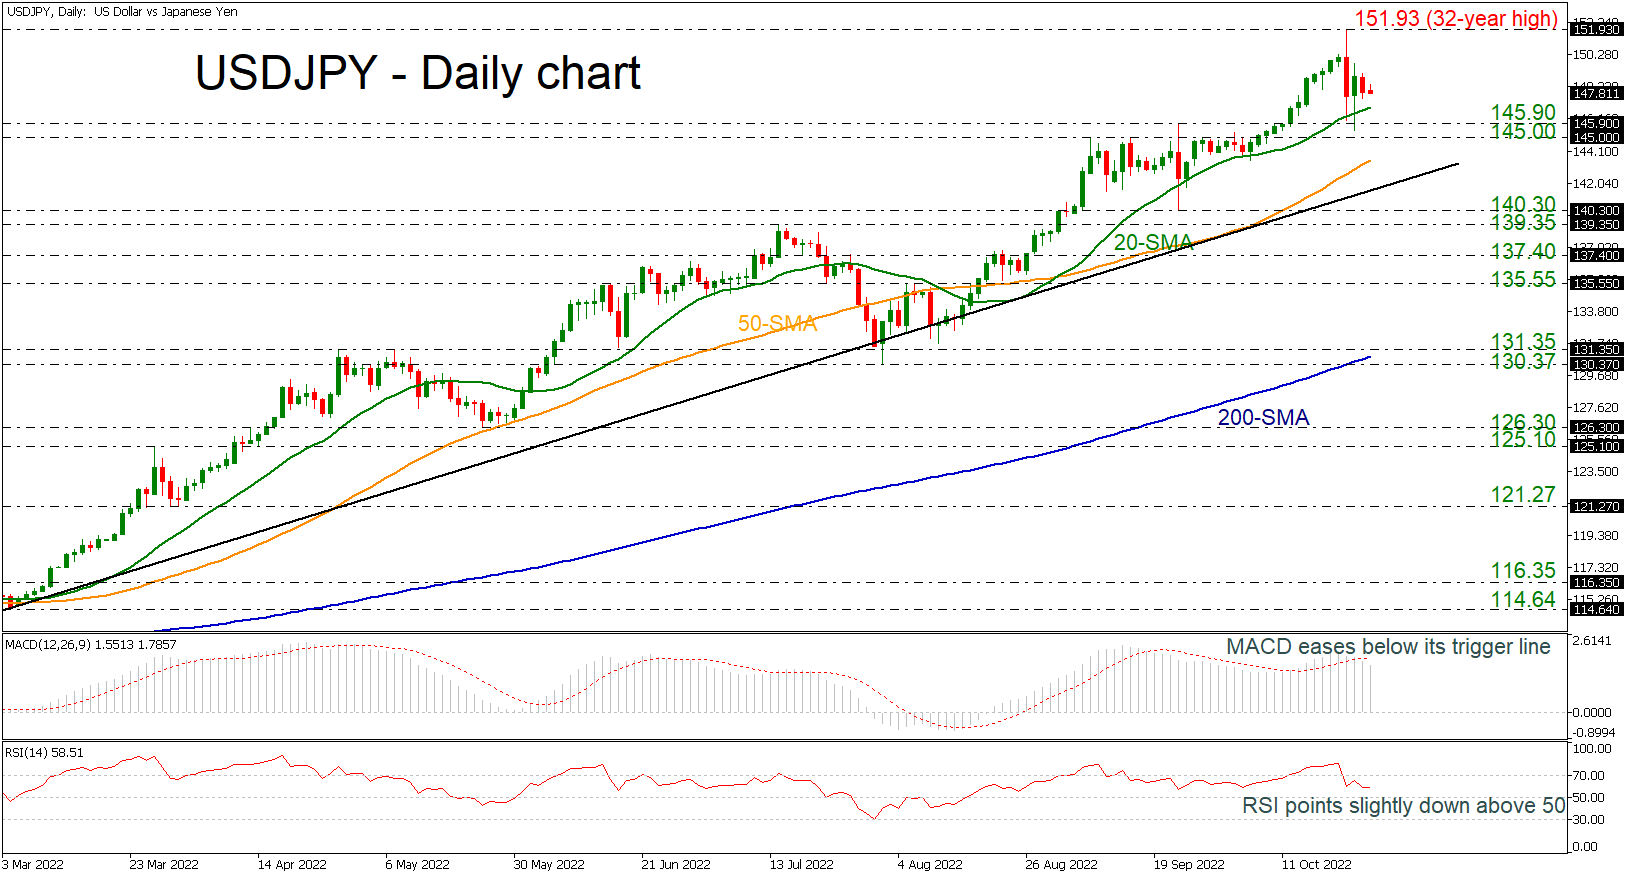
USDJPY is losing some momentum after the rally towards the fresh 32-year high of 151.93 in the very near-term. However, the market is still rebounding on the 20-day simple moving average (SMA), confirming the long-term bullish outlook.
According to the technical indicators, the MACD is heading south below its trigger line in the positive region, while the RSI is pointing downwards after the sharp advance towards the overbought area. In trend indicators, the 20- and 50-day simple moving averages (SMAs) are following the current market action.
The 151.93 resistance could be a trigger point for steeper bullish action if the pair manages to break the line. This is also slightly below the next psychological mark of 152.00 and hence should attract some attention. Higher, resistance could run towards the next round numbers such as 153.00 and 154.00.
However, if the pair reverses to the downside and dive beneath the 20-day SMA, investors could put a stop first at the 145.90 support and then at 145.00. If the price continues to drop, support could next come somewhere near the 50-day SMA, which overlaps with the 143.45 barrier before the focus shifts to the long-term ascending trend line around the 142.00 barrier.
In the short-term picture, the fall from the multi-year high is shifting the bias to neutral. Chances for another bullish move are still rising in the medium- and long-term timeframes as the 200-day SMA keeps rising and the pair holds well above it.
What Can the ECB Do Now?
Tomorrow the ECB meets for its latest policy assessment. The consensus among economists is that there will be a hike of 75bps, and the market appears to be pricing it in. Therefore, the reaction in the currency pairs might be minimal, since over two-thirds of the surveyed economists agreed. Those who didn't were split between 50bps and 100bps, with the midpoint at 75.
That means markets are likely to be looking beyond the current meeting, with expectations around what happens in December likely the key to how the pairs perform. The Euro has fallen respect to the dollar for two major reasons: The ECB has been much slower to raise rates, and inflation has gone higher in the shared economy. That means the real interest rate spread has continued to grow. With the Fed expected to raise rates another 75bps as well, the ECB has to keep pace in order to keep the Euro from falling. It would have to do something more than that to lift the shared currency.
What can make a stronger euro?
The thing is, a stronger Euro would help the ECB reach its targets in the current circumstances. Almost half of the inflation experienced in Europe is because of the high price of fuel - which is priced in dollars. A stronger Euro would help reduce the impact of inflation from that source. It would also help reduce the cost of other imports. Of course, on the other hand, it would make exports more difficult, but the Euro is near lows it hasn't seen for more than a couple of decades.
However, that's unlikely to be a consideration for policy; merely a potential beneficial side effect. The ECB is dealing with another problem, and that is so called "excess liquidity". Investors have been staying on the sidelines given the uncertainty in Europe. And considering how little bonds pay, they aren't rushing to buy up debt. With inflation expected to remain high for an extended period of time, but interest rates not forecast to rise to compensate, it's just not a sound investment to buy Eurobonds (compared to other currencies).
What to look out for
The ECB is expected to address this issue during the meeting, and look for another mechanism to mop up this "extra cash" that's contributing to higher inflation. One of them is quantitative tightening, which is to sell bonds that the ECB has bought up. This would be expected to force up market interest rates, and encourage investors to take on more debt.
However, Lagarde has insisted this won't happen until the ECB has reached its neutral rate, meaning it's unlikely to be implemented just yet. However, a change in rhetoric around the possibility of QT - for example, that it's not necessary to reach the neutral rate - might change the calculus of the market. It's not likely to be enough to push the Euro substantially higher, but it could set the groundwork for that to happen later in the year.
The other option is to take a more definitive stance on what's called the "terminal rate" or the rate at which the ECB will taper off hikes. So far, officials have talked about reaching 2.0% by the end of the year. With 75bps expected tomorrow, that means just 50bps in December. But if members were to talk about a higher terminal rate, it could get bond yields to rise as well. But, again, that would be more setting the groundwork for future actions, in a very uncertain environment.
USD/CHF: The Final Leg of the Ending Diagonal is Under Development
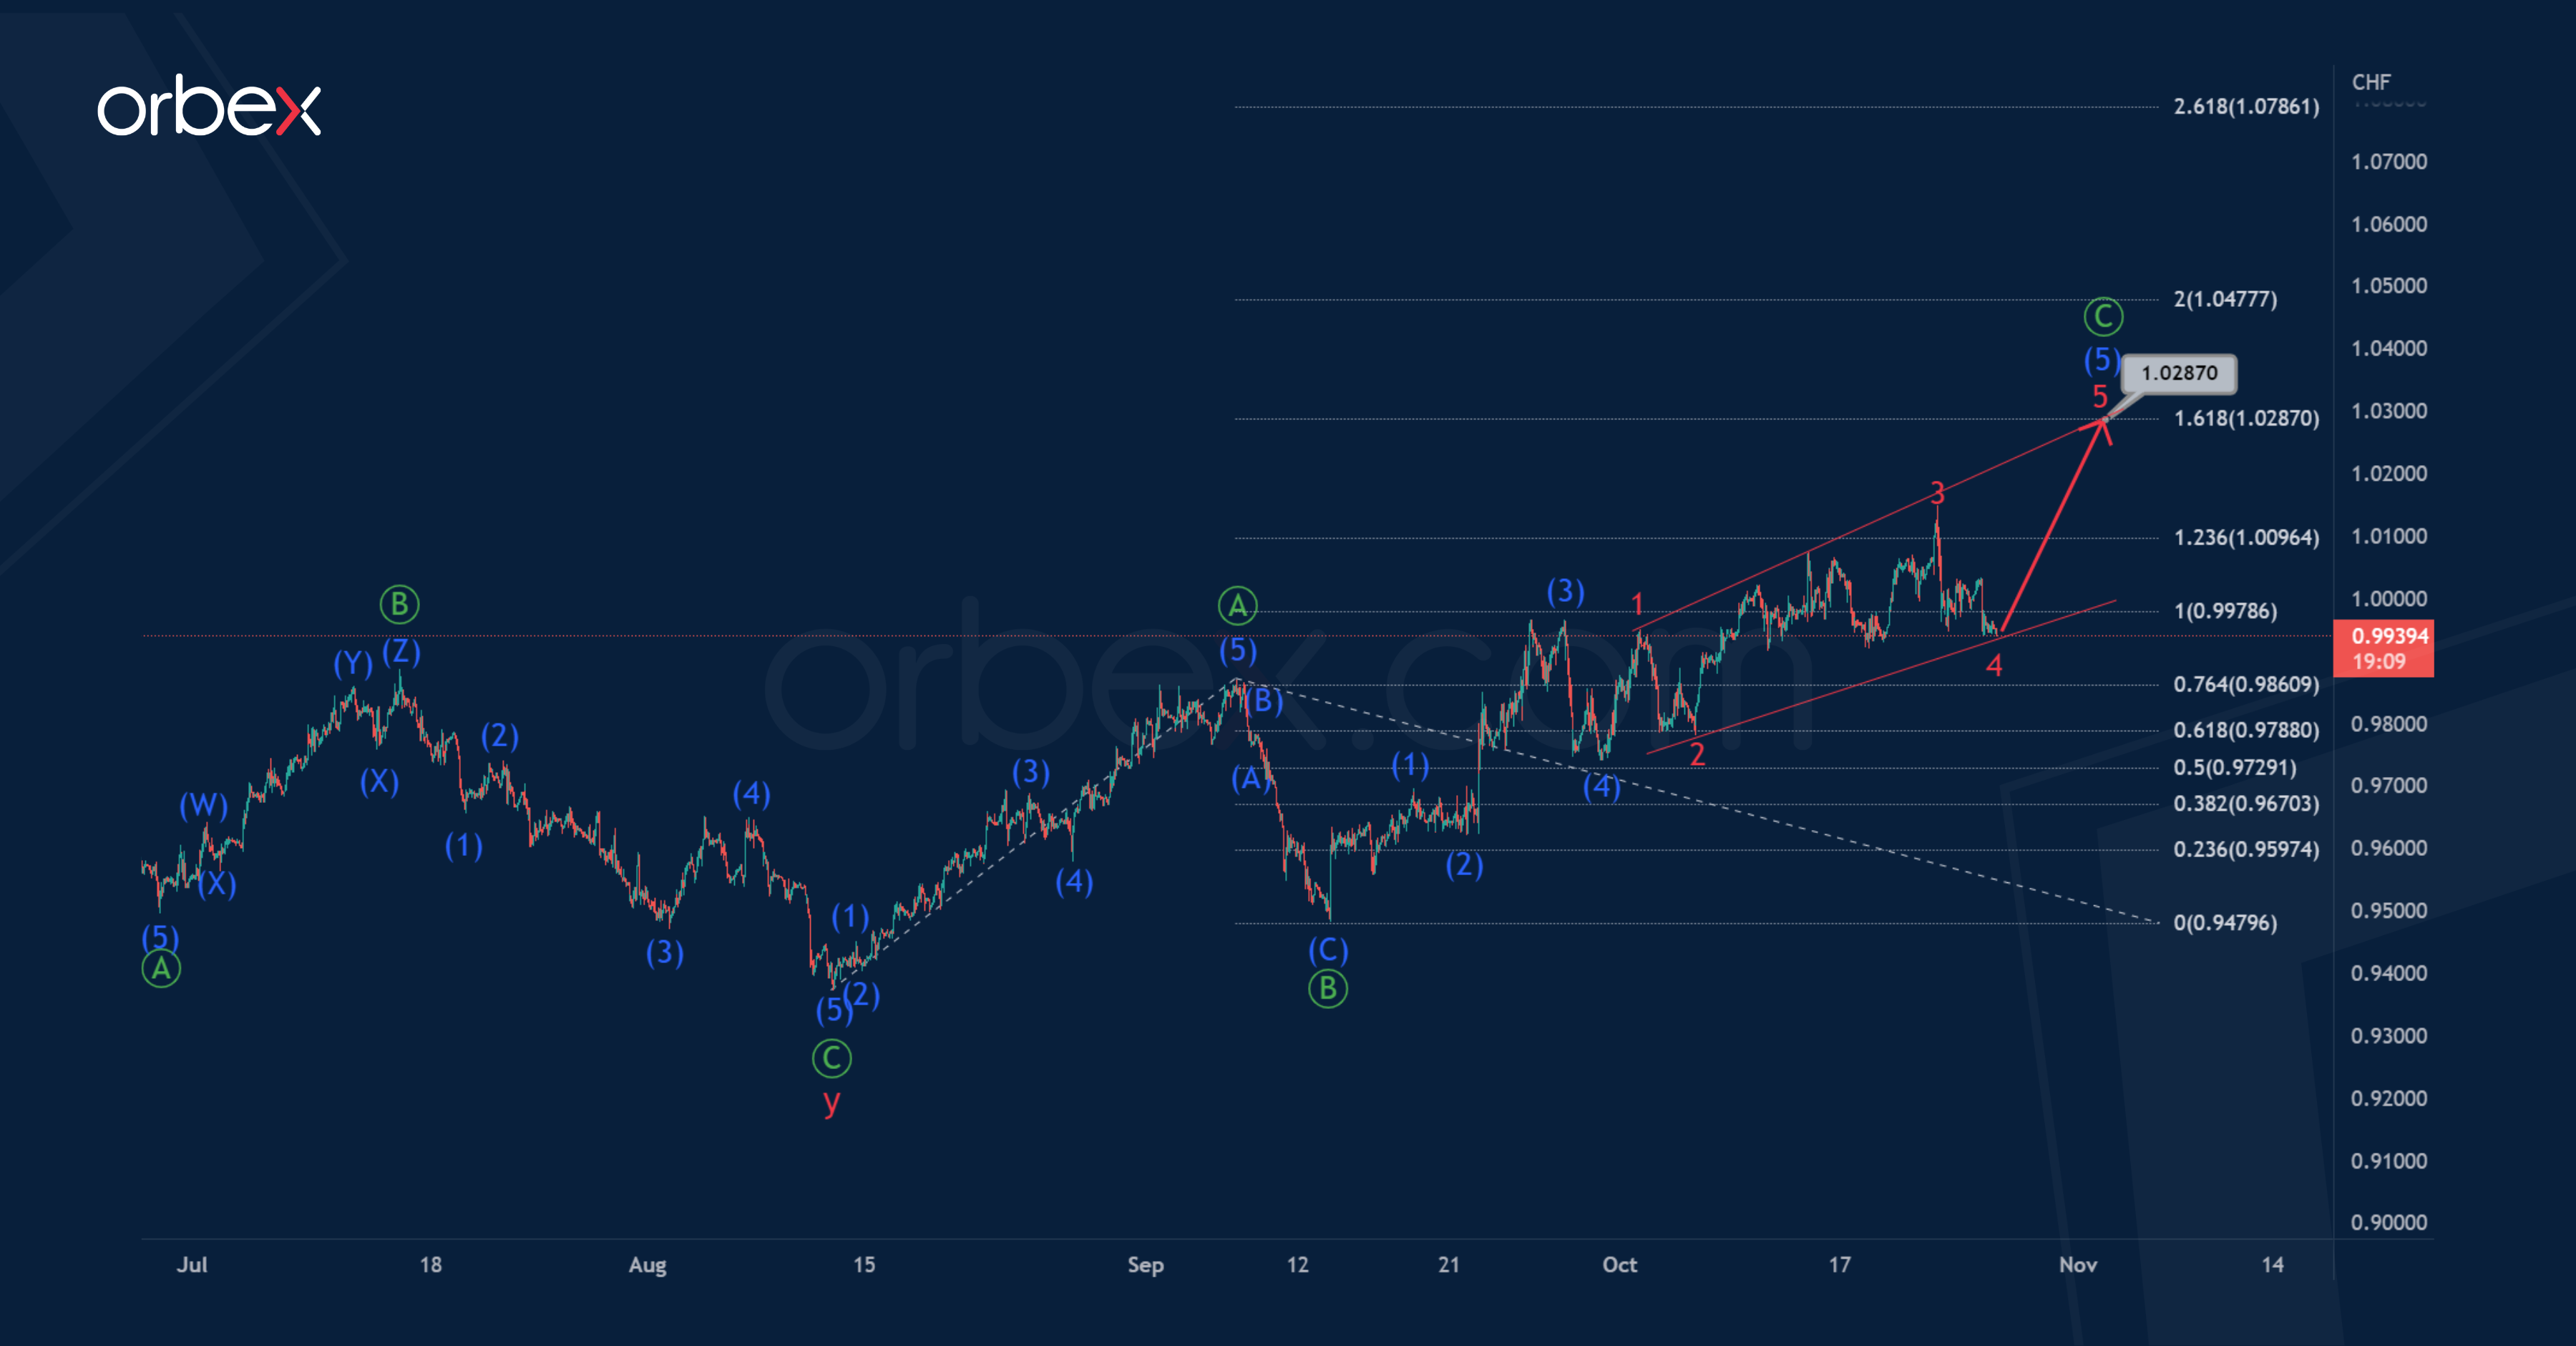
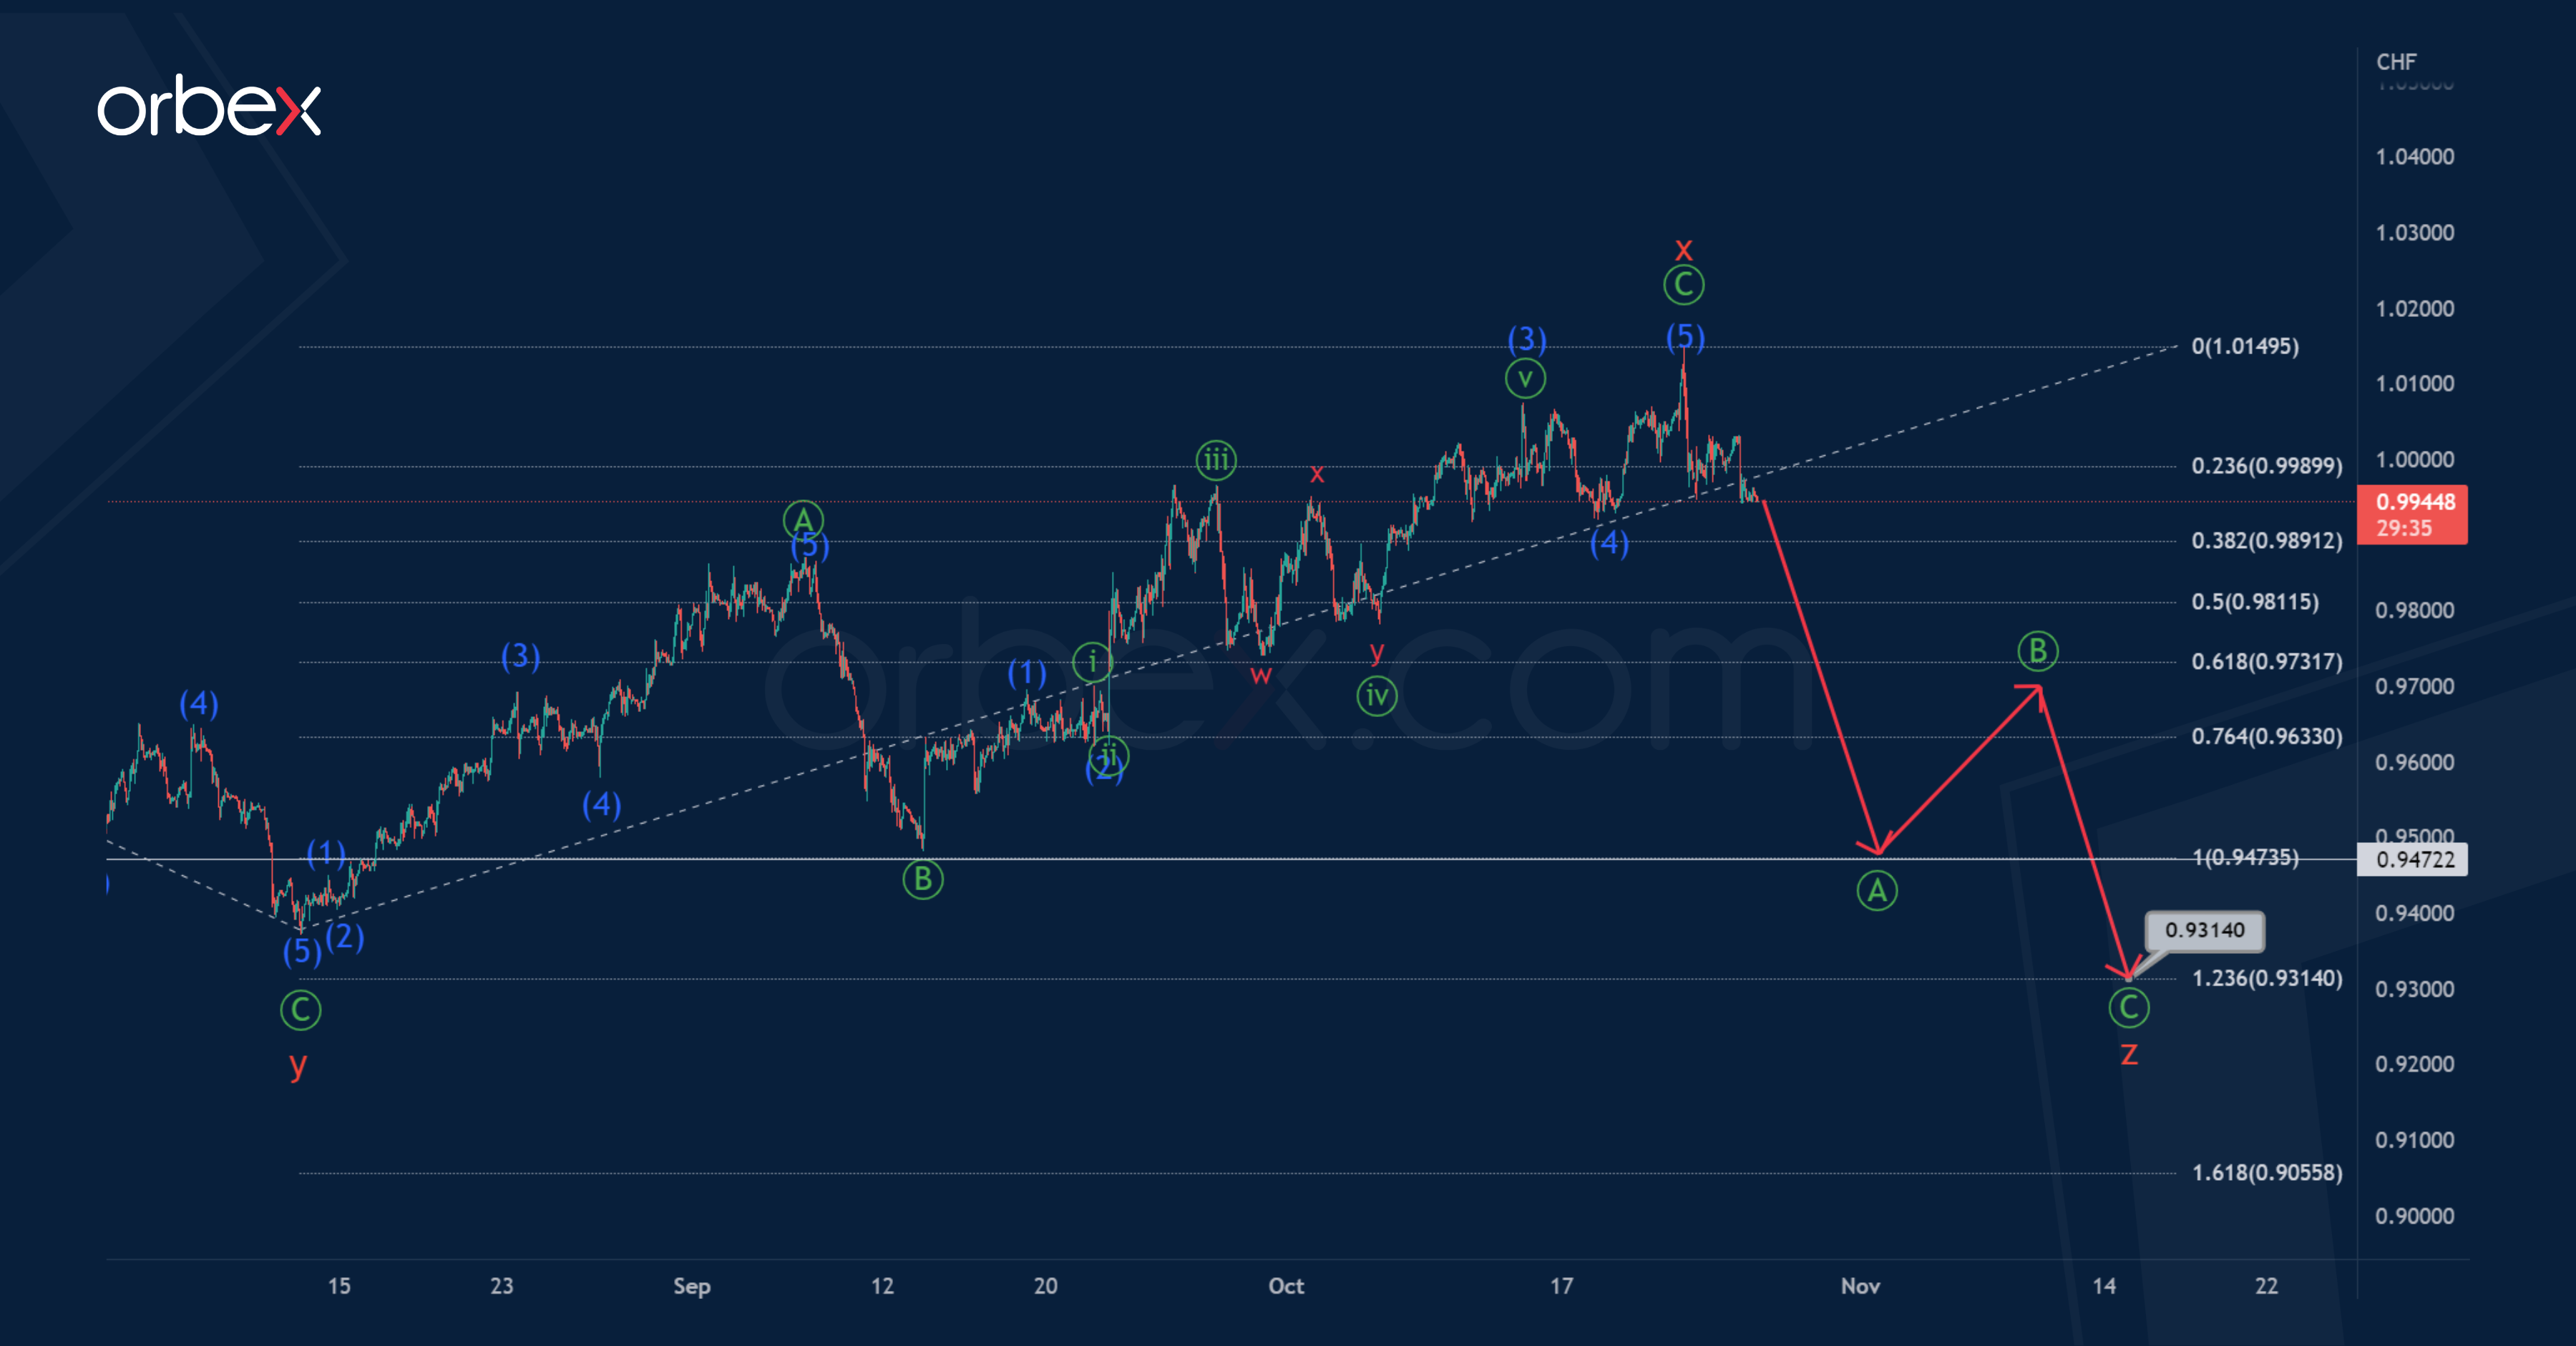
On the 1H timeframe for the USDCHF pair, we see the final part of the proposed large double zigzag consisting of cycle sub-waves w-x-y. This pattern looks fully completed, that is, the price decline in the cycle wave y, which is the primary standard zigzag, has come to an end.
Currently, there is a development of the initial part of a new corrective trend.
It is assumed that a standard 3-wave zigzag of the primary degree Ⓐ-Ⓑ-Ⓒ is being constructed.
Perhaps the first two sub-waves Ⓐ-Ⓑ are fully completed, so growth is expected in the direction of the 1.0096 level, in the impulse Ⓒ, the last leg of which takes the form of an ending diagonal 1-2-3-4-5, as shown in the chart.
At that level, wave Ⓒ will be at 123.6% of first impulse Ⓐ.
Alternatively, the cycle pattern may take a more complex form, that is, a triple zigzag w-x-y-x-z.
Thus, if this option is confirmed, we will see a decrease in the price and the construction of the final sub-wave z.
It is possible that the wave z will be at 123.6% of wave y and will complete its pattern near 0.931. And its first part, the primary sub-wave Ⓐ, may end at a minimum of 0.947.
An approximate scheme of possible future movement is shown on the chart.
FTSE 100 Tests Resistance
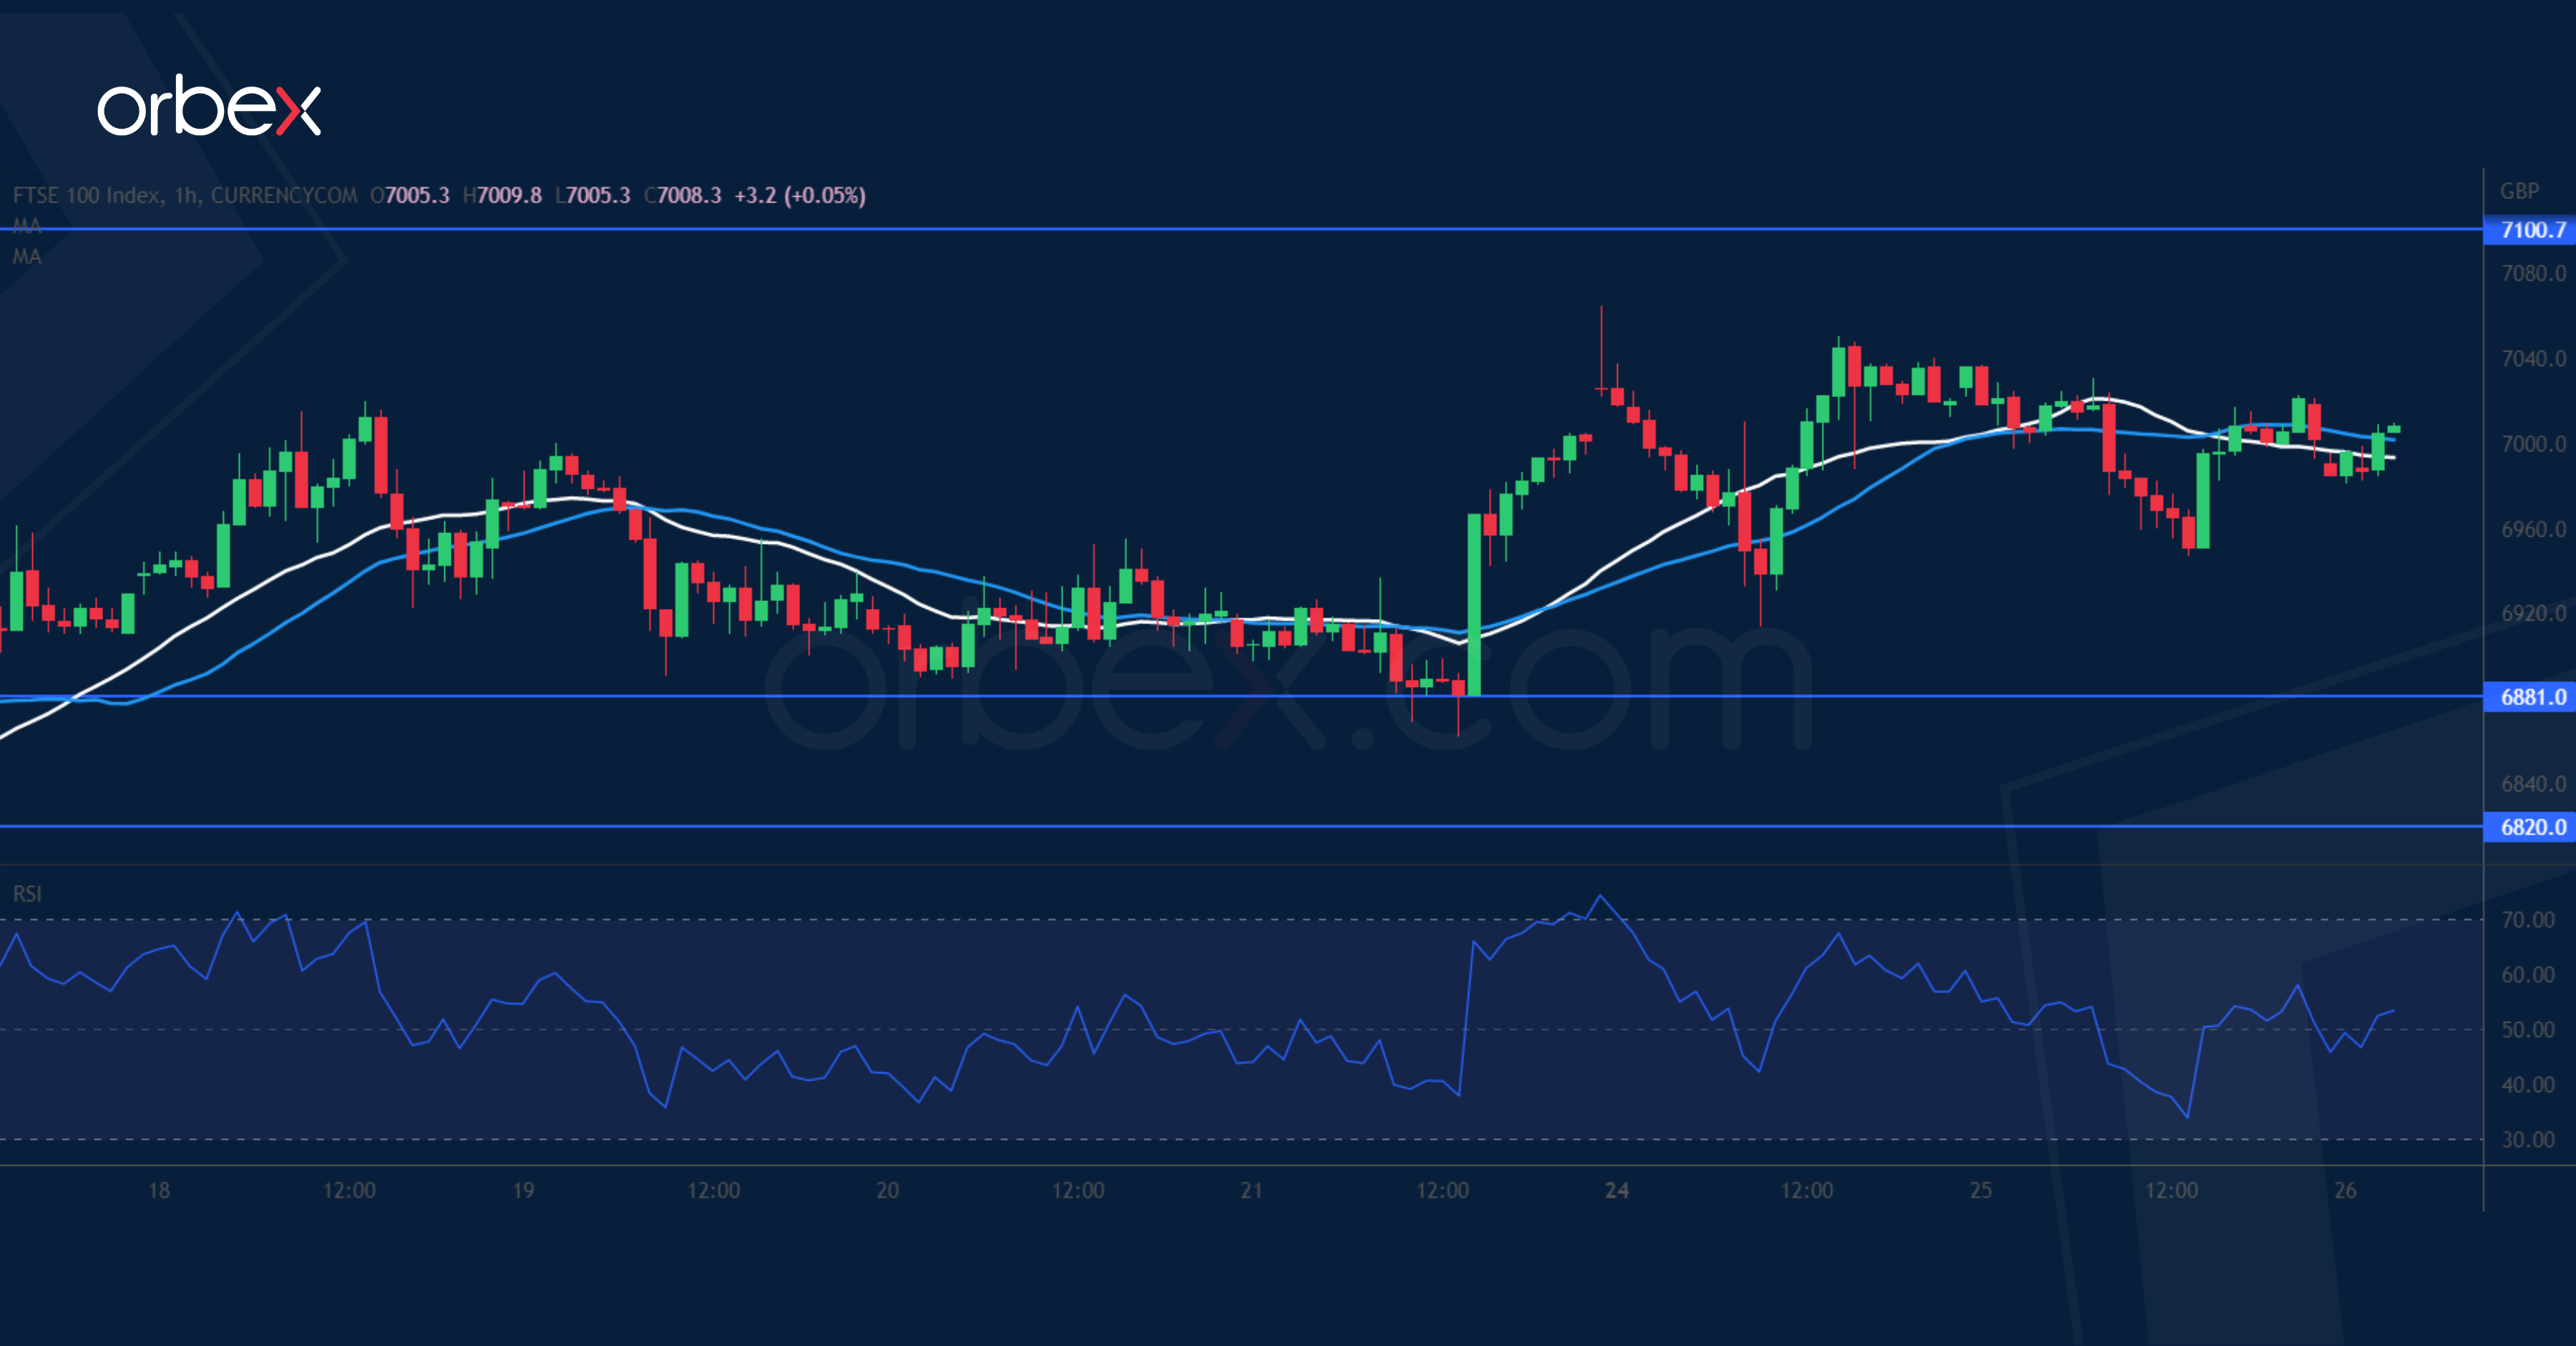
The FTSE 100 bounces as traders bet on a slowdown in the hiking cycle. The index has clawed back losses from previous sessions but the bias remains down. The price action is testing the supply zone between the 30-day moving average and the daily resistance at 7100 where strong pressure could be expected after the market edged into bearish territory. 6880 is a fresh support and 6820 the short-term bulls’ second line of defence. Their breach would invalidate the latest rebound and send the index below 6700.
XAU/USD Attempts to Bounce
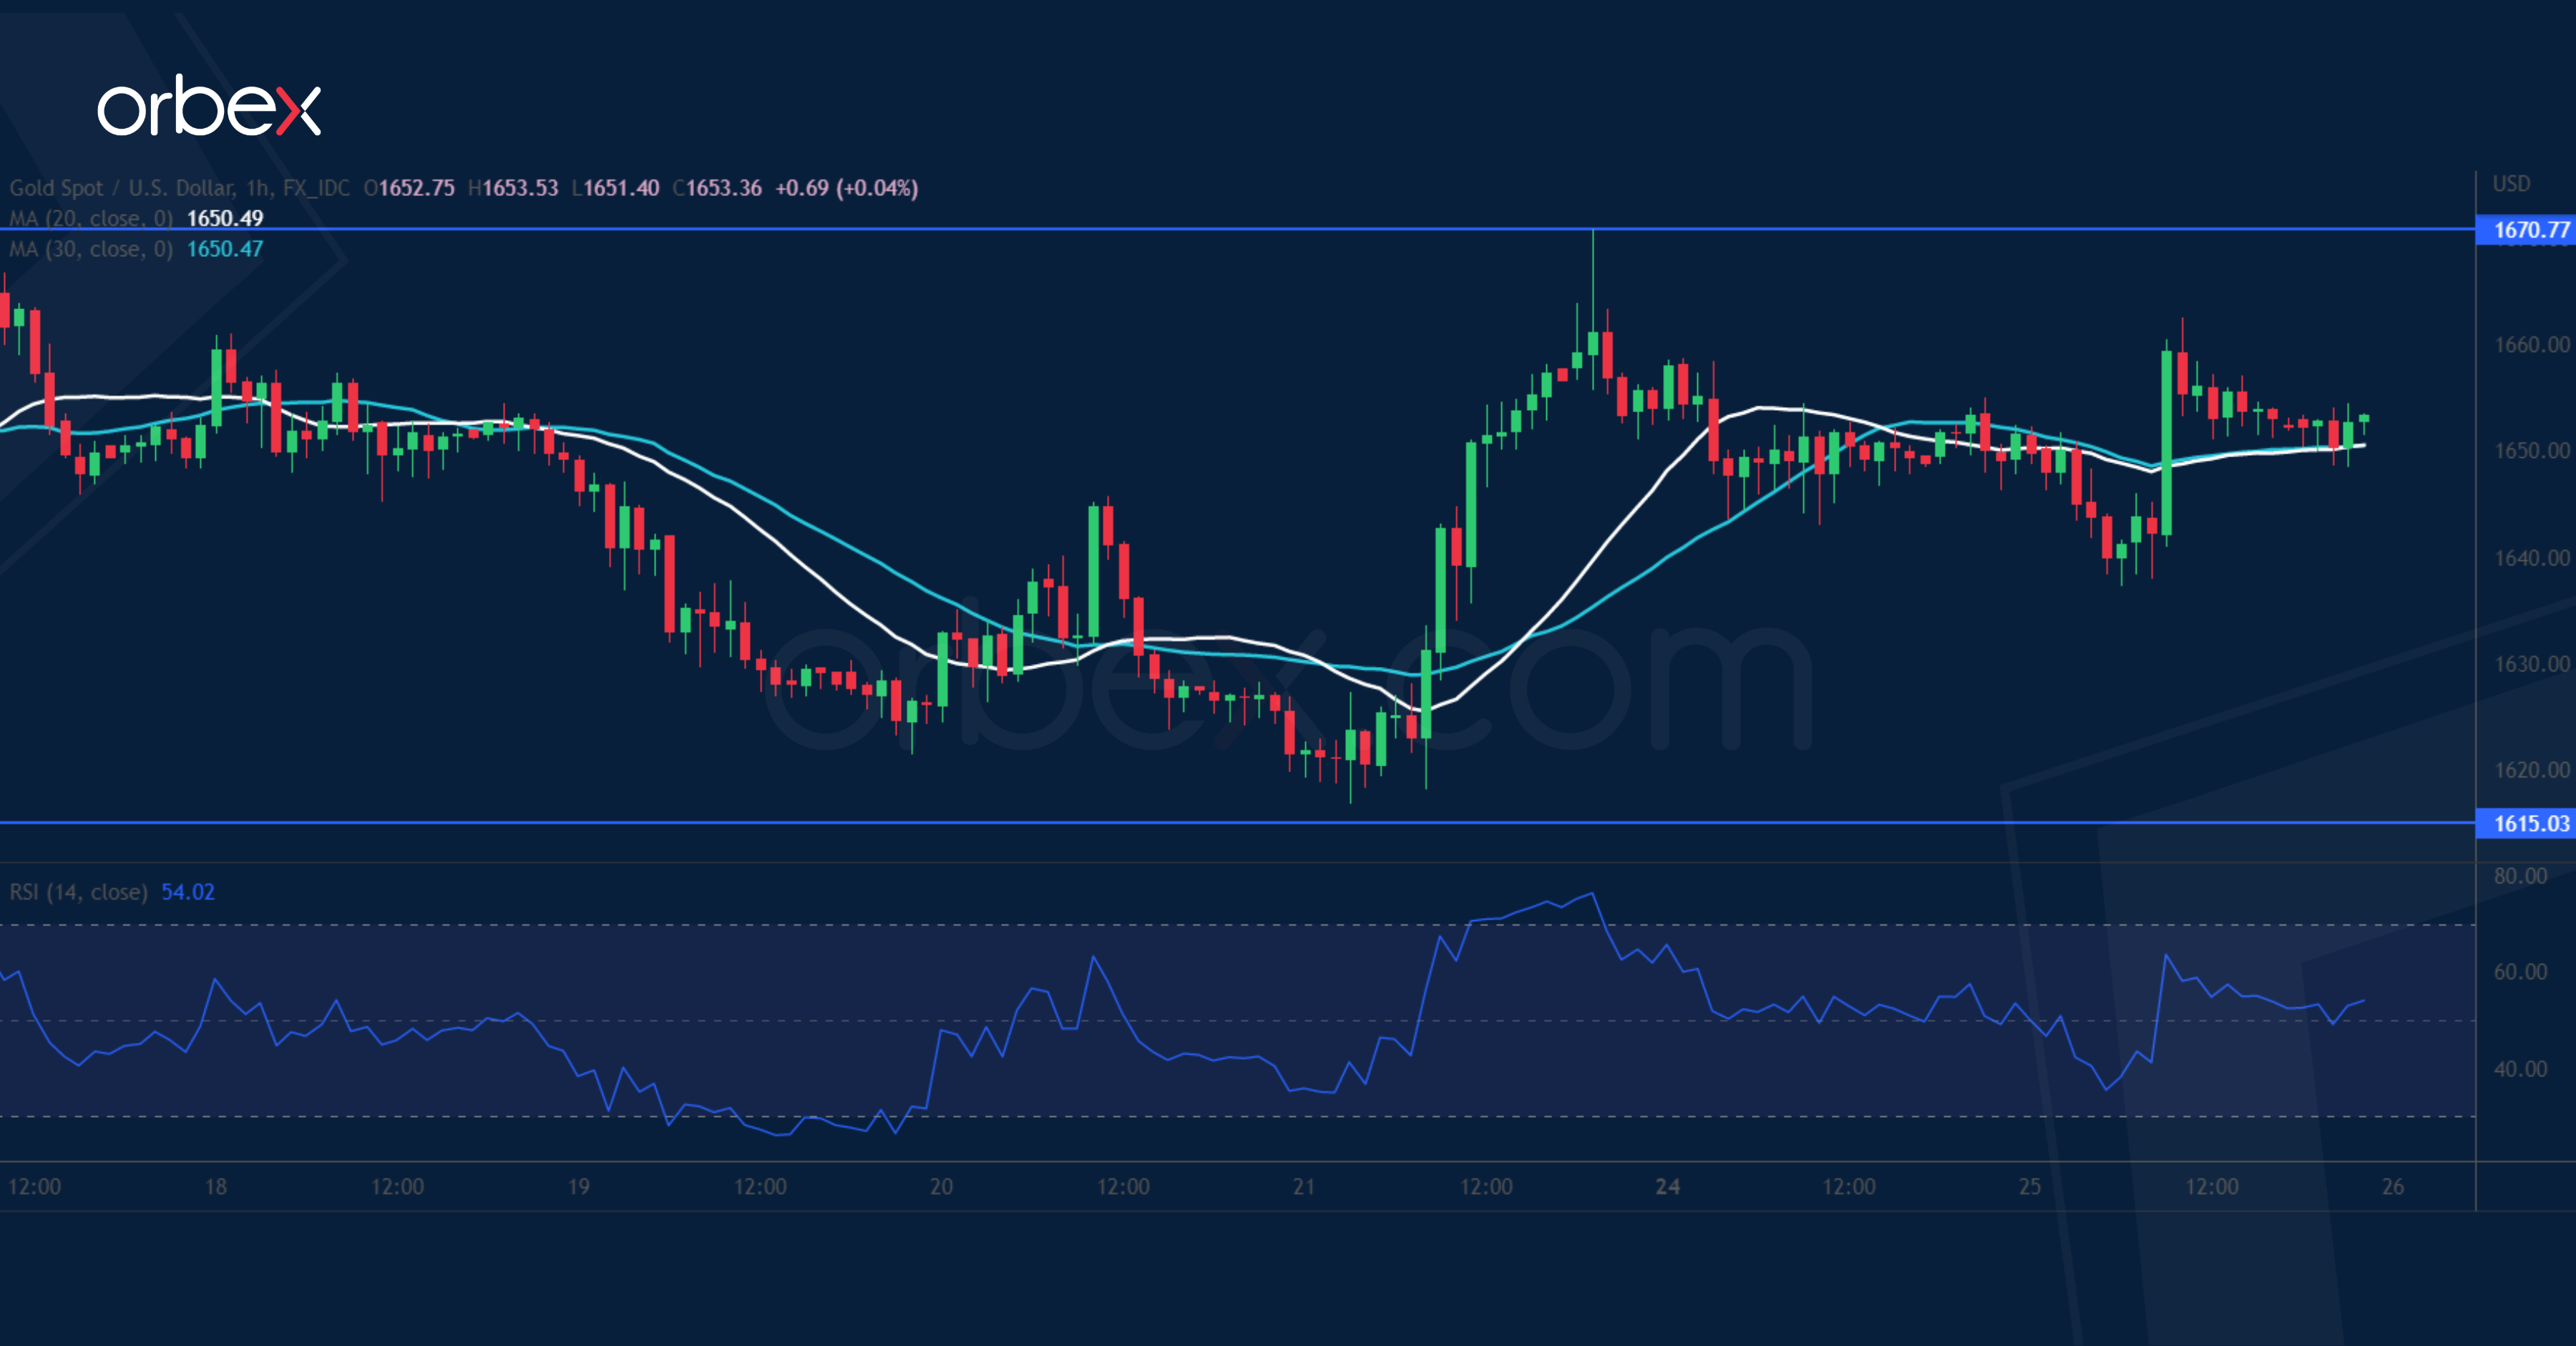
Bullion strengthens as a decline in US home prices weighs on Treasury yields. Gold saw bids at the previous low (1615) and a surge above 1660 may have prompted some short interests to cover. A rally fueled by profit-taking will not be enough to reverse the price action unless the precious metal secures follow-up buying. 1670 used to be a demand zone from a rally earlier this month and has become a key resistance. Its breach would carry the price to the previous high at 1730. A break below 1615 would push gold to 1570.
AUD/USD Grinds Higher
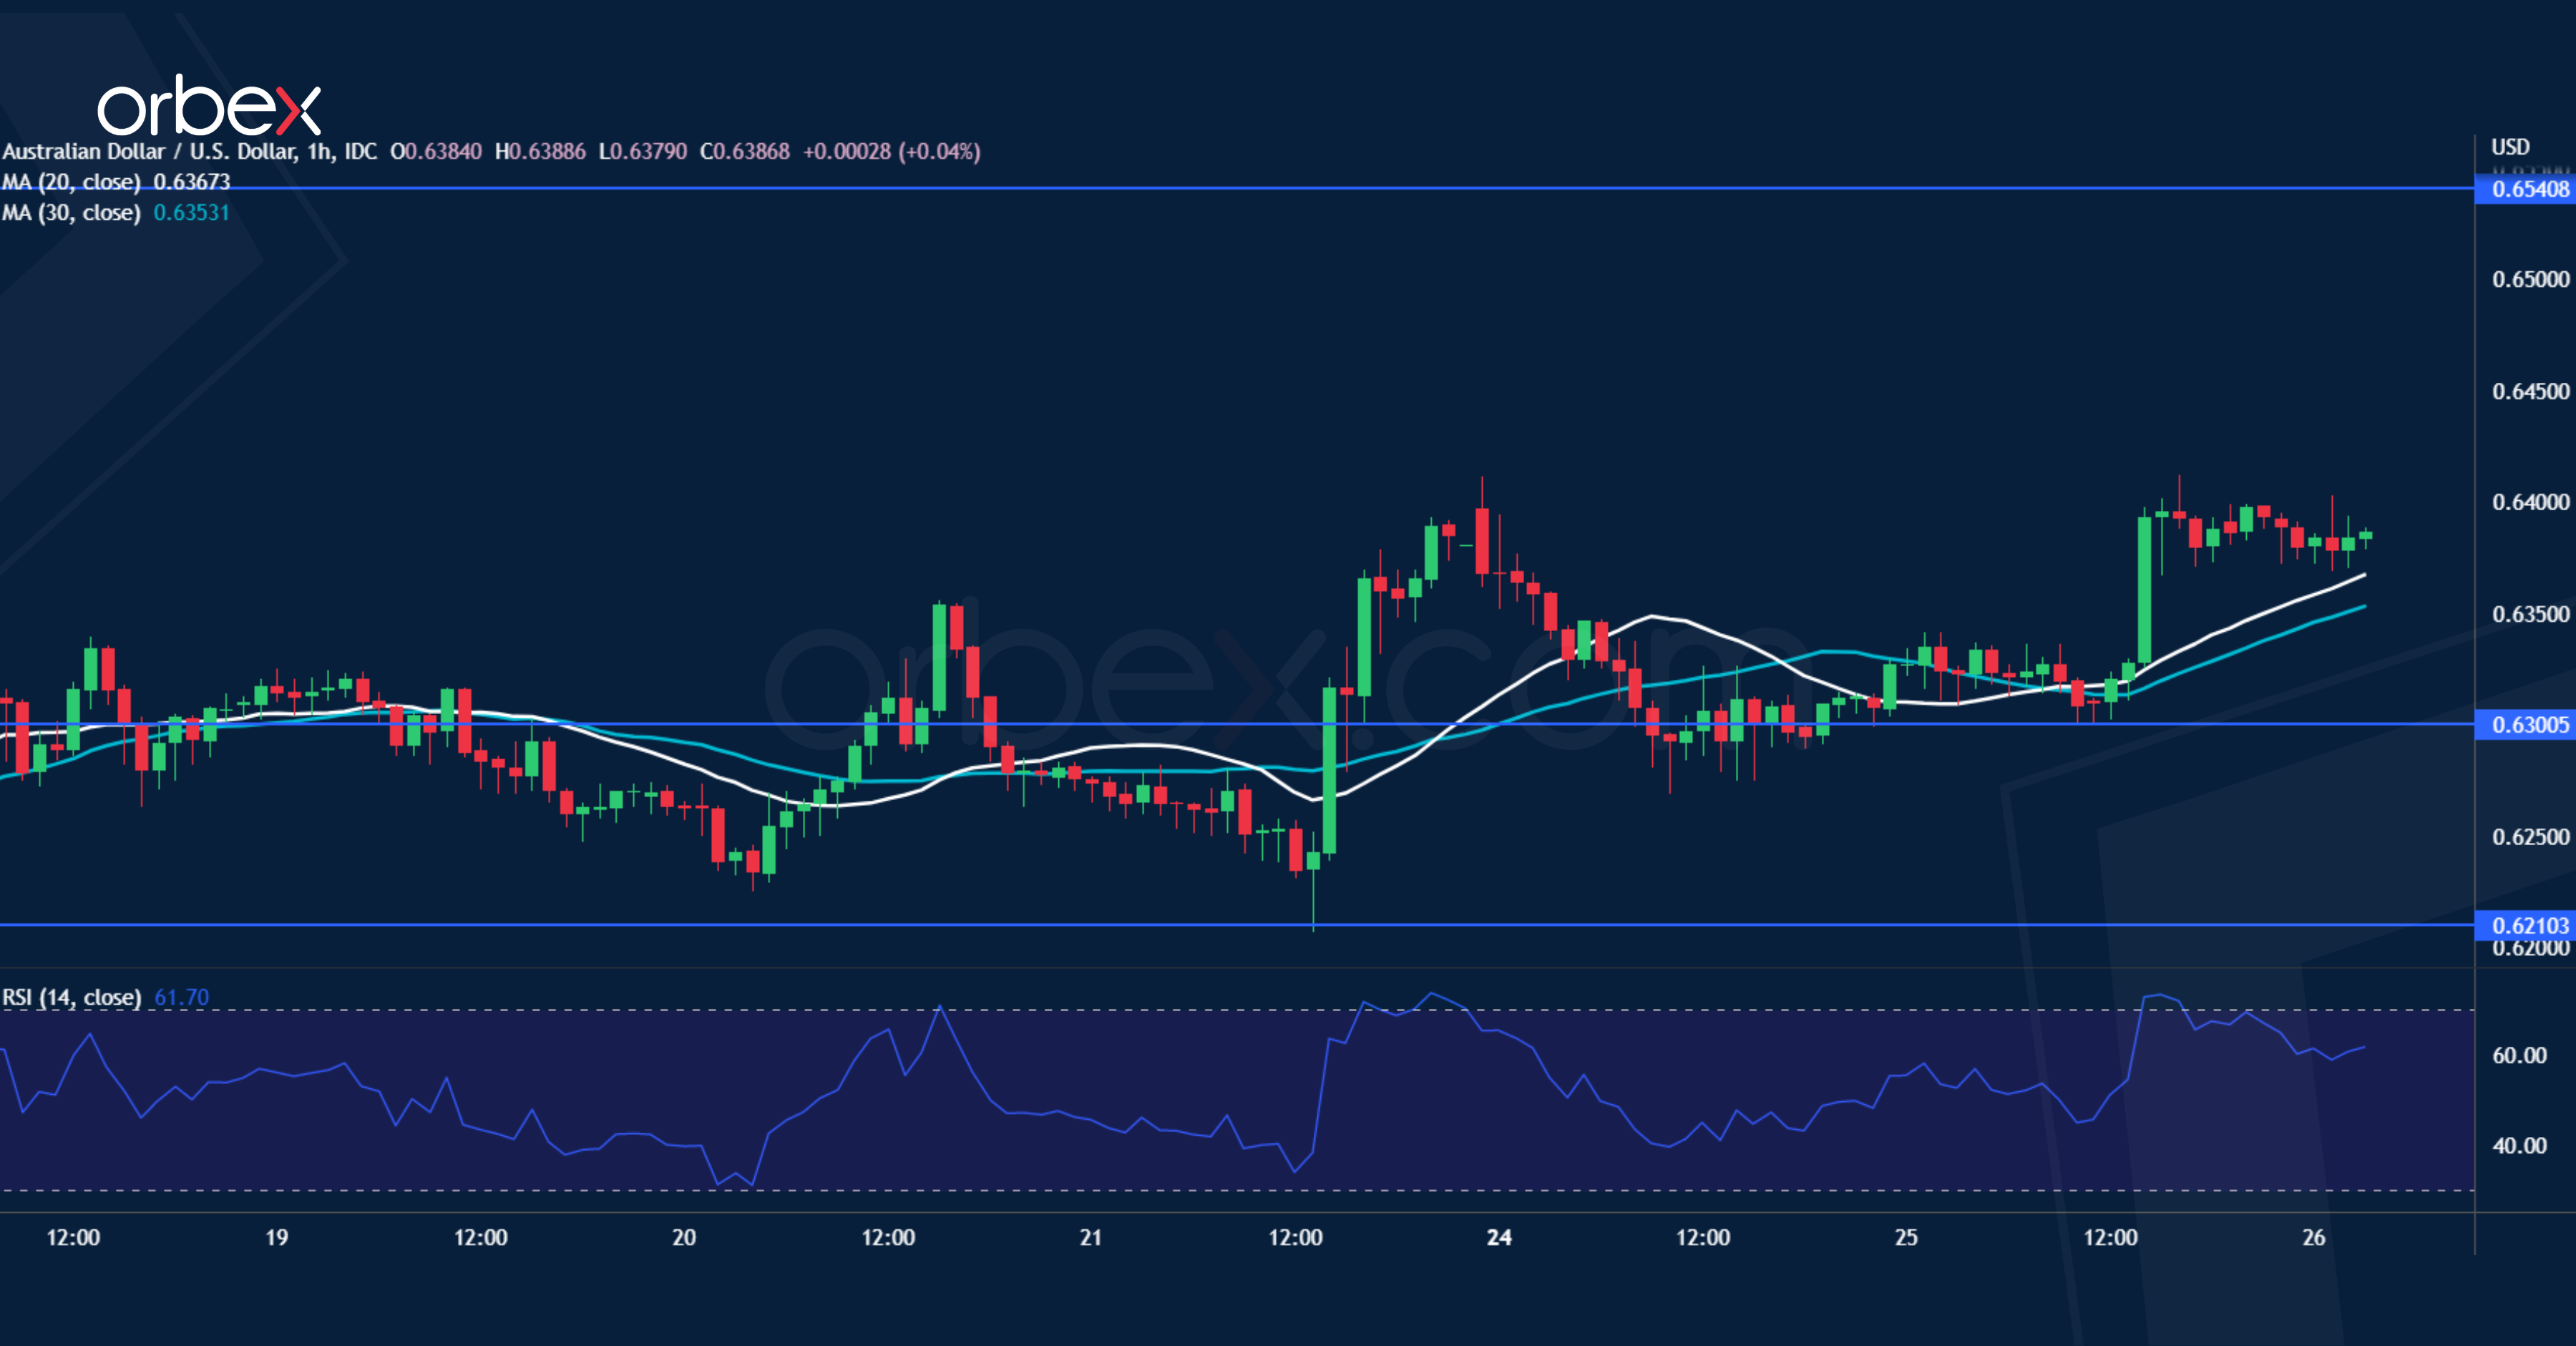
The Australian dollar finds support from strong CPI in Q3. From the daily chart’s perspective, sentiment remains extremely bearish and the latest rebound could be a mere flag-shaped consolidation near moving averages. The pair has met stiff selling pressure at the support-turned-resistance (0.6400). Its breach on a second attempt means that the bulls will be challenging 0.6540 before they could turn the mood around. Or a dip below 0.6300 could trigger a new round of sell-off below the critical floor at 0.6210.