Sample Category Title
Fed Bullard: Goal is to raise rates to some meaningfully restrictive level
St. Louis Fed President James Bullard said yesterday that Fed's goal is to front-load aggressive rate hikes to move to "some meaningfully restrictive level" that would push inflation down.
For November meeting, Bullard said the results "has been more or less priced in to markets" for a 75 basis-point hike, even though he'd prefer to decide at the meting. As for December, didn't want to "prejudge".
Then, in 2023, "I think we'll be closer to the point where we can run what I would call ordinary monetary policy," he said. "Now you're at the right level of the policy rate, you're putting downward pressure on inflation, but you can adjust as the data come in in 2023."
Fed Kashkari: I can’t see how I would recommend pausing interest rate increases
Minneapolis Fed President Neel Kashkari said yesterday that while headline inflation may have peaked, there is no evidence that core inflation has stopped climbing. So, "I can't see how I would recommend pausing interest rate increases," he added.
"My best guess right now is yes, do I think inflation is going to level out over the next few months, the services, the core inflation, and then that would position us some time next year to potentially pause," he added.
"I've seen very little evidence in my region that the labor market is softening," Kashkari said. "The No. 1 issue I hear from businesses small and large is that they're struggling to find workers, how they're having to pay more wages to keep their employees and to attract employees."
Bitcoin Price Is Facing Uphill Task, $20K Is The Key
Key Highlights
- Bitcoin price is facing a major resistance near $19,400 and $20,000.
- A major bearish trend line is in place with resistance near $19,400 on the 4-hours chart.
- A close above $20,000 might start a strong increase.
- The main breakdown support sits near the $18,500 zone.
Bitcoin Price Technical Analysis
Bitcoin price remained in a bearish zone below the $20,000 level against the US dollar. BTC/USD made a few attempts to gain strength above $19,500 but failed.
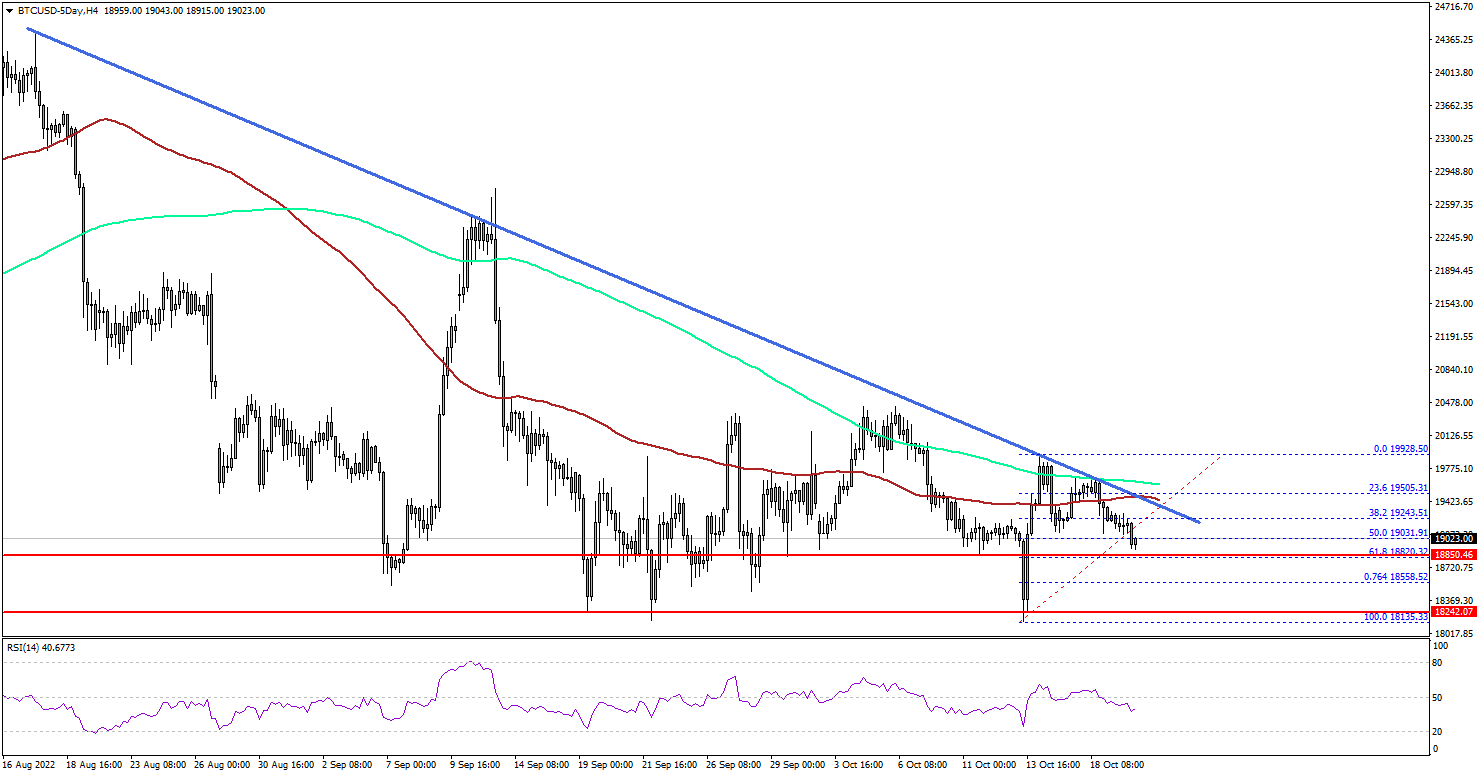
Looking at the 4-hours chart, the pair started a fresh decline from the $19,920 swing high. The price declined below the $19,500 level. It settled below the $19,500 level, the 100 simple moving average (red, 4-hours), and the 200 simple moving average (green, 4-hours).
On the upside, the price is facing a significant resistance at $19,400. There is also a major bearish trend line in place with resistance near $19,400 on the same chart.
The main resistance sits near the $20,000 level. A close above the $20,000 level may perhaps start a steady increase in the coming days. In the stated case, the price could rise towards the $21,000 level. Any more gains could set the pace for a move towards the $22,500 level.
On the downside, an initial support sits near the $18,800 level. The main breakdown support sits near the $18,500 zone. If there is a downside break, bitcoin might decline towards the $17,500 support in the coming sessions.
The overall price action and chart suggest that bitcoin price is facing an uphill task near $19,400 and $20,000, above which it could start a strong increase.
Economic Releases
- US Initial Jobless Claims - Forecast 230K, versus 228K previous.
- US Existing Home Sales for Sep 2022 (MoM) - Forecast -0.1%, versus -0.4% previous.
After Failed Upturn, Gold May Be Heading to $1150
Gold is down more than 1% on Wednesday and 5.5% in the last two weeks, failing to find any firm buying support after taking off at the end of September. Declining almost daily over the previous two weeks, it wiped away nearly all its gains of the recent rally, going back to levels of $1630. The technical picture looks contradictory, with something for both bulls and bears.
During the sell-off last week, gold returned under the 200-week moving average, signalling that the bears are still in control of the long-term trend in the metal. The last time we saw a similar technical pattern was in 2013. The analogy is reinforced by the fact that there were several years of solid gold price increases in response to the recession, rate cuts and QE. This was followed by a correction and a false attempt to push gold to renewed highs. But the economic slowdown played against the demand for the precious metal.
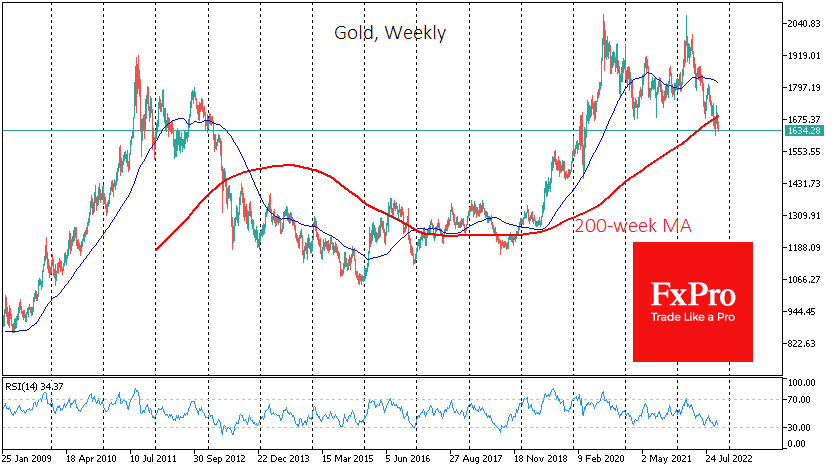
At that time, a renewed failure under the 200-week mark was followed by an absolute surrender, which took 18% off the price within seven weeks. The bearish trend finally died out two and a half years later.
Despite the frightening similarity in the weekly chart, there are differences from what happened ten years prior. Back then, the price of gold reached the bottom on the day of the first Fed rate hike, an event that did not stop the pressure this time.
On the daily candlestick charts, the rally in gold was stopped by the 50-day moving average, which has acted as resistance more than once since April of this year. However, the bullish divergence between the price and the RSI remains in force, indicating that the bearish momentum is locally exhausted.
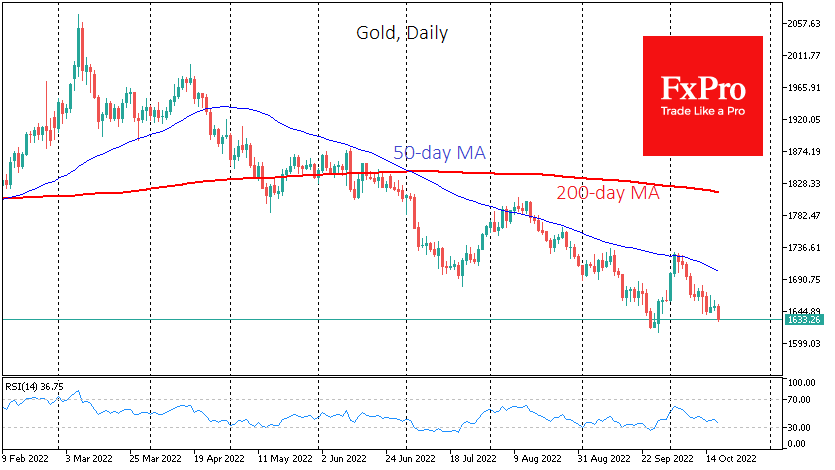
Should gold close this week below its 200-week average, which is now near $1680, the chances of a bearish scenario would increase sharply. In the recent history of free-floating, gold has fallen 18-30% after falling below the 200-week average. Translated to our prices, that implies a downside potential to $1350 or down to $1150, where the first level coincides with the upper bound of the 2013-2018 trading range and the lower level is near the lows of that same prolonged range.
Canadian Dollar Yawns After Inflation Report
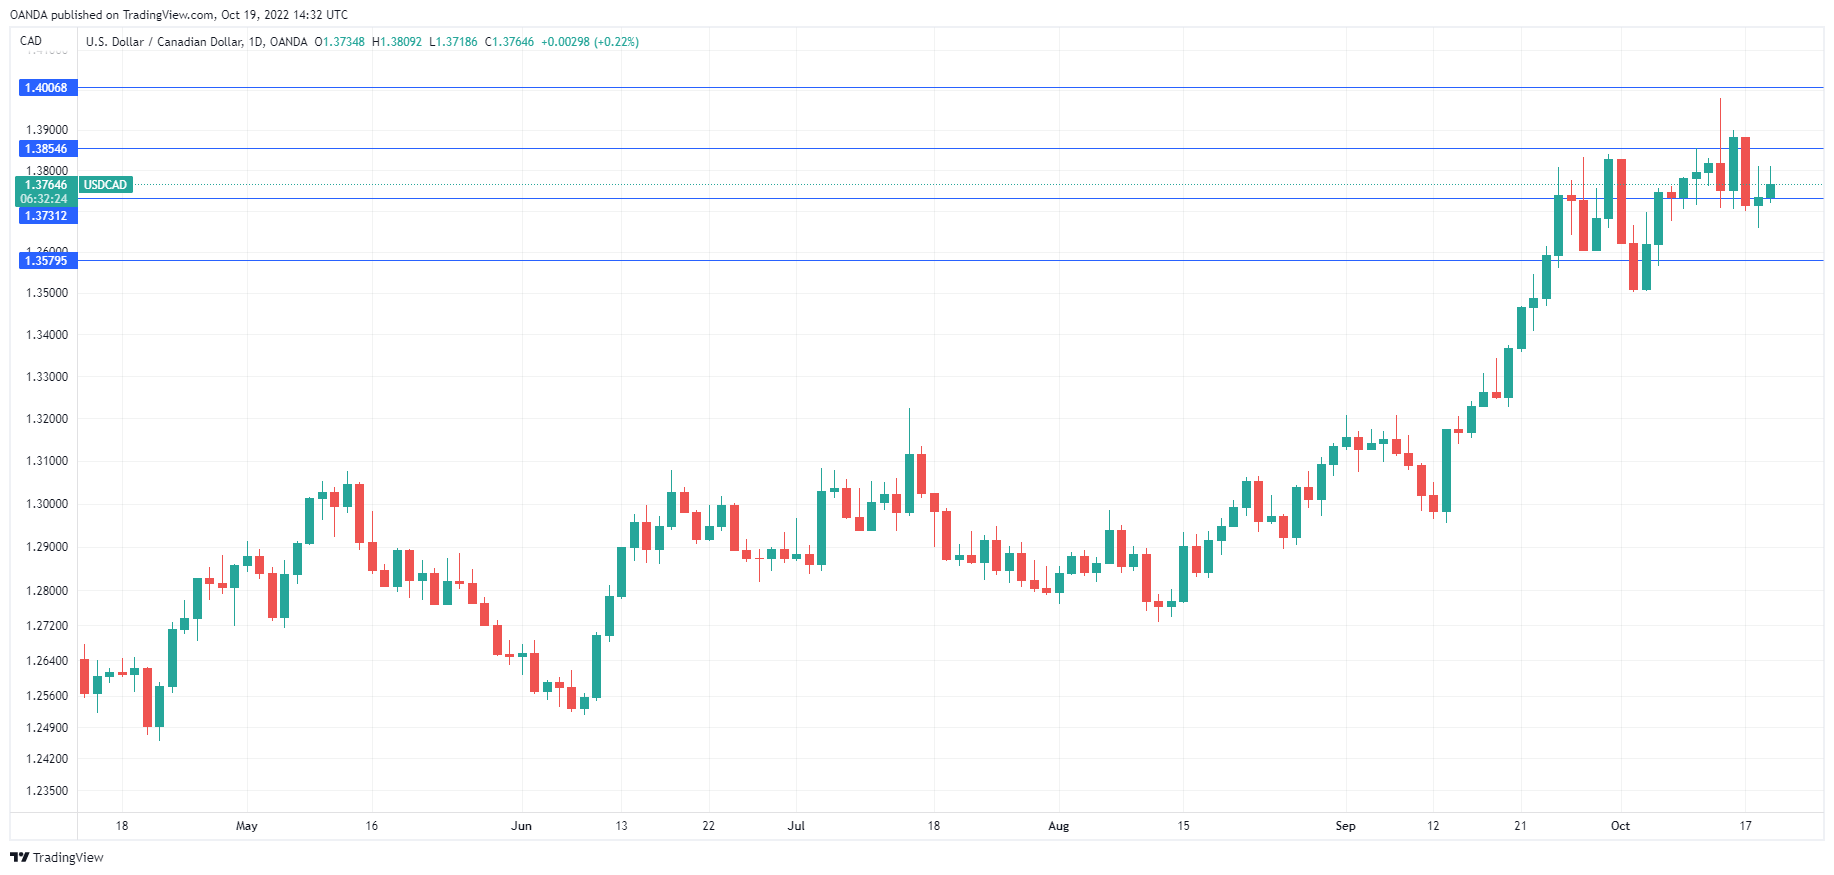
USD/CAD pushed higher earlier in the day but has pared most of those gains. In the North American session, the Canadian dollar is trading at 1.3757, up o.17%.
Canada’s CPI ticks lower
Headline inflation ticked lower to 6.9% in September, down from 7.0% in August. Still, the reading was higher than the consensus of 6.8%. Core inflation remains even more stubborn, rising to 6.0%, up from 5.8% and above the forecast of 5.6%.
The inflation report takes on added significance as the Bank of Canada meets next week, and as is the case with most major central banks, the question is not if rates will rise, but by how much. The Bank will be unhappy with core inflation rising, although I doubt this was much of a surprise for Bank policy makers, as most BoC core inflation indicators are around 6%. The takeaway from the inflation data is that there will be more support for a 75 basis point hike, as opposed to a 50bp move, with inflation remaining stubbornly high.
With the Federal Reserve possibly looking at a 75bp rate hike in November, a matching hike from the BoC will prevent the US/Canada rate differential from widening, which is good news for the Canadian dollar. The BoC’s aggressive rate tightening has pushed the economy closer to a recession, but inflation remains public enemy number one for the Bank, which means more oversize rate hikes are on the way.
In the US, the Fed’s rate tightening has led to the economy showing signs of cooling down, such as the housing market. The NAHB housing market index fell for a 10th straight month, dropping to 38 in October, down from 43 in September.
USD/CAD Technical
- 1.3927 and 1.4024 are the next resistance lines
- There is support at 1.3744 and 1.3647
ECB Preview – Focus on the Technicalities
Next week's ECB meeting is set to bring another 75bp rate hike in all three policy rates. We expect Lagarde to say that the probability of the ECB staff's downside risk scenario from the September projection exercise is becoming more likely, but fall short of giving new significant policy signals. We expect the ECB to continue to hike its policy rates until early next year, with the risk of potential further hikes if fiscal initiatives support the growth outlook in such a way that inflation remains too high over the medium-term.
Markets will focus on the risk of the ECB ending its APP reinvestments, which will complement the liquidity tightening that will take place as TLTROs mature next year. We do not expect the ECB to present a roadmap on how to end reinvestments at this meeting, but we expect the ECB to announce a change in its reserve remuneration system, which may initially cause some market jitters. We expect the ECB to calibrate the new system in such a way that the market relevant policy rate will continue to be the deposit rate, but we acknowledge risks to short-end credit spreads.
What the US Midterm Elections Mean for the Dollar and Stocks
On November 8, American citizens will head to the polls to elect their new Congress. Opinion polls and prediction markets argue the Republicans will take back at least one chamber, setting the stage for two years of political deadlock. Such an outcome could spark a relief rally in equity markets, and perhaps some profit-taking in the mighty dollar.
Power shift
With less than three weeks to go, investors are grappling with how this election could impact US government policy and financial markets. The Democrats currently hold a slim majority in the House of Representatives while the Senate is split 50-50, with Vice President’s Harris’s tiebreaker vote giving the Democrats control. Most prognostications suggest it would be a miracle if they keep control of both chambers.
Opinion polls clearly favor the Republicans to win back the House. According to simulation models by FiveThirtyEight, the probability of this scenario is around 70%, while betting odds in most prediction websites are even higher at 85%. The Senate is a much closer call, with both opinion surveys and bookmakers viewing it almost as a coin toss.
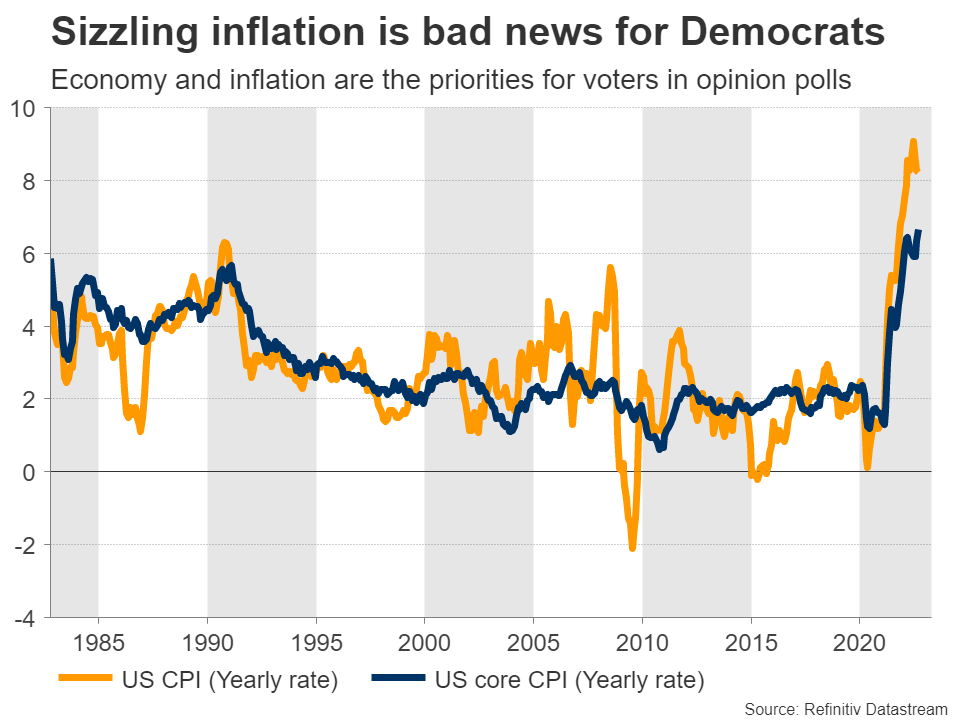
There is a long list of contentious issues at the heart of this election including abortions rights, climate policy, and threats to democracy. Nonetheless, the economy could still steal the spotlight amid the worst cost of living crisis in decades and rising concerns that a recession is on the horizon.
Stocks like a divided Congress
Historically speaking, stock markets tend to perform poorly in the months heading into midterm elections, but then stage sharp rallies after the event has passed. The logic behind this pattern is that investors often hedge or cut their market exposure because of the political uncertainty, and then unwind those hedges once they have clarity of the outcome.
Over the last seven decades, stock markets have always been higher six months after a midterm election. Of course that doesn’t mean much in a year as rocky as this one. Markets will be driven mostly by how inflation evolves, how high the Fed raises interest rates, and whether a recession actually hits. Still, it’s useful to look at the historical precedent.
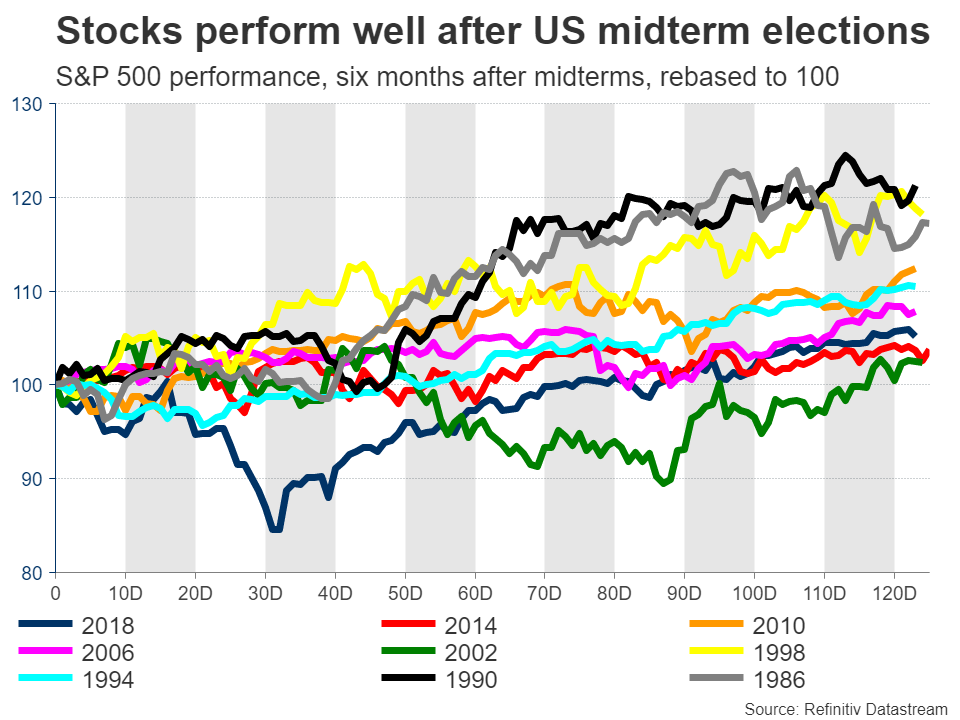
A divided Congress may prove beneficial for equity markets because it would strip President Biden’s power, limiting the scope for enacting anti-business legislation such as raising corporate taxes or tightening regulations. Even if the Republicans gain control of one chamber, they would almost certainly veto such laws, eliminating one risk facing investors.
The risk is that a split Congress is already the market’s baseline scenario. Hence, if the Democrats manage to pull off the upset victory and keep both chambers, that could spark a substantial selloff, although the likelihood seems quite low.
What about the dollar?
Turning to the US dollar, there is no clear historic pattern after midterms. The market reaction will boil down to how the election affects the trajectory of Fed policy. In this respect, a split Congress would probably limit the federal government’s ability to roll out new spending.
If the Republicans seize control, they will use their new powers to push back against recent decisions by the Biden administration such as forgiving student debt, and block any future initiatives that involve heavy spending.
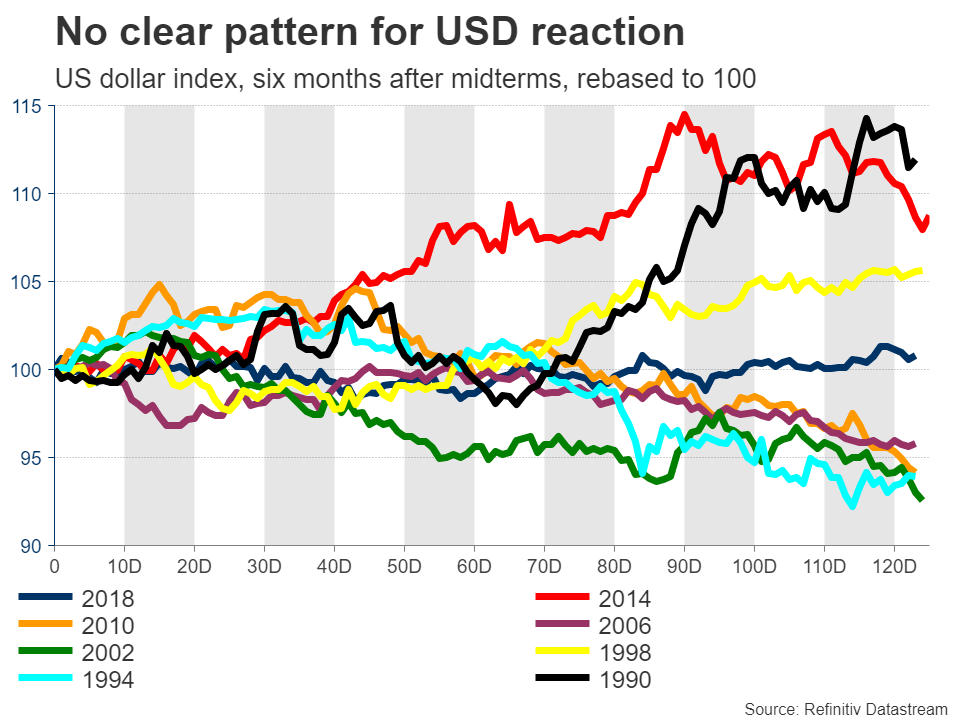
With fiscal spending being slashed in an environment of slowing economic activity, the next couple of years might be characterized by slower growth and softer inflation, which argues for the federal funds rate to peak at a lower level.
Market pricing currently suggests the peak will be just under 5%. This might be dialed down a notch if the Democrats lose Congress, igniting a pullback in the mighty US dollar.
Big picture
All told, this election is unlikely to be a game-changer for markets. It might be the trigger for a short-squeeze in stocks and a round of profit-taking in the dollar, but ultimately those are likely to be relief moves, not trend reversals.
Stock markets are still far too ‘expensive’. Valuations haven’t fully adjusted to the rapid spike in real rates yet, and with the economic data pulse slowing, particularly in Europe and China, the risk of an earnings recession is becoming increasingly realistic.
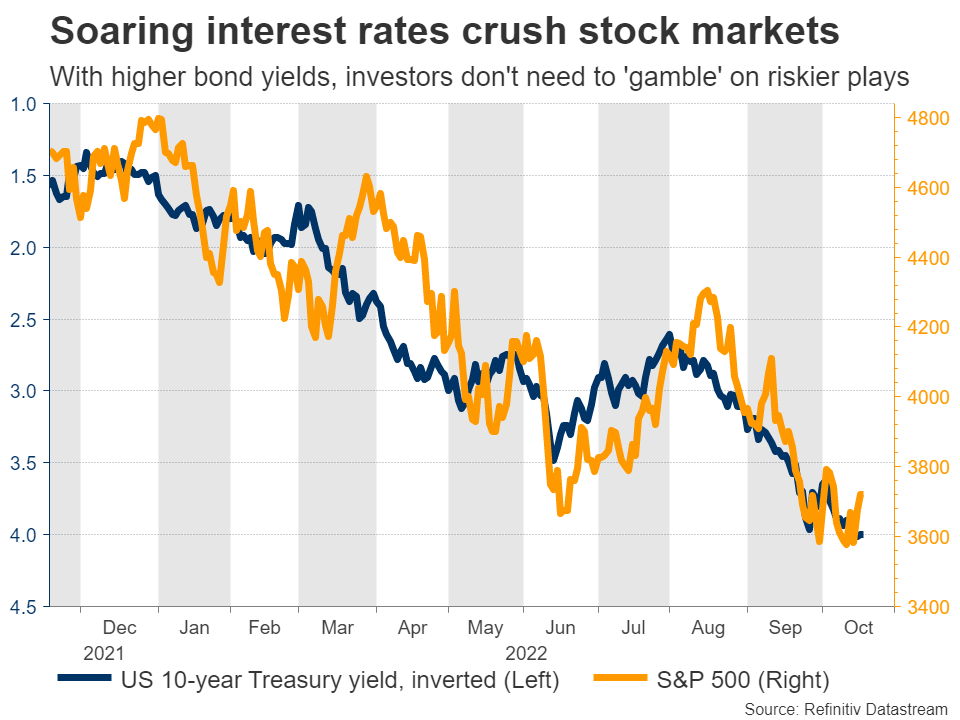
As for the dollar, the dynamics that fueled this spectacular rally are still very much in play. Inflation is scorching-hot and the US labor market remains in good shape, giving the Fed cover to keep raising rates aggressively. Meanwhile, every other major currency is battling its own demons, so there is hardly any competition.
There’s a Fed meeting almost one week ahead of the midterms, which could prove to be equally important for the dollar as investors try to decipher when the central bank might hit the pause button.
Sunset Market Commentary
Markets
As was the case yesterday and on Monday, eco data still were second tier today. EMU September inflation was revised out of double digit territory (9.9% Y/Y from 10.0% preliminary reading), but with metrics of core inflation trending decisively higher, this doesn’t change the conclusion that the ECB still has plenty of work to do. US housing starts surprised to the downside confirming other evidence that rising yields are weighing on activity in the sector. Admittedly, permits were marginally better than expected. Even so, after a tentative pause earlier this week, core bond yields resumed their ‘natural drift north’. Fed’s Kashkari yesterday warned that, if core inflation continues to rise, it’s no option for the Fed to stop its tightening cycle at 4.50% or 4.75%. This leaves room for markets to reprice the peak Fed policy rate beyond the 4.875% forecast of the MPC hawks at last month’s Fed’s dot plot. US yields are gaining between 10 bps (2-y) and 5 bps (30-y) with bond yields across the whole curve touching new cycle peak levels intraday. The German yield curve also bear flattened. Bunds hugely underperform EMU swaps. German yields are gaining between 10 bps (2-y). The 30-y trades marginally lower (-1 bp). The 2-y bund yield also touched a new cycle top at 2.12%. ECB’s Nagel yesterday evening reiterating that the ECB should soon start reducing its bond portfolio maybe partially explains the bund underperformance versus swaps. Will the ECB already give some hints on this topic at next week’s policy meeting? Whatever, QT is on the radar of European bond markets, too. For now, the impact on intra-EMU spreads remains manageable. The 10-y Italian spread vs Germany even eases slightly (- 2bps). The resumption of the yield uptrend also caps this weeks tentative ‘rebound’ of equities. The EuroStoxx 50 (+ 0.3%) returned most of an intra-day uptick. US indices open mixed to modestly lower (S&P -0.2%).
Higher real yields and the risk-rebound running into resistance again changed fortunes in favour of the dollar. DXY jumped from the 112 area in Asia this morning to currently trade at 112.8. EUR/USD dropped back below the 0.98 handle (0.978). USD/JPY (149.75) is nearing the 150 psychological barrier with markets still pondering Japanese authorities’ strategy on the protracted decline of their currency (hidden interventions?). Sterling reversed a poor start (against the euro) after September UK CPI again printed in double digit territory (10.1). Still, EUR/GBP finally drooped back below the 0.87 handle in calm trading. News Headlines
Canadian inflation rose by 0.1% M/M in September with the headline number marginally slowing down from 7% Y/Y to 6.9% Y/Y. Consensus expected a bigger fall (-0.1% M/M & 6.7% Y/Y). Lower gasoline prices were mostly responsible for the deceleration (-7.4% M/M). Prices for food purchased from stores (+11.4%) grew at the fastest pace Y/Y since August 1981 (+11.9%). Unfavorable weather, higher prices for important inputs such as fertilizer and natural gas, as well as geopolitical instability stemming from Russia's invasion of Ukraine contributed to the rise in food and beverage prices. Excluding food and energy, prices rose 5.4% in September (from 5.3% Y/Y). The cost of services accelerated from 5.5% Y/Y to 5.6% Y/Y. Mortgage interest costs also continued to put upward pressure on overall inflation. Average hourly wages rose 5.2% Y/Y. The upward inflation surprise suggests that the BoC will need to stick to the September 75 bps rate hike pace instead of slowing down to 50 bps. The policy rate currently stands at 3.25%. Canadian swap yields rise by 8.5 bps to 13.5 bps today with the belly of the curve underperforming the wings. The loonie fails to profit with USD/CAD a tad higher near 1.3770.
Polish consumer confidence dropped to its lowest level on record in October (-45.5 from -44.2) with underlying details showing a deterioration in both the current situation and future expectations. Polish citizen’s became much more concerned on job security, the general economic situation in the country and the potential to save money.
EUR/USD Mid-Day Outlook
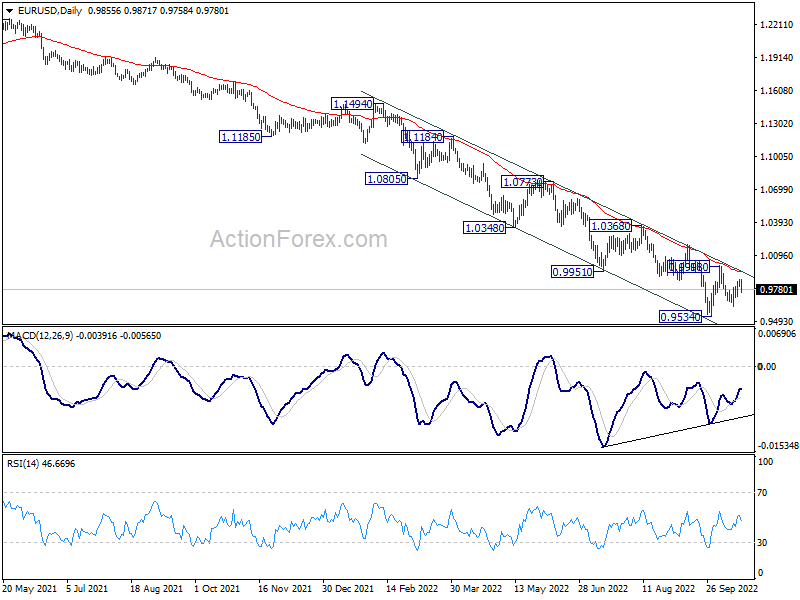
Daily Pivots: (S1) 0.9759; (P) 0.9805; (R1) 0.9891; More...
Intraday bias in EUR/USD stays neutral and outlook is unchanged. Deeper decline is expected with 0.9998 resistance intact. Below 0.9630 will bring retest of 0.9534 low first. Firm break there will resume larger down trend. However, break of 0.9998 will confirm short term bottoming and turn bias back the upside for stronger rebound.
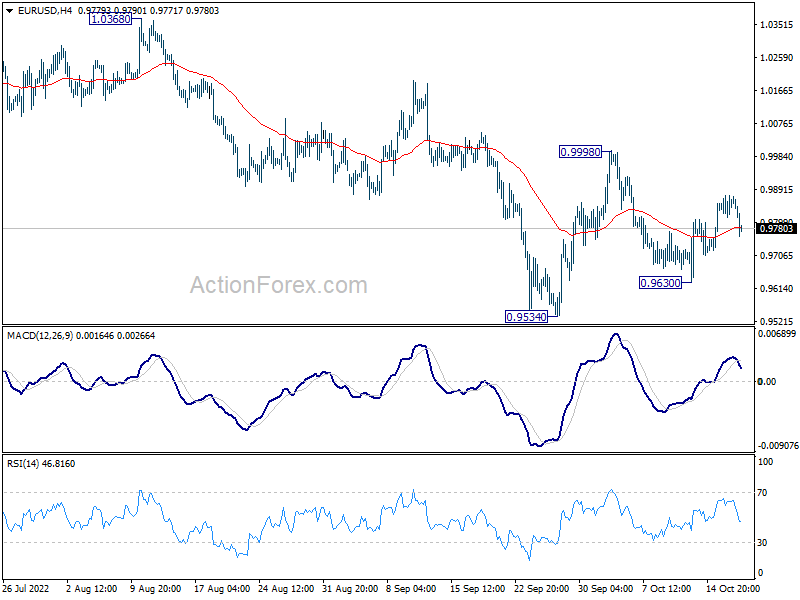
In the bigger picture, down trend from 1.6039 (2008 high) is still in progress. Next target is 100% projection of 1.3993 to 1.0339 from 1.2348 at 0.8694. In any case, break of 0.9998 resistance is needed to be the first sign of medium term bottoming. Otherwise, outlook will stay bearish even with strong rebound.