Sample Category Title
GBP/USD Mid-Day Outlook
Daily Pivots: (S1) 1.1247; (P) 1.1329; (R1) 1.1401; More...
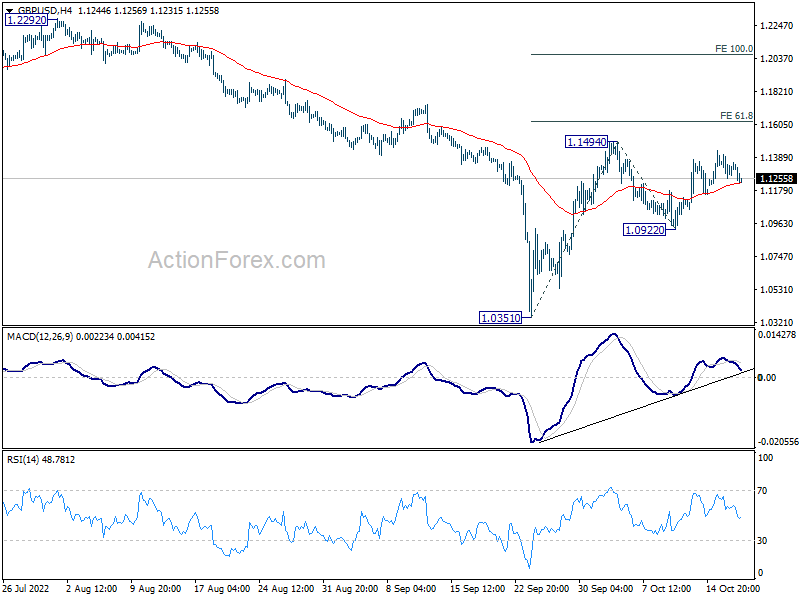
Intraday bias in GBP/USD remains neutral for the moment. On the upside, break of 1.1494 will resume the rise from 1.0351 to 61.8% projection of 1.0351 to 1.1494 from 1.0922 at 1.1628. On the downside, below 1.0922 will turn bias back to the downside for 1.0351 low instead.
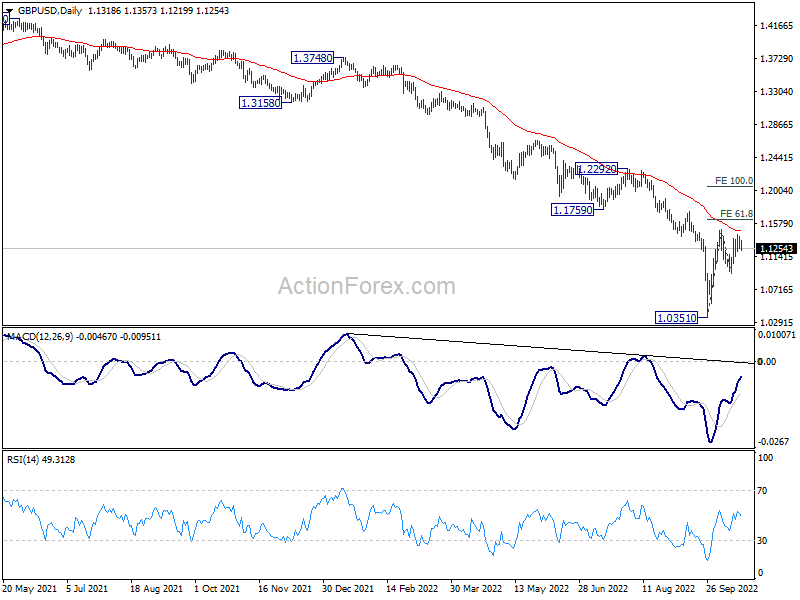
In the bigger picture, fall from 1.4248 (2018 high) is resuming long term down trend from 2.1161 (2007 high). Next target is 100% projection of 2.1161 to 1.3503 from 1.7190 at 0.9532. There is no scope of a medium term rebound as long as 1.1759 support turned resistance holds.
USD/CHF Mid-Day Outlook
Daily Pivots: (S1) 0.9915; (P) 0.9986; (R1) 1.0027; More...
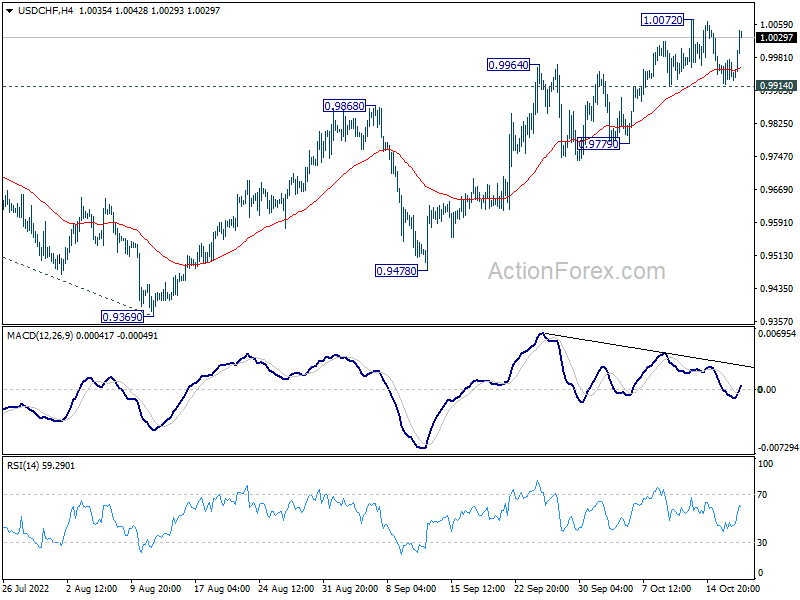
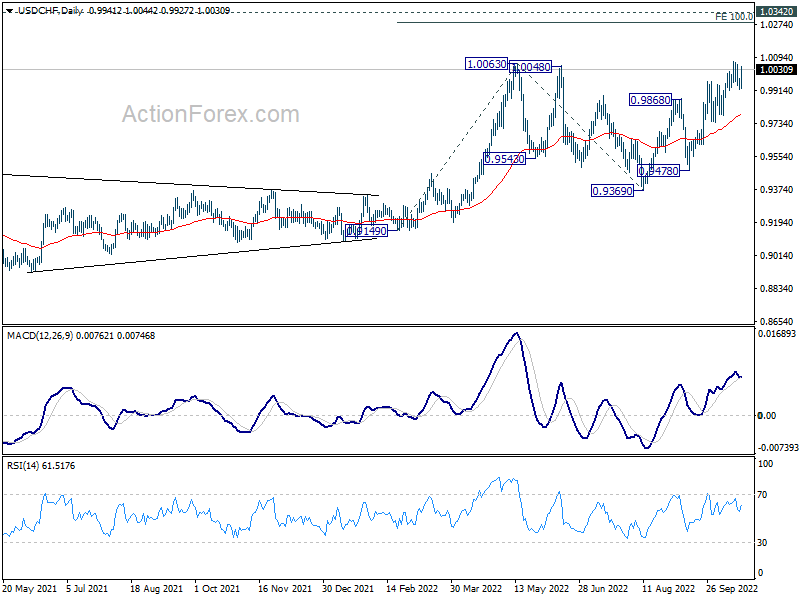
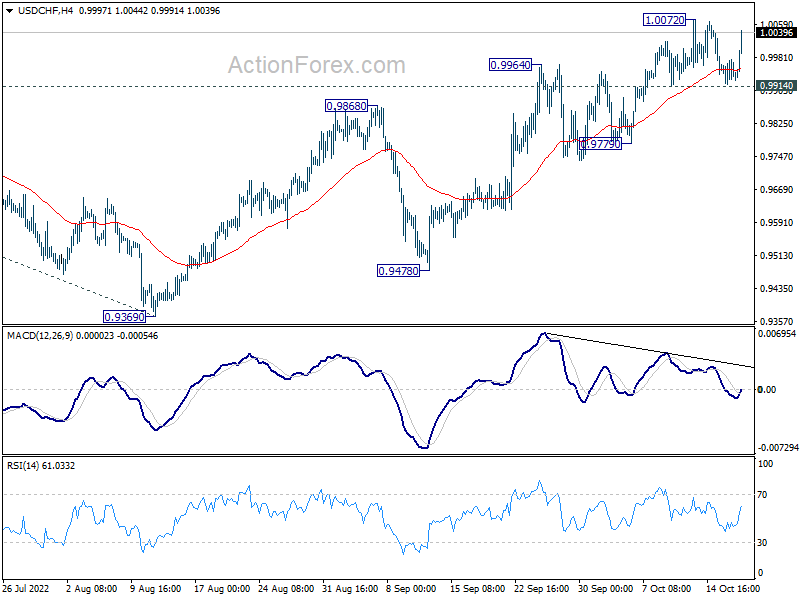
USD/CHF rebounds notably today but stays below 1.0072 resistance. Intraday bias remains neutral first. Further rise is still mildly in favor. On the upside, break of 1.0072, and sustained trading above 1.0063, will confirm larger up trend resumption. Next target is 1.0283 projection level. However, break of 0.9914 support will indicate rejection by 1.0063, and turn bias back to the downside for 0.9779 support first.
In the bigger picture, current development suggests that up trend from 0.8756 (2021 low) is still in progress. Sustained break of 1.0063 will target 100% projection of 0.9149 to 1.0063 from 0.9369 at 1.0283, and then 1.0342 (2016 high). For now, this will remain the favored case as long as 0.9369 support holds, even in case of deep pull back.
Canada: Cooler Headline Inflation Belies Hotter Core Reading in September
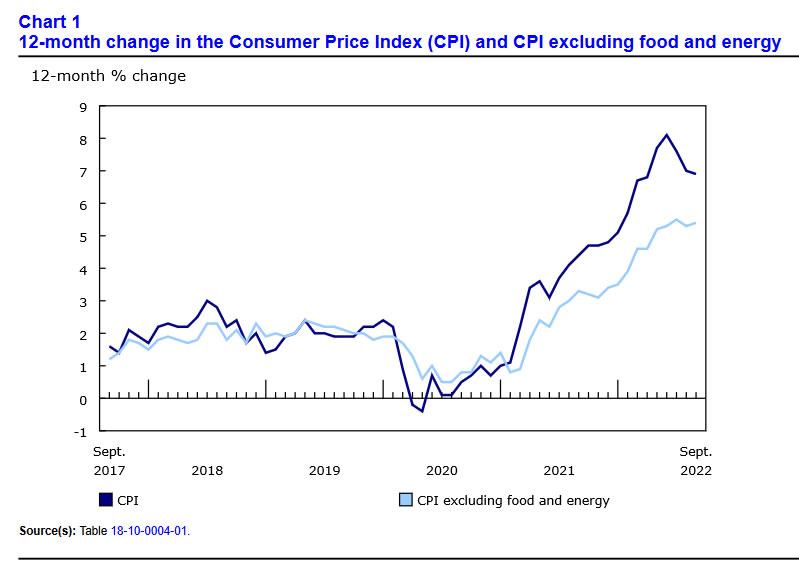
Consumer price inflation took another small step in the right direction in September, easing to 6.9% year-on-year (y/y), down from 7.0% in August.
Lower gasoline prices were mainly responsible for the cooling in headline inflation. Consumers got some relief at the pump, with prices down 7.4% in September, and are now up 13.2% y/y.
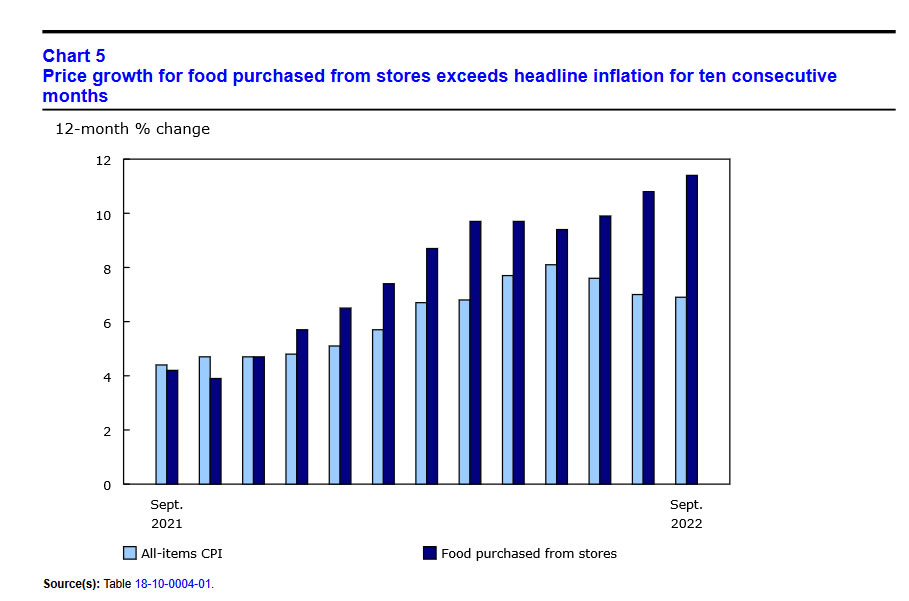
Unfortunately, there is no relief at the grocery store. Food purchased from stores cost 11.4% more than a year ago, up from August's 10.8% y/y pace – the fastest pace since 1981.
Core inflation was also a little hot under the collar. CPI ex-food and energy ticked up to a 5.4% y/y pace in September, from 5.3% y/y in August. Shelter inflation, which carries a heavy weight in the CPI was up 6.8% y/y in September, two ticks higher than August's pace. Within shelter, the uptick was driven by higher mortgage interest costs (+8.3% y/y) outweighed the deceleration in homeowner's replacement cost (+7.7% y/y) and other owned accommodation expenses (+5.8%).
Durable goods inflation heated up again in September (+6.7% y/y) from a 6% y/y pace in August. Vehicle prices were up 8.4% y/y, and furniture was up 13.3% y/y, both faster than August's pace.
The Bank of Canada's core inflation metrics were unchanged from August. CPI-trim held steady at 5.2% y/y, CPI-common was 6.0% y/y, and CPI-median was 4.7%. The average of the three core measures was 5.3% y/y in September.
Key Implications
It is great that headline inflation took a small step in the right direction in September, but underlying inflation pressures in core measures showed no signs of cooling down. The BoC has hiked interest rates 300 basis points so far this year, and the impact of that is starting to be felt in the economy, from housing to consumer spending. But, with the Bank of Canada's (BoC) core measures of inflation more than 2 percentage points from the target range of 1-3%, more cooling in demand is required.
Today's report emphasizes the need for a hefty 50 basis point hike next week in the BoC's overnight rate. We expect the bank is getting closer to a pause on rate hikes, once it reaches 4% by the end of the year.
USD/JPY Mid-Day Outlook
Daily Pivots: (S1) 148.80; (P) 149.09; (R1) 149.52; More...
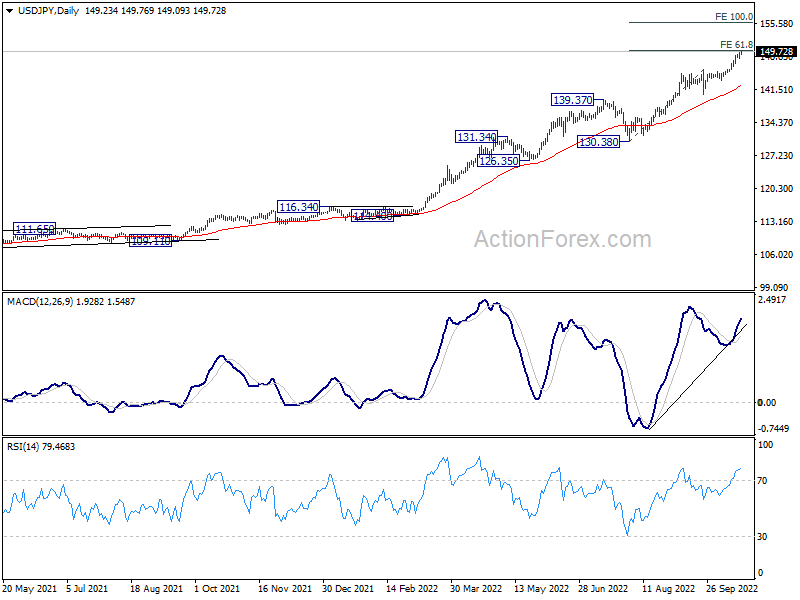
USD/JPY's rally continues today and intraday bias stays on the upside for 61.8% projection of 130.38 to 140.33 from 145.89 at 149.91. There Japan might intervene again to defend 150 psychological level. On the downside, break of 148.11 minor support will turn bias to the downside for pull back towards 145.89 resistance turned support. However, sustained trading above 150 could pave the way to 100% projection at 155.84 next.
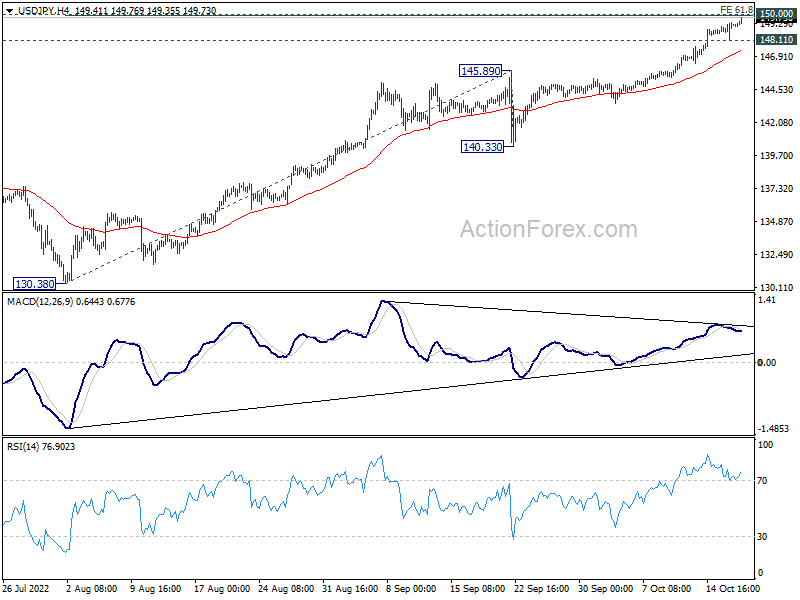
In the bigger picture, up trend from 101.18 is still in progress, as part of the whole up trend from 75.56 (2011 low). 147.68 (1998 high) was already met and there is not clearly sign of topping yet. In any case, break of 139.37 resistance turned support is needed to be the first sign of medium term topping. Otherwise, further rise is in favor to next target at 160.16 (1990 high).
USD/JPY Marching to 150 as Dollar Rises With Yields
Dollar rises broadly today, with help from bonds as 10-year yield tops 4.1% in pre-market. Canadian Dollar is also slightly firmer after CPI report. Other parts of the markets are mixed. Yen is dropping towards 150 with Dollar, but recovers elsewhere. Swiss Franc is weakening against both Euro and Sterling but loss is limited. Aussie and Kiwi turned softer as this week's recovery lost steam.
Technically, one focus is on Japan's intervention as USD/JPY approaches 150 handle, and on whether Dollar bears would finally jump in (which is unlikely). On the other hand, another focus in on USD/CHF's reaction to 1.0072 temporary top. Decisive break there will confirm up trend resumption, which could be a early signal of more Dollar buying elsewhere.
In Europe, at the time of writing, FTSE is down -0.26%. DAX is down -0.21%. CAC is down -0.02%. Germany 10-year yield is up 0.0597 at 2.353. Earlier in Asia, Nikkei rose 0.37%. Hong Kong HSI dropped -2.38%. China Shanghai SSE dropped -1.19%. Singapore Strait Times dropped -0.10%. Japan 10-year JGB yield dropped -0.0051 to 0.254.
Canada CPI ticked down to 6.9% yoy in Sep, food inflation rose to 11.4% yoy
Canada CPI slowed from 7.0% yoy to 6.9% yoy in September, slightly above expectation of 6.8% yoy. Food prices inflation rose to 11.4% yoy, the fastest rate since 1981's 11.9% yoy. Also, prices for food purchases from stores have been increasing at a faster rate than all-items CPI for 10 consecutive months. Excluding food and energy, CPI accelerated from 5.3% yoy to 5.4% yoy.
CPI median dipped from 4.8% yoy to 4.7% yoy, versus expectation of 4.8% yoy. CPI trimmed was unchanged at 5.2% yoy, above expectation of of 5.1% yoy. CPI common accelerated from 5.7% yoy to 6.0% yoy, above expectation of 5.6% yoy.
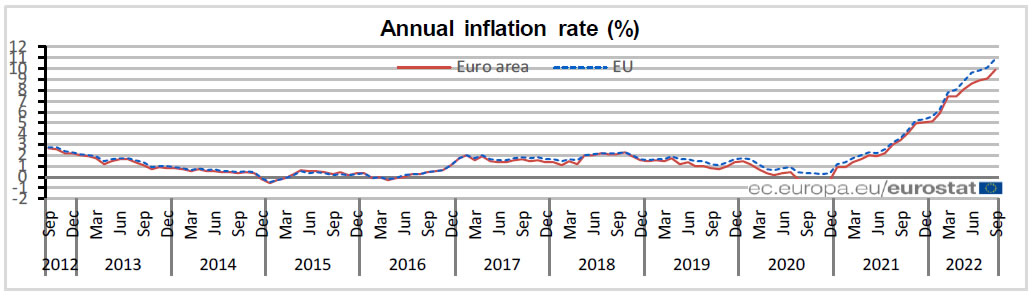
Eurozone CPI finalized at 9.9% yoy in Sep, core at 4.8% yoy
Eurozone CPI was finalized at 9.9% yoy in September, up from August's 9.1% yoy, but revised down from flash reading of 10.0% yoy. CPI core (all items excluding energy, food, alcohol & tobacco) was finalized at 4.8% yoy, up from August's 4.3% yoy
The highest contribution to the annual Eurozone inflation rate came from energy (+4.19%), followed by food, alcohol & tobacco (+2.47%), services (+1.80%) and non-energy industrial goods (+1.47%).
EU CPI was finalized at 10.9% yoy, up from August's 10.1% yoy. The lowest annual rates were registered in France (6.2%), Malta (7.4%) and Finland (8.4%). The highest annual rates were recorded in Estonia (24.1%), Lithuania (22.5%) and Latvia (22.0%). Compared with August, annual inflation fell in six Member States, remained stable in one and rose in twenty.
UK CPI rose to 10.1% yoy in Sep, Food prices up 14.6% yoy
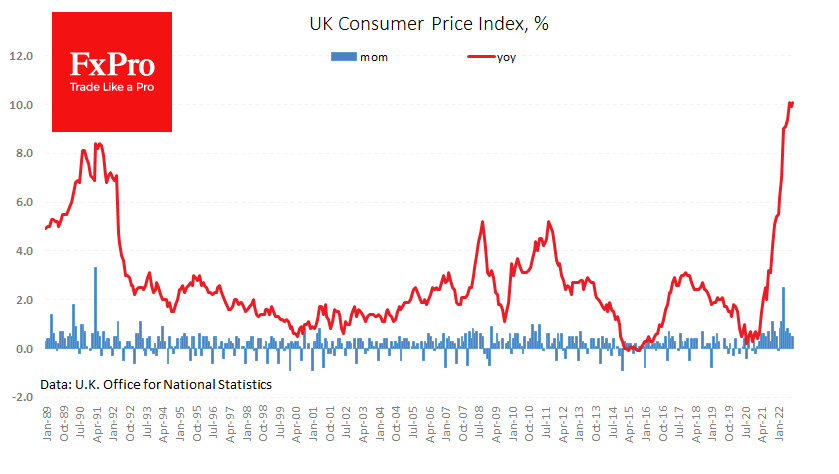
UK CPI rose 0.5% mom in September, above expectation of 0.4% mom. In the 12 months to September, CPI accelerated from 9.9% yoy to 10.1% yoy, above expectation of 10.0% yoy. That's the highest level since around 1982 based on modelled estimates. CPI core also rose from 6.3% yoy to 6.5% yoy, above expectation of 6.4% yoy.
ONS said: "Rising food prices made the largest upward contribution to the change in both the CPIH and CPI annual inflation rates between August and September 2022. The continued fall in the price of motor fuels made the largest, partially offsetting, downward contribution to the change in the rates."
Food and non-alcoholic beverage prices accelerated from 13.1% yoy to 14.6% yoy. After 14 consecutive months of acceleration, current rate is estimated to be the highest since 1980.
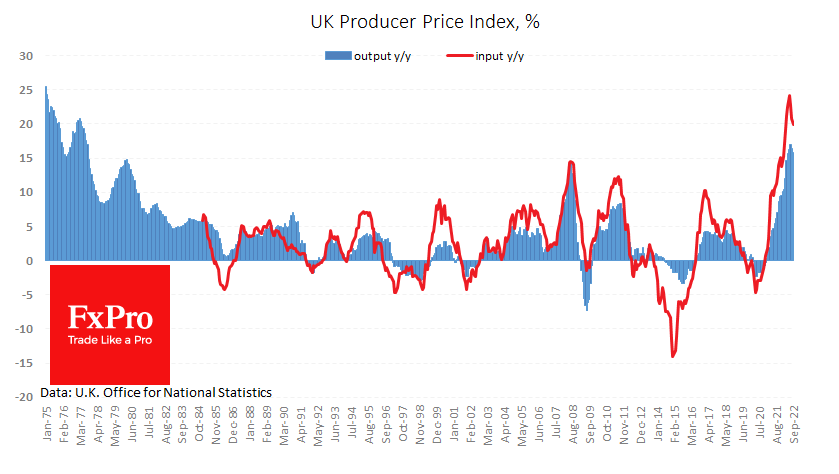
Also released, RPI came in at 0.7% mom, 12.6% yoy versus expectation of 0.5% mom, 12.4% yoy. PPI input was at 0.4% mom, 20.0% yoy. PPI output was at 0.2% mom, 15.9% yoy. PPI output core was at 0.7% mom, 14.0% yoy.
BoJ Kuroda: Recent depreciation of Yen was sharp and one-sided
BoJ Governor Haruhiko Kuroda told a parliamentary committee that recent depreciation of Yen was sharp and one-sided "This kind of yen weakening makes it difficult for companies to set their business plans and raises uncertainties in their outlook," he said. "This is negative for our economy and not desirable."
Separately, board member Seiji Adachi said, "When looking at the global financial and economic environment surrounding Japan, downside risks are building up rapidly... When downside risks are so high, we should be cautious of shifting toward monetary tightening."
Australia Westpac leading index points to material loss in momentum heading into 2023
Australia Westpac leading index six-month annualized growth rate declined from -0.33% to -1.15% in September. It's now at the weakest level since the pandemic first hit in 2020, and prior to that, since early 2016. The index continued to point to a "material loss in momentum to a below-trend growth pace heading into 2023."
Westpac added that the signal in broadly in line with forecast that economic growth will slow from 3.4% in 2022 to 1.0% in 2023, with sharp slowdown in consumer spending. It said, "that slowdown is likely to intensify through 2023 as rising interest rates and a softening labour market take their toll."
On RBA policy, Westpac pointed to minutes of October meeting, which noted, "drawing out policy adjustments would also help to keep public attention focused for a longer period on the Board's resolve to return inflation to target." The thinking was in line with Westpac's forecast that RBA will have a series of 25bps rate hikes in the future months of November, December, February, and March.
USD/JPY Mid-Day Outlook
Daily Pivots: (S1) 148.80; (P) 149.09; (R1) 149.52; More...
USD/JPY's rally continues today and intraday bias stays on the upside for 61.8% projection of 130.38 to 140.33 from 145.89 at 149.91. There Japan might intervene again to defend 150 psychological level. On the downside, break of 148.11 minor support will turn bias to the downside for pull back towards 145.89 resistance turned support. However, sustained trading above 150 could pave the way to 100% projection at 155.84 next.
In the bigger picture, up trend from 101.18 is still in progress, as part of the whole up trend from 75.56 (2011 low). 147.68 (1998 high) was already met and there is not clearly sign of topping yet. In any case, break of 139.37 resistance turned support is needed to be the first sign of medium term topping. Otherwise, further rise is in favor to next target at 160.16 (1990 high).
Economic Indicators Update
| GMT | Ccy | Events | Actual | Forecast | Previous | Revised |
|---|---|---|---|---|---|---|
| 23:30 | AUD | Westpac Leading Index M/M Sep | 0.00% | -0.10% | -0.20% | |
| 06:00 | GBP | CPI M/M Sep | 0.50% | 0.40% | 0.50% | |
| 06:00 | GBP | CPI Y/Y Sep | 10.10% | 10.00% | 9.90% | |
| 06:00 | GBP | Core CPI Y/Y Sep | 6.50% | 6.40% | 6.30% | |
| 06:00 | GBP | RPI M/M Sep | 0.70% | 0.50% | 0.60% | |
| 06:00 | GBP | RPI Y/Y Sep | 12.60% | 12.40% | 12.30% | |
| 06:00 | GBP | PPI Input M/M Sep | 0.40% | -0.40% | -1.20% | -0.90% |
| 06:00 | GBP | PPI Input Y/Y Sep | 20.00% | 17.20% | 20.50% | 20.90% |
| 06:00 | GBP | PPI Output M/M Sep | 0.20% | 0.60% | -0.10% | 0.10% |
| 06:00 | GBP | PPI Output Y/Y Sep | 15.90% | 15.00% | 16.10% | 16.40% |
| 06:00 | GBP | PPI Core Output M/M Sep | 0.70% | 0.90% | 0.30% | 0.50% |
| 06:00 | GBP | PPI Core Output Y/Y Sep | 14.00% | 12.70% | 13.70% | 13.90% |
| 09:00 | EUR | Eurozone CPI M/M Sep F | 9.90% | 10.00% | 10.00% | |
| 09:00 | EUR | Eurozone CPI Core Y/Y Sep F | 4.80% | 4.80% | 4.80% | |
| 12:30 | USD | Building Permits Sep | 1.56M | 1.55M | 1.54M | |
| 12:30 | USD | Housing Starts Sep | 1.44M | 1.46M | 1.58M | |
| 12:30 | CAD | Raw Material Price Index Sep | -3.20% | -3.50% | -4.20% | |
| 12:30 | CAD | Industrial Product Price M/M Sep | 0.10% | -0.90% | -1.20% | |
| 12:30 | CAD | CPI M/M Sep | 0.10% | -0.10% | -0.30% | |
| 12:30 | CAD | CPI Y/Y Sep | 6.90% | 6.80% | 7.00% | |
| 12:30 | CAD | CPI Median Y/Y Sep | 4.70% | 4.80% | 4.80% | |
| 12:30 | CAD | CPI Trimmed Y/Y Sep | 5.20% | 5.10% | 5.20% | |
| 12:30 | CAD | CPI Common Y/Y Sep | 6.00% | 5.60% | 5.70% | |
| 14:30 | USD | Crude Oil Inventories | 2.5M | 9.9M | ||
| 18:00 | USD | Fed's Beige Book |
Canada CPI ticked down to 6.9% yoy in Sep, food inflation rose to 11.4% yoy
Canada CPI slowed from 7.0% yoy to 6.9% yoy in September, slightly above expectation of 6.8% yoy. Food prices inflation rose to 11.4% yoy, the fastest rate since 1981's 11.9% yoy. Also, prices for food purchases from stores have been increasing at a faster rate than all-items CPI for 10 consecutive months. Excluding food and energy, CPI accelerated from 5.3% yoy to 5.4% yoy.
CPI median dipped from 4.8% yoy to 4.7% yoy, versus expectation of 4.8% yoy. CPI trimmed was unchanged at 5.2% yoy, above expectation of of 5.1% yoy. CPI common accelerated from 5.7% yoy to 6.0% yoy, above expectation of 5.6% yoy.
UK’s Inflation Sluggish Slowdown
The portion of the UK inflation data showed that the problem is in no hurry to recede. The consumer price index returned to 10.1% y/y, changing hopes that the trend had already reversed. The retail price index is climbing further upwards, reaching 12.6%. The contribution of food to inflation has already exceeded the impact of transport costs.
Excluding these volatile components, the acceleration continues, with the core CPI rising to 6.5% compared to 6.3% the previous month. UK’s Retail Price Index at 12.6% y/y was last seen in March 1981. However, producer prices signal an easing of inflationary pressures, albeit not as quickly as previously hoped.
Input PPI has slowed to 20% from 20.9% a month earlier and peaked at 24.2% in June. Output PPI inflation slowed to 15.9% after peaking at 17% in July. The persistent downward trend in exchange prices for agricultural and energy products has reinforced disinflationary trends all these months.
The higher inflation trajectory is creating pressure on the Bank of England to take even more steps to raise rates. The Bank of England’s recent statements about its willingness to move to quantitative tightening from November and its reluctance to stretch out its emergency government bond-buying programme show that the central bank is indeed concerned about inflationary pressures.
Pound Falls as Inflation Rises
GBP/USD is in negative territory today. In the European session, the pound is trading at 1.1261, down 0.48%.
Inflation rises to double-digits
UK inflation rose to 10.1% in September, up from 9.9% in August and above the consensus of 10.0%. It was a similar story from Core CPI, which edged up to 6.5%, up from 6.4% and higher than the forecast of 6.3%. A return to double-digit inflation is certainly not something the Bank of England wanted to see. Inflation is not showing any signs of peaking, which leaves no doubt that the BoE will have to continue to raise interest rates.
The cash rate remains relatively low at 2.25% in comparison with the Federal Reserve (3.25%) and other major central banks. The cash rate will likely hit 4% or even higher by mid-2023, which means some oversize rate hikes are on the way. The BoE meets next on November 3rd and policy makers will need to deliver a hike of 0.75% or a full point in order to maintain credibility. The recent political maelstrom, in which Chancellor Hunt has abolished most of the planned tax cuts and signalled spending cuts instead, means that the BoE may not have to act as aggressively as anticipated just a few weeks ago.
A key point in the fiscal U-turn provided by Hunt is the energy cap plan. The cap, which was supposed to remain in place for two years, has been scaled down to just six months. Higher energy bills for households will mean higher inflation unless energy falls substantially in the winter.
The economic outlook for the UK does not look all that bright, which will likely be reflected in a weaker British pound. Goldman Sachs has downgraded its UK growth outlook, with the economy expected to decline by 1% in 2023, worse than the previous estimate of -0.4%.
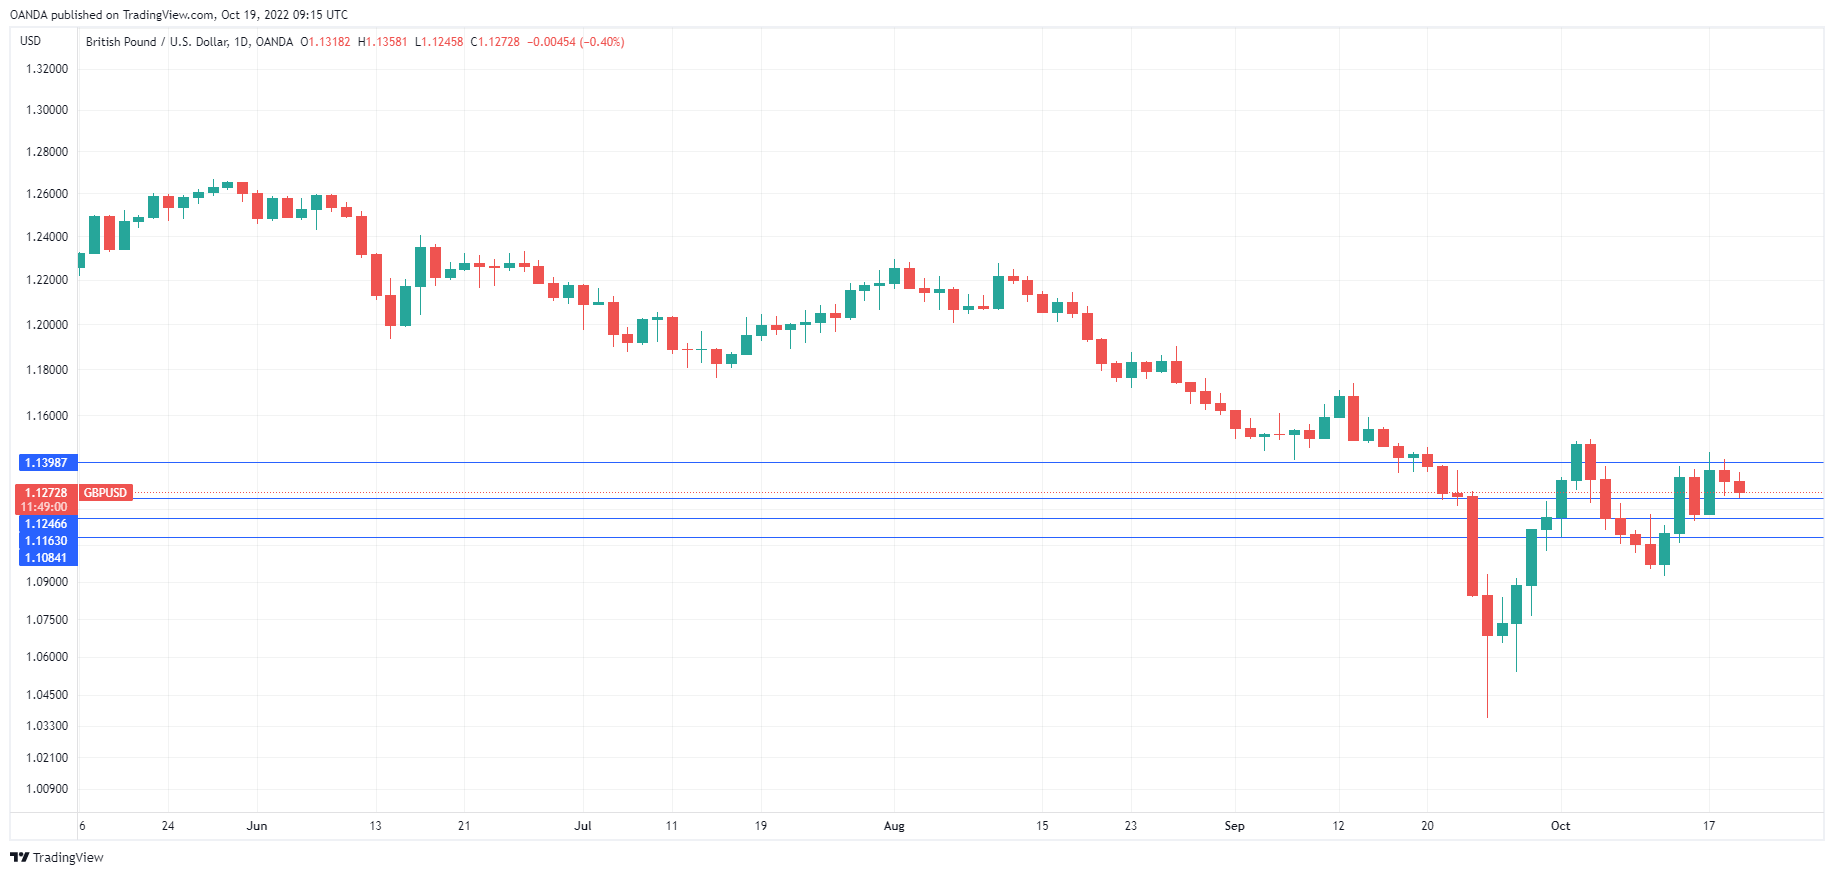
GBP/USD Technical
- GBP/USD faces resistance at 1.1373 and 1.1455
- There is support at 1.1214 and 1.1085
Eurozone CPI finalized at 9.9% yoy in Sep, core at 4.8% yoy
Eurozone CPI was finalized at 9.9% yoy in September, up from August's 9.1% yoy, but revised down from flash reading of 10.0% yoy. CPI core (all items excluding energy, food, alcohol & tobacco) was finalized at 4.8% yoy, up from August's 4.3% yoy
The highest contribution to the annual Eurozone inflation rate came from energy (+4.19%), followed by food, alcohol & tobacco (+2.47%), services (+1.80%) and non-energy industrial goods (+1.47%).
EU CPI was finalized at 10.9% yoy, up from August's 10.1% yoy. The lowest annual rates were registered in France (6.2%), Malta (7.4%) and Finland (8.4%). The highest annual rates were recorded in Estonia (24.1%), Lithuania (22.5%) and Latvia (22.0%). Compared with August, annual inflation fell in six Member States, remained stable in one and rose in twenty.
USDJPY Aims for 150; Overbought Signals Strong
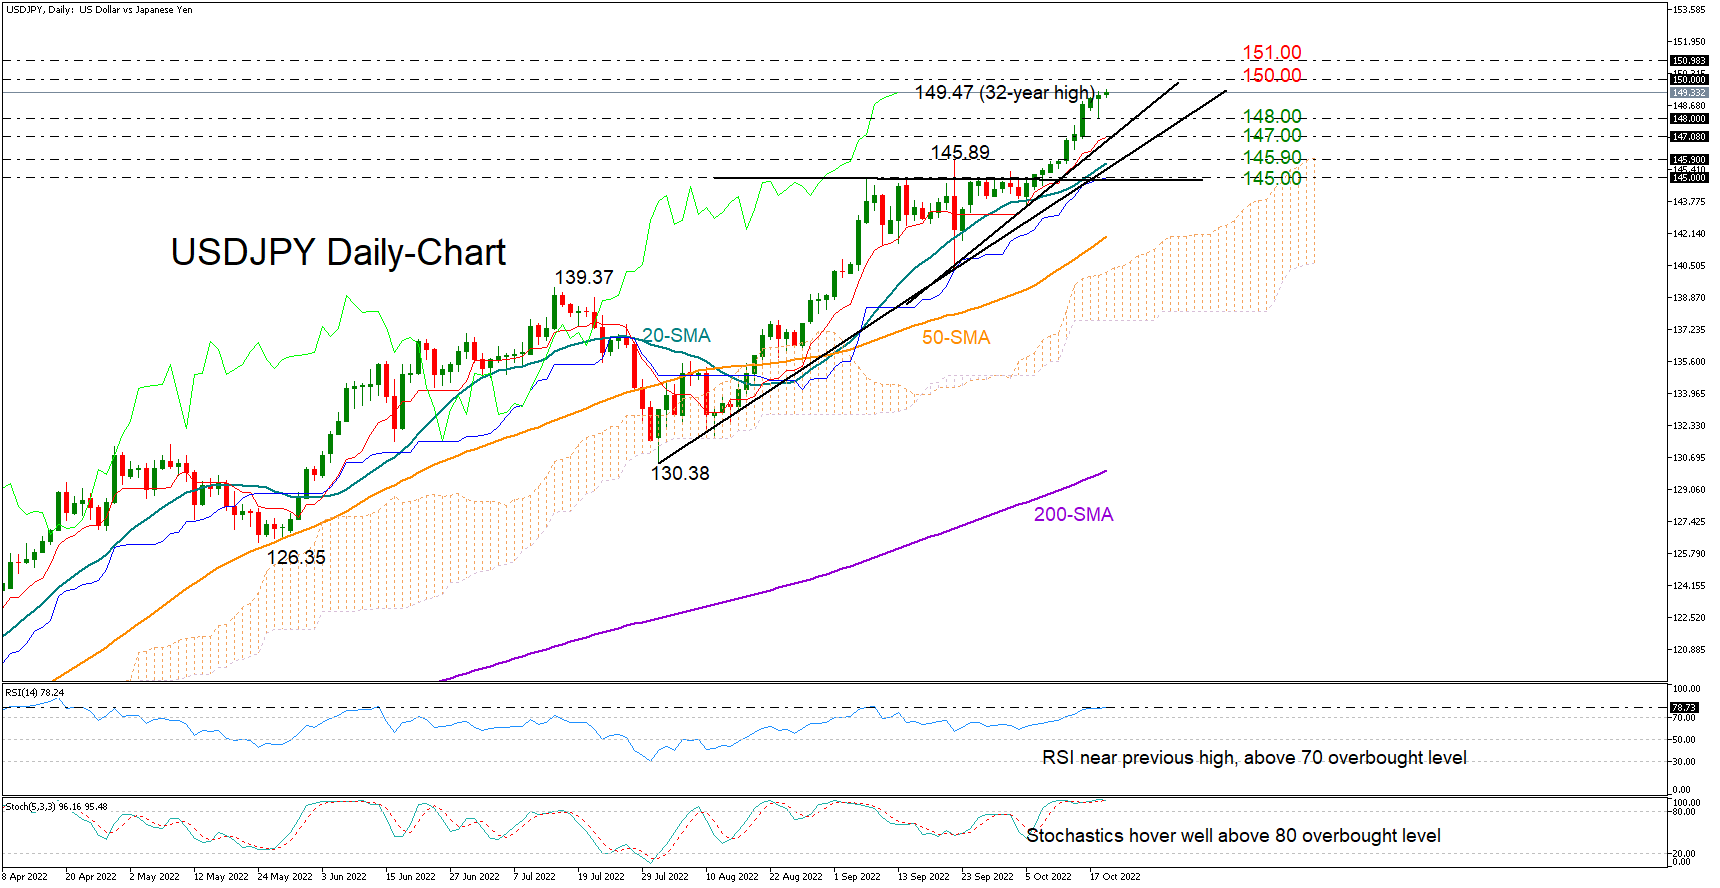
USDJPY has trimmed its bullish momentum since the spike above the 1998 top of 147.71, gradually moving northwards within the 149.00 area – the highest since 1990.
The pair is in its tenth week of gains well above the Ichimoku cloud, increasing speculation that the bull run is probably nearing a peak. The RSI is flirting with its previous high in the overbought area, while the stochastics are also comfortably above their 80 overbought level, backing that narrative too.
If the 150.00 psychological mark proves easy to break, the pair could chart a new higher high within the 151.00 – 152.00 territory last seen in August 1990. Should the bulls persist, the next obstacle could pop up around 153.30.
In the event upside pressures falter, with the price pulling below 148.00, the focus will immediately return to the tentative ascending trendline currently around 147.00. A step lower could meet the 20-day simple moving average (SMA) and a longer-term tentative ascending trendline near 145.90. Yet, traders may pay greater attention to the 145.00 region for any aggressive declines that may press the price towards the 50-day SMA.
All in all, USDJPY is looking cautiously bullish in the short-term picture as the technical picture signals overbought conditions. A close above 150.00 could see another extension higher, whilst a move below 148.00 could activate profit-taking orders.