

Sample Category Title
USD/JPY Breaches 150
USD/JPY continues to gain ground
USD/JPY is almost unchanged today but hit a milestone in the Asian session as it briefly darted above the 150 line, which has psychological significance. This marked the yen’s lowest level since August 1990 as the currency continues to slide. The yen hasn’t recorded a winning session since October 4th and has plunged about 600 points during this period. Later today, Japan releases Core CPI for September, which is expected to rise to 3.0%, up from 2.8% in August.
The Bank of Japan holds its policy meeting next week, but it seems unlikely that it will change its ultra-loose policy. The yen is sinking and inflation is above the Bank’s 2% target, but the central bank is fixated on continuing to provide massive stimulus in order to support the weak economy. Earlier today, Japan’s 10-year government bonds breached the 0.25% cap which the BoJ has fiercely defended, rising as high as 0.264%. The BoJ has responded with an emergency bond-buying package in order to bring yields back below 0.25%.
With the BoJ defending its policy and ignoring the yen’s descent, the ball is in the court of the Ministry of Finance (MoF). The MoF dramatically intervened in late September to prop up the yen after it fell below 145, but the move did little more than slow the yen’s descent for a few days. Another intervention is possible, but it would have to be on a larger scale to have any substantial effect on the exchange rate. Finance Minister Suzuki has warned that the government would “properly respond” in the currency markets, but increasingly, the verbal bullets out of Tokyo are being viewed as blanks. With the Federal Reserve showing no signs of easing up on oversize rate hikes, the yen remains at the mercy of the US/Japan rate differential, which continues to widen. The yen’s prolonged downturn looks set to continue, with the currency likely to hit new lows.
USD/JPY Technical
- USD/JPY is testing support at 149.81. Below, there is support at 149.09
- There is resistance at 150.04 and 151.32
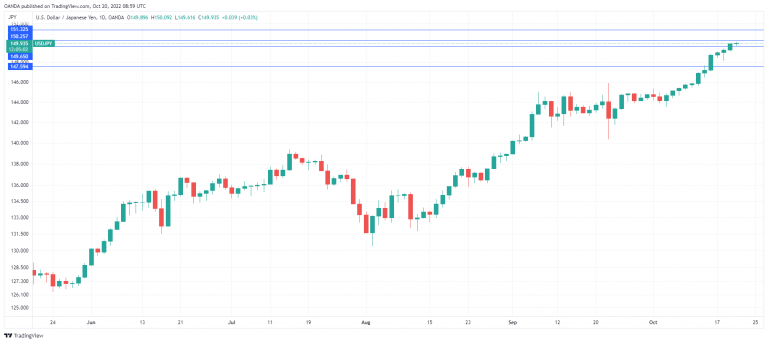
USD/JPY: High Possibility of Japanese Government Intervening in FX Market
High possibility of Japanese government intervening in FX market as the JPY value hits its lowest level since 1990
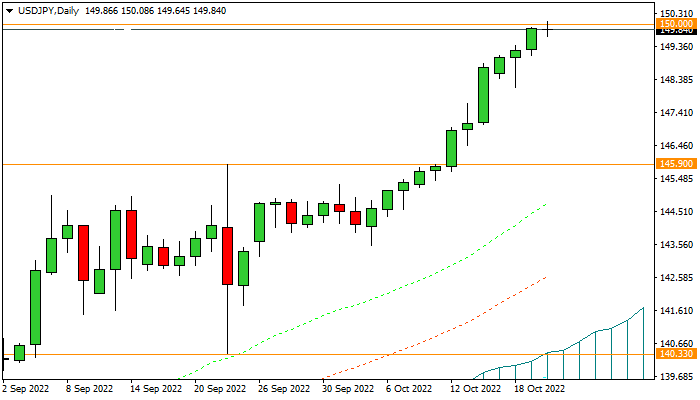
Despite the intervention of the Central Bank of Japan in the FX market last month to control the value of the Japanese yen, the price has returned to the bullish trend after a short-term correction and has now exceeded the previous peak and reached the major resistance range of $150, which is the lowest value of USDJPY since 1990. According to the statements of Kuroda (Governor of the Bank of Japan), regarding keeping a close eye on FX market moves, forecasts show that there is a possibility of the Japanese government’s intervention to control the value of the Yen and reduce the yield rate of bonds.
In this case, the possibility of a downward corrective trend of USDJPY in the current range will be strengthened. However, considering Japan’s monetary policy divergence from the US Federal Reserve, any intervention by the BOJ will probably have short-term results.
Technically, the value of the Japanese Yen against the USD has decreased by more than 47% in the last two years, the upward slope of the USDJPY price has increased in recent weeks, and the possibility of a short-term downward corrective trend has been strengthened. However, in the mid-term, the first possibility is continuing the bullish trend.
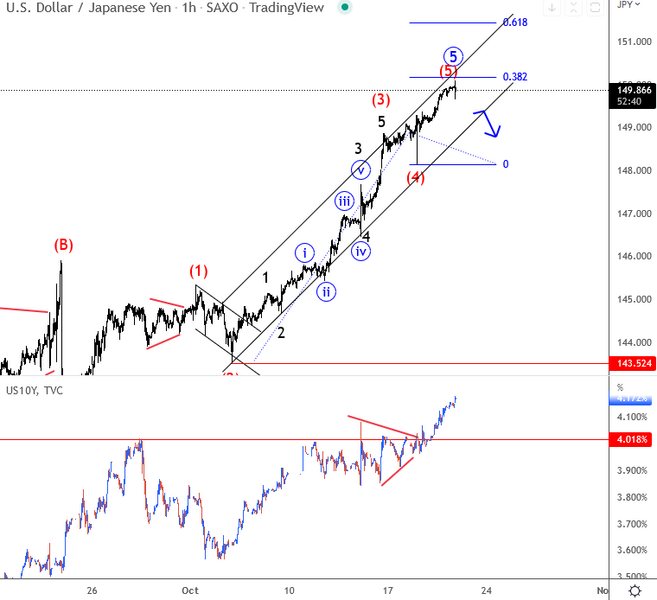
USD/JPY Hits Big 150 Level as US Yields Continue to Rise
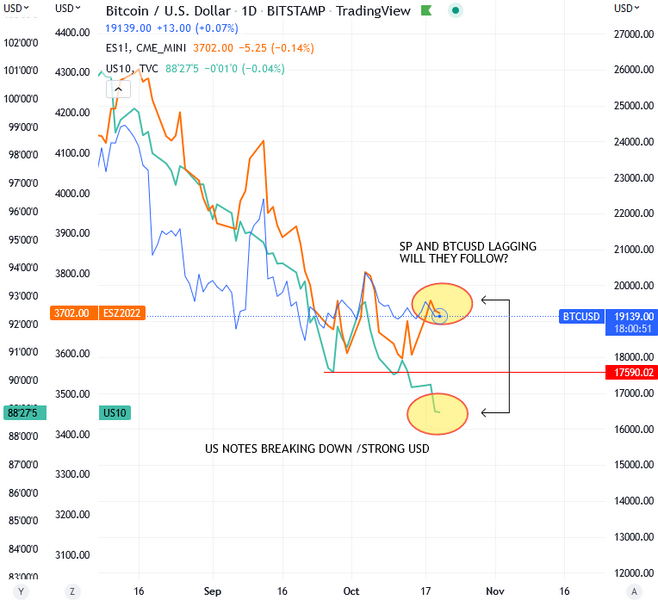
Stocks found some resistance in the last few sessions as US yields keep moving higher. However, the notice that yields are coming out of a triangle so it can be a final leg up in a higher degree sequence. If that's the case then resistance on yields is coming. USDJPY also has five waves up into 150 level, so watch USDJPY trendline near 149 that must be broken for a weakness. If Yields will continue to rise, then USDJPY will most likely do the same, and then SP and even bitcoin can fall. They are lagging a bit. However, shorting JPY here is a bit danagerous as BoJ may interven any second; the question is if maybe alone, or will other CB join which should then have much greater impact.
AUDUSD Vulnerable Near 30-month Lows
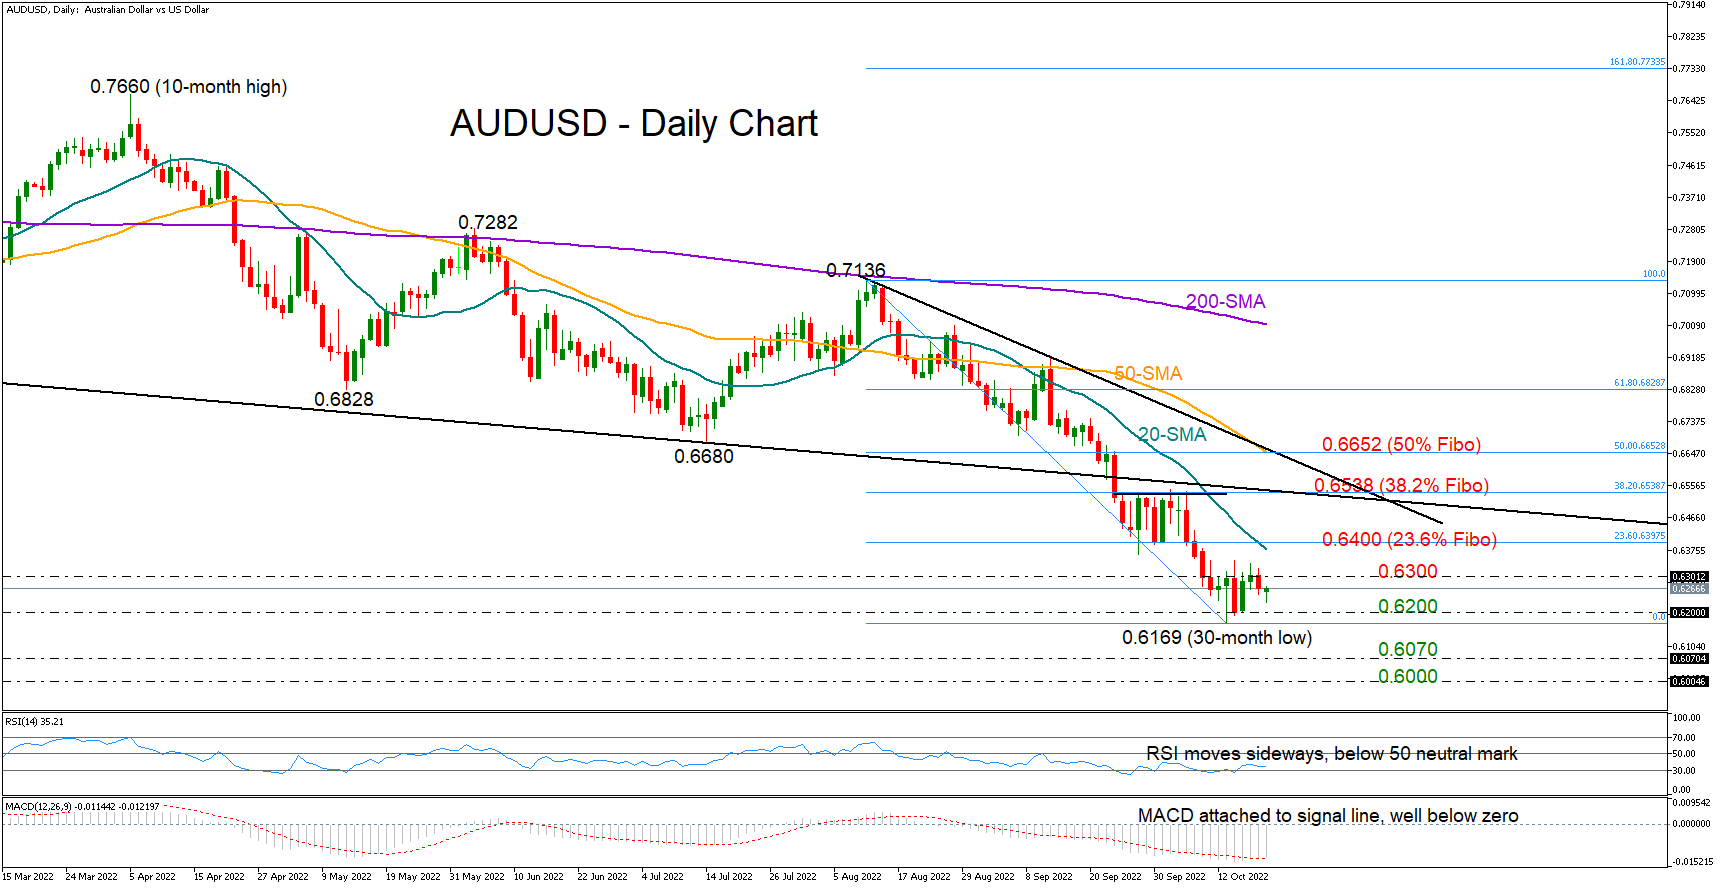
AUDUSD could not successfully exit the consolidation area of 0.6200-0.6300 despite starting the week on a positive note, with the price remaining exposed to its 30-month low of 0.6169.
The RSI is lacking direction below its 50 neutral mark, while the MACD is attached to its red signal line within the bearish area, both endorsing the short-term neutral trajectory in the price.
A close above the 20-day simple moving average (SMA) and the 23.6% Fibonacci retracement of the 0.7136-0.6169 downleg at 0.6400 could produce a quick upside move to 0.6538. The 38.2% Fibonacci and a former support line drawn from August 2021 are also in this neighborhood. Therefore, a violation at this point could add more fuel to the rally, likely bringing the 50% Fibonacci of 0.6652 and the 50-day MA next into view.
Should selling pressures drive the price below 0.6200, support could initially commence somewhere between 0.6070 and 0.6000. Falling lower, the pair may attempt to set a foothold around 0.5860 like it did at the start of 2003.
In short, AUDUSD is in a wait-and-see mode at the bottom of a downtrend. A sustainable move above the 20-day SMA or below the 0.6200 base could direct the market accordingly.
WTI Oil Futures Drift Higher, Crucial Barriers on Sight
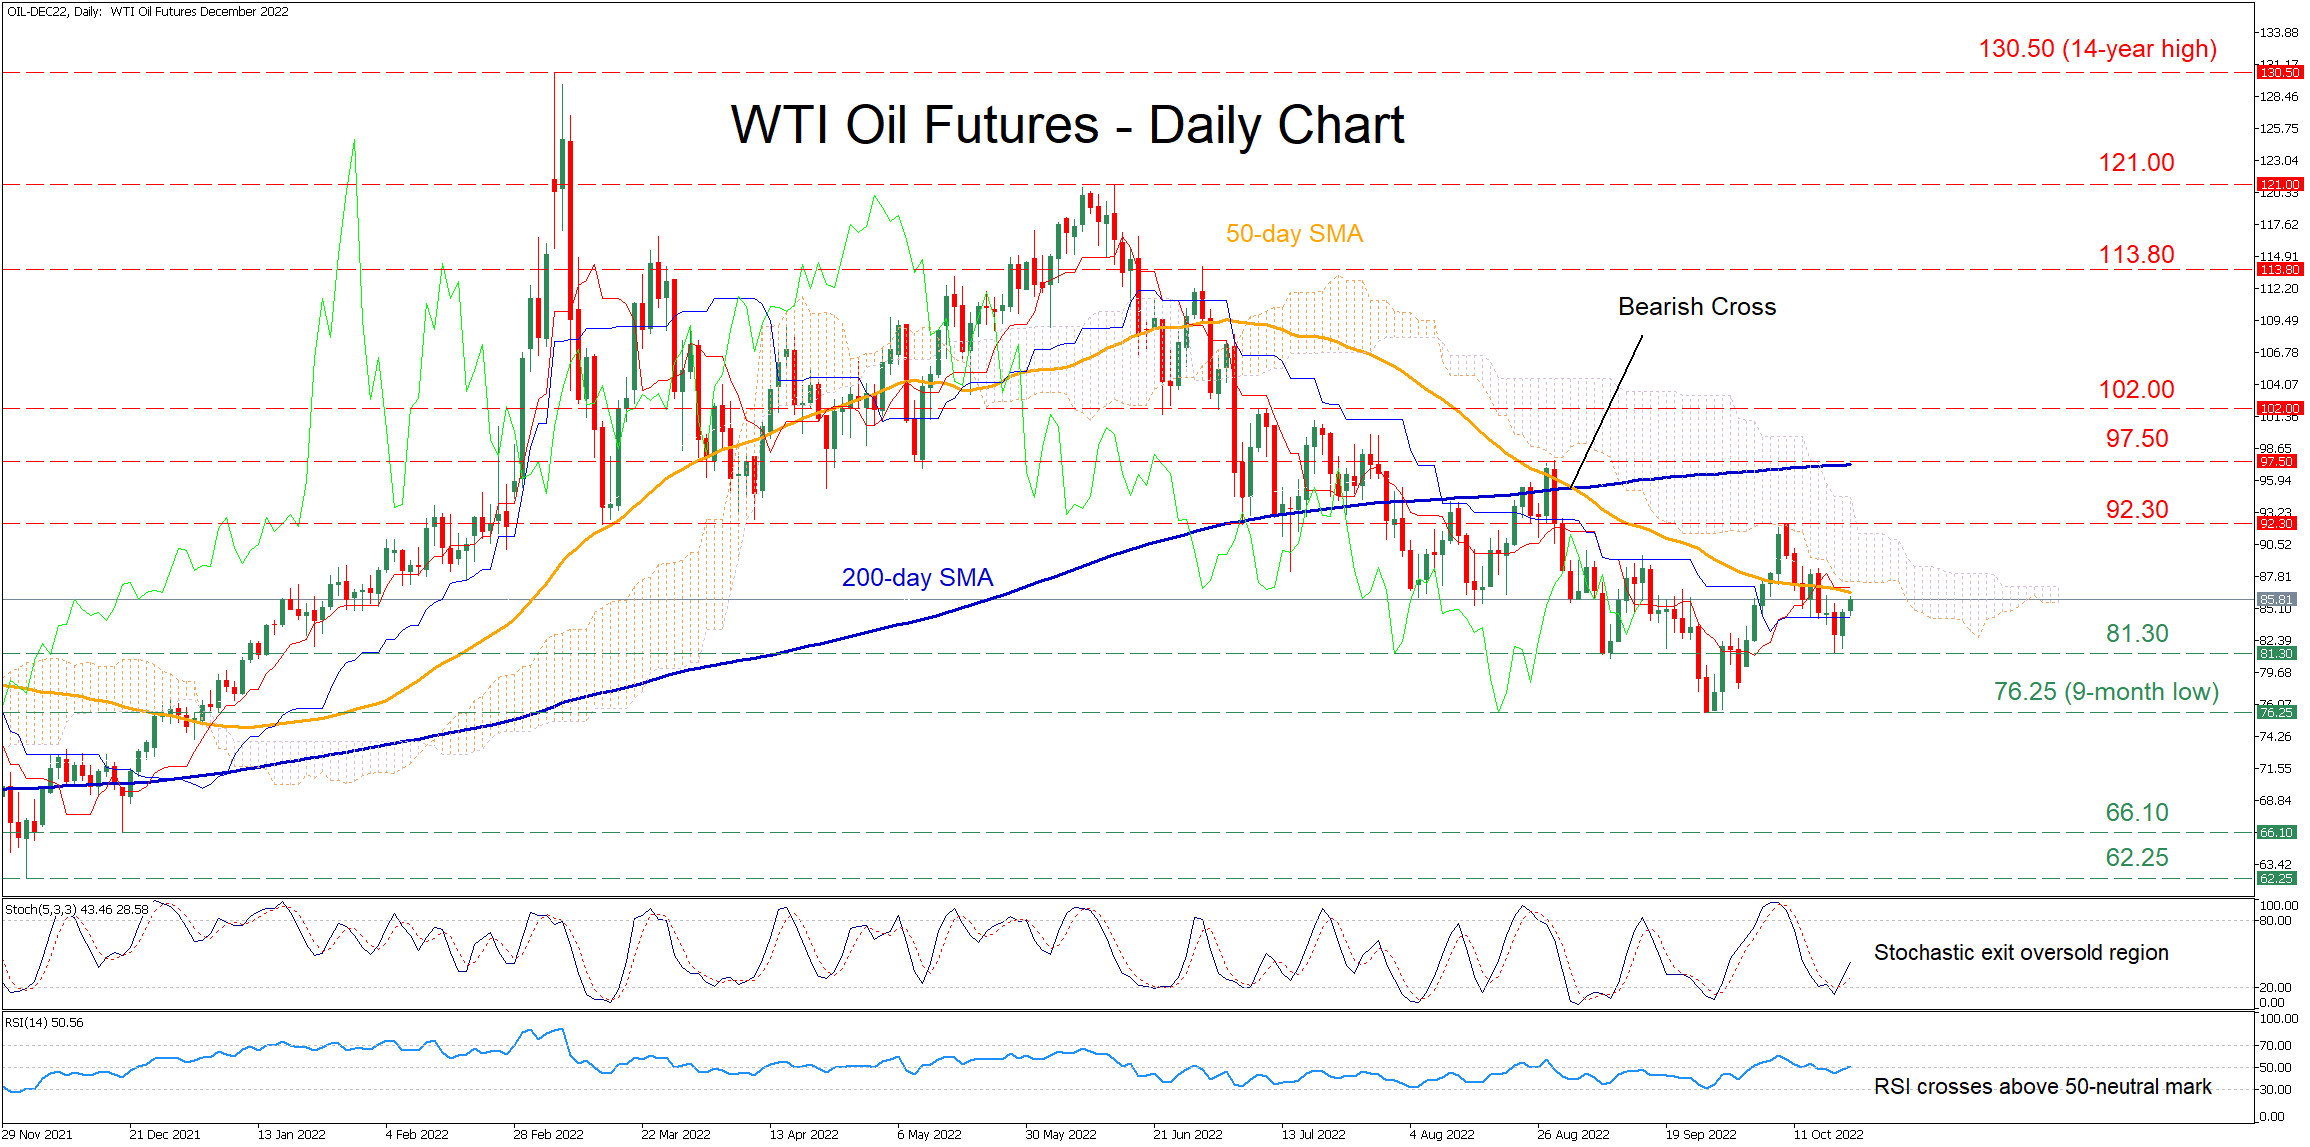
WTI oil futures (December delivery) have been experiencing a prolonged decline since mid-June, while their two latest rebounds fell short at the lower boundary of the Ichimoku cloud. However, the commodity seems to be gaining some ground after encountering strong support at 81.30, with the price now aiming for the 50-day simple moving average (SMA).
The momentum indicators currently suggest that the bullish forces are strengthening. Specifically, the stochastic oscillator is ascending after rebounding from the 20-oversold zone, while the RSI has jumped above its 50-neutral mark.
Should buying pressures intensify, the price could ascend towards the recent rejection point of 92.30. Conquering this barricade, the bulls might aim for the August peak of 97.50, which overlaps with the 200-day SMA. A break above the latter could open the door for the 102.00 ceiling.
To the downside, if the positive momentum wanes and the price retreats again, initial declines could cease at the recent support region of 81.30. Dipping beneath that zone, the spotlight could turn to the nine-month low of 76.25. Even lower, the December low of 66.10 may provide further downside protection.
Overall, WTI oil futures are attempting a recovery in the last couple of daily sessions as positive momentum appears to be intensifying. For those efforts to materialize, the price needs to initially jump above the congested region that includes the 50-day SMA and the lower boundary of the Ichimoku cloud.
XAU/USD: The Bullish Trend Continues
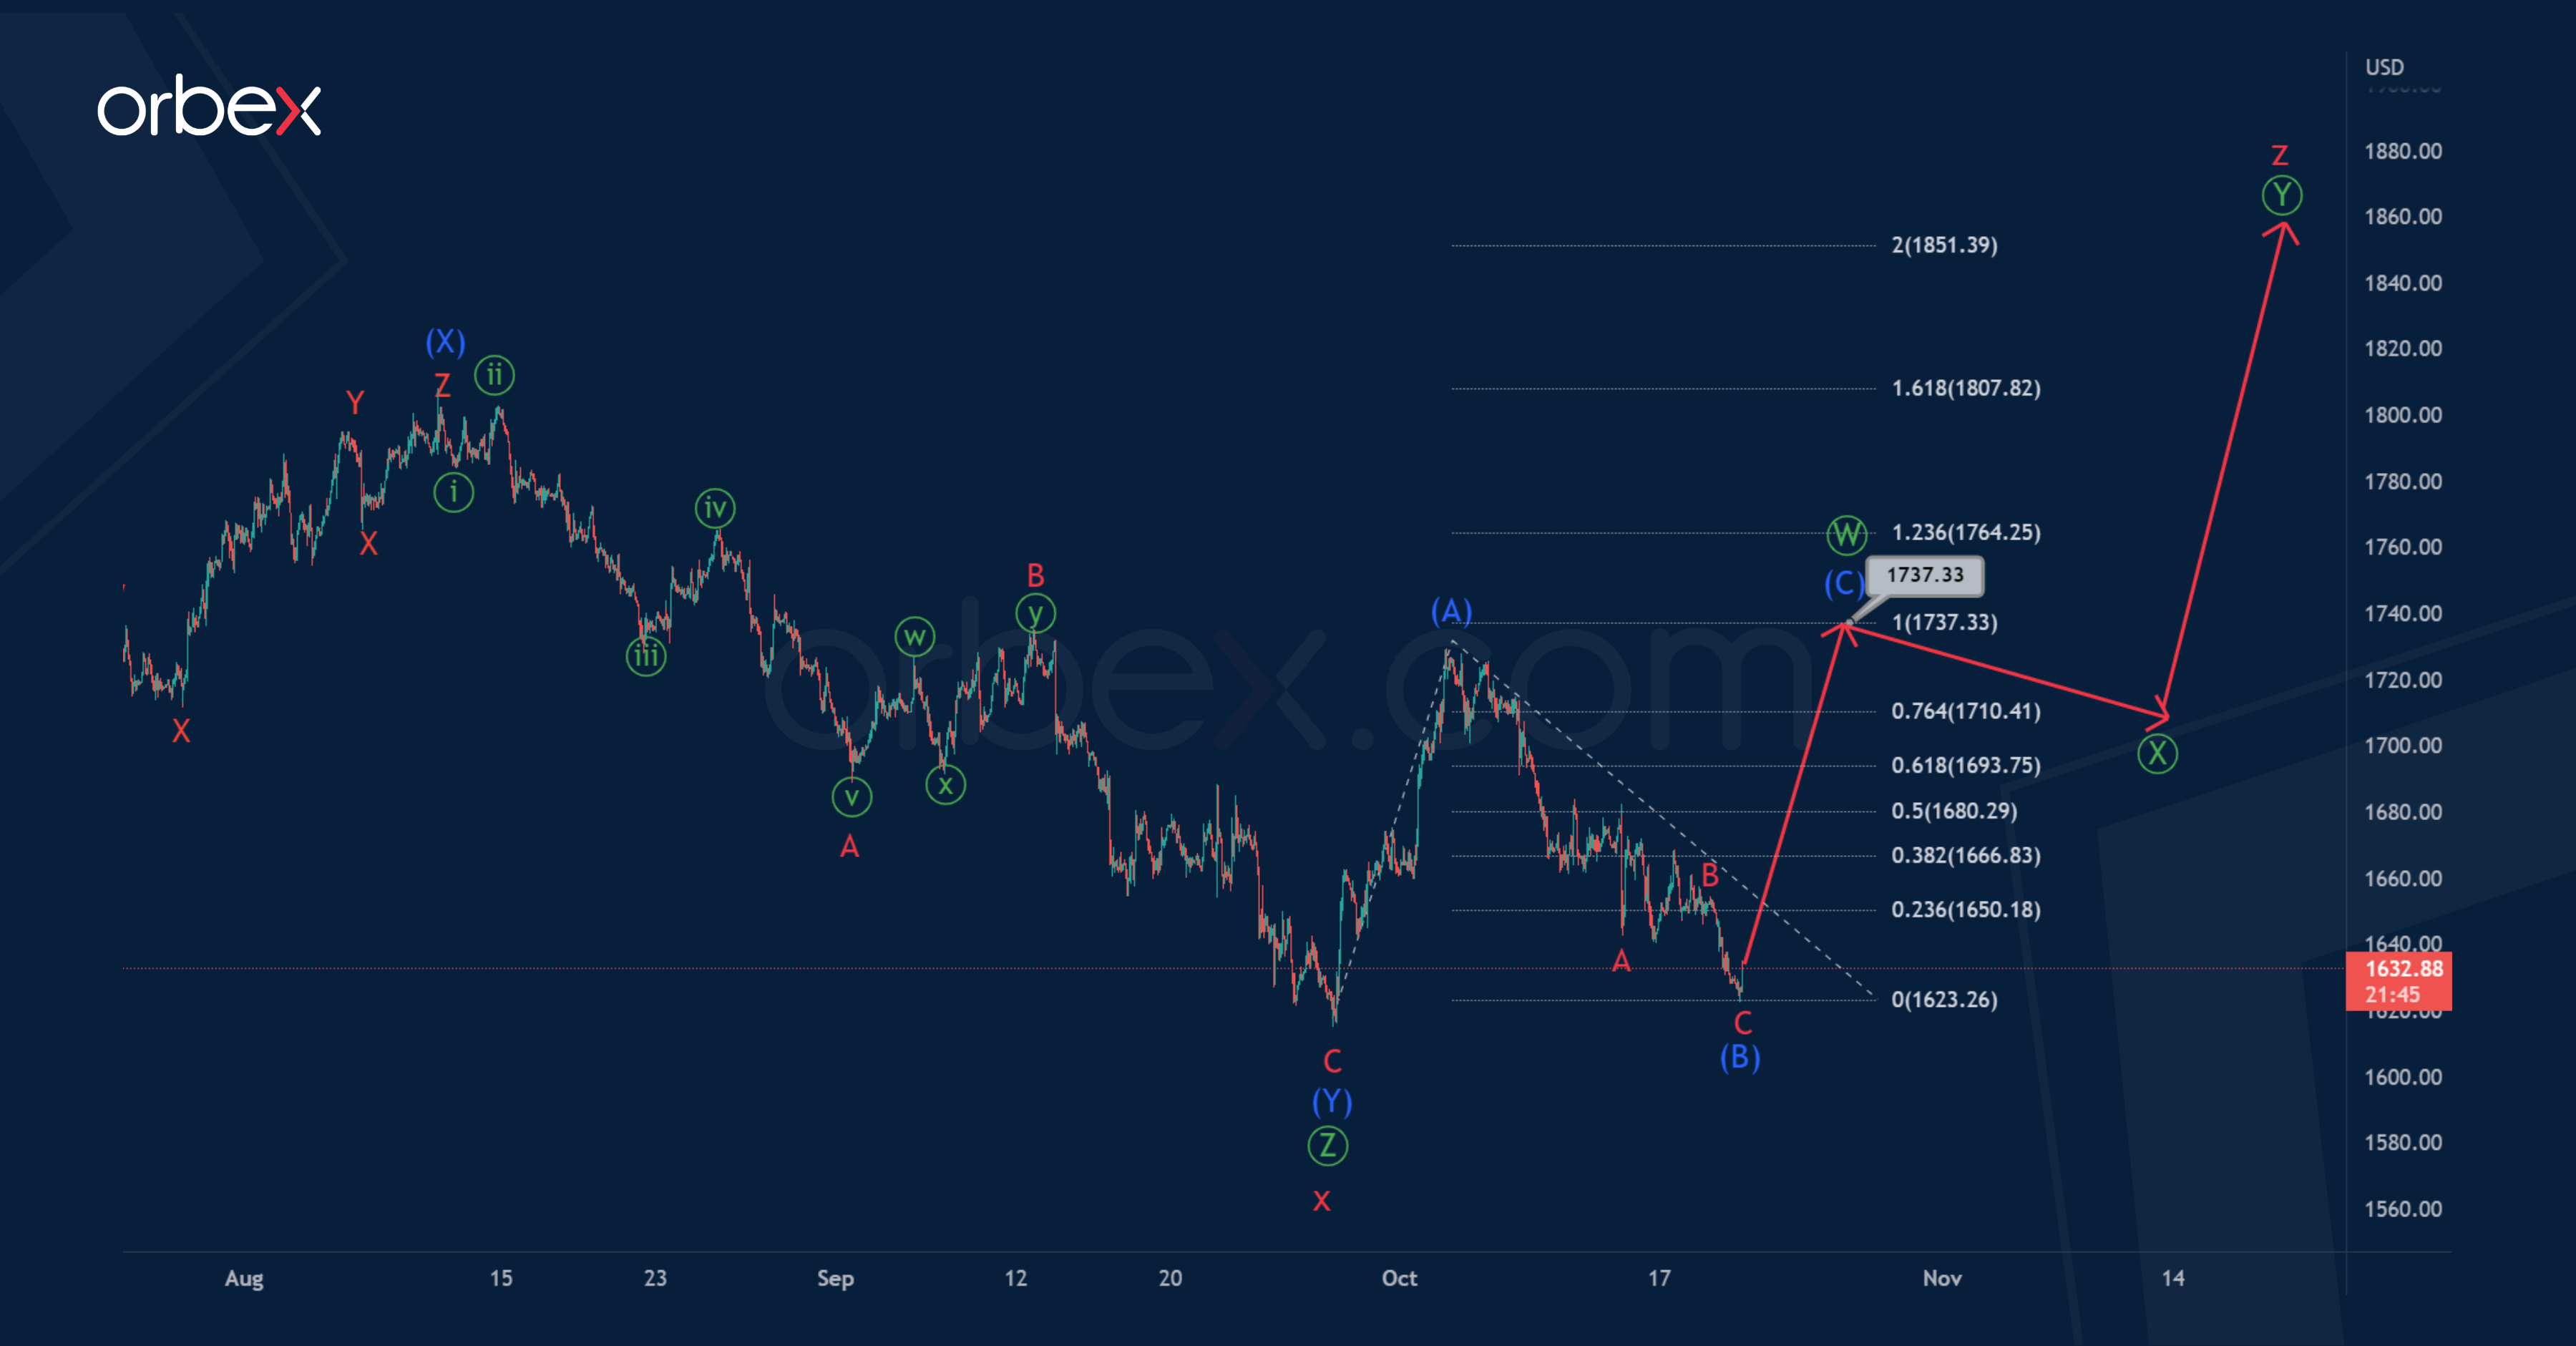
The current Gold chart suggests the development of a large correction pattern, which takes the form of a cycle triple zigzag.
The 1H timeframe shows the structure of the bearish cycle intervening wave x, which looks like a triple zigzag Ⓦ-Ⓧ-Ⓨ-Ⓧ-Ⓩ.
There is a possibility that the cycle wave z takes the form of a primary double zigzag Ⓦ-Ⓧ-Ⓨ, and now the price is in its first actionary wave Ⓦ.
Apparently, the bearish correction (B) of the intermediate degree could come to an end as part of the primary wave Ⓦ. Thus, in the near future, the price will rise in impulse (C), which may complete the zigzag pattern (A)-(B)-(C) near 1737.33. At that level, impulses (A) and (C) will be equal.
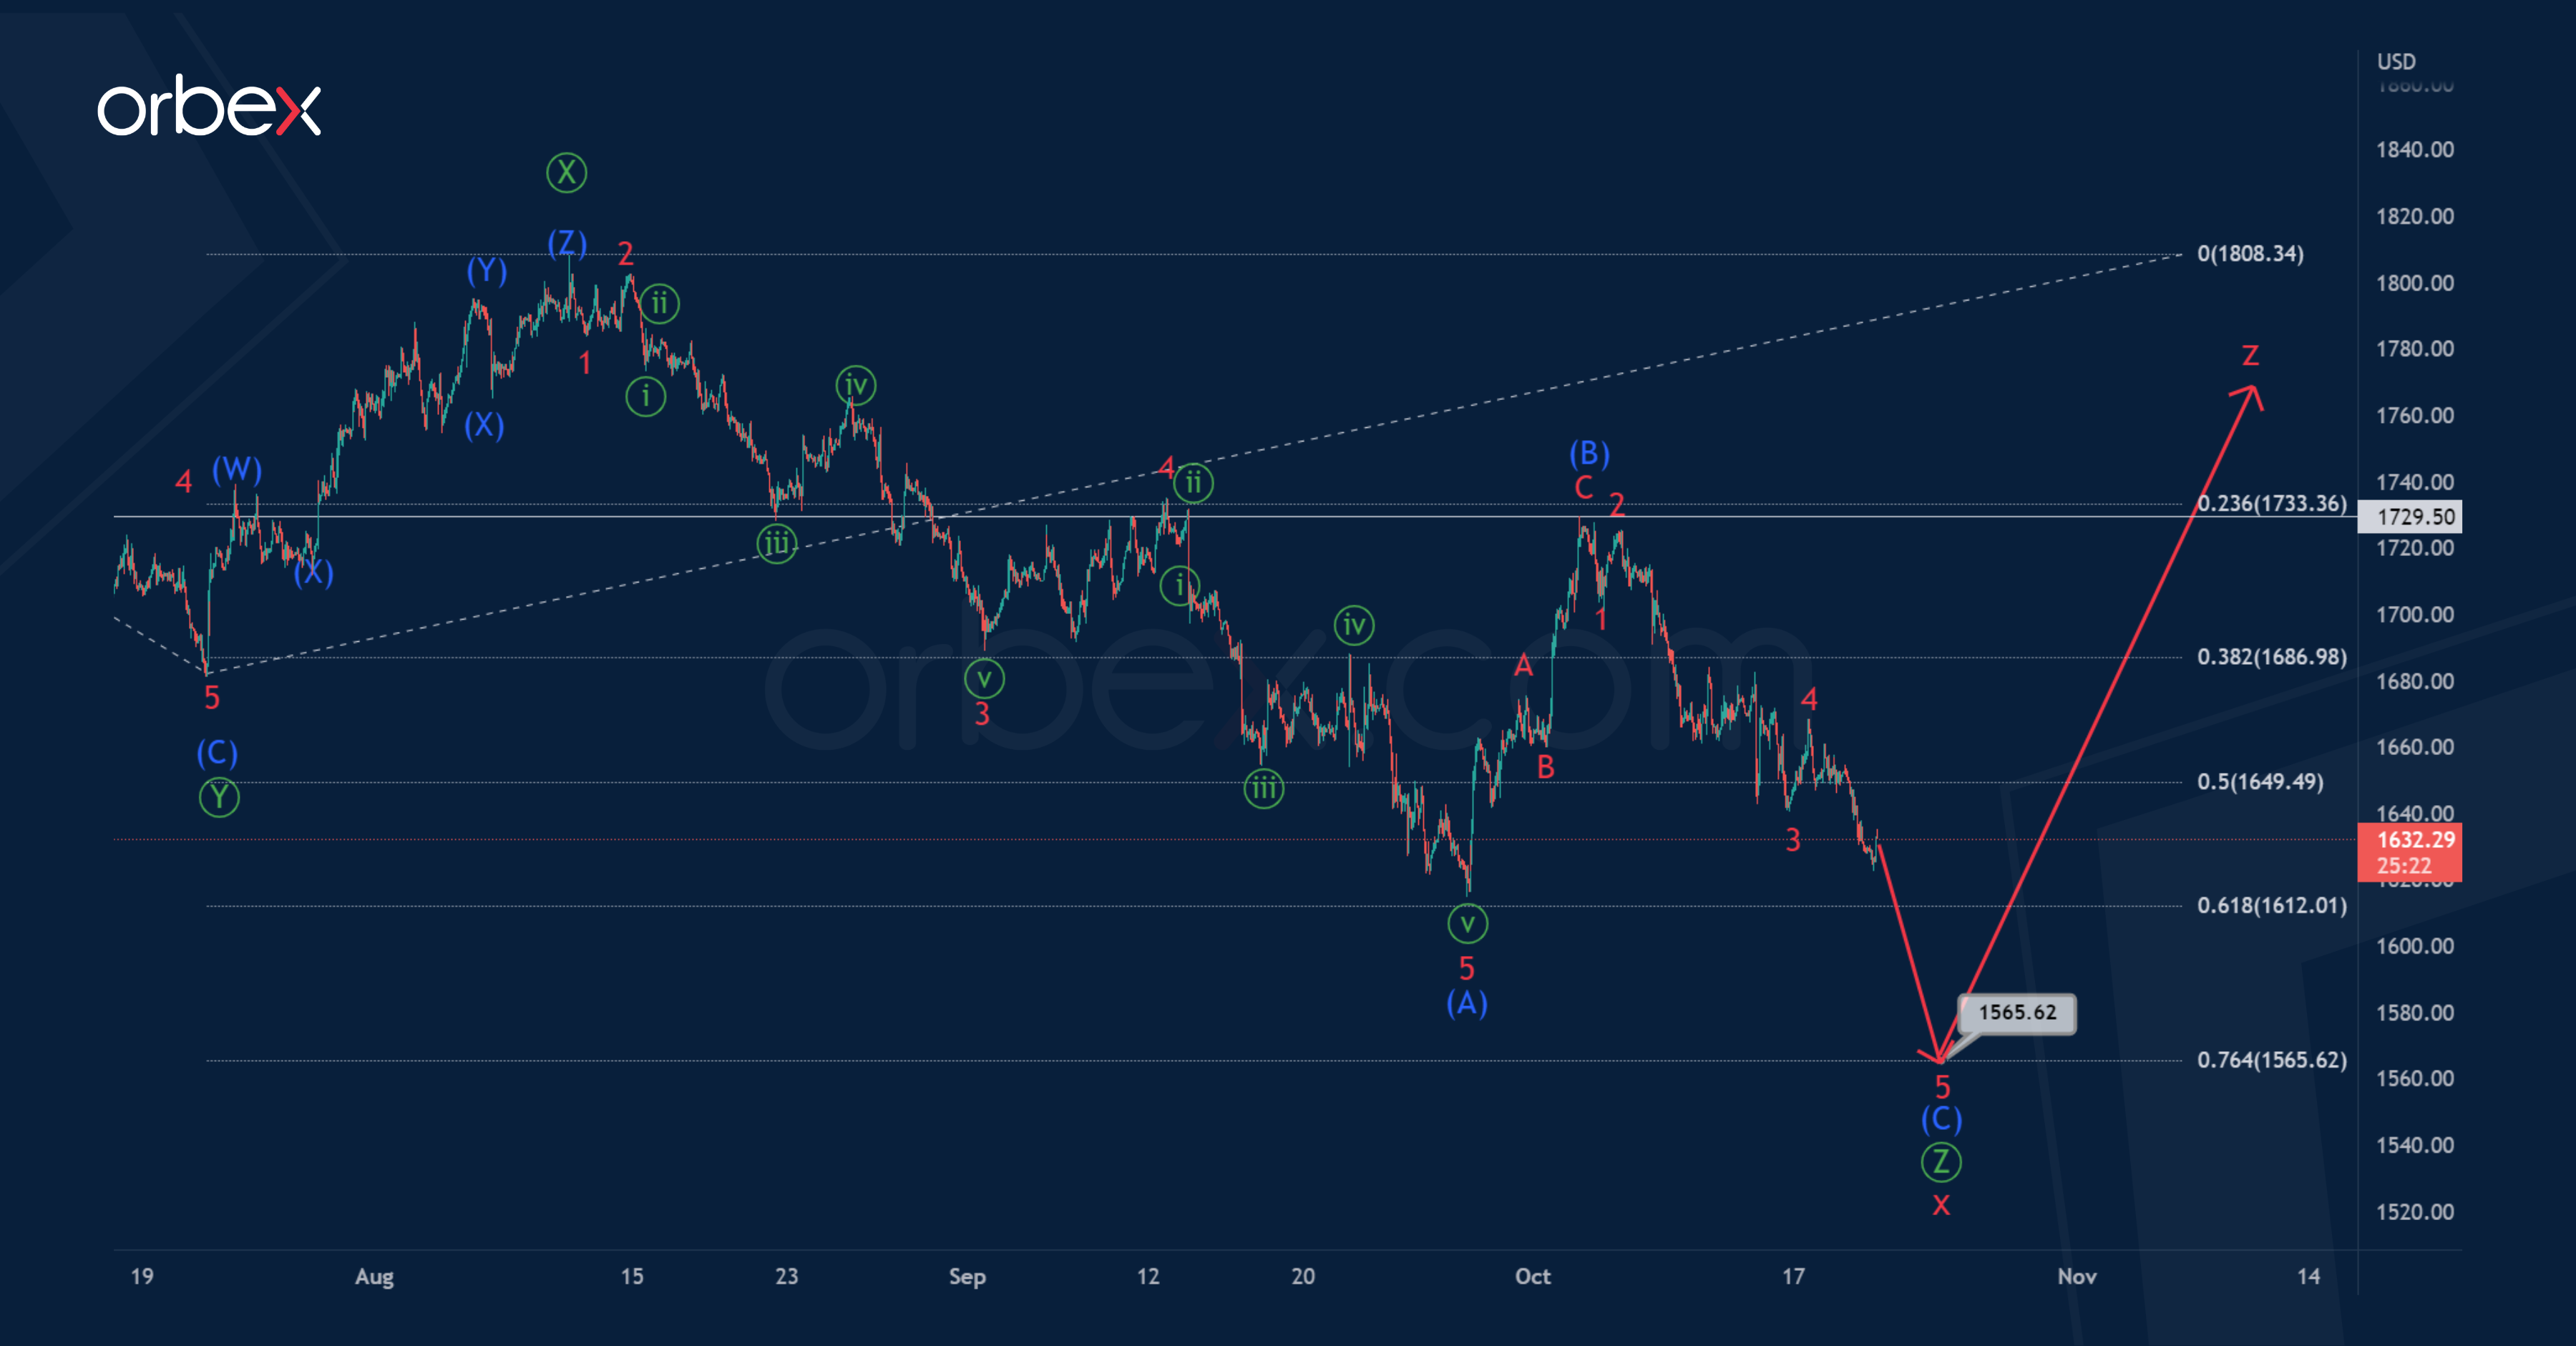
Let's consider the second option, where the downward movement of the pair continues in the cycle wave x. The final primary wave Ⓩ is under development.
Thus, a downward movement of XAUUSD is expected in the near future. The primary wave Ⓩ may take the form of an intermediate zigzag (A)-(B)-(C).
The final of the correction pattern zigzag (A)-(B)-(C) is possible near 1565.62. At that level, primary wave Ⓩ will be at 76.4% of primary wave Ⓨ.
Only after reaching the specified level, the development of the cycle wave z will begin.
US Oil Attempts to Bounce Back
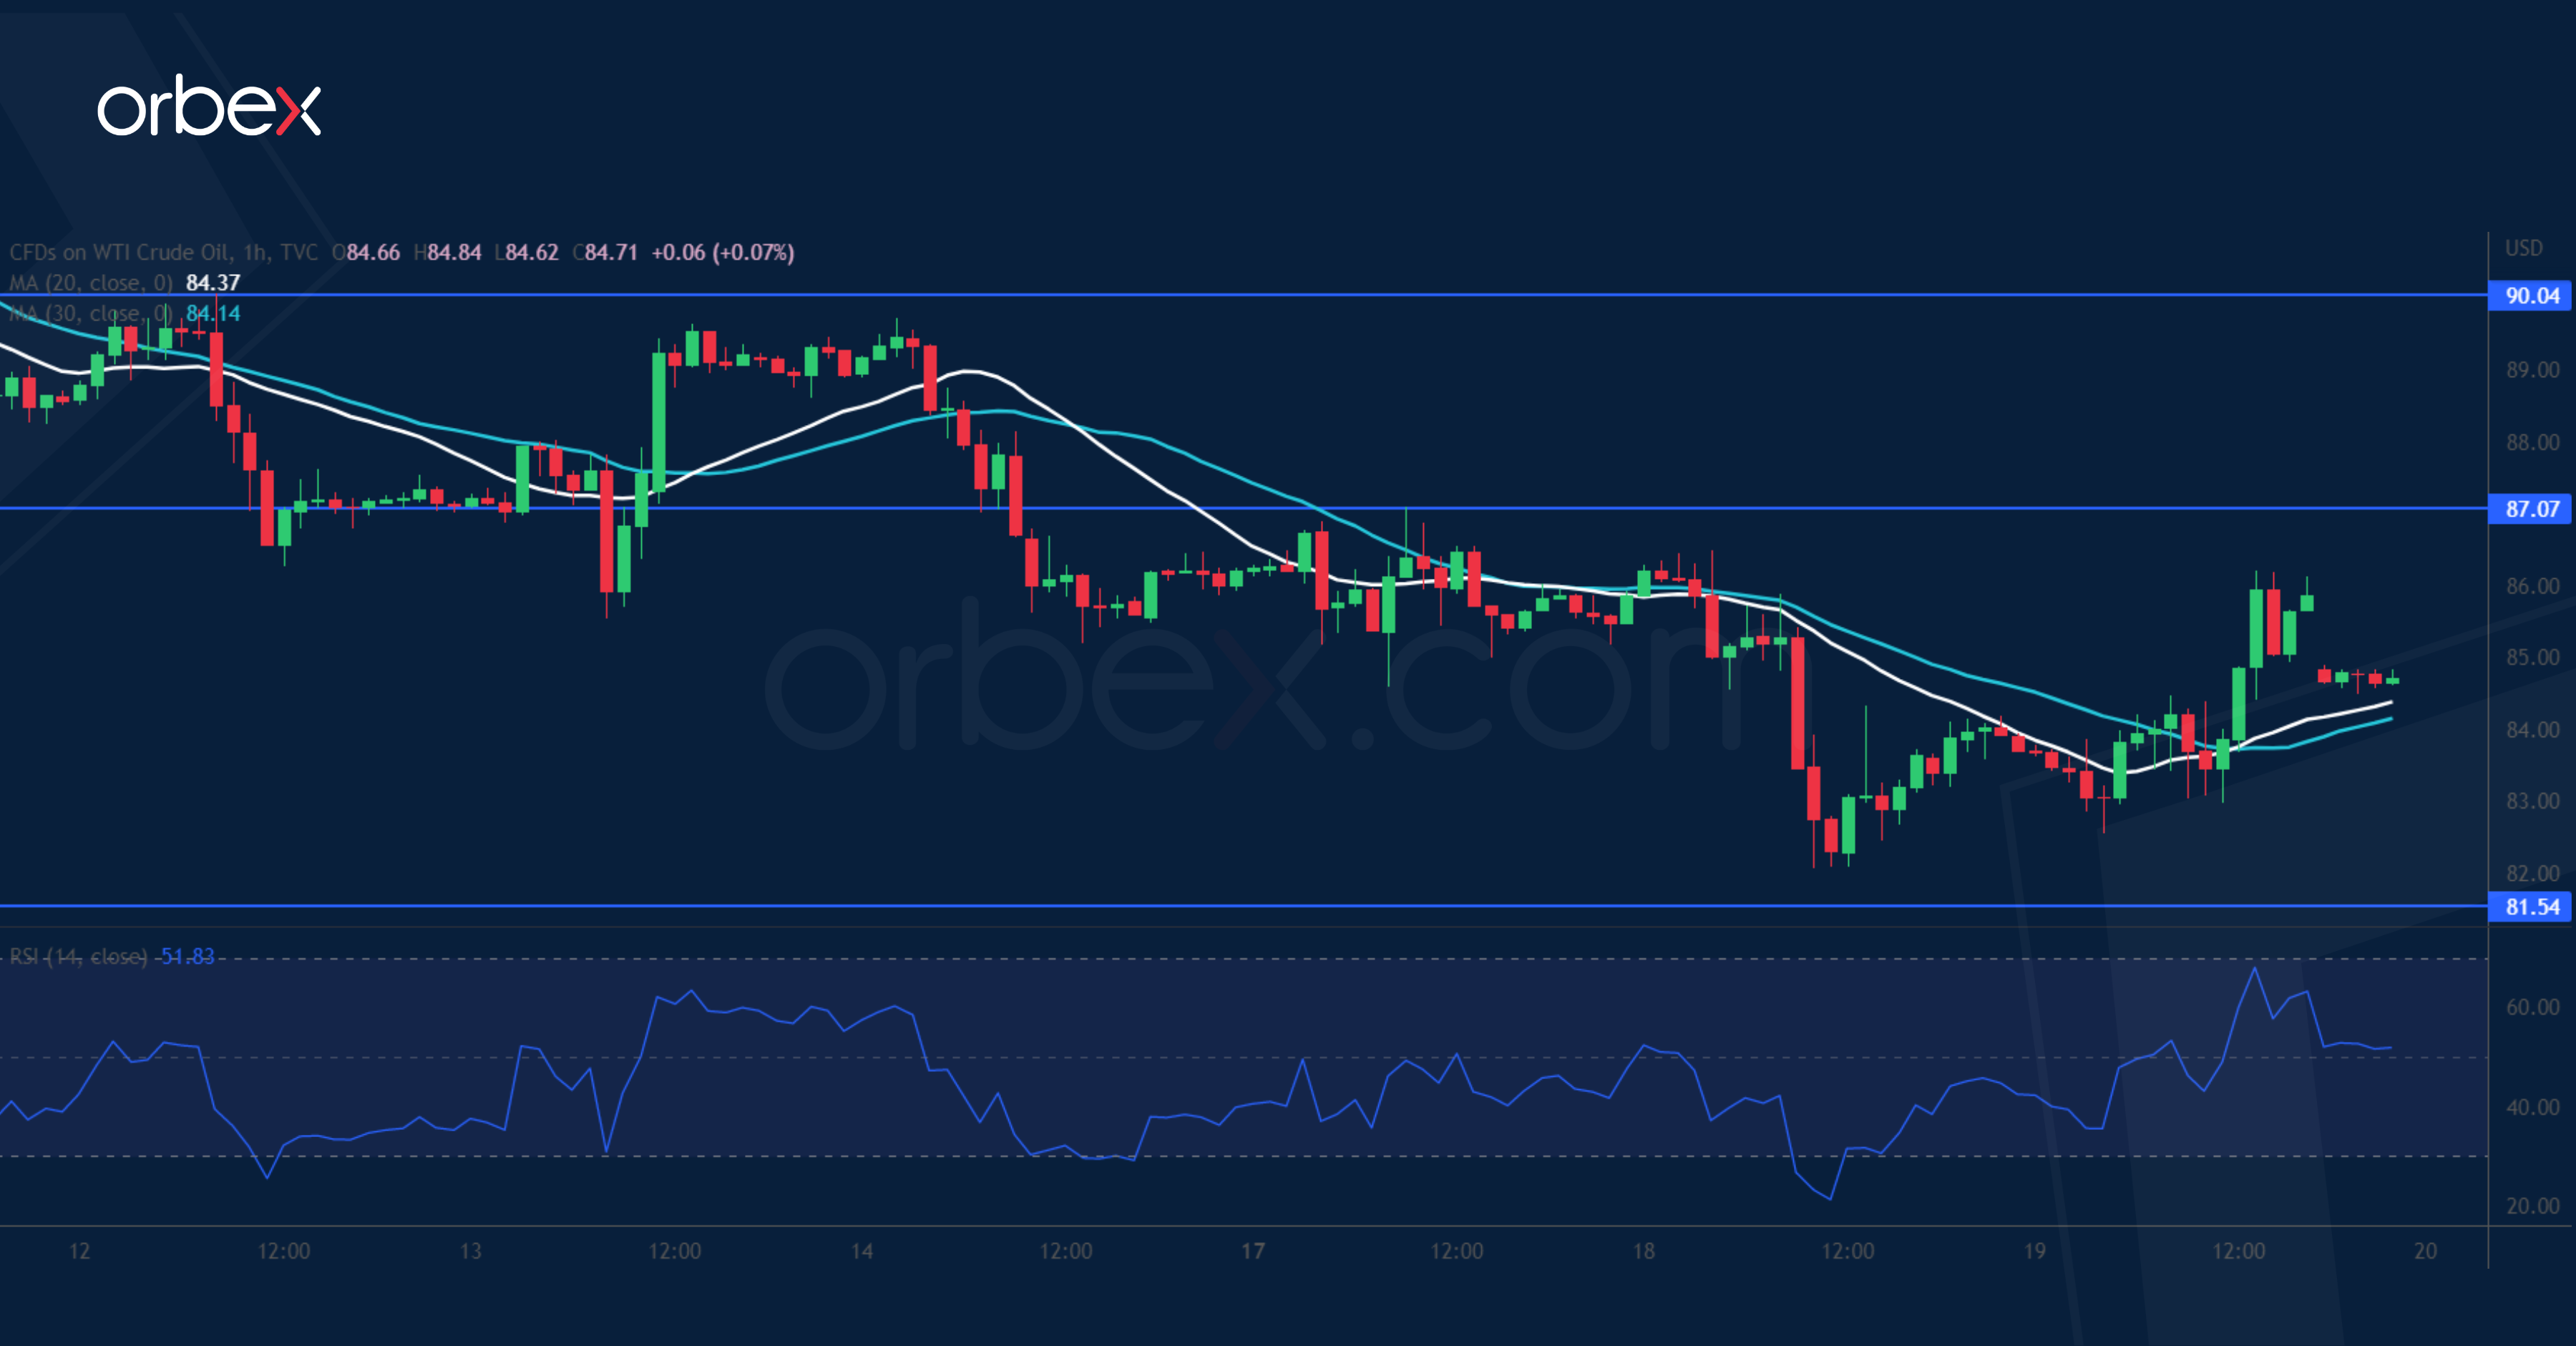
WTI rallied after US inventories showed a surprise drawdown. While the rally above 86.00 and 90.00 has eased some pressure, the price hit resistance at the origin (93.50) of the late August sell-off and struggled to secure bids. This suggests that the bears may have doubled down. 81.50 is the immediate support and its breach would cause a retest of 77.00 where the crude could be vulnerable to a new round of liquidation. 87.00 is the first hurdle in case of a rebound and only a rally above 90.00 may turn the mood around.
USD/CAD Consolidates Gains
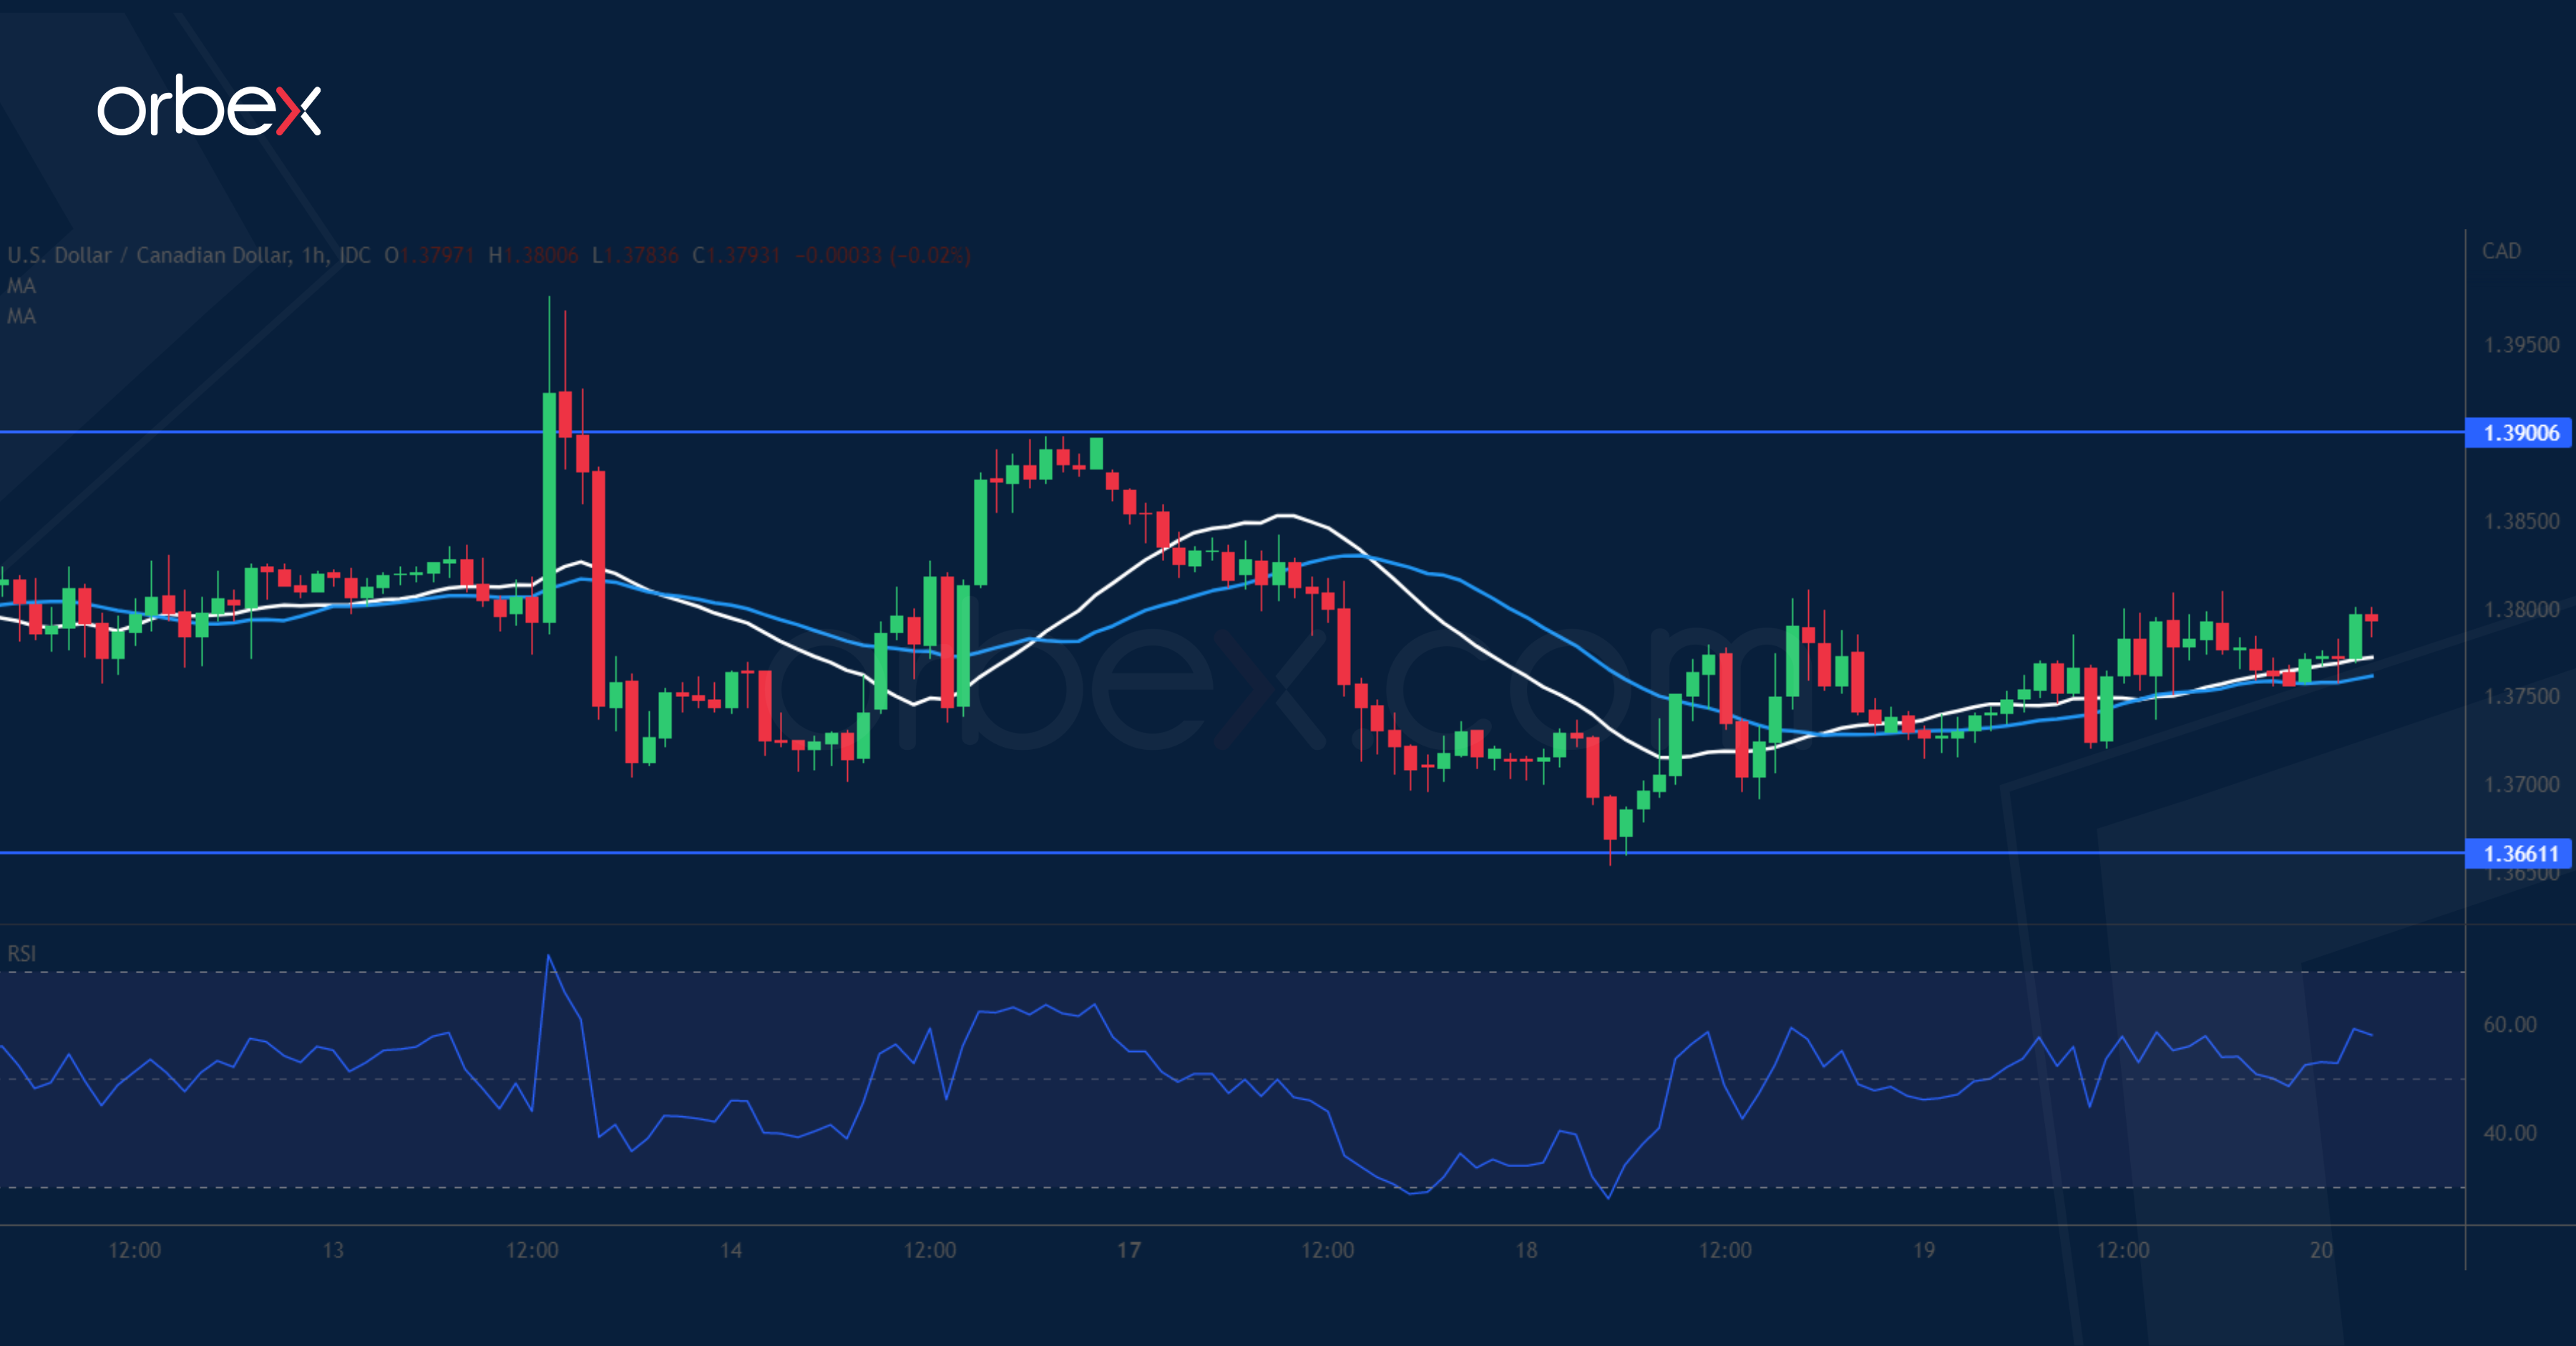
The Canadian dollar softened after the annual CPI eased to 6.9% in September. The price action is consolidating its latest gains after making a new high above 1.3840. A drop below 1.3700 has shaken out some weak hands but overall sentiment still points to the upside. The bulls may see the current pause as an opportunity to join the rally. 1.3660 is the first support while 1.3500 on the 30-day moving average is a key level to see follow-up interests. On the upside, a close above 1.3900 would resume the uptrend.
GBP/USD Seeks Support
The pound holds steady as Britain’s inflation rose to 10.1% in September. From the daily chart’s perspective, the pair is forming a flag-shaped pattern after its recent sharp slide. While Sterling clawed back some losses, the directional bias remains bearish in the medium-term which may attract more trend followers. 1.1500 is an important ceiling and its breach could lift offers to September’s high at 1.1700. 1.1070 at the base of the latest rally is a key support. A bearish breakout would send the price back to 1.0760.
Bank of Japan This Morning Announced an Unscheduled Bond Buying Operation
Markets
We’ve grown more used to large bond yield moves over the past few months. But it still feels extraordinary when they appear out of thin air. That’s what happened yesterday during a trading session that hadn’t much to offer in terms of important economic data or other events. Yet core bond yields hit new (closing) cycle highs at almost all maturities. US bond rates shot up between 9.5 bps and 13.6 bps in a flattener even with housing data coming in mixed – at best. Comments from Fed’s Kashkari (“no evidence that core inflation has peaked”, “more serious risk from not enough tightening”) and Evans helped sustain the move going into the US close. Bullard said that frontloading could end this year before shifting to keeping policy sufficiently restrictive with small adjustments as inflation cools in 2023. German yields added 11.8 to 12.3 bps in the 2y-5y segment, again underperforming swaps. Gilt yields were the exception even as UK CPI went back to the double digit area (10.1%). The ultralong end tanked more than 30 basis points, bringing the 30y back below 4% for the first time since end September. This is still a direct consequence of the Bank of England excluding that part of the curve (for now) in its bond selling programme starting November 1. Stock markets pared gains in Europe to just 0.2% or suffered minor losses up to 0.85% in the US. The US dollar held sway in currency markets with everyone eyeballing USD/JPY as it neared the 150 (intervention-triggering?!) barrier. EUR/USD retreated from 0.986 to 0.9777. Sterling traded without a clear direction. EUR/GBP closed unchanged above 0.87.
Asian stock sentiment was gloomy but got a little boost from reports that China is considering to cut quarantine time. The country’s very strict Covid rules weigh on demand and continue to hamper supply chains. The news is seen a first step in the other direction. Chinese stocks erased losses to turn slightly positive and is pulling peers away from intraday lows too. The dollar pared gains. Core bonds trade around or even slightly below yesterday’s closing levels. The BoJ this morning stepped in with an unscheduled bond buying spree (see below). Given the empty economic calendar and upcoming events (ECB next week), we would normally argue for wait-and-see trading behaviour. However, yesterday showed this doesn’t need to be the case per se. Especially with many parts of the yield curve, both in the US and Europe, having risen above previous cycle (closing) highs there’s room left for more from a technical point of view. On currency markets all attention is going to USD/JPY. 149.95 and counting.
News Headlines
Job growth in Australia unexpectedly came almost to a standstill in September, with a rise of only 900, compared to market expectations for a gain of about 25 000. Full time jobs rose modestly (13.3k). Part time employment declined. The participation rate stabilized at 66.6%. At the same time, the unemployment rate stayed very low at 3.5%. The labour market gradually moving to a more balanced condition supports the case for the RBA holding to a slower pace of rate hikes. At the October 4 meeting the RBA raised to policy rate by ‘only’ 25 bps to 2.6%, while markets expected a bigger increase. For the next RBA meeting on November 1, the market expects a similar 25 bps step. Despite the softer than expected labour market data, Australian bond yields are rising about 13 bps across the curve this morning on the global market repositioning. AUD/USD dropped to currently trade in the 0.6245 area, with the cycle low set earlier this month at 0.617.
The Bank of Japan this morning announced an unscheduled bond buying operation as the broader rise in global yields pushed the 10-y Japanese government bond yield above the 0.25% cap. To prevent a further rise the BOJ announced to buy an unlimited amount of 10-y Notes at a 0.25% yield. The BoJ also intends to by JPY 250 bln of bonds starting from a maturity of 5-year. The operation today illustrates that the BoJ continues to withstand the global trend op yield normalization, which also translates into persistent weakness of the Japanese currency. This weakening in September also resulted in a 44.9% Y/Y rise in the import bill. However, the value of exports also rose to 28.2% to JPY 8.8 trillion record level, slightly easing the adjusted trade deficit to JPY 2.01 trillion.