Sample Category Title
NZDUSD Plummets to Fresh 30-Month Lows
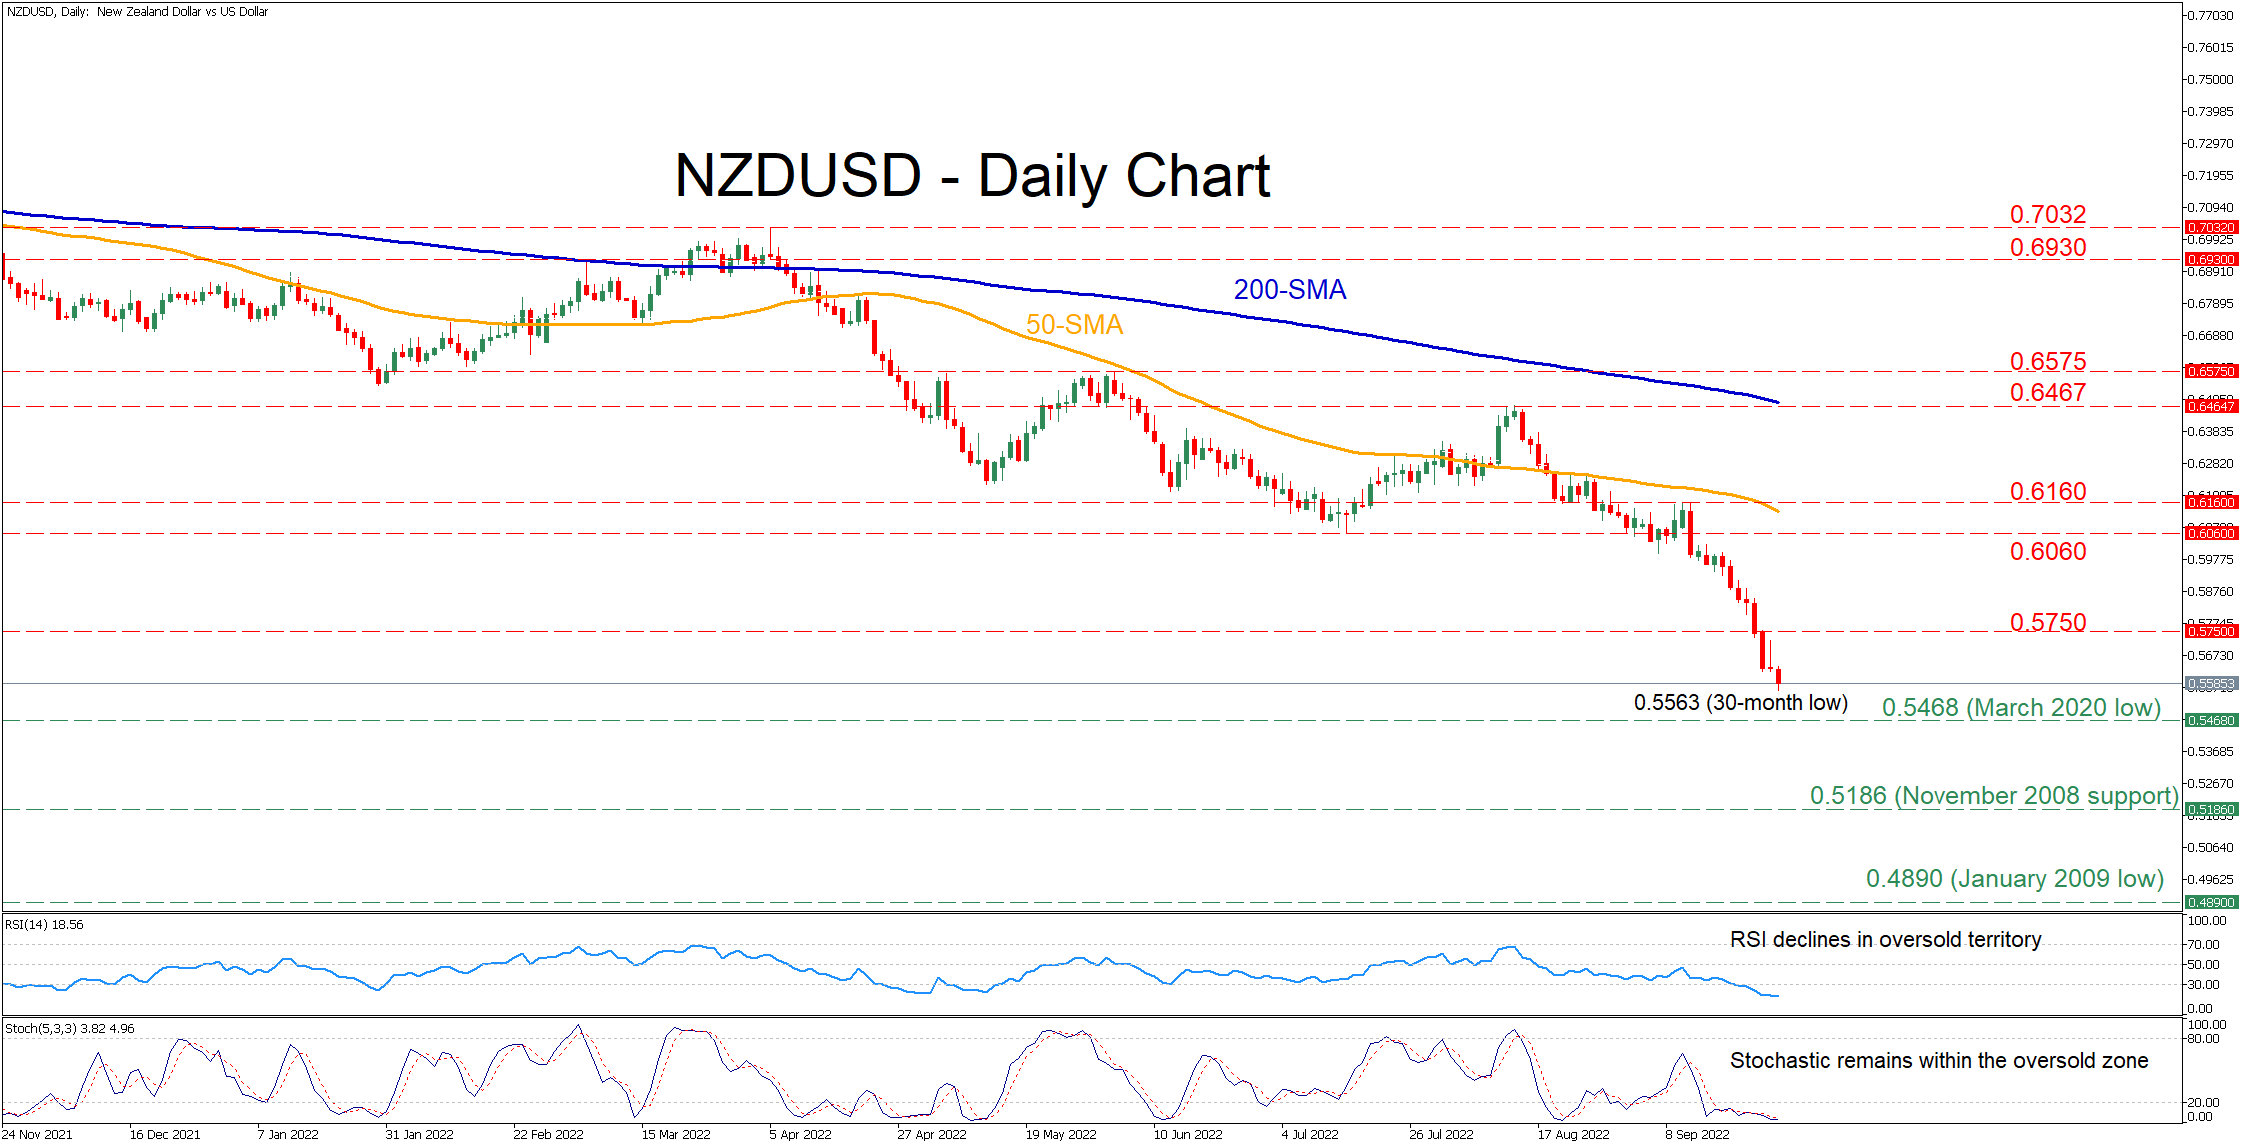
NZDUSD has been trending lower since March, generating a profound structure of lower highs and lower lows. Moreover, in the past few sessions, the technical picture has deteriorated even further, with the price recording a fresh 30-month low of 0.5563.
The momentum indicators are currently deep within their bearish areas, which could also signal that a rebound is imminent. The RSI is descending in the 30-oversold zone, while the stochastic oscillator has eased within its 20-oversold territory.
Should selling pressures intensify, the price could encounter support at the March 2020 bottom of 0.5468. If that floor collapses, the pair will dive towards levels not seen in the past 13 years, where the November 2008 support of 0.5186 could provide downside protection. Failing to halt there, the January 2009 low of 0.4890 may halt any further drops.
To the upside, bullish actions could send the price to test 0.5750. Crossing above this region, the pair might ascend towards the July low of 0.6060 or higher to challenge the recent resistance zone of 0.6160. Piercing through the latter, the August high of 0.6457 could prove to be a tough obstacle for the pair to overcome.
Overall, even if NZDUSD has come under tremendous downside pressure, the momentum indicators currently suggest that the market has reached oversold levels. Therefore, it wouldn’t be a surprise if the pair experienced an upside correction soon.
ECB Lagarde: First destination is neutral rate
ECB President Christine Lagarde said in a conference today, "we have to return inflation to 2% in the medium term, and we will do what we have to do, which is to continue hiking interest rates in the next several meetings."
"Our primary goal is not to create a recession. Our primary objective is price stability and we have to deliver on that. If we were not delivering, it would hurt the economy far more," she said, adding that the "first destination" of rate hikes will be to reach neutral rate.
Separately, Governing Council member Peter Kazimir indicated that ECB may need to hike again by 75bps next month as inflation remains unacceptably high.
USDJPY on a Mission to Claim 145.00; Bias Cautiously Bullish
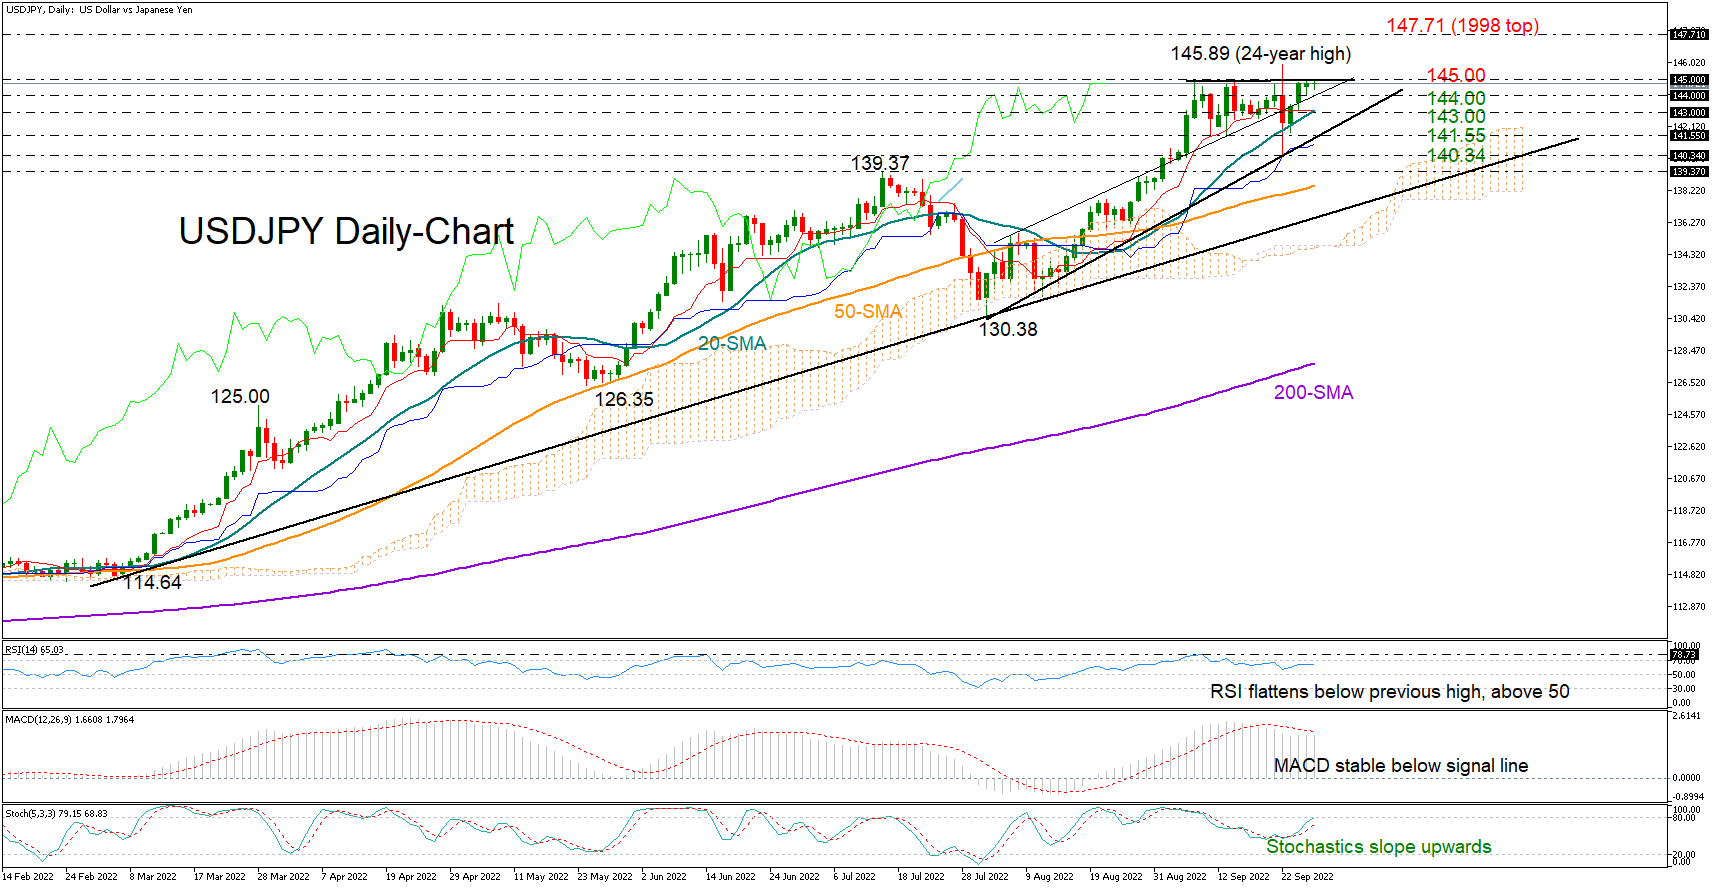
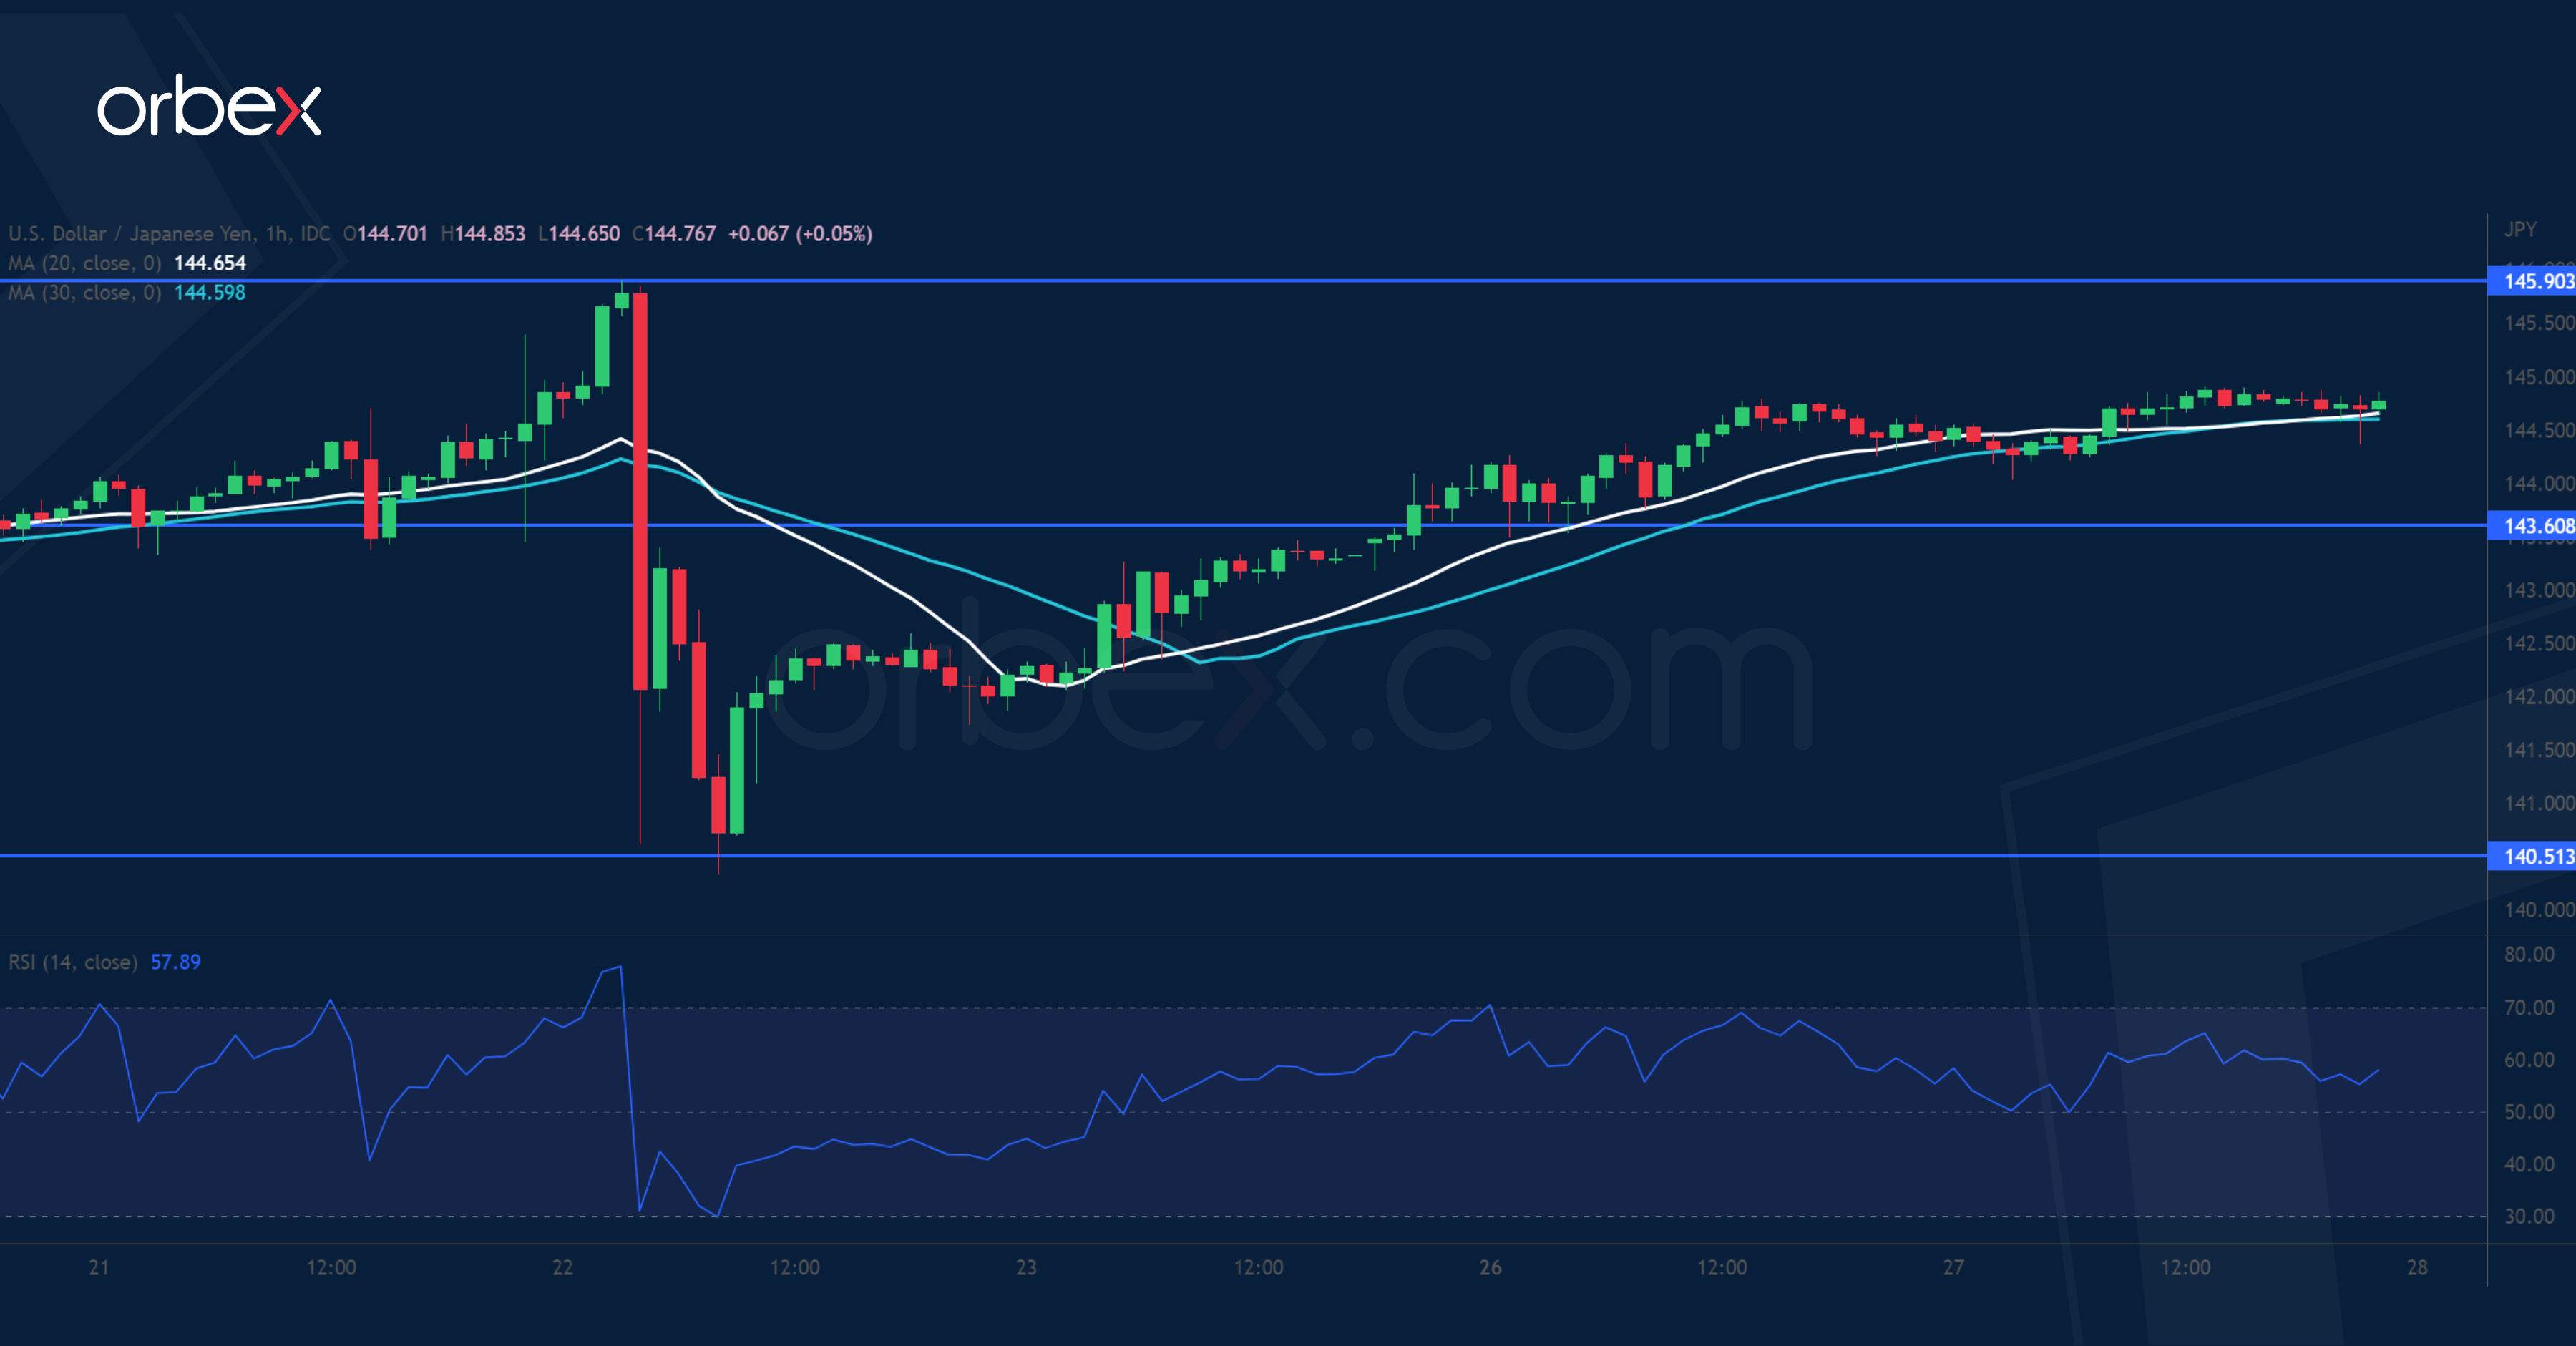
USDJPY is back on the mission to fight against the 145.00 crucial ceiling after fully recouping the Bank of Japan-led decline to 140.34 last week.
Even though the stochastics are positively charged, the RSI and the MACD are mirroring some skepticism among investors as the former seems to be struggling to post a higher high within the bullish area, while the latter remains stable below its red signal line.
Nevertheless, if the pair manages to secure a foothold around the 144.00 level, the pair may pierce through the 145.00 wall to meet the 1998 top of 147.71. The 149.00 -150.00 region could next come on the radar if the ascent grows further.
Should the bears drive the price below 144.00, the 20-day simple moving average (SMA) at 143.00 could cancel any extensions towards the 141.55 support zone, where the ascending trendline from 130.38 is positioned. Falling lower, the price may retest last week’s low of 140.34 ahead of the key 139.37 region, a break of which would signal the end of the bullish trend.
In brief, USDJPY is looking cautiously bullish in the short-term picture. The next episode of volatility is expected to start either above 145.00 or below 144.00.
Daily Technical Analysis
EUR/USD
The bulls’ attempts to limit the sell-offs remain unsuccessful and the sellers are currently testing the support at 28952. If they manage to successfully breach it, then their next move would be for an attack on the critical support at 28500. In this falling market and clear downtrend, the bears would definitely prevail, thus the buyers need to be extremely cautious when entering the market. It is so far deemed that only a confirmed breach of the resistance at 29658 may suggest a positive outlook – for an increase in the price of the index towards the psychological level at 30000.
USD/JPY
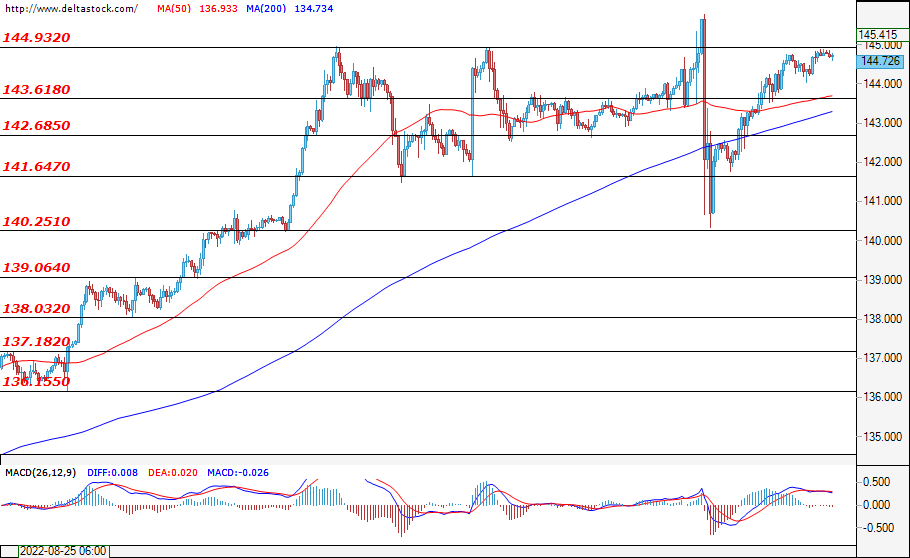
Despite the strong U.S. dollar, the resistance zone at 145.00 seems to be a strong barrier for the bulls to break out from in order to lead the pair towards new highs. The expectations for today’s trading session are for the pair to bounce back from this level and to test the support at 143.60, where a successful breach may lead to further sell-offs heading the pair towards the next key support at 142.68. In an alternative scenario, in which the bulls manage to overcome the mentioned resistance and hold the pair above 145.00, we may expect an impulsive upward movement and a continuation of the long-term uptrend that would lead the Ninja towards new highs.
GBP/USD
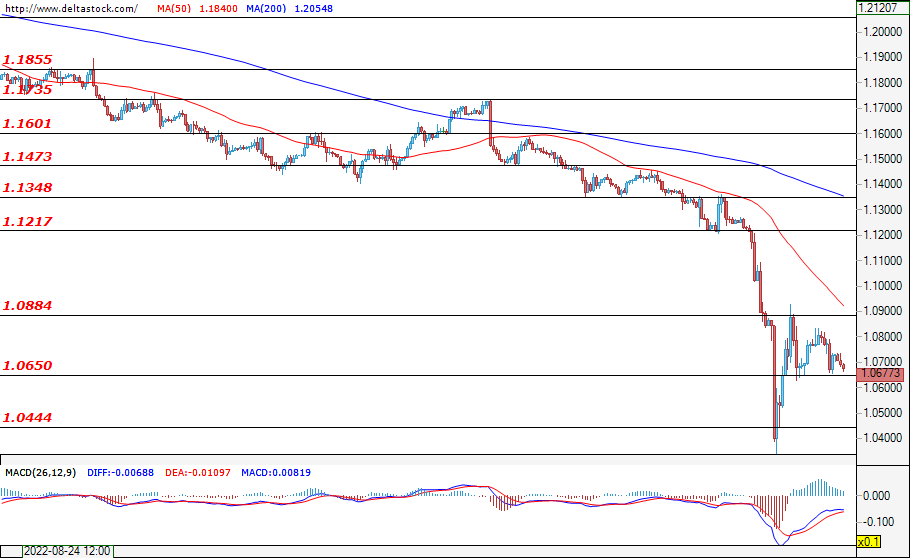
After the pair rebounded from the support at 1.0400, the bulls prevailed and the corrective move deepened, reaching the resistance at 1.0880. At the time of writing, the pair is hovering just above the support at 1.0650 and the forecasts for today’s trading session are for the bears to regain control over the market, and in case of a confirmed breach of the local support at 1.0650, for them to follow up with an attack on the next key support at 1.0444. A breach of the mentioned support may be considered a signal for a resumption of the downtrend, which would pave the way for the pair towards the low at 1.0300. In the opposite direction, only a confirmed breach of the resistance at 1.0884 may suggest a further upward movement, with the upper limit being the resistance at 1.1217.
EUGERMANY40
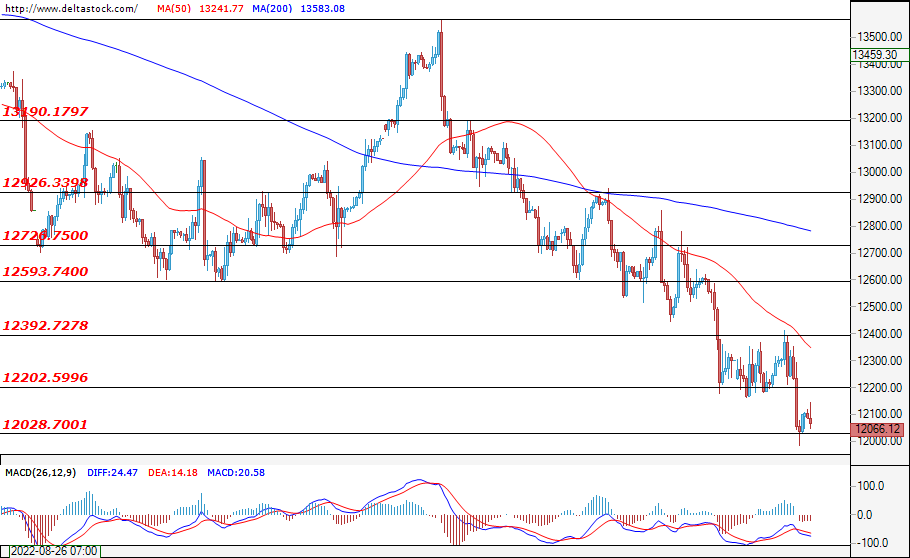
In the early hours of today’s trading session the bears are striving to violate the support at 12000. In case they manage to push and hold the price below 12000, then the most probable scenario for today’s trading session is the downtrend to continue and to witness further decrease in the price towards the next key support at around 11500. Investors do not have any signs for a reversal of the downtrend, thus staking on further losses for the index. In the opposite direction, only a successfully breach of the resistance at 12400 may be considered as a strong signal for changing the negative market sentiments.
US30
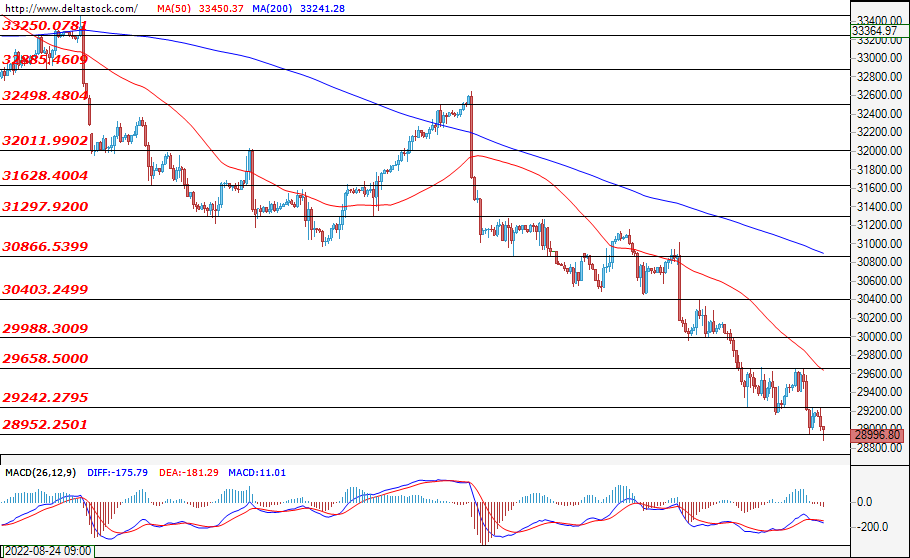
The bulls’ attempts to limit the sell-offs remain unsuccessful and the sellers are currently testing the support at 28952. If they manage to successfully breach it, then their next move would be for an attack on the critical support at 28500. In this falling market and clear downtrend, the bears would definitely prevail, thus the buyers need to be extremely cautious when entering the market. It is so far deemed that only a confirmed breach of the resistance at 29658 may suggest a positive outlook – for an increase in the price of the index towards the psychological level at 30000.
XAU/USD: Gold is Ready for a Bullish Trend Towards 1865.77
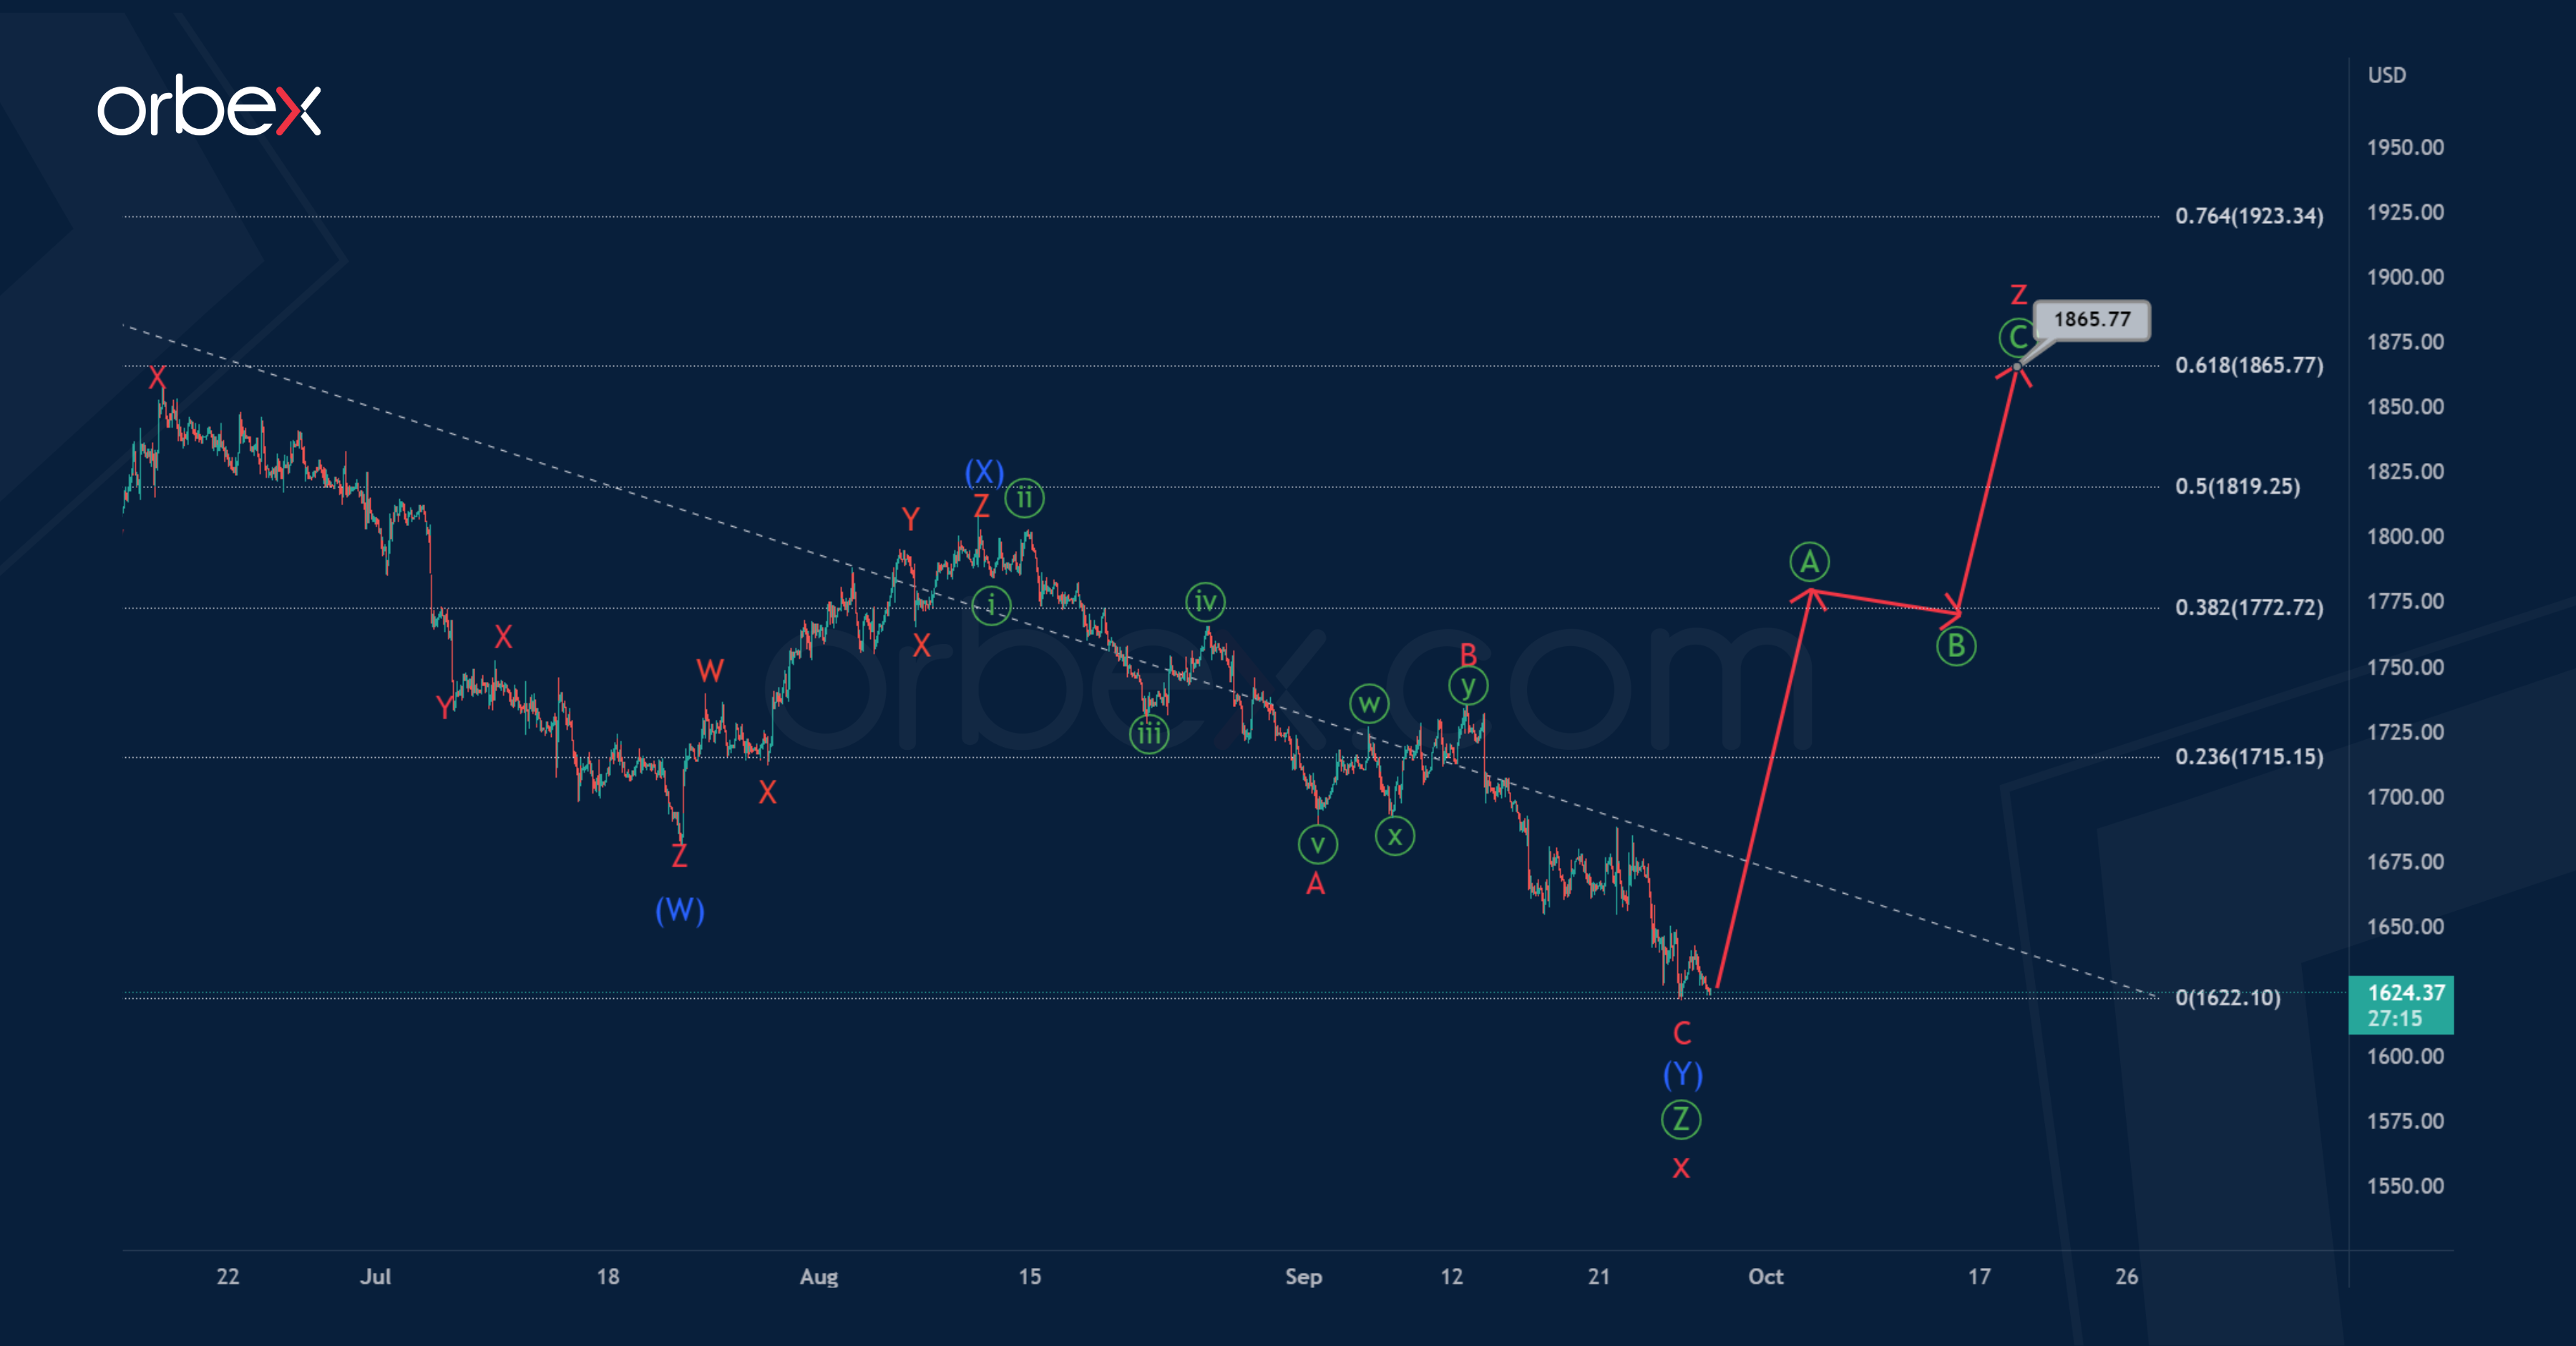
The current Gold chart shows a large correction pattern, which takes the form of a cycle triple zigzag.
The last section of the chart shows the structure of the bearish cycle intervening wave x, which looks completed in the form of a primary triple zigzag Ⓦ-Ⓧ-Ⓨ-Ⓧ-Ⓩ.
Perhaps in the next coming trading days, the market will turn around and start moving up, in the initial part of the cycle wave z. It may take the form of a primary standard zigzag Ⓐ-Ⓑ-Ⓒ, as shown in the chart.
The price of gold in the wave z may rise to the price mark of 1865.77. At that level, it will be at 61.8% of previous actionary wave y.
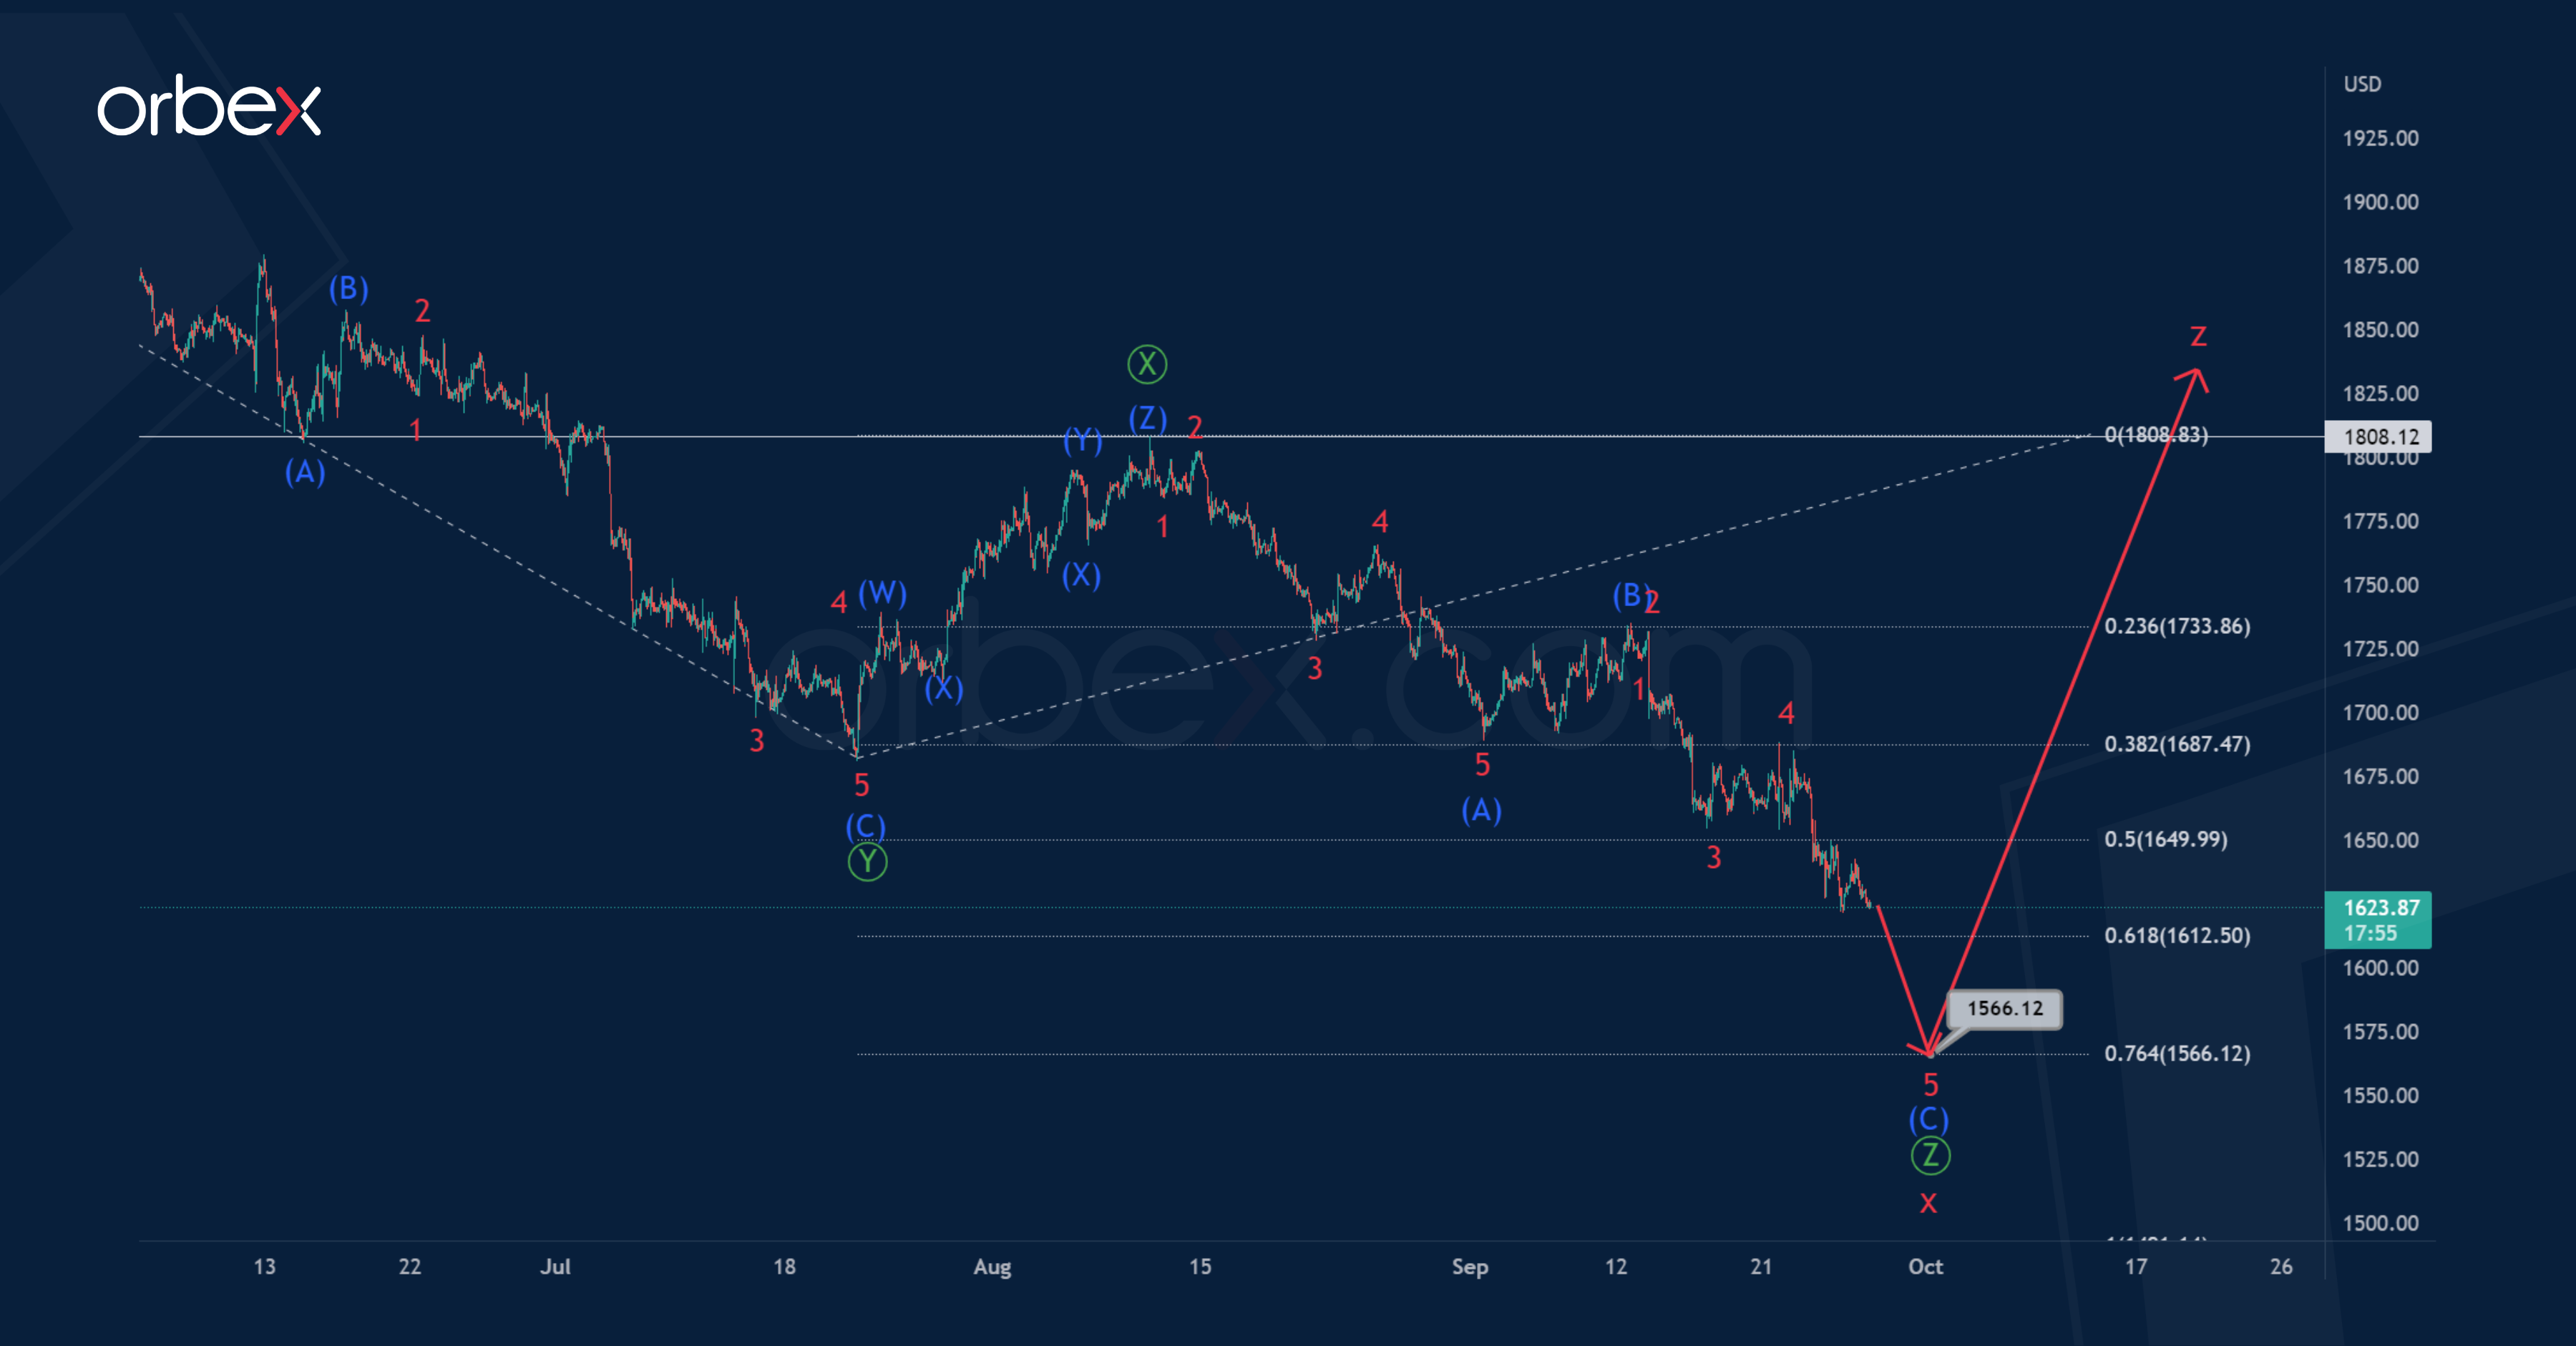
Let's consider the second scenario, where the downward movement of the pair continues in the cycle wave x. The final primary wave is under development.
Thus, a downward movement of XAUUSD is expected in the near future. The primary wave Ⓩ may take the form of an intermediate zigzag (A)-(B)-(C).
The final of the correction pattern zigzag (A)-(B)-(C) is possible near 1566.12. At that level, primary wave Ⓩ will be at 76.4% of primary wave Ⓨ.
Only after reaching the specified level, the development of the cycle wave z will begin.
UK 100 Breaks Critical Support
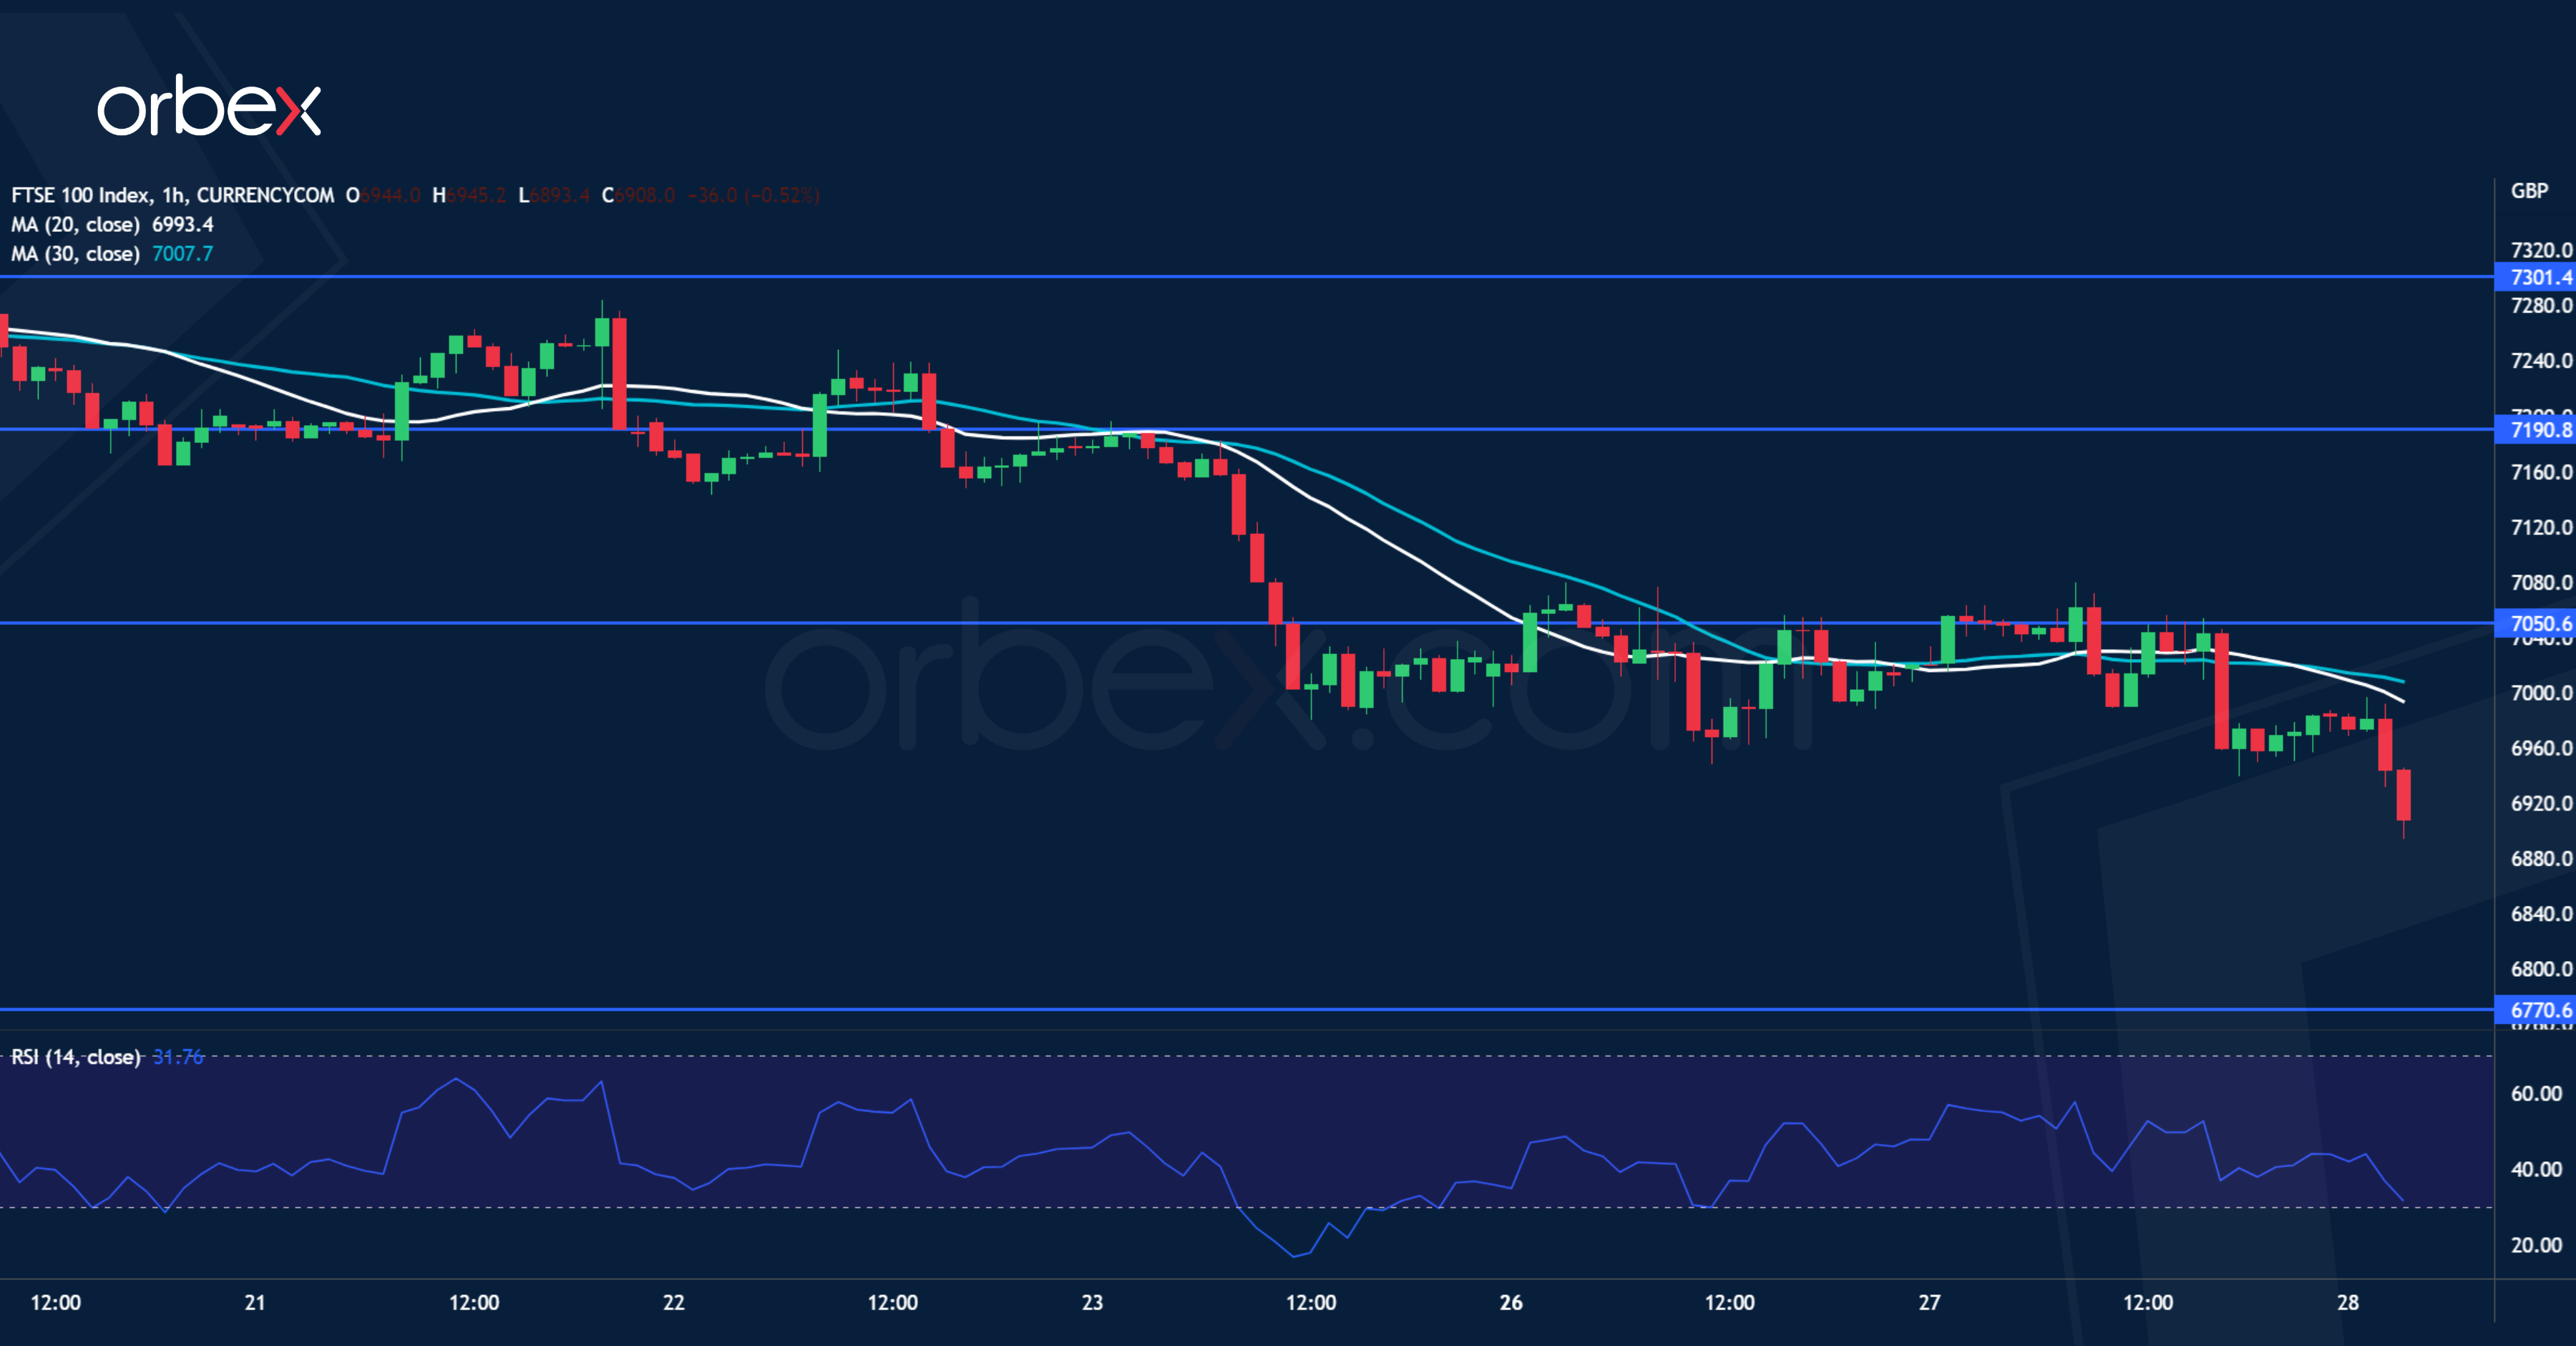
The FTSE 100 struggles over UK rate rise worries to support a battered pound. A fall below the critical area and psychological level of 7000 is a strong signal that the market has slipped into bearish territory. After the RSI recovered into the neutral zone, a brief consolidation could be the last chance for the bulls to bail out before another round of sell-off. Waning buying has met stiff selling near the fresh resistance at 7050. A bearish MA cross suggests an acceleration to the downside. Last March’s low at 6770 would be next.
AUD/USD Fails to Bounce Back
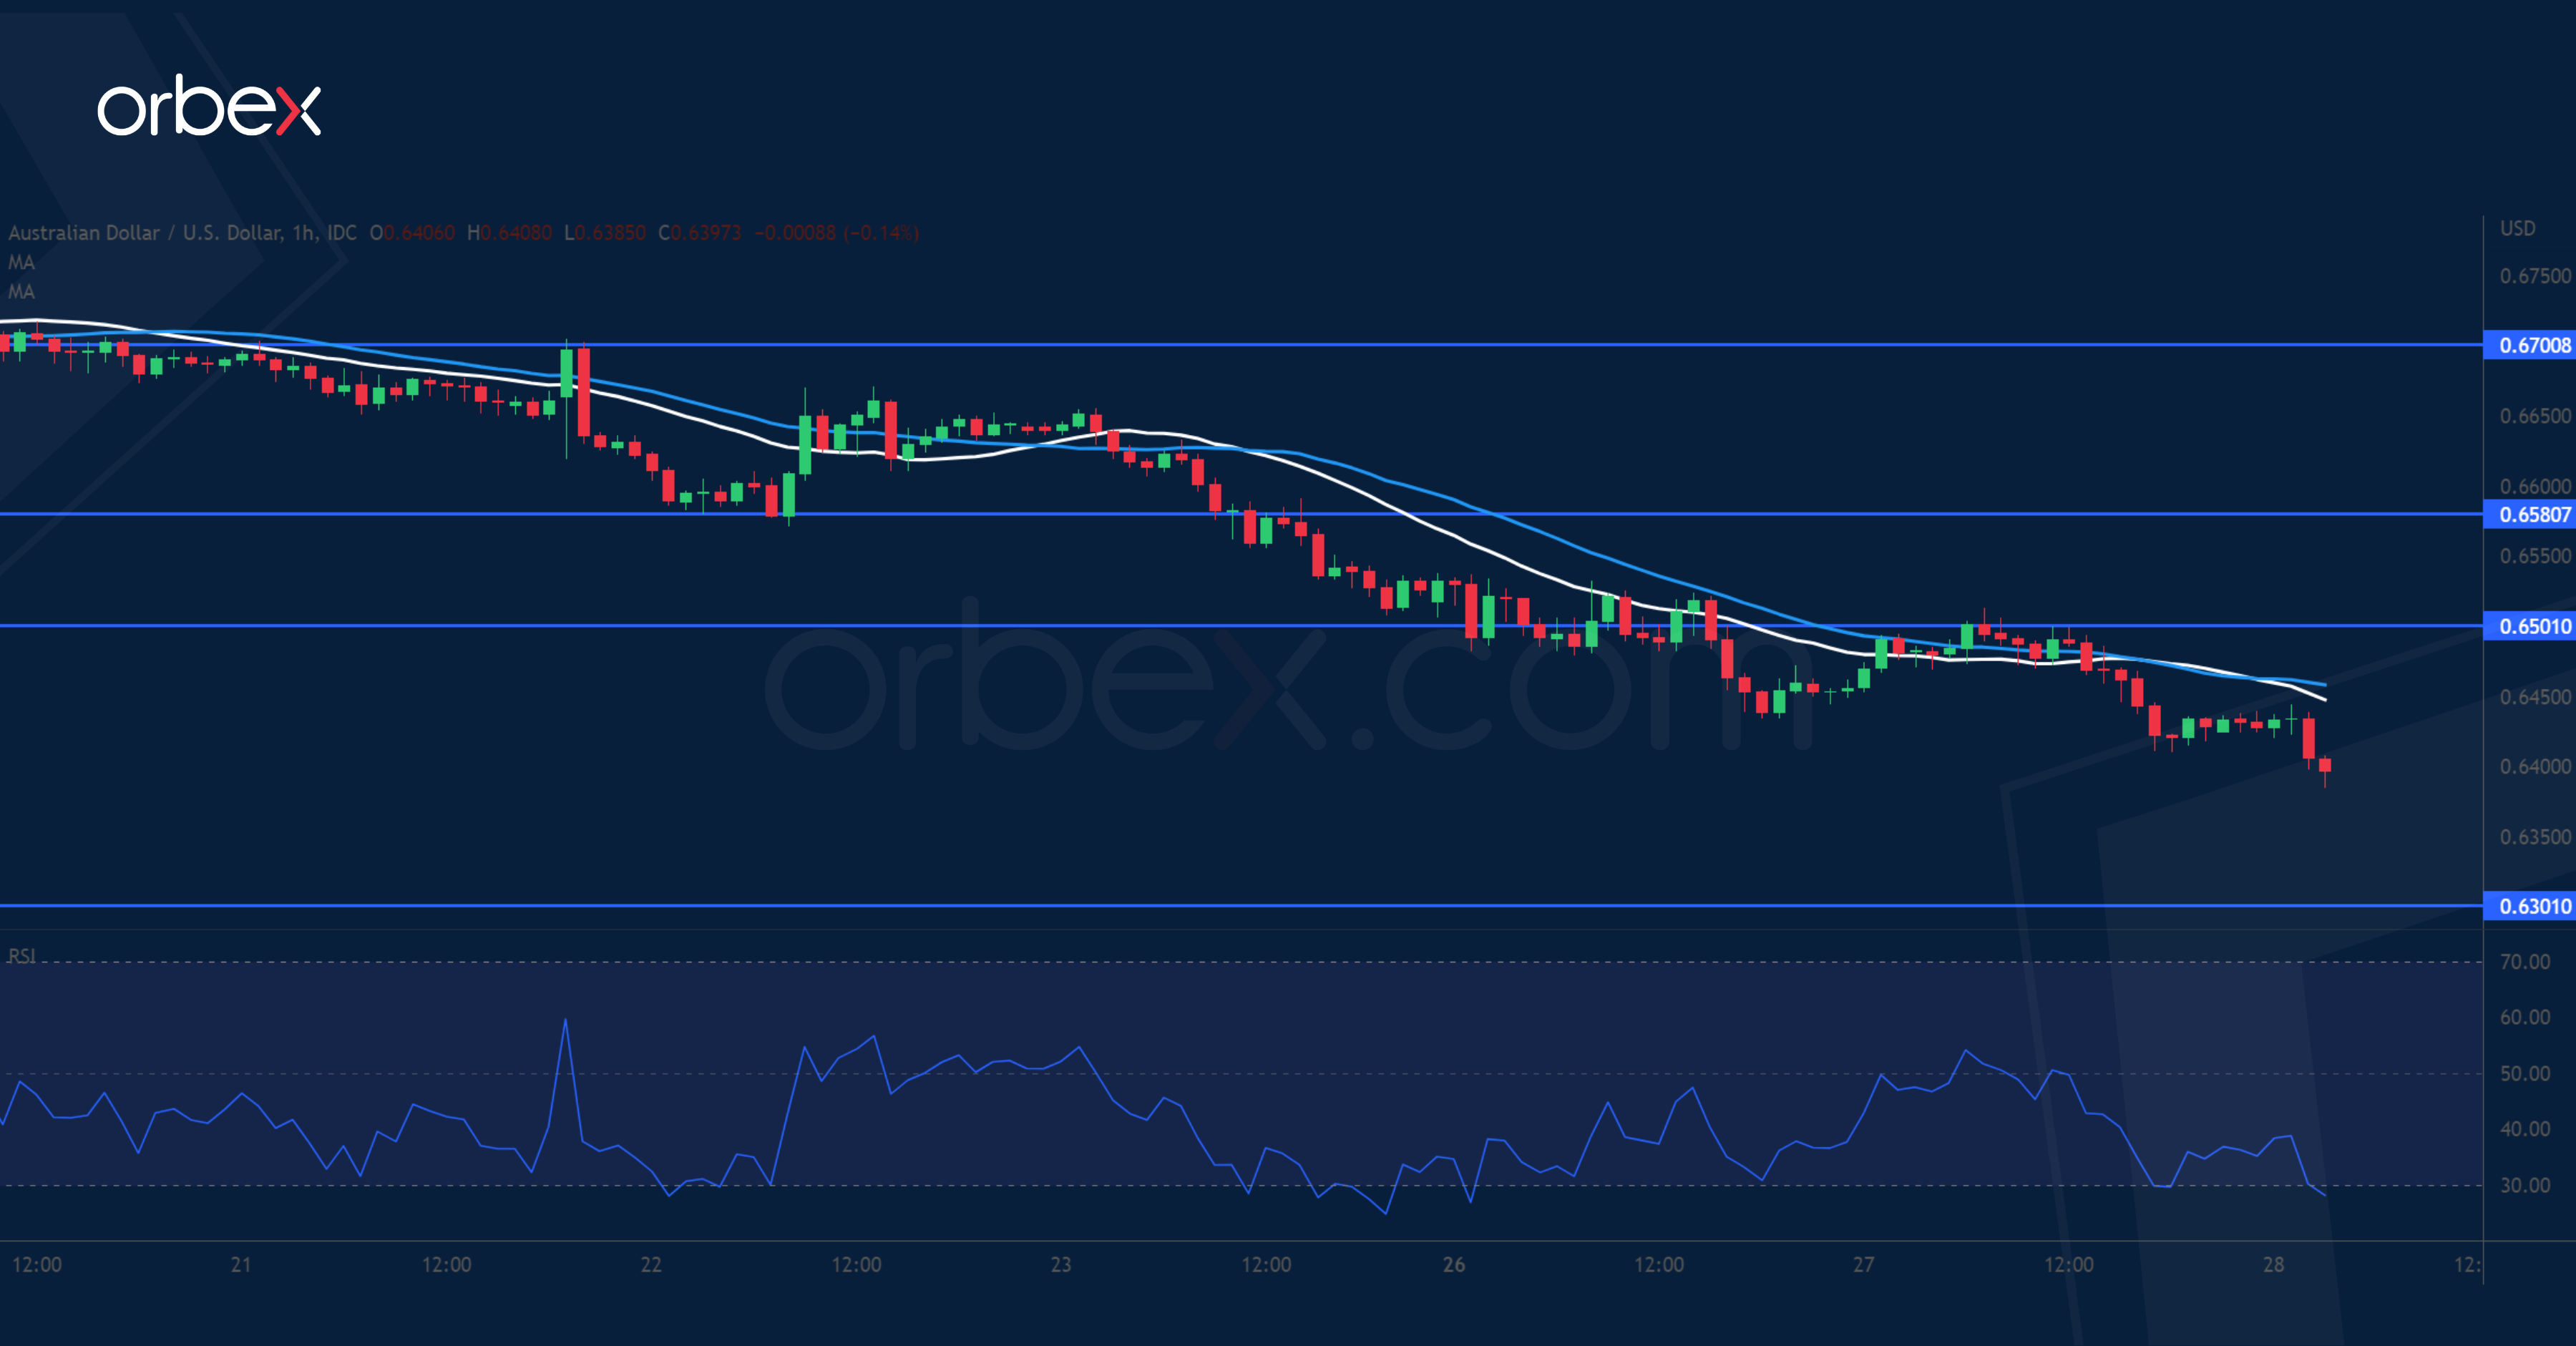
The Australian dollar falls as risk appetite remains subdued across assets. The pair went into a free fall after it broke last summer’s lows near 0.6700. The bearish mood still prevails and may continue to attract trend followers to depress the price action. 0.6300 is the next level to see whether the buy side could make its way back. The RSI’s oversold condition might cause a bounce and 0.6500 would be the first obstacle. The support-turned-resistance 0.6700 on the 20-day moving average could offer strong downward pressure.
USD/JPY Tests Key Resistance
The US dollar edged higher after Fed officials reiterated the need to keep tightening. The pair has recouped most of the losses from a previous liquidation, which suggests solid buying interest at 140.50 along the 30-day moving average. The peak at 145.90 is a key resistance and its breach could resume the rally towards August 1998’s high at 147.60. From the daily chart’s perspective, sentiment remains upbeat and the bulls may see pullbacks as opportunities to stake in. 143.60 is the first level should this happen.
No Letting Uup
It would appear we're in for another day of risk-off trade, with parts of Asia recording heavy losses and Europe opening on the backfoot.
Fear of tightening-induced recessions has wiped out the recovery we saw in stock markets over the bulk of the summer as investors were once again burned by an over-eagerness to catch the bottom in the market despite there being little evidence of it being justified.
That fear has now gripped the markets and we may see a little more caution going forward as the Fed has made clear that one inflation reading doesn't make a trend and it will take a lot more than that to convince it that it can afford to ease off the brake. Other central banks may have a lot more work to do; one in particular springs to mind, thanks to the misguided direction the government is taking the country in.
IMF adds to scathing attacks on UK mini-budget
The negative response to the UK's "mini-budget" has continued with the IMF adding their voice to the chorus of scathing attacks on the country's fiscal plans. It appears everyone is unusually united in their objection to the Treasuries tax-cutting plans at a time when inflation is almost 10% and rising.
The IMF was particularly forthright in its criticism of the debt-funded and untargeted measures, urging the government to re-evaluate during the budget event in November as current measures simply increased inequality.
Moody's was equally scathing warning that the measures are a credit negative that could threaten the country's credibility with investors and more permanently weaken the UK's debt affordability. It's no surprise then to see sterling plummet once more alongside Kwasi Kwarteng and Liz Truss' credibility on the world stage. Not the best start to life in Downing Street.
BoJ not ready to tighten despite weak yen
The BoJ minutes showed little inclination among board members to change course despite ongoing pressure on the currency and core inflation that is currently above target. The belief remains that temporary commodity inflation is responsible and therefore not sustainable although board members did acknowledge that they see price increases broadening with one even suggesting there's a stronger chance of sustained inflation backed by higher wages. A small step in the right direction but a step at least.
Of course, it's not one that changes the near-term outlook for Japanese monetary policy and so the pressure will remain on the yen as long as the dollar remains king.
Oil rebound brief as gas spikes amid sabotage on Nord Stream pipelines
Oil prices rebounded on Tuesday but that proved to be only a brief correction as economic doom and gloom has driven them lower again this morning. With Brent trading only a little above $80 and WTI below, you have to wonder how much more OPEC+ will tolerate and the size of output cut they may be considering next week in light of the new economic outlook and price.
Gas prices have also been highly volatile in light of the latest developments on Nord Stream one and two. While the latter was never likely to come online and the former unlikely as flows have been gradually reduced to zero over the course of the year, the apparent act of sabotage on both kills any hope of additional gas along those routes. The question for many is therefore what the sabotage sought to achieve, occurring around the inauguration of a pipeline that will deliver Norwegian gas to Poland.
Gold slipping again on a stronger dollar Gold is falling again as yields rise and the dollar rallies once more on Wednesday. The yellow metal has been hammered by the repricing of interest rate expectations recently and is now threatening to break below $1,620, with support next appearing around $1,600. It's now fallen more than 20% from its highs this year and could have further to go yet before we see peak inflation and rates priced into the market.
Bitcoin's show of resilience was short-lived
Bitcoin was showing remarkable resilience at one point on Tuesday, trading more than 5% higher and comfortably outperforming the broader market in a manner that was very impressive. Unfortunately, it didn't last long and actually ended the day in negative territory before slipping another 2% this morning. On the one hand, the risk environment is very unfavourable but we are seeing substantial support around $17,500-18,500. If that can hold, the rebound could be strong. The question is how long can it hold out if risk assets continue to head lower.
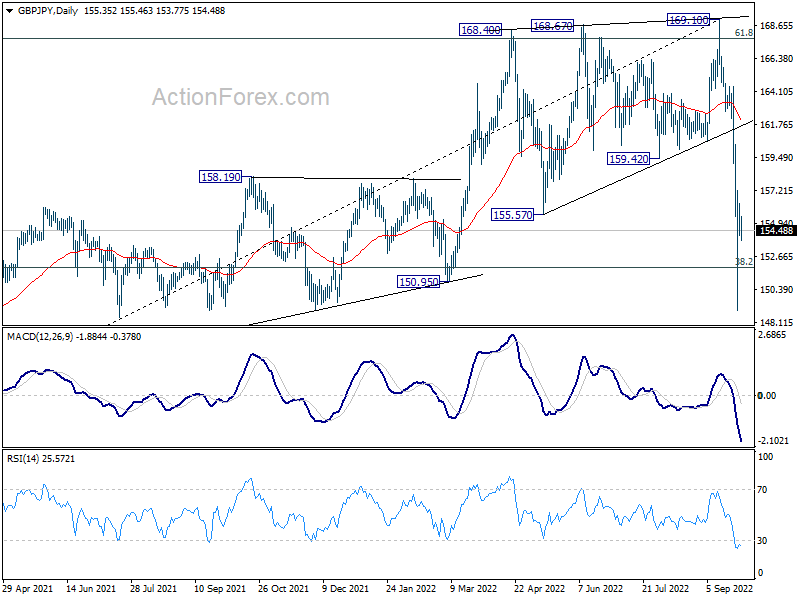
GBP/JPY Daily Outlook
Daily Pivots: (S1) 154.26; (P) 155.32; (R1) 156.49; More...
Intraday bias in GBP/JPY stays neutral as consolidation from 148.93 is still in progress. For now, risk will stay on the downside as long as 160.64 support turned resistance holds. Break of 148.93 will resume the decline from 169.10 towards 141.19 fibonacci level.
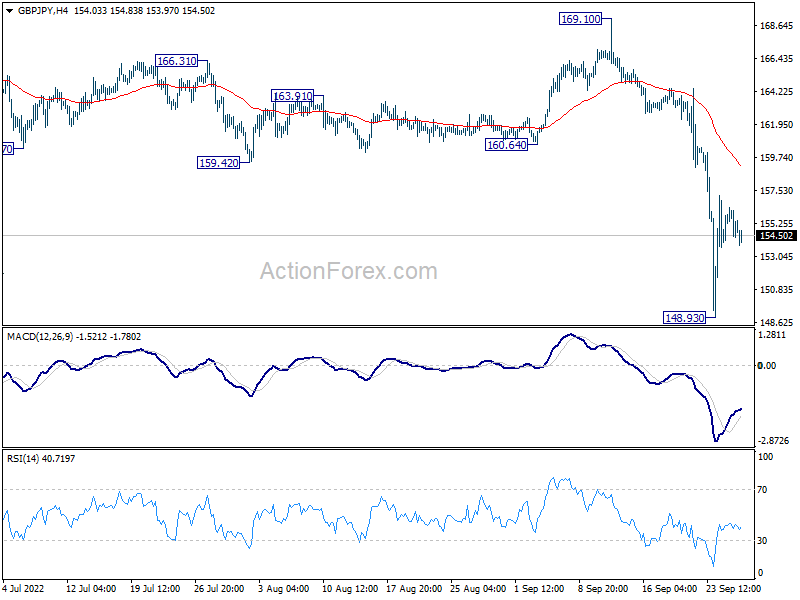
In the bigger picture, rise from 123.94 (2020 low) has completed at 169.10. 38.2% retracement of 123.94 to 169.10 at 151.84 is already met, and there could be some support from there for rebound. But risk will now stay on the downside as long as 169.10 resistance holds. Sustained trading below 151.84 will target 61.8% retracement at 141.19.