Sample Category Title
Eurozone PMI composite dropped to 48.2, recession on the cards
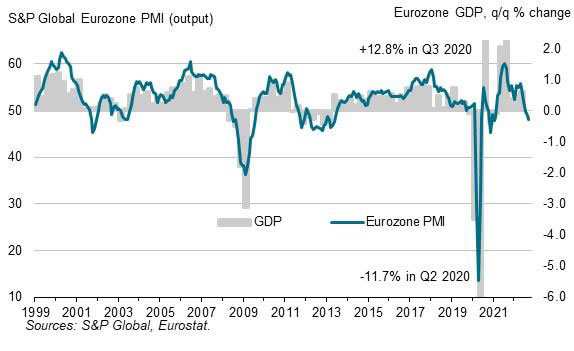
Eurozone PMI manufacturing dropped from 49.6 to 48.5 in September, a 27-month low. PMI services dropped form 49.8 to 48.9, a 19-month low. PMI composite dropped from 48.9 to 48.2, a 20-month low.
Chris Williamson, Chief Business Economist at S&P Global Market Intelligence said: "A eurozone recession is on the cards as companies report worsening business conditions and intensifying price pressures linked to soaring energy costs.
"The early PMI readings indicate an economic contraction of 0.1% in the third quarter, with the rate of decline having accelerated through the three months to September to signal the worst economic performance since 2013, excluding pandemic lockdown months."
Germany PMI manufacturing dropped to 27-mth low, services to 28-mth low
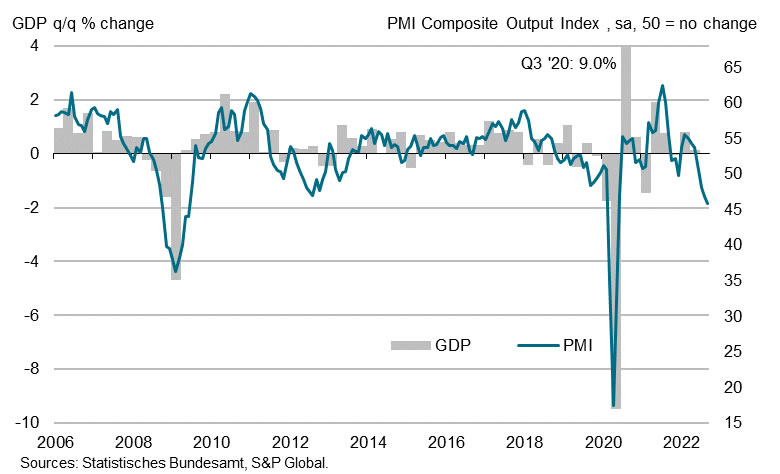
Germany PMI Manufacturing dropped from 48.3 to 49.1 in September, a 27-month low. PMI Services dropped from 47.7 to 45.4, a 28-month low. PMI Composite dropped from 46.9 to 45.9, a 28-month low.
Phil Smith, Economics Associate Director at S&P Global Market Intelligence said:
"The German economy looks set to contract in the third quarter, and with PMI showing the downturn gathering in September and the survey's forward-looking indicators also deteriorating, the prospects for the fourth quarter are not looking good either.
"The deepening decline in business activity in September was led by the service sector, which has seen demand weaken rapidly as customers pull back on spending due tightening budgets and heightened uncertainty about the outlook.
"Whilst constraints on manufacturing output from material shortages looked to have eased somewhat, resulting in a shallower decline production levels in September, goods producers like their service sector counterparts have nevertheless grown increasingly concerned about activity in the coming months, with the energy crisis stoking recession fears.
"Just when it looked like underlying inflationary pressures might be easing, a fresh surge in energy prices has seen business input costs rise at a faster rate for the first time in five months, in turn leading to a renewed acceleration in average prices charged for goods and services."
France PMI manufacturing dropped to 28-mth low, services improved
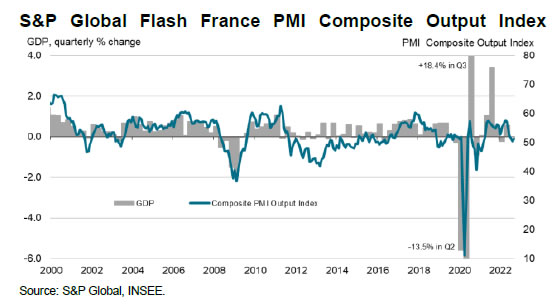
France PMI Manufacturing dropped from 50.6 to 47.8 in August, a 28-month low. PMI Services improved from 51.2 to 53.0. Overall, PMI Composite rose from 50.4 to 51.2.
Joe Hayes, Senior Economist at S&P Global Market Intelligence said:
"The upward movement in the Composite Output PMI should not take away from the clear message seen across the survey as a whole – the French economy is struggling. Weakness is its most striking in the manufacturing sector, where the downturn accelerated in September as overstocked warehouses, rapidly deteriorating demand for goods, heightened economic uncertainty and intense price pressures drove production volumes lower.
"Another worrying find from the latest survey was the pick-up in inflationary pressures, despite more evidence that supply stress is fading. According to surveyed firms, this reflected higher energy tariffs and wage bills. Energy security is a principal concern of companies as we head into the colder months across Europe.
"The overall improvement in September was services-driven as a renewed increase in new business supported a slight pick-up in activity growth. Nevertheless, trends in output and new orders on the services side were still subdued by historical standards. Given the large degree of weakness we're seeing in the manufacturing sector, it's likely that we'll see some of this spill over into services, thereby raising the risk of a recession in France."
USDCAD Unlocks Fresh 26-Month High
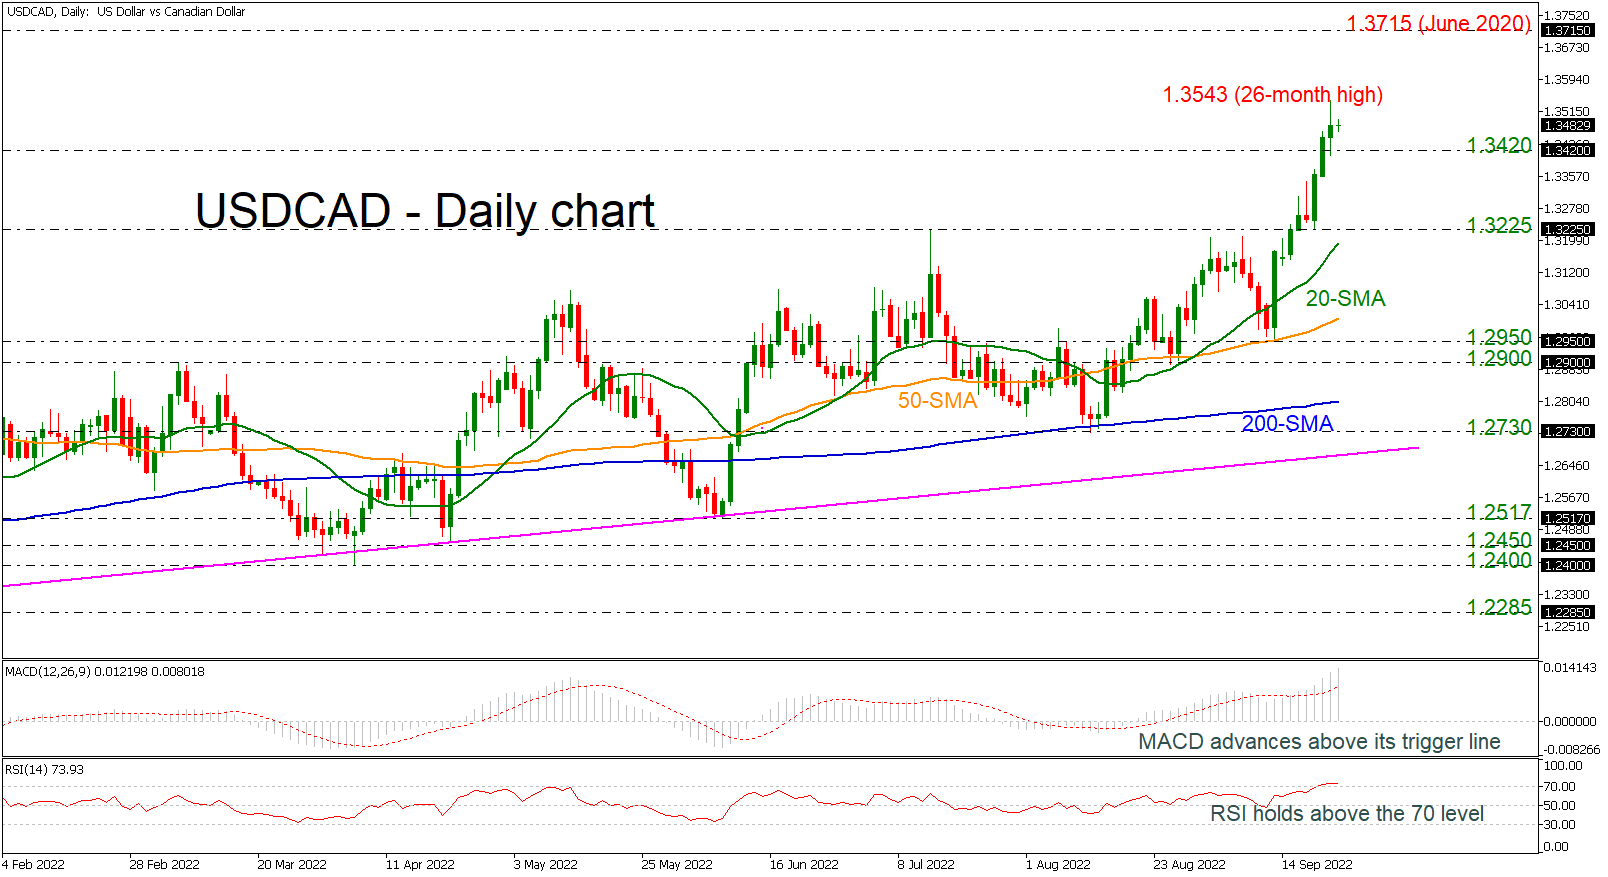
USDCAD skyrocketed to a higher high on yesterday’s session at 1.3543, which is a new 26-month peak. The pair looks to be creating a floor above the 1.3400 barrier while the RSI and the MACD oscillators are holding in overbought levels, suggesting that the next move may be to the downside.
Traders, however, would be more eager to buy if the price manages to surpass the nearby top at 1.3543. If this is successfully breached, then the rally may next rest somewhere near the 1.3715 resistance, taken from the peak in June 2020, while a closure above that level may push the market until the inside swing low of 1.3850, registered in April 2020.
On the flip side, the selling pressure could accelerate if the market deteriorates below the 1.3420 former strong support area. Such a move could next bring the 1.3225 key barrier under the spotlight, which if violated could trigger sharper losses probably towards the 20- and 50-day simple moving averages (SMAs) at 1.3190 and 1.3010 respectively.
Summarizing, USDCAD is expected to show improvement if the price overcomes the latest high. On the other hand, a sharp selling interest beneath the 200-day SMA and the long-term uptrend line is required to switch the outlook to negative.
USDCHF Outlook Unchanged Despite Fast Rally
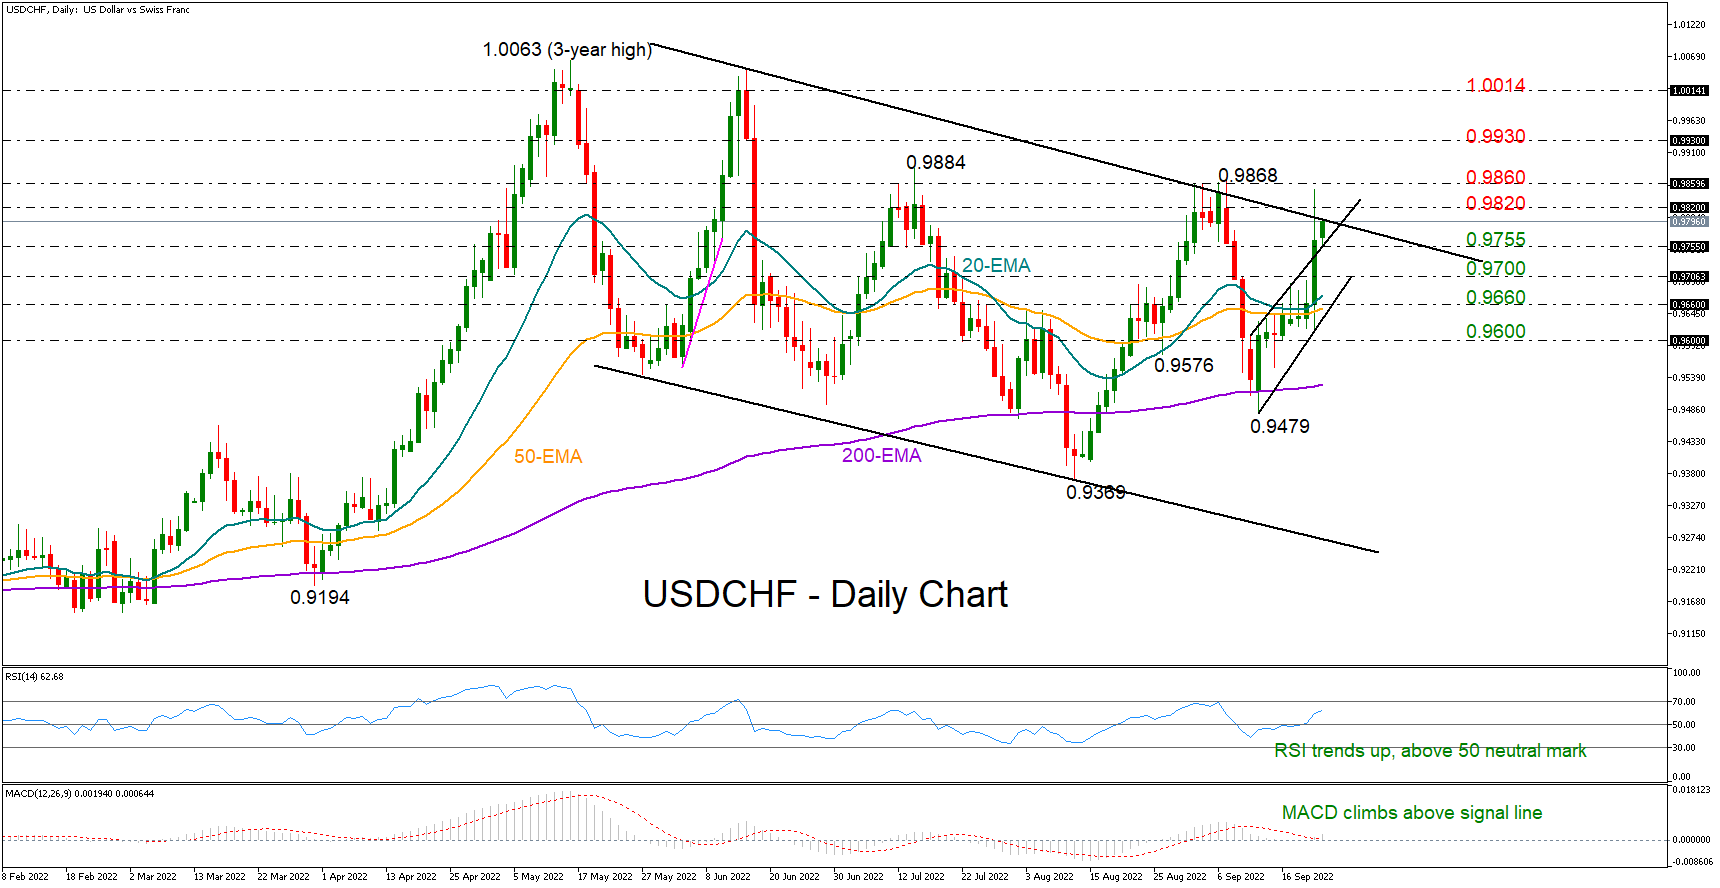
USDCHF experienced its most volatile daily session since June 2021 on Thursday, fluctuating vigorously between a low of 0.9619 and a high of 0.9849.
The pair managed to distance significantly above its exponential moving averages (EMAs), but the bullish fuel was not enough to exit the bearish-to-neutral trajectory in the medium-term picture, with the price closing below July’s high of 0.9668.
Nevertheless, with the RSI jumping decisively above its 50 neutral level and the MACD climbing back above its red signal line, there are hopes for further improvement in the market.
Encouragingly, the broken short-term resistance line drawn from mid-September is currently buffering downside pressures, adding to optimism that the pair may gain fresh impetus above the 0.9800 number and towards the key 0.9860 region. A clear step above the latter could lift the price up to 0.9930, while higher, all attention will turn to the crucial 1.0014 barricade.
In the event the pair pulls below the support trendline at 0.9755, the downfall could initially take a breather around the 0.9700 psychological mark before stretching towards the ascending trendline at 0.9660, where the 20- and 50-day EMAs also reside. Should the sell-off sharpen here, the next stop could be near the 0.9600 number.
All in all, Thursday's steep ascent in USDCHF has pushed the bias into the bullish area, but left the outlook fragile. To change that, the pair will need to run firmly above the 0.9820- 0.9860 zone.
EUR/USD: Euro Hits Mew 20-year Low, On Track for Further Losses
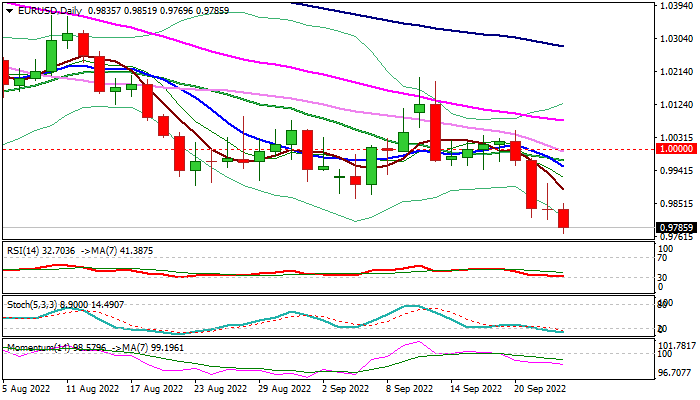
The Euro returns to red on Friday and extends below 0.98 handle, to hit new 20-year low after bears paused previous day, due to Japan’s intervention in FX market to support yen that temporarily deflated the dollar.
Thursday’s action ended in Doji candle with long upper shadow, which signaled that the upside remains well protected and bearish pressure persists.
Strong dollar and darkened economic outlook for the Eurozone weigh on the single currency, along with signals that the Fed remains on track for further large rate hikes.
Daily studies in full bearish setup add to negative stance, as the pair focuses net target at 0.9607 (Sep 2002 low).
Former low at 0.9864 (Sep 6) reverted to initial resistance, followed by 0.9900 and falling 10/20DMA’s (0.9953/0.9968 respectively) which also created a bear-cross and add to bearish structure.
Today’s key events will be releases of PMI figures from Germany and EU, with forecasts showing lower levels in September compared to previous month in both sectors and the numbers remaining well below 50 threshold which divides growth from contraction that adds to Euro’s negative near-term outlook
Res: 0.9851; 0.9864; 0.9900; 0.9953.
Sup: 0.9769; 0.9736; 0.9700; 0.9657.
USD/CAD: Cycle Triple Zigzag Likely to Complete Near 1.372
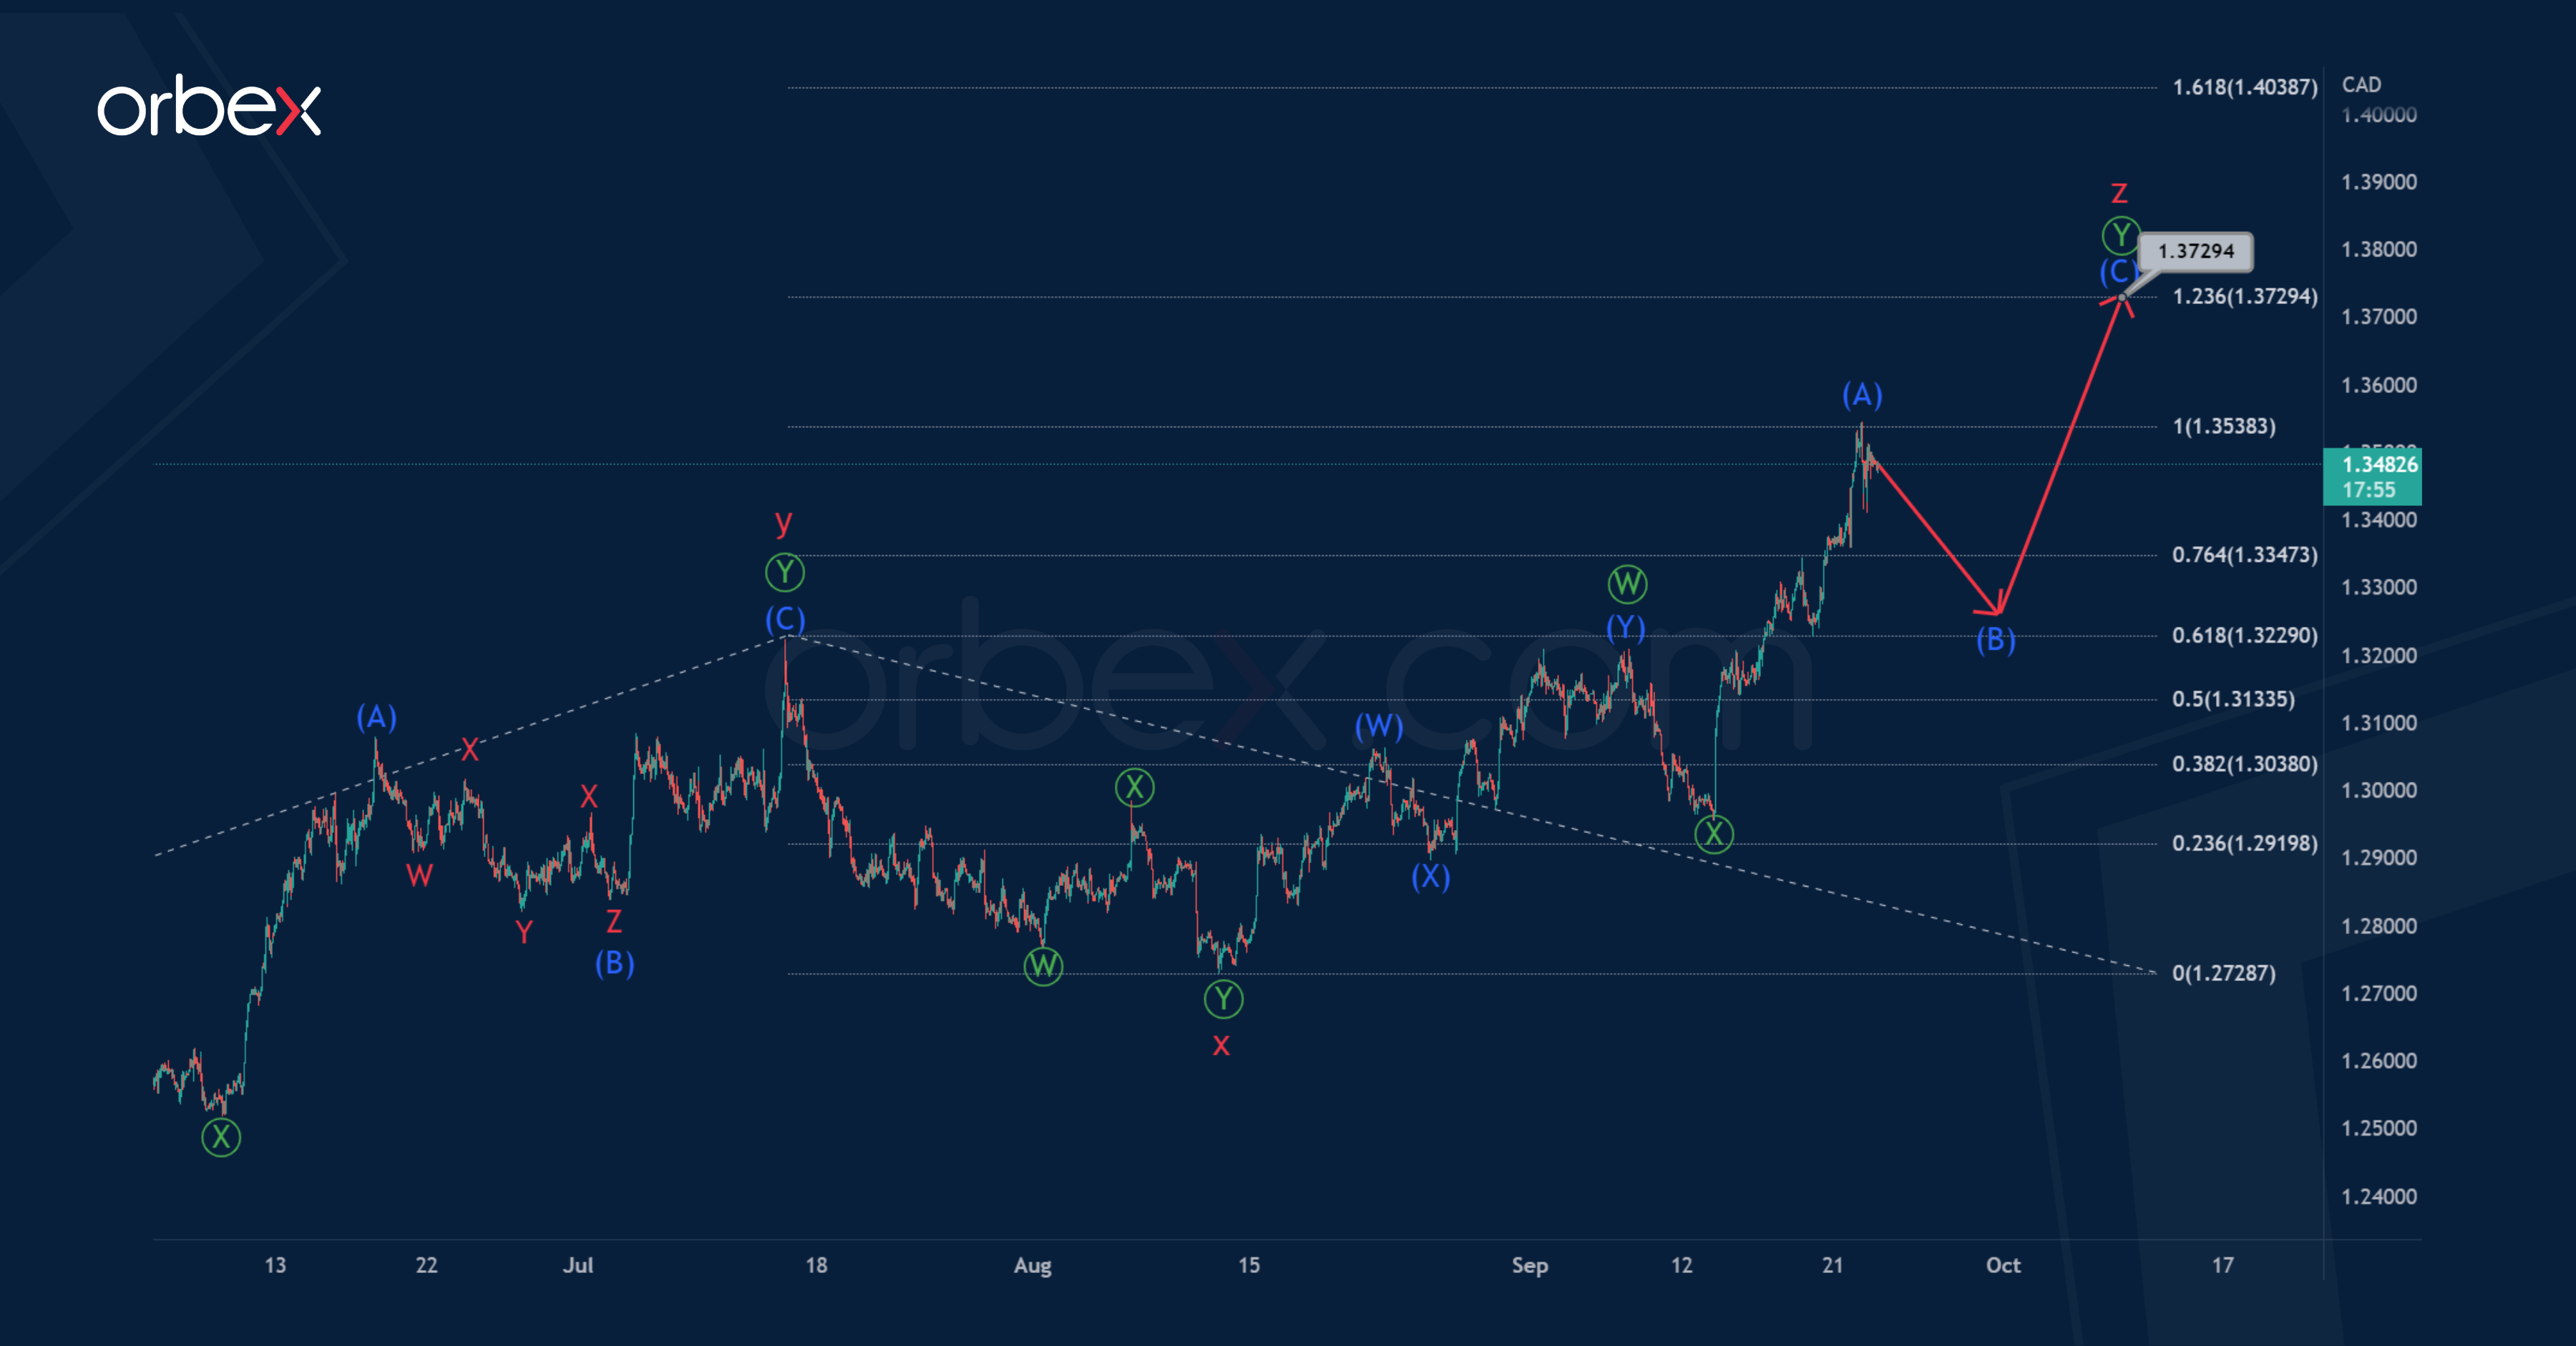
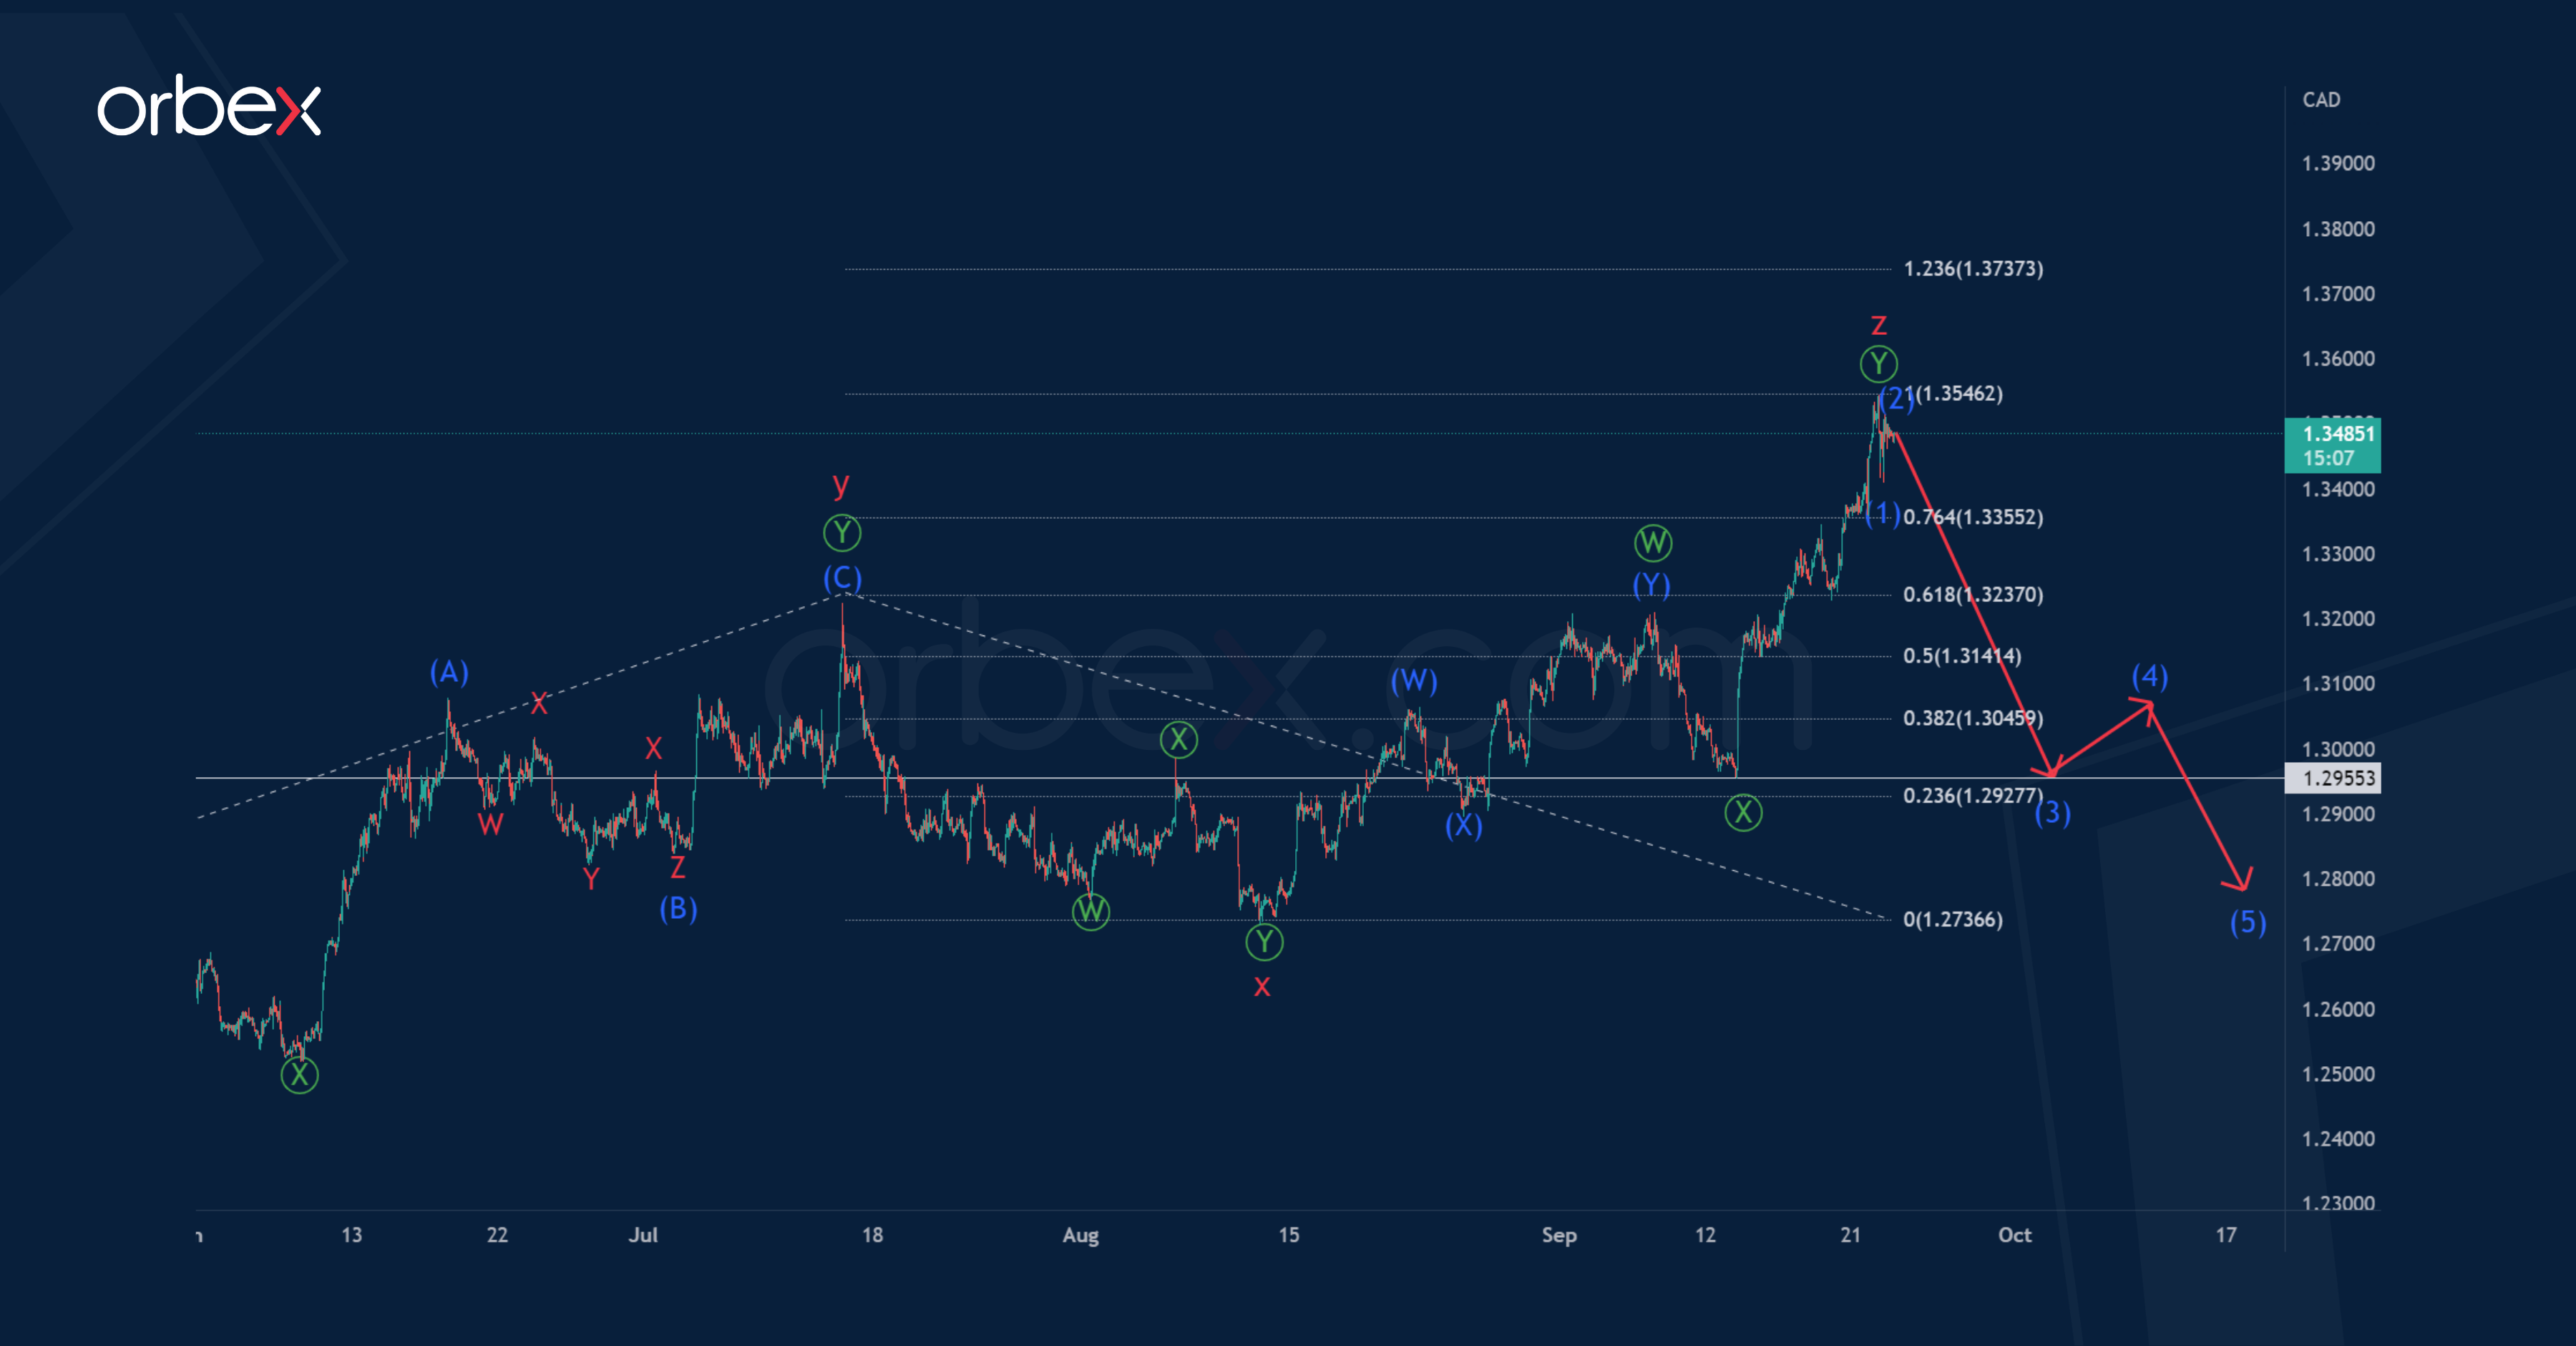
The current USDCAD timeframe shows the internal structure of a large correction pattern, which most likely takes the form of a cycle triple zigzag w-x-y-x-z.
Perhaps the first four parts are fully completed, and now the final actionary leg is being built – the sub-wave z. Apparently, the wave z takes the form of a primary double zigzag Ⓦ-Ⓧ-Ⓨ, where the sub-waves Ⓦ-Ⓧ have already been formed.
Thus, the last actionary primary wave Ⓨ may be under construction at the moment.
It may end in the form of a standard zigzag (A)-(B)-(C) near 1.372. At that level, cycle wave z will be at 123.6% of cycle wave y.
According to an alternative scenario, the formation of a cycle triple zigzag could be completed. Therefore, let's assume that the initial part of a new bearish trend is forming. We assume the construction of an intermediate impulse (1)-(2)-(3)-(4)-(5).
It is possible that the impulse (1) and bullish correction (2) have been fully completed today, and now we see a decline in the wave (3).
The target for bears is at the level of 1.295. This is the previous minimum, marked by the primary intervening wave Ⓧ. After reaching this level, a small corrective rise is expected within the bullish correction (4).
An approximate scheme of possible future movement is shown on the chart.
GBP/USD Takes a Breather
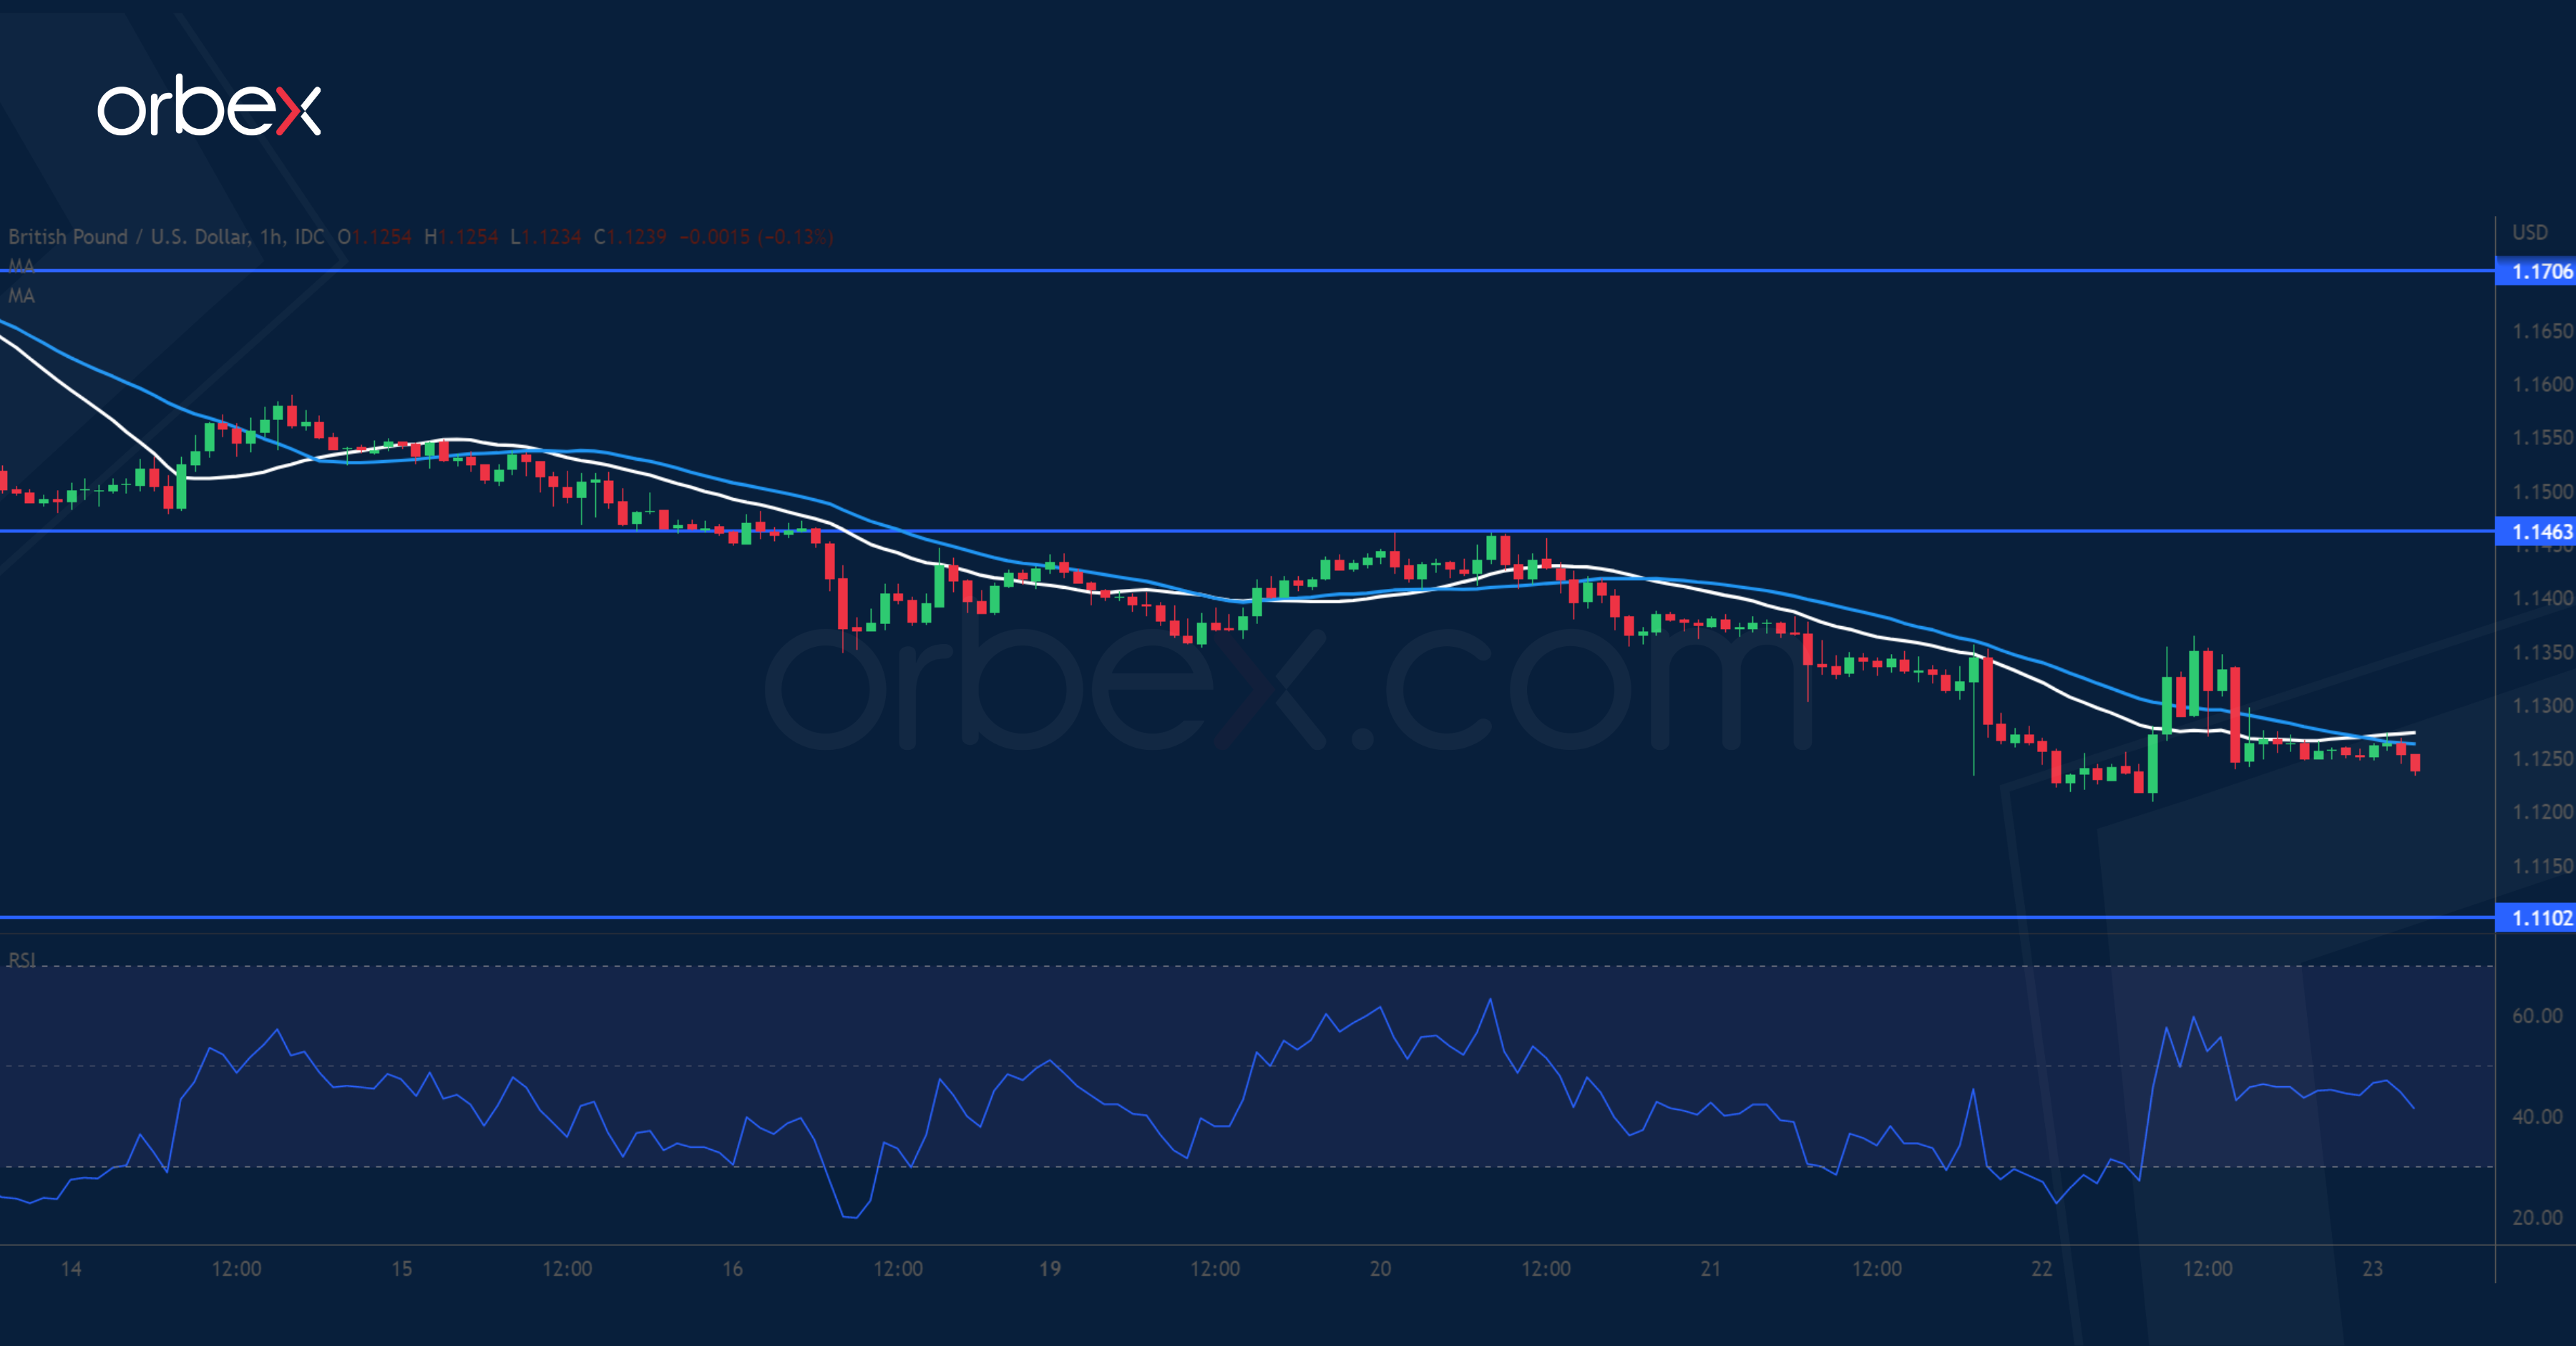
The pound slipped as the BoE raised its interest rate by a moderate 0.5%. The bearish inertia has taken a front seat after Sterling slipped through March 2020’s lows (1.1420). The RSI’s repeated oversold situations have led to a brief pullback. The former demand zone around 1.1460 has become a supply zone where the bears could be expected to get in at a better price. Sentiment may only turn around if the bulls manage to push past 1.1700, which means that the path of least resistance seems to be towards 1.1100 for now.
USD/CHF Tests Key Resistance
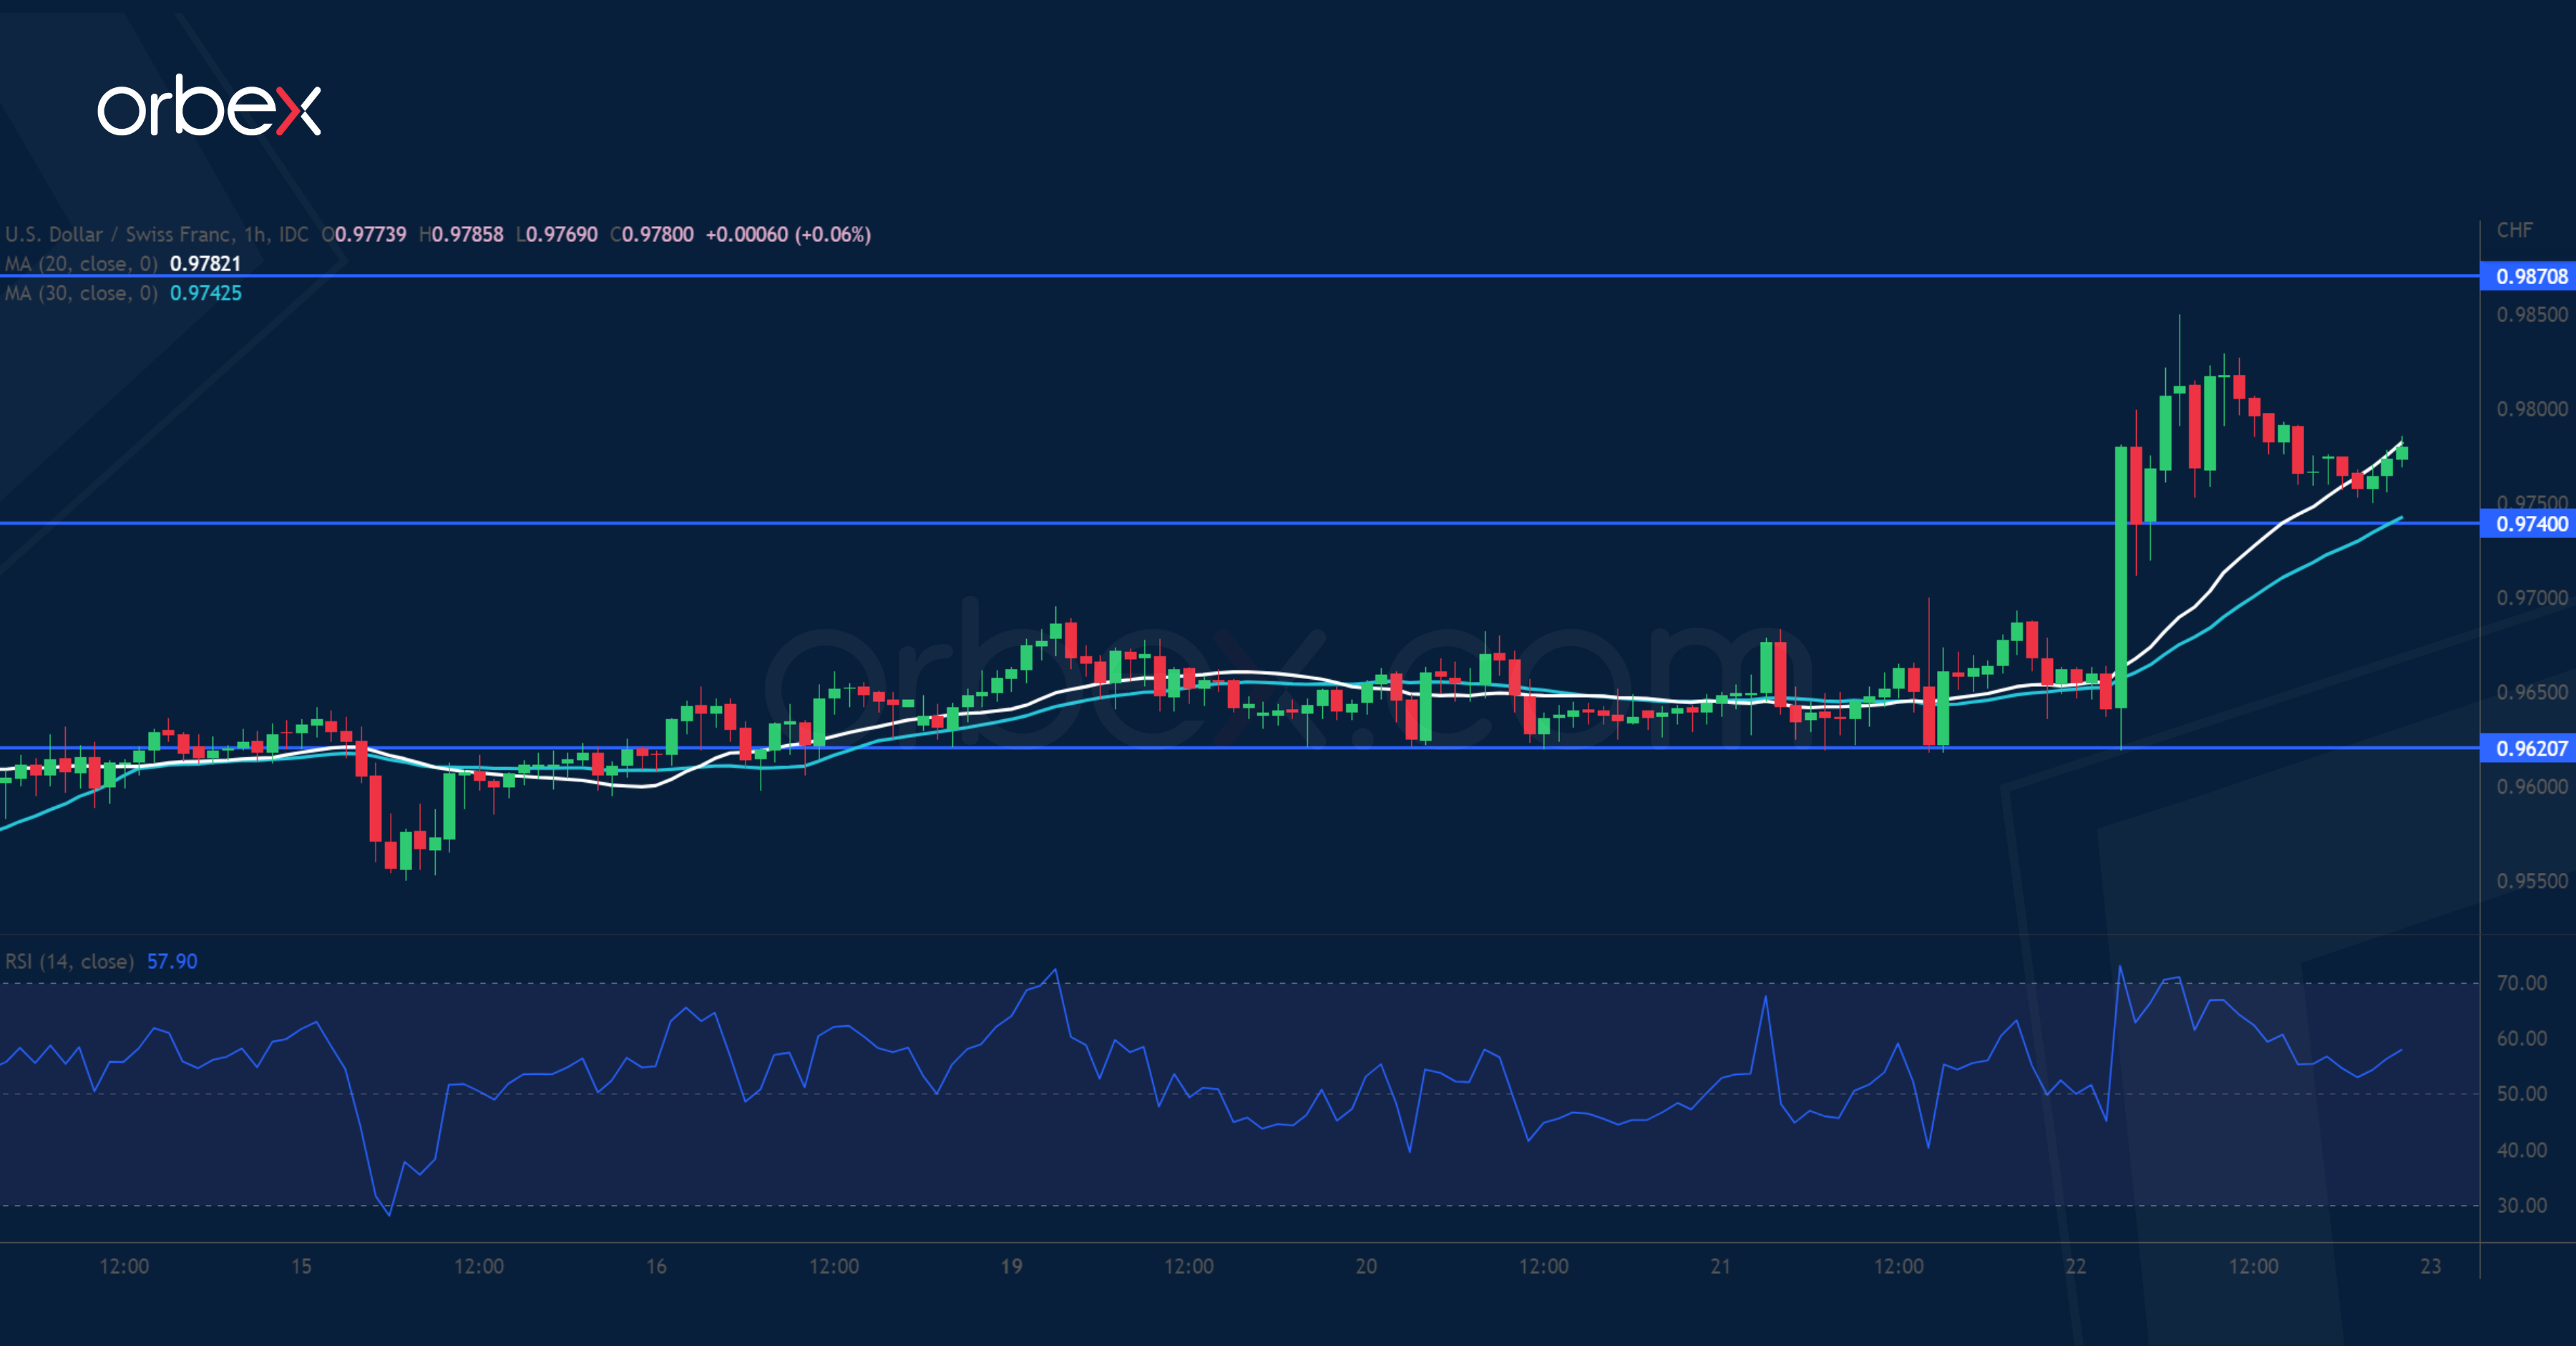
The Swiss franc fell after the SNB's hike came short of the 100bp previously priced in. A clean cut above the support-turned-resistance at 0.9690 is a sign of strong interest. The double top at 0.9870 is a major hurdle after the pair went into a four-month long consolidation. Its breach would help the dollar reclaim parity and open the door to the previous ceiling at 1.0050, a step closer to a bullish continuation. In the meantime, the RSI’s overbought condition might cause a limited retracement and 0.9740 would be the first support.
USD/JPY Pulls Back for Support
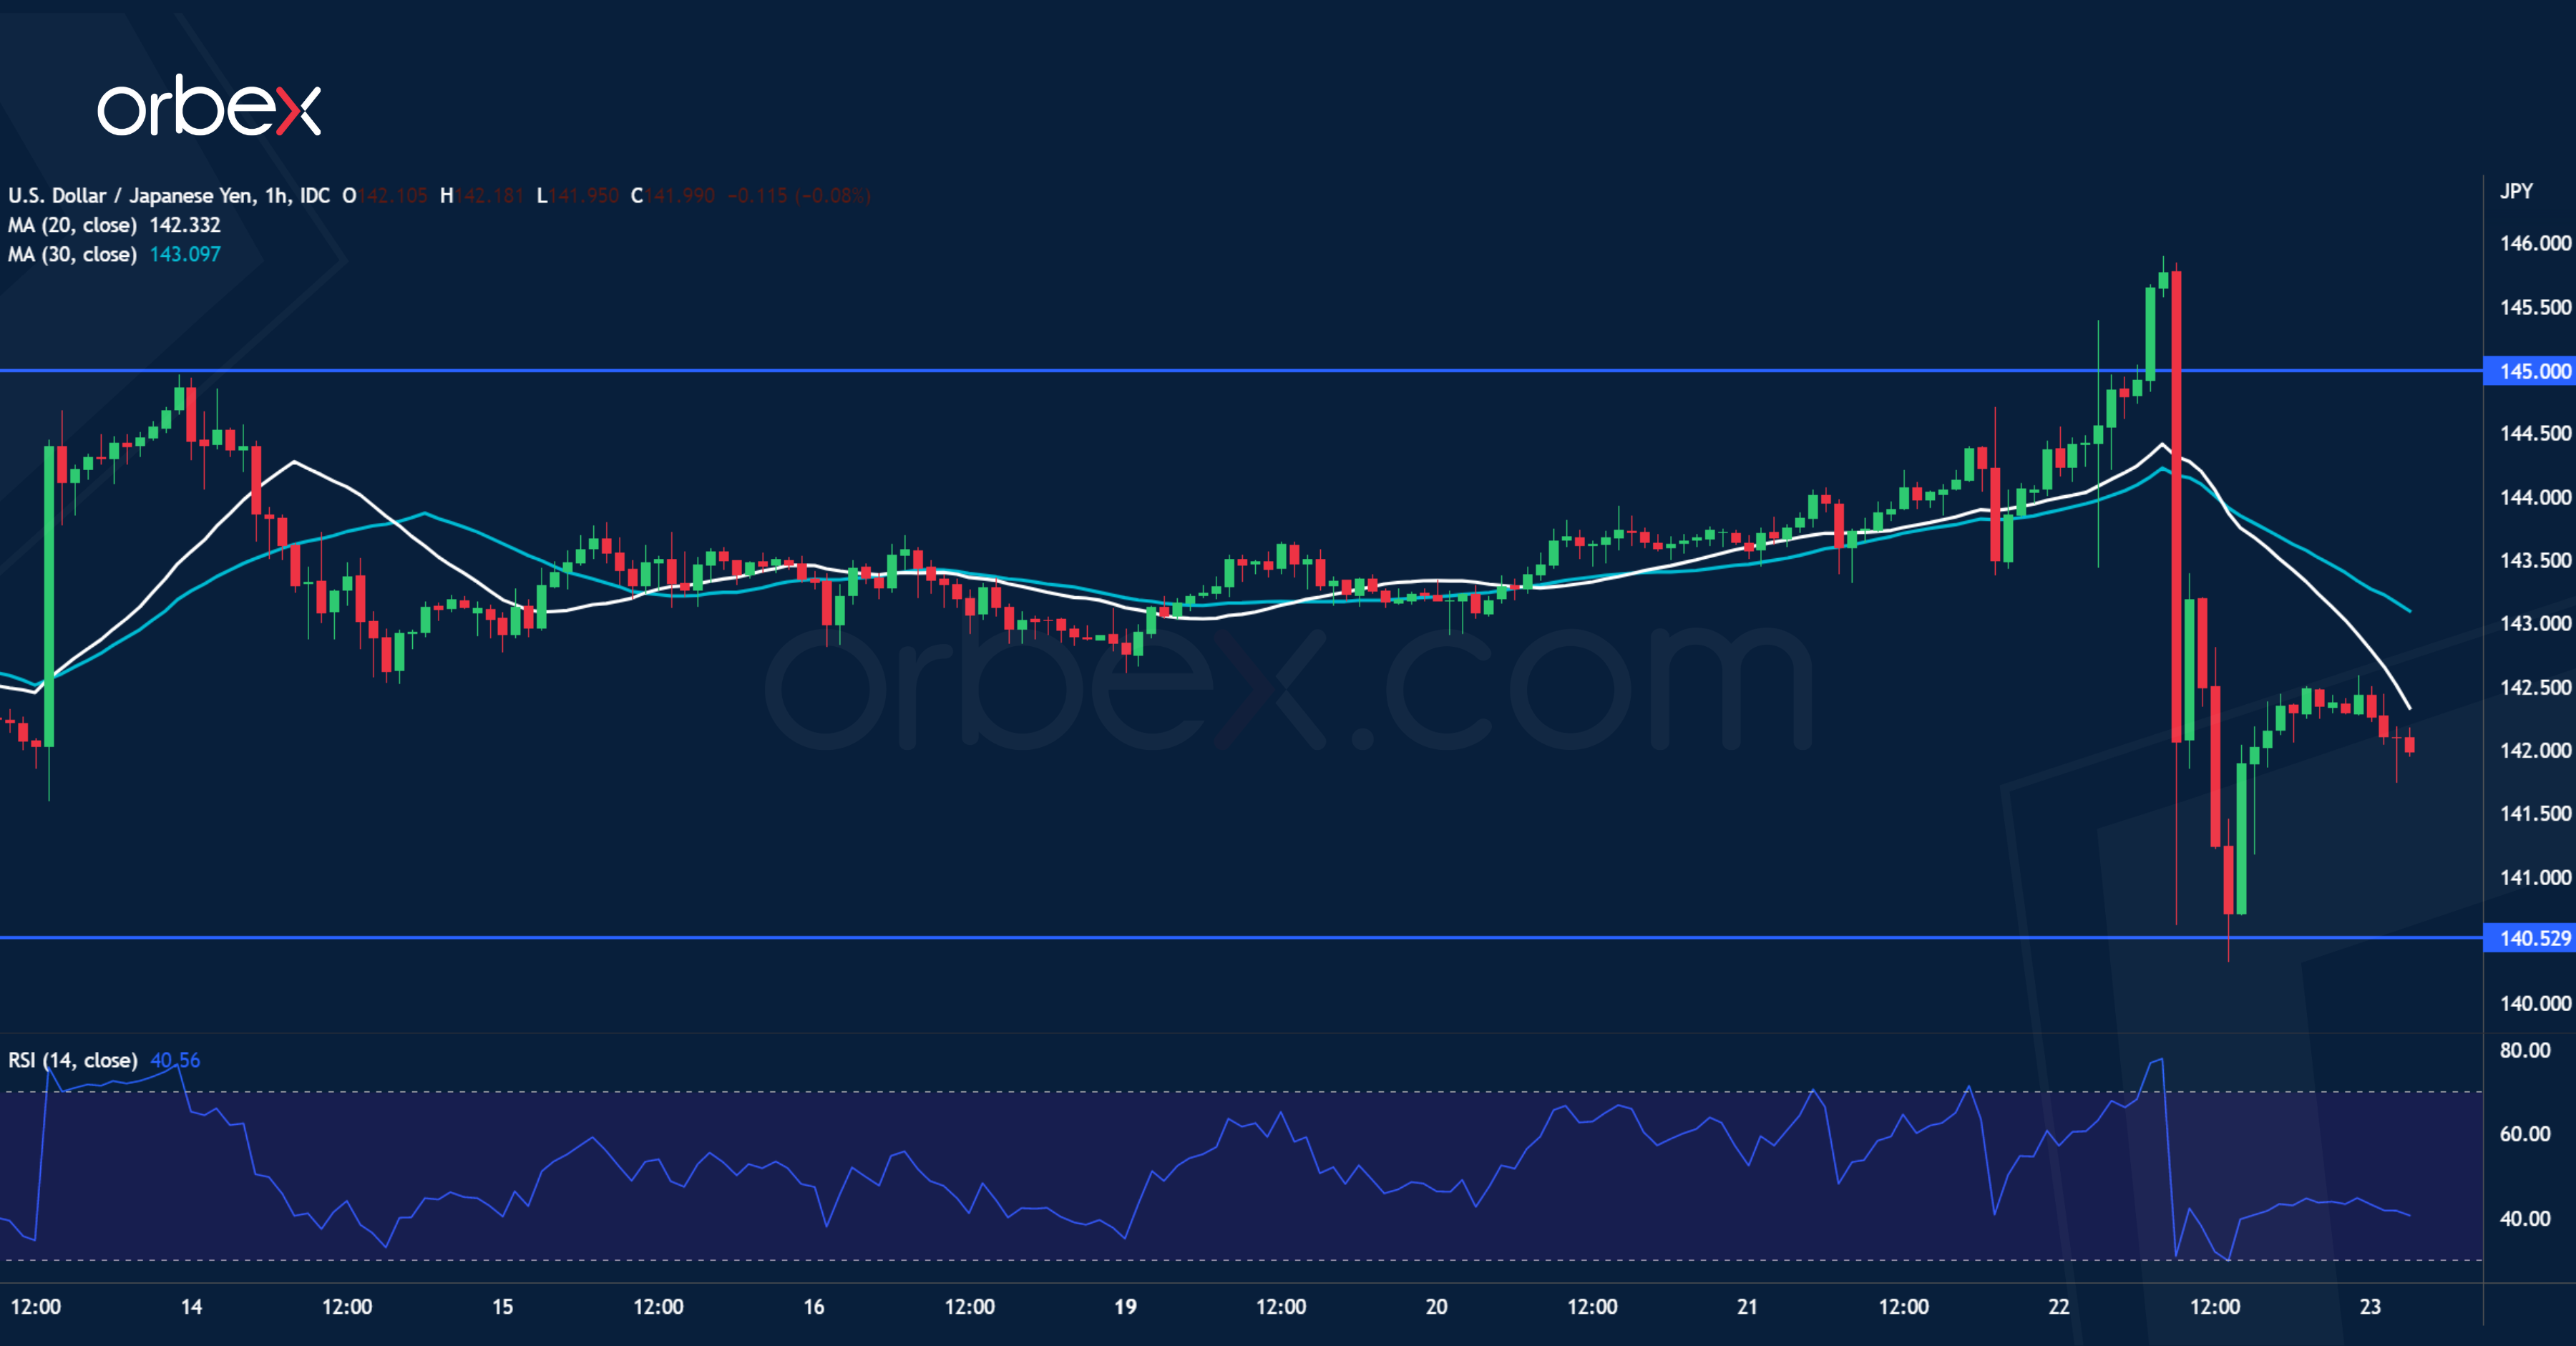
The Japanese yen skyrocketed following the first Japanese currency intervention in 24 years. The pair swiftly reversed its course after flirting with the psychological level of 145.00. A break below 143.50 triggered a liquidation of leveraged positions. 140.50 along the 30-day moving average is a key level to probe buyers’ interest. A bounce would signal that the greenback is merely taking a breather and the uptrend remains intact in the medium-term. A rally back above 145.00 may carry the price to August 1998’ high at 147.50.