

Sample Category Title
High US CPI Derails Risk Appetite
Market movers today
More focus on CPI today with inflation releases from both UK and Sweden (see below), where focus will be on the impact from high electricity prices.
US releases PPI which has shown signs of easing inflation pressure lately as commodity prices have come down and pricing power is weakening.
In the euro area industrial production for July is expected to drop 1.0% m/m reflecting the weakening industrial sector.
The 'State of the Union' speech President of the EU Commission Ursula von der Leyen could hold further details on how the EU is planning to tackle the energy crisis.
The 60 second overview
US CPI: The US August CPI surprised clearly to the upside yesterday, headline CPI rose only 0.1% m/m due to the lower gasoline prices, but core inflation clearly outpaced expectations at 0.6% m/m (July +0.3%, consensus +0.3%). Importantly, inflation pressures remain broad-based with both core goods and services inflation picking up.
Admittedly, shelter prices continue to explain a decent share of the current inflation (contribution to headline: +0.22%-points m/m), which we do expect to moderate as US housing market cools. In addition, several leading inflation indicators, including the NFIB small business price plans released yesterday, point towards easing price pressures. Nevertheless, with the upside surprise in core CPI, strong economic momentum and persistent labour shortages, Fed's 75bp hike next week looks like a done deal. Market is even pricing in around 30% chance of a 100bp hike, although if Fed wanted to guide the markets towards faster hiking pace, it would have to do so informally (as in June) due to the blackout period. While we think Fed will likely stick with the 75bp hike for now, yesterday's figures underline that Fed cannot afford to signal a 'pivot' anytime soon. Financial conditions have to be maintained at restrictive levels for longer in order to cool aggregate demand.
Sour risk appetite: The higher than expected US CPI immediately turned risk appetite around and heavy losses were seen in especially interest rate sensitive stocks such as tech. Nasdaq fell a stunning 5.2% and S&P 4.3% - the biggest one-day loss since June 2020. Credit spreads widened and EUR/USD almost instantly moved back below parity. 10Y UST yields moved some 15bp higher to 3.45% and the 2Y UST yield reached a 15 year high at 3.79% overnight.
The market moves were as strong as the number removed any market beliefs that a peak in inflation had been reached in August. For now, it effectively silenced the "peak in inflation is near camp' and removed any hopes that a peak in the Fed Funds rate is close. The inflation surprise also adds to the risk premium and uncertainty in all asset classes including the term-premium in the yield curve adding further upside to longer-dated yields.
One number can sometimes really make a huge difference for financial markets. The number yesterday was one of those. We would expect the moves seen yesterday to extend ahead of the September 21 FOMC. European equity futures remain in red this morning.
Oil: The sour risk appetite should normally push oil prices significantly lower especially as commercial oil stocks are expected to grow. However, media reports that the White House plans to start rebuilding strategic oil stocks supports prices. Back in March the Biden administration ordered a record 180 million barrel release from the strategic reserves that currently stand at 442 million barrels, its lowest level since 1984. Hence, the oil release decided in the spring to dampen oil prices and inflation is now adding to oil prices and inflation.
Equities: Markets in deep sell-off yesterday after the hotter-than-expected inflation print. US markets witnessed its sharpest drop in almost two years, with Nasdaq -5.2%, S&P 500, Dow and Russell 2000 around -4%. Valuation in focus with cyclicals - and especially growth cyclicals - underperforming. Tech naturally one of the worst performing sectors (FANMAG around -7%), underperforming health care by about 3p.p. Positioning impact was however milder as VIX rose but in line with last week. Similarly, credit spreads widened but less than the reaction in equities (HY -2%). US futures are rebounding slightly this morning.
FI: Yesterday's market reaction was all about the US CPI being stronger than expected. The euro curves mirrored the UST higher, where particularly the 5y to 10y point underperformed. Bund yields rose 7bp on the day while as the 10s30s curve flattened once again, the EUR swap 10s30s curve stands at almost -40bp.
FX: USD was the big outperformer in yesterday's session with the US inflation surprise and subsequent surge in USD real rates brining EUR/USD back below parity. In the other end of the spectre, the NOK had a horrible session in part driven by a poor Regional Network Survey and in part by the global investment environment. AUD, NZD and PLN also posted big losses while GBP more or less mirrored EUR price action found in the middle of the pack in FX majors space.
Credit: Credit market sentiment deteriorated on Tuesday, on the back of the slower than expected decline in US inflation. Itrax main widened 4bp to close at 108bp, while Itrax crossover widened by 17.9bp to close at 526.2bp. Primary market activity was still solid, but deal reception was slightly softer compared with Monday, as indicated by generally higher new issue concessions.
Nordic macro
Sweden: The electricity crisis and the skyrocketing electricity prices are in the spotlight when it comes to the inflation outlook. In August we expect consumer electricity prices to have risen whopping 35 % mom, which in itself will add 1.1 p.p. to CPI and CPIF. When it comes to core inflation, Swedish food prices recently appear to be rising faster than seen in the Euro area on average. Hence, food could continue to surprise on the upside. Clothing should bounce back as normal for August and the same applies to hotel/restaurant prices. After the holiday season we also expect a normal, but quite modest, drop in transportation and recreation prices. Our CPIF estimate is in the lower range of consensus at 8.8% yoy (1.3% mom) which is 1.3 p.p. above the Riksbank's 7.5% forecast. For core CPIF we expect 5.7% (0.4% mom), also in the lower end of the range but 1.1 p.p higher than the Riksbank's 5.7% estimate. Hence, the Riksbank's inflation forecast is outplayed as they admitted themselves and reflected in pricing indicating 82bp in September and 100bp in November (we look for two times 75bp).
EUR/USD Daily Outlook
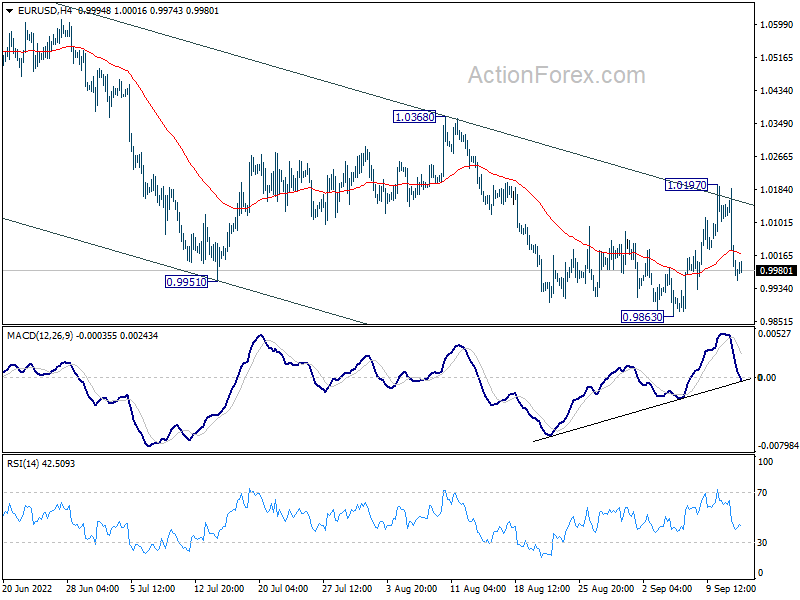
Daily Pivots: (S1) 0.9894; (P) 1.0040; (R1) 1.0114; More...
Intraday bias in EUR/USD is mildly on the downside for retesting 0.9863 low first. . Firm break there will resume larger down trend. On the upside, sustained trading above 55 day EMA (now at 1.0154) raise the chance of larger trend reversal, and target 1.0368 resistance.
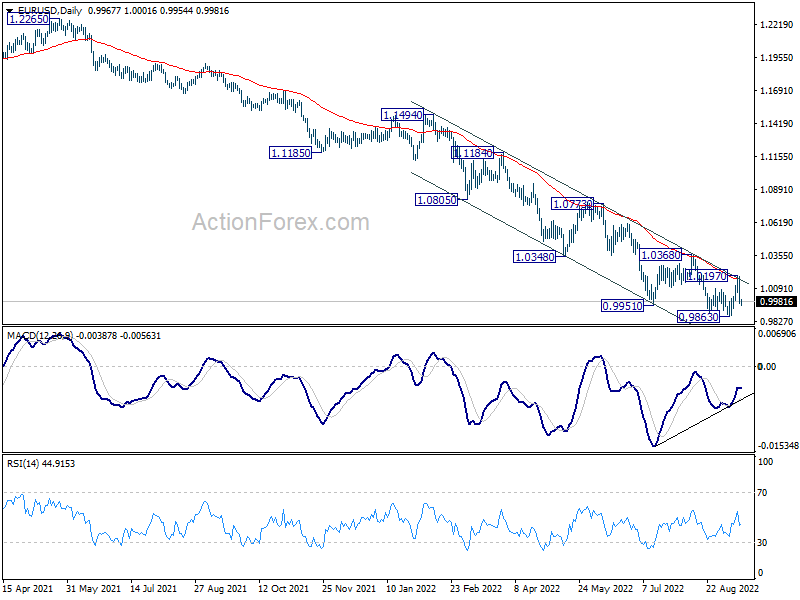
In the bigger picture, down trend from 1.6039 (2008 high) is still in progress. Next target is 100% projection of 1.3993 to 1.0339 from 1.2348 at 0.8694. In any case, outlook will stay bearish as long as 1.0368 resistance holds, in case of strong rebound. However, firm break of 1.0368 will confirm medium term bottom at 0.9863 already.
GBP/USD Daily Outlook
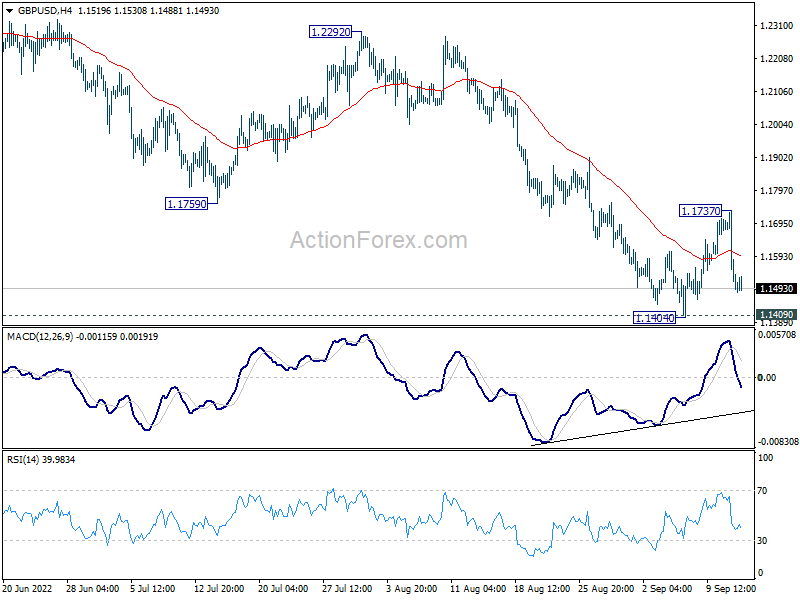
Daily Pivots: (S1) 1.1411; (P) 1.1574; (R1) 1.1657; More...
Intraday bias in GBP/USD is mildly on the downside for retesting 1.1404/9 support zone. Decisive break there will resume larger down trend. On the upside, above 1.1737 minor resistance will resume the rebound from 1.1404 to 55 day EMA (now at 1.1917).
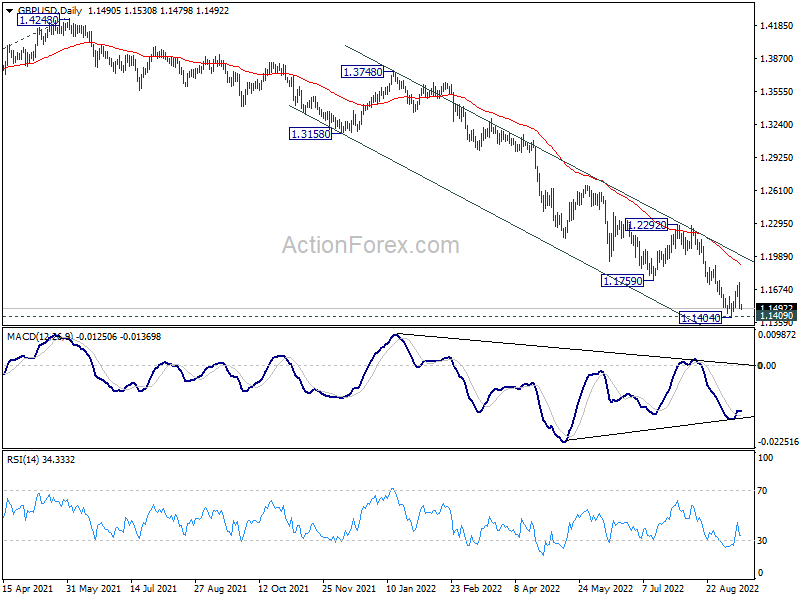
In the bigger picture, based on current momentum, fall from 1.4248 (2018 high) is probably resuming long term down trend from 2.1161 (2007 high). Sustained break of 1.1409 will target 61.8% projection of 1.7190 (2014 high) to 1.1409 (2020 low) from 1.4248 (2021 high) at 1.0675. This will remain the favored case for now as long as 1.2292 resistance holds.
USD/CHF Daily Outlook
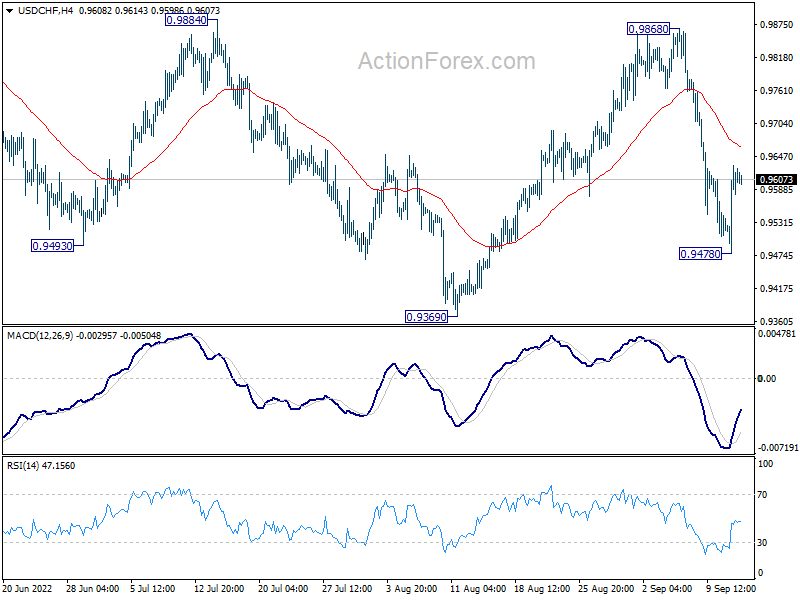
Daily Pivots: (S1) 0.9522; (P) 0.9577; (R1) 0.9675; More...
Intraday bias in USD/CHF remains neutral fist. Overall, it's still in corrective pattern from 1.0063. Below 0.9478 will extend the fall from 0.9868 towards 0.9369 support. On the upside, firm break of 4 hour 55 EMA (now at 0.9664) will target 0.9868 resistance first. Further break there will argue that larger up trend is ready to resume through 1.0063.
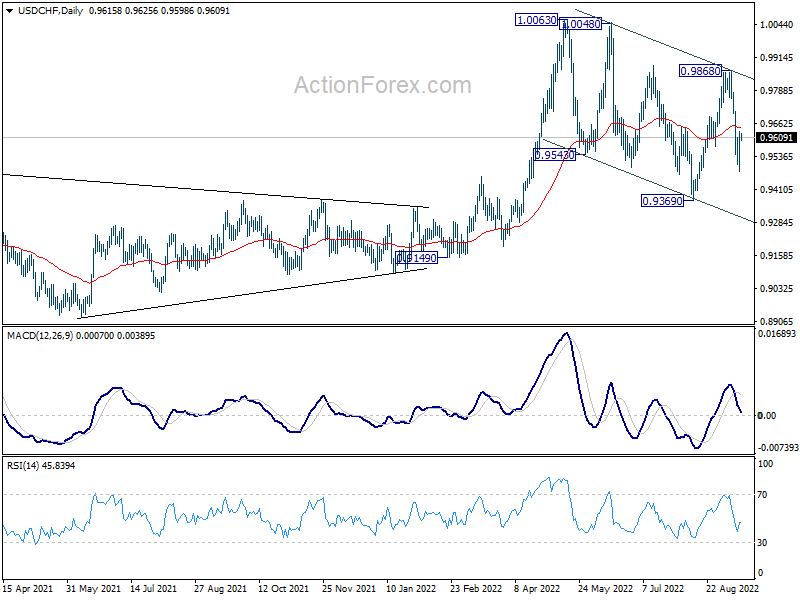
In the bigger picture, current development suggests that up trend from 0.8756 (2021 low) is still in progress. Sustained break of 1.0063 will target 100% projection of 0.9149 to 1.0063 from 0.9369 at 1.0283, and then 1.0342 (2016 high). For now, this will remain the favored case as long as 0.9369 support holds, even in case of deep pull back.
USD/JPY Daily Outlook
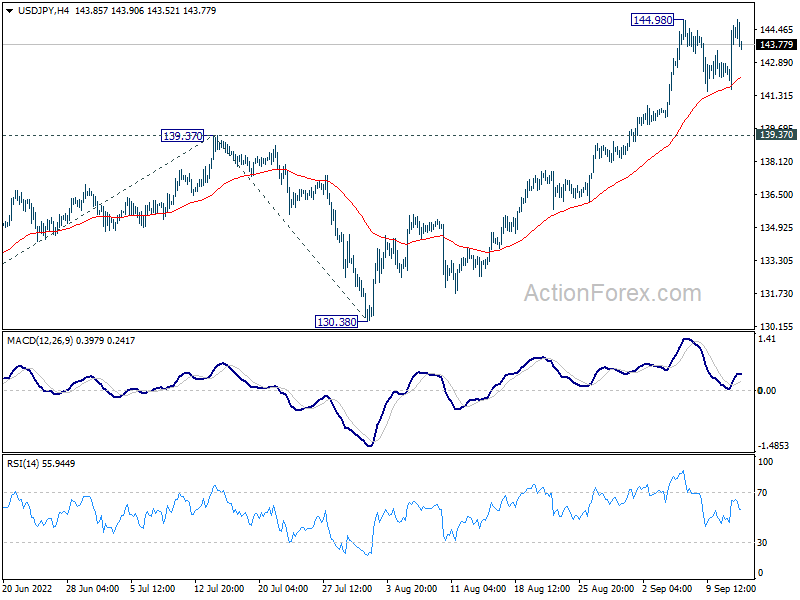
Daily Pivots: (S1) 142.59; (P) 143.63; (R1) 145.61; More...
Intraday bias in USD/JPY remains neutral first. Consolidation from 144.98 could still extend. But downside should be contained by 139.37 resistance turned support. On the upside, break of 144.98 will resume larger up trend to 147.68 long term resistance. Break there will target 161.8% projection of 126.35 to 139.37 from 130.38 at 151.44 next.
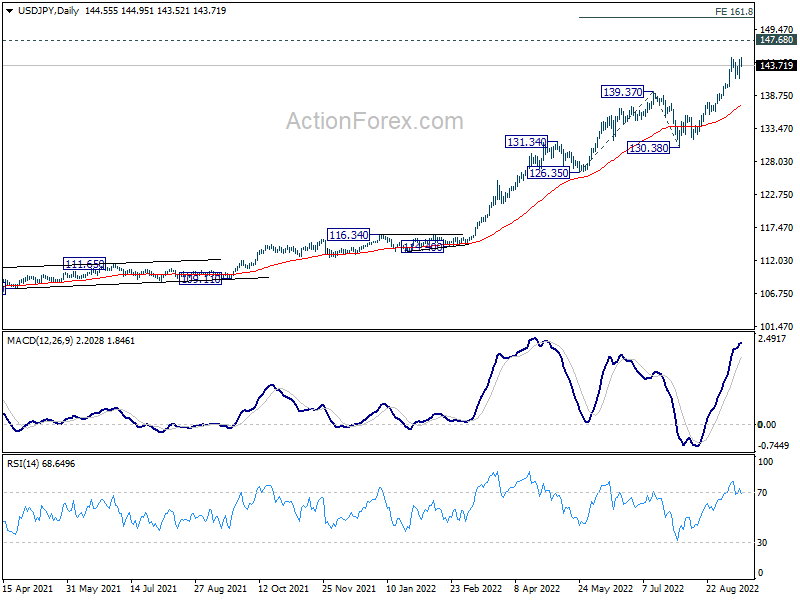
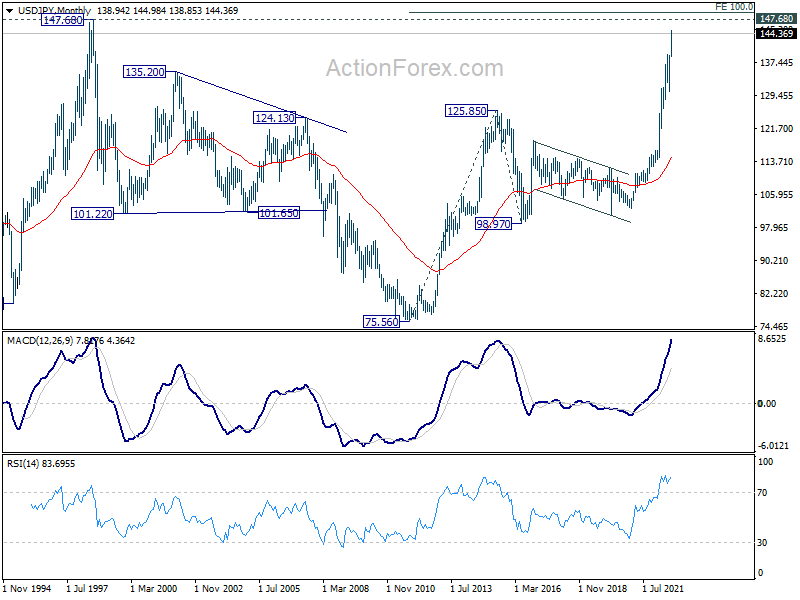
In the bigger picture, up trend from 101.18 is still in progress, as part of the whole up trend from 75.56 (2011 low). Further rise should be seen to 147.68 (1998 high). For now, break of 130.38 support is needed to be the first indication of medium term topping. Otherwise, outlook will stay bullish even in case of deep pull back.
AUD/USD Daily Report
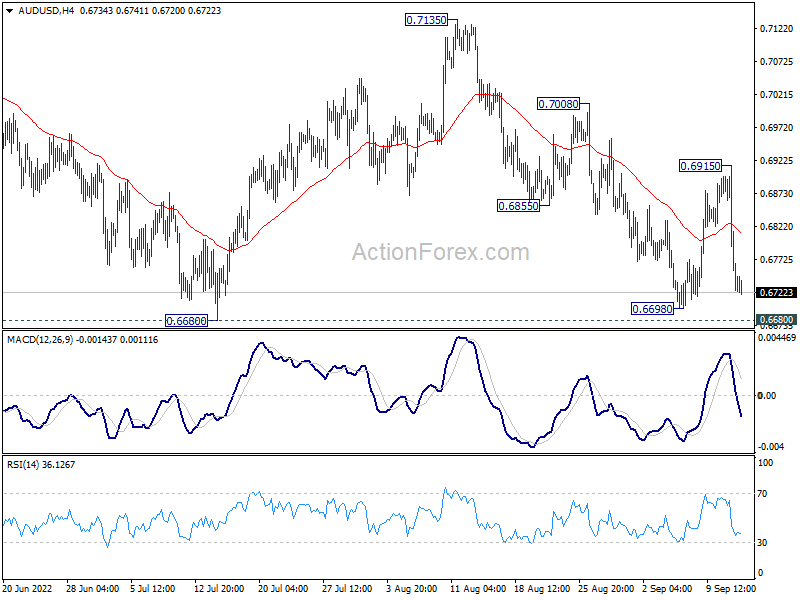
Daily Pivots: (S1) 0.6667; (P) 0.6792; (R1) 0.6856; More...
Intraday bias in AUD/USD remains neutral first. On the downside, firm break of 0.6680 support will resume larger down trend. Next target is 0.6461 long term fibonacci level. On the upside, sustained break of 55 day EMA (now at 0.6915) will target 0.7135 resistance next.
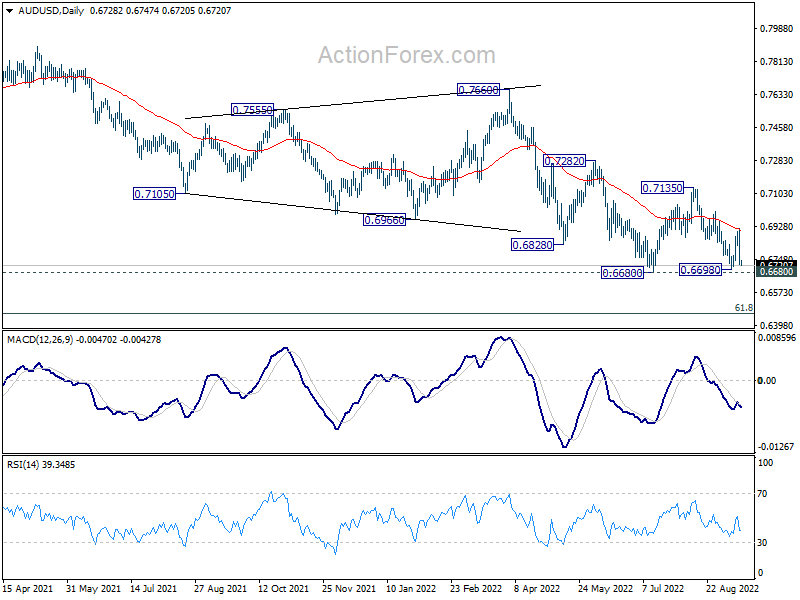
In the bigger picture, price actions from 0.8006 (2021 high) is seen more as a corrective pattern to rise from 0.5506 (2020 low). Or it could also be a bearish impulsive move. In either case, outlook will remain bearish as long as 0.7135 resistance holds. Next target is 61.8% retracement of 0.5506 to 0.8006 at 0.6461.
USD/CAD Daily Outlook
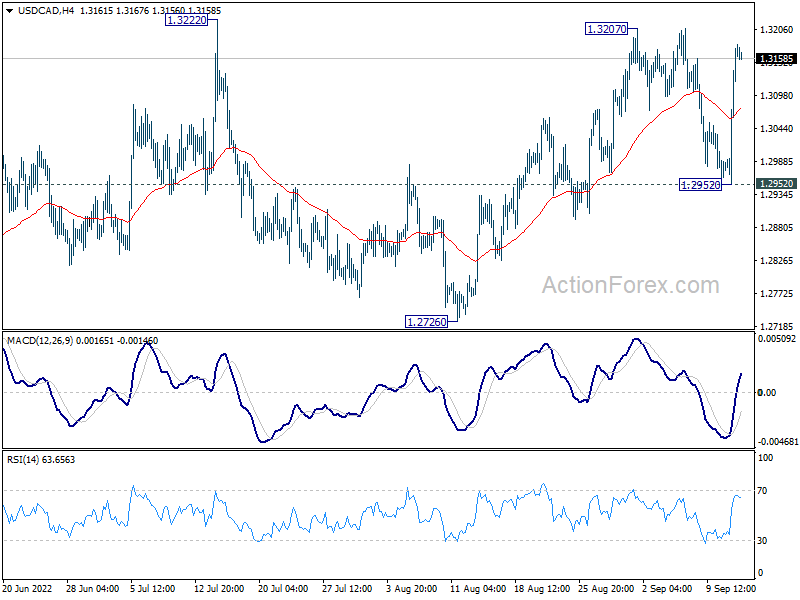
Daily Pivots: (S1) 1.3027; (P) 1.3101; (R1) 1.3249; More...
USD/CAD rebounded strongly after dipping to 1.2952, but stays below 1.3207. Intraday bias remains neutral first. On the upside, decisive break of 1.3222 will resume larger up trend from 1.2005. Next target is 100% projection of 1.2005 to 1.2947 from 1.2401 at 1.3343. On the downside, however, break of 1.2952 will extend the corrective pattern from 1.3222 with another falling leg, back towards 1.2726 support instead.
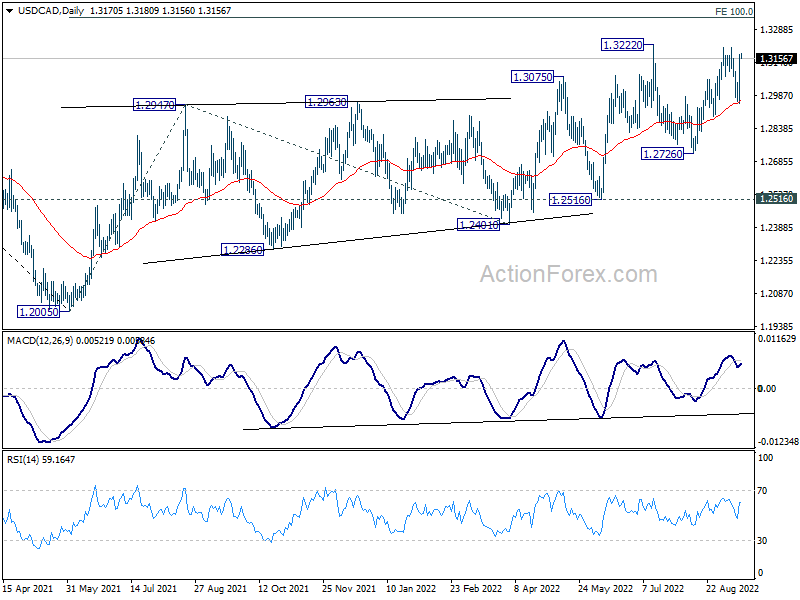
In the bigger picture, down trend from 1.4667 (2020 high) should have completed at 1.2005, after defending 1.2061 long term cluster support. Rise from there should target 61.8% retracement of 1.4667 to 1.2005 (2021 low) at 1.3650. This will remain the favored case now as long as 1.2516 support holds.
Dollar Lacks Follow Through Buying, Yen Recovers on Jawboning
Dollar surged overnight, partly as traders added bet of another aggressive rate hike by Fed next week, and partly on deep risk aversion. Though, there is no follow through buying in Asia, as the greenback is now consolidating gains. On the other hand, Yen appears to be talked up by Japanese officials, and reports that BoJ is checking rates for intervention. Commodity currencies are currently the worst performers while European majors are mixed.
Technically, Dollar has yet to prove it's ready to resume recent up trend. Key levels to watch include 0.9863 support in EUR/USD, 1.1404 support in GBP/USD, 0.6698 support in AUD/USD, 144.98 resistance in USD/JPY and 1.3207 resistance in USD/CAD. These levels have to be taken out with some conviction to confirm underlying strength in Dollar.
In Asia, at the time of writing, Nikkei is down -2.69%. Hong Kong HSI is down -2.45%. China Shanghai SSE is down -1.03%. Singapore Strait Times is down -1.17%. Japan 10-year JGB yield is up 0.0079 at 0.253. Overnight, DOW dropped -3.94%. S&P 500 dropped -4.32%. NASDAQ dropped -5.16%. 10-year yield rose 0.0060 to 3.422.
Markets pricing in 35% chance of 100bps Fed hike next week
US stock tumbled sharply overnight as traders added bets on another aggressive rate hike by Fed on September 21, next Wednesday. The moves came after stronger than expected consumer inflation data. DOW ended down -1276 pts, or -3.94% while S&P 500 fell -4.32%. NASDAQ suffered most by closing -5.16% lower.
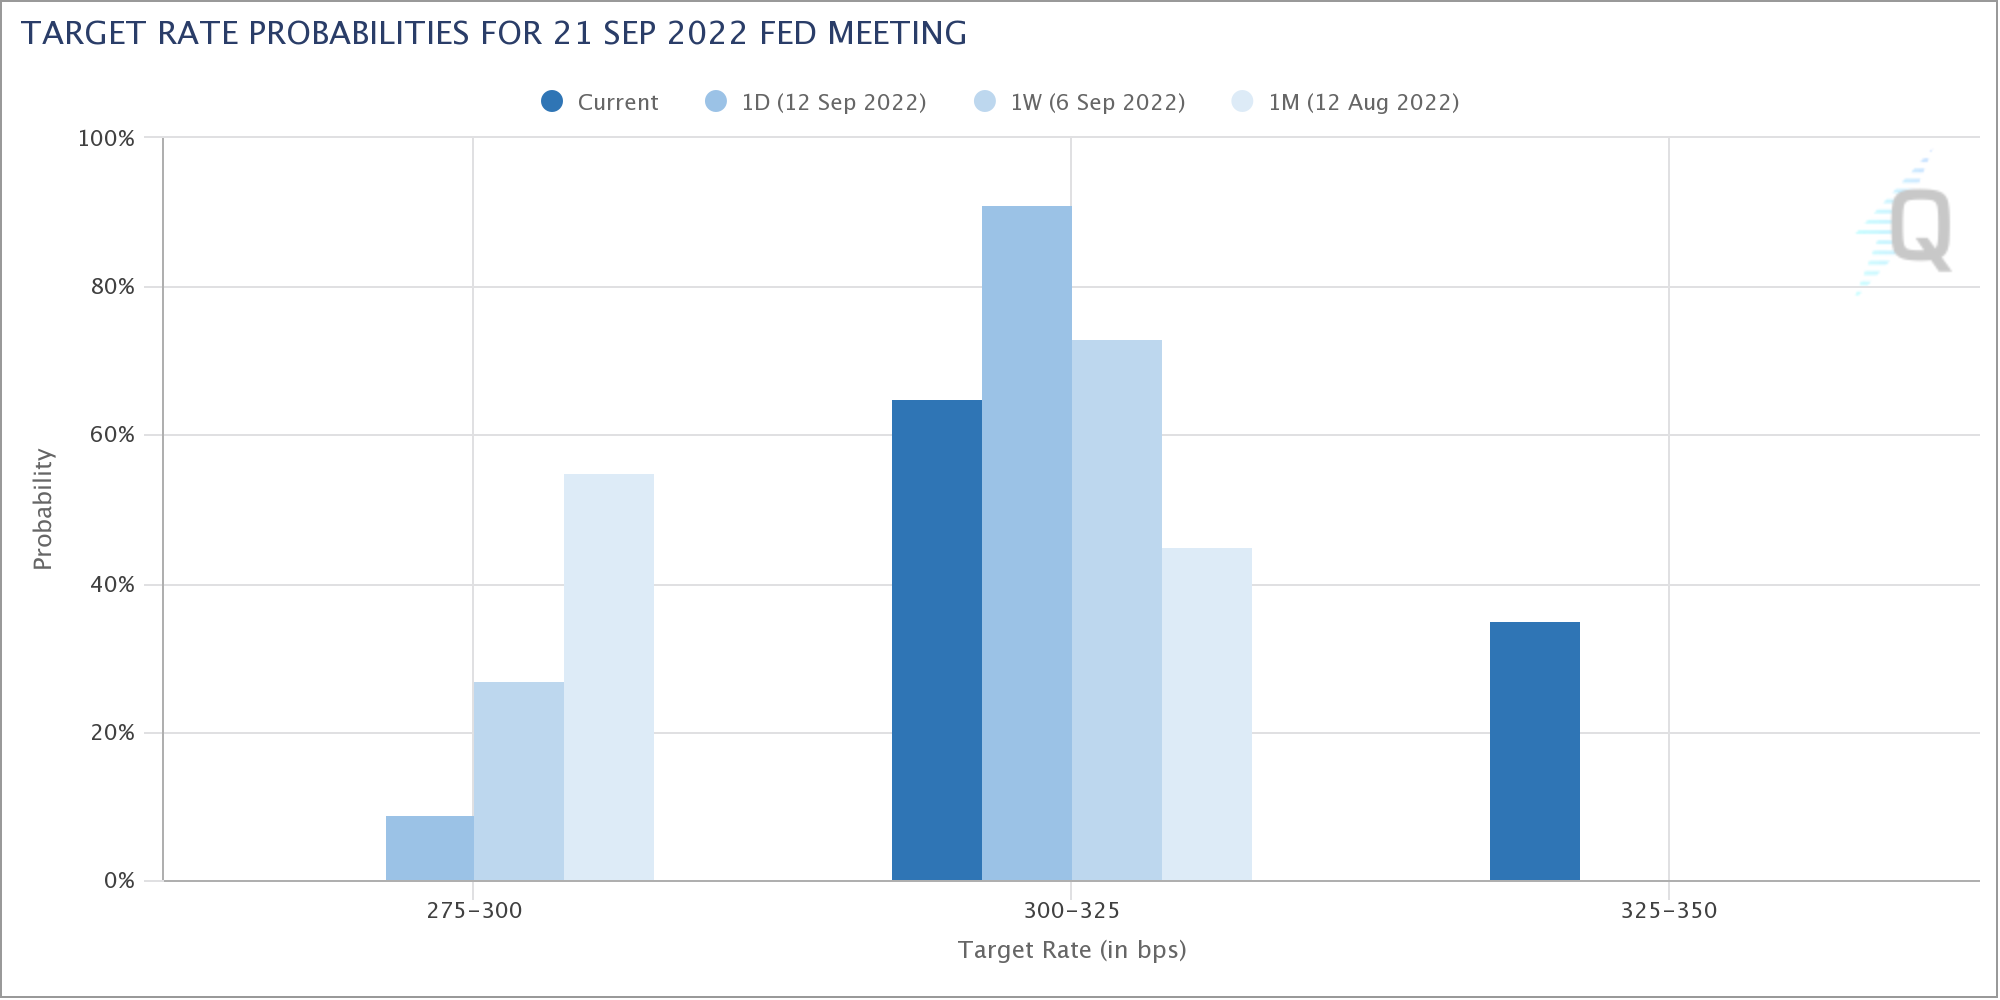
Fed fund futures are now fully pricing a 75bps hike, comparing to 91% a day ago, and 73% a month ago. Indeed, there is even 35% chance of a 100bps hike.
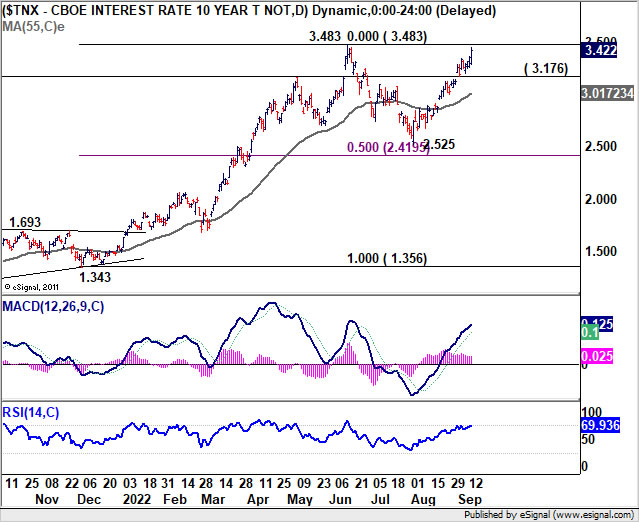
10-year yield surged to as high as 3.458 before closing at 3.422. It's still more likely than not for 3.483 high to exert strong resistance to limit upside. Break of 3.176 support will suggest that TNX is extending the corrective pattern from 3.483 with another falling leg. However, strong break of 3.483 will resume medium term up trend. And that could take USD/JPY through 144.98 towards 1998 high at 147.68.
Japan officials toughen up talks on Yen
Top Japanese officials toughened up the talks on Yen, as it tumbled notably again overnight following US CPI data. Finance Minister Shunichi Suzuki said Japan wouldn't rule out any response if current trends in the foreign exchange market continued, with intervention as an option.
The comment was echoed by top current diplomat Masato Kanda, who reiterated, "we are monitoring yen moves with a sense of urgency. We will respond appropriately to currency moves without ruling out any options."
Chief Cabinet Secretary Hirokazu Matsuno also said at a briefing that the government would take necessary action should excessive yen moves continue. He added that rapid currency moves were undesirable.
On the data front
New Zealand current account deficit narrowed from NZD -6.50B to NZD -5.22B in Q2, versus expectation of NZD -4.70B. Japan machine orders rose 5.3% mom in July, much better than expectation of -0.6% mom decline. Industrial production was finalized at 0.8% mom in July.
Looking ahead, UK CPI and PPI are the major focuses in European session. Eurozone will release industrial production. Later in the day, US will publish PPI while Canada will release manufacturing sales.
USD/CAD Daily Outlook
Daily Pivots: (S1) 1.3027; (P) 1.3101; (R1) 1.3249; More...
USD/CAD rebounded strongly after dipping to 1.2952, but stays below 1.3207. Intraday bias remains neutral first. On the upside, decisive break of 1.3222 will resume larger up trend from 1.2005. Next target is 100% projection of 1.2005 to 1.2947 from 1.2401 at 1.3343. On the downside, however, break of 1.2952 will extend the corrective pattern from 1.3222 with another falling leg, back towards 1.2726 support instead.
In the bigger picture, down trend from 1.4667 (2020 high) should have completed at 1.2005, after defending 1.2061 long term cluster support. Rise from there should target 61.8% retracement of 1.4667 to 1.2005 (2021 low) at 1.3650. This will remain the favored case now as long as 1.2516 support holds.
Economic Indicators Update
| GMT | Ccy | Events | Actual | Forecast | Previous | Revised |
|---|---|---|---|---|---|---|
| 22:45 | NZD | Current Account (NZD) Q2 | -5.22B | -4.70B | -6.14B | -6.50B |
| 23:50 | JPY | Machinery Orders M/M Jul | 5.30% | -0.60% | 0.90% | |
| 04:30 | JPY | Industrial Production M/M Jul F | 0.80% | 1.00% | 1.00% | |
| 06:00 | GBP | CPI M/M Aug | 0.60% | 0.60% | ||
| 06:00 | GBP | CPI Y/Y Aug | 10.20% | 10.10% | ||
| 06:00 | GBP | Core CPI Y/Y Aug | 6.30% | 6.20% | ||
| 06:00 | GBP | RPI M/M Aug | 1.20% | 0.90% | ||
| 06:00 | GBP | RPI Y/Y Aug | 12.40% | 12.30% | ||
| 06:00 | GBP | PPI Input M/M Aug | 1.20% | 0.10% | ||
| 06:00 | GBP | PPI Input Y/Y Aug | 21.00% | 22.60% | ||
| 06:00 | GBP | PPI Output M/M Aug | 1.60% | 1.60% | ||
| 06:00 | GBP | PPI Output Y/Y Aug | 17.80% | 17.10% | ||
| 06:00 | GBP | PPI Core Output M/M Aug | 1.50% | 1.00% | ||
| 06:00 | GBP | PPI Core Output Y/Y Aug | 13.90% | 14.60% | ||
| 09:00 | EUR | Eurozone Industrial Production M/M Jul | -0.80% | 0.70% | ||
| 12:30 | USD | PPI M/M Aug | -0.10% | -0.50% | ||
| 12:30 | USD | PPI Y/Y Aug | 8.90% | 9.80% | ||
| 12:30 | USD | PPI Core M/M Aug | 0.30% | 0.20% | ||
| 12:30 | USD | PPI Core Y/Y Aug | 7.40% | 7.60% | ||
| 12:30 | CAD | Manufacturing Sales M/M Jul | -1.00% | -0.80% | ||
| 14:30 | USD | Crude Oil Inventories | 1.9M | 8.8M |
Technical Outlook and Review
USD/JPY:
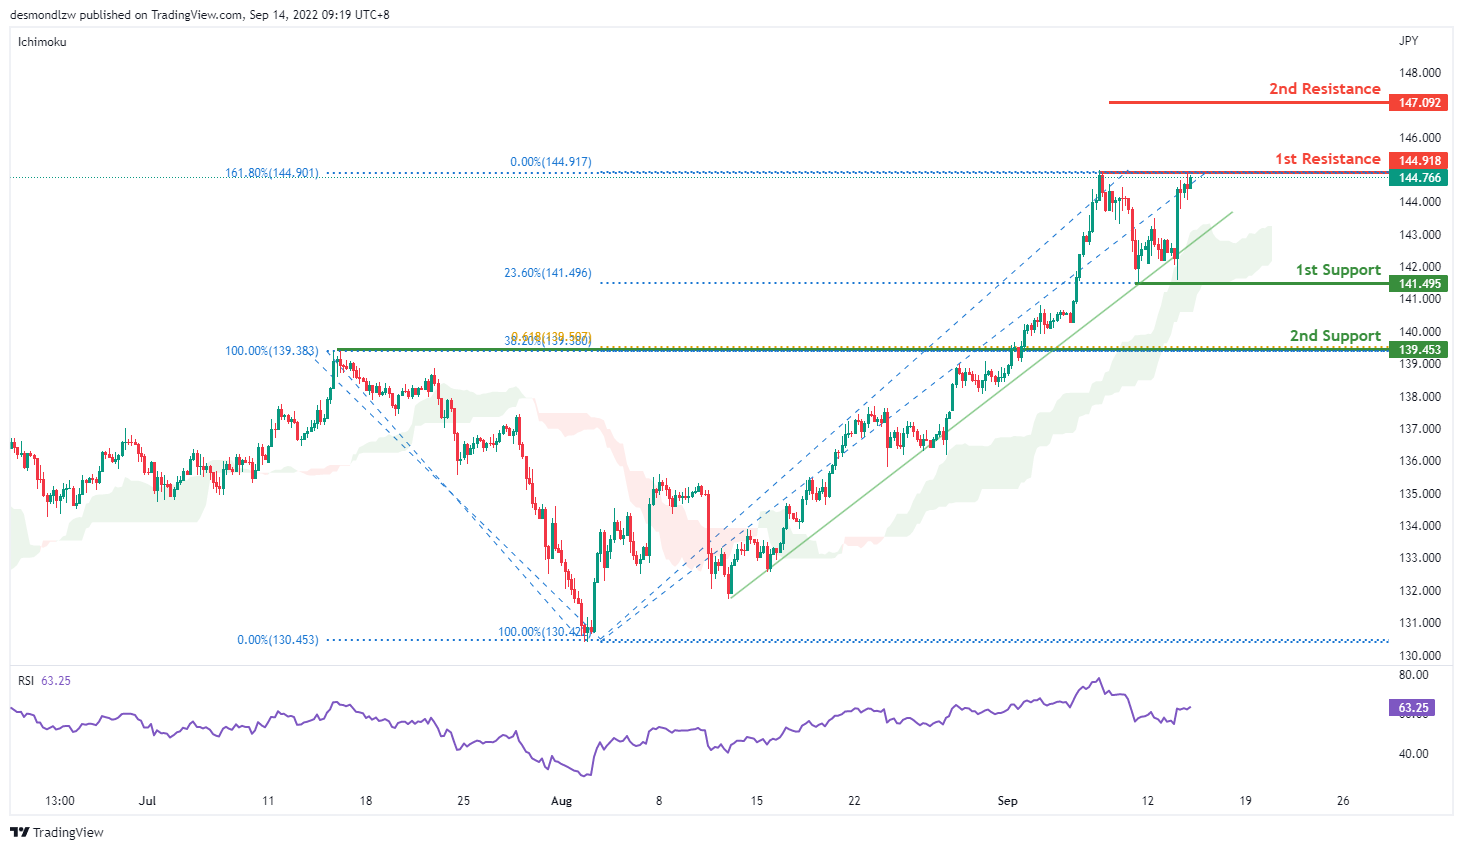
On the H4 chart, price is still respecting the ascending channel. We are still bullish bias- Price is testing at the first resistance 144.918 where the 161.8% extension sits. If bullish momentum continues, it should bring price to 147.092 where the previous swing high sits. Alternatively it could pull back to the first support at 141.495 where the 23.6% retracement sits then to the second support at 139.453 where the 38.2% retracement and overlapping support sits.
Areas of consideration:
- H4 time frame, 1st resistance at 144.918
- H4 time frame, 1st support at 141.495
DXY:
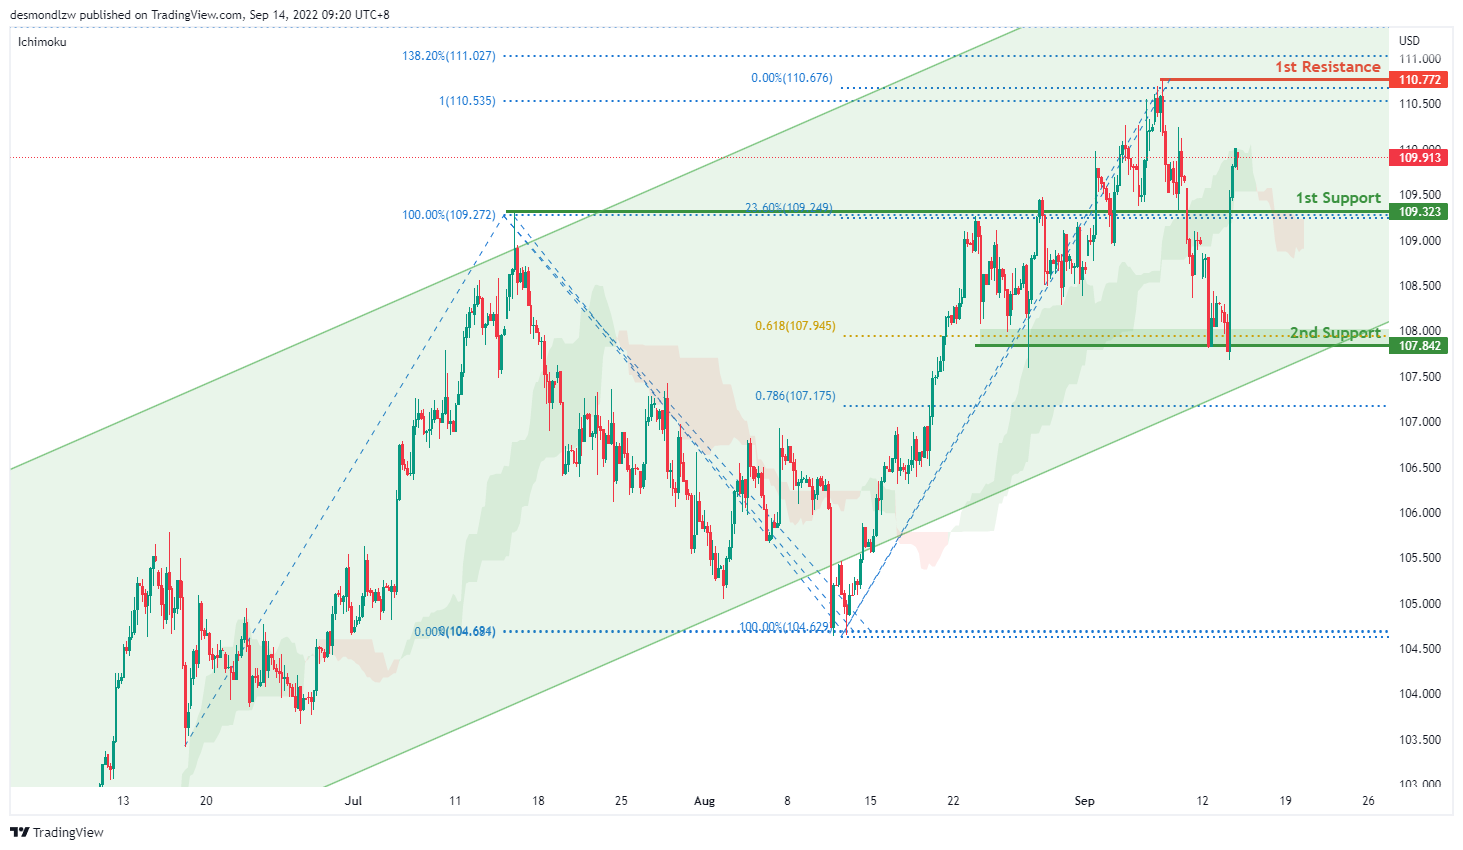
On the H4, price is still respecting the bullish channel- we are bullish bias. Price has rebounded off the support level and is moving toward the first resistance at 110.772 levels where the previous swing high sits. Alternatively, price could pull back to test the first support at 109.323 where the 23.6% retracement sits then the second support at 107.842 where the 61.8% projection and previous swing low sits.
Areas of consideration:
- H4 time frame, 1st resistance at 110.772
- H4 time frame, 1st support at 109.323
EUR/USD:
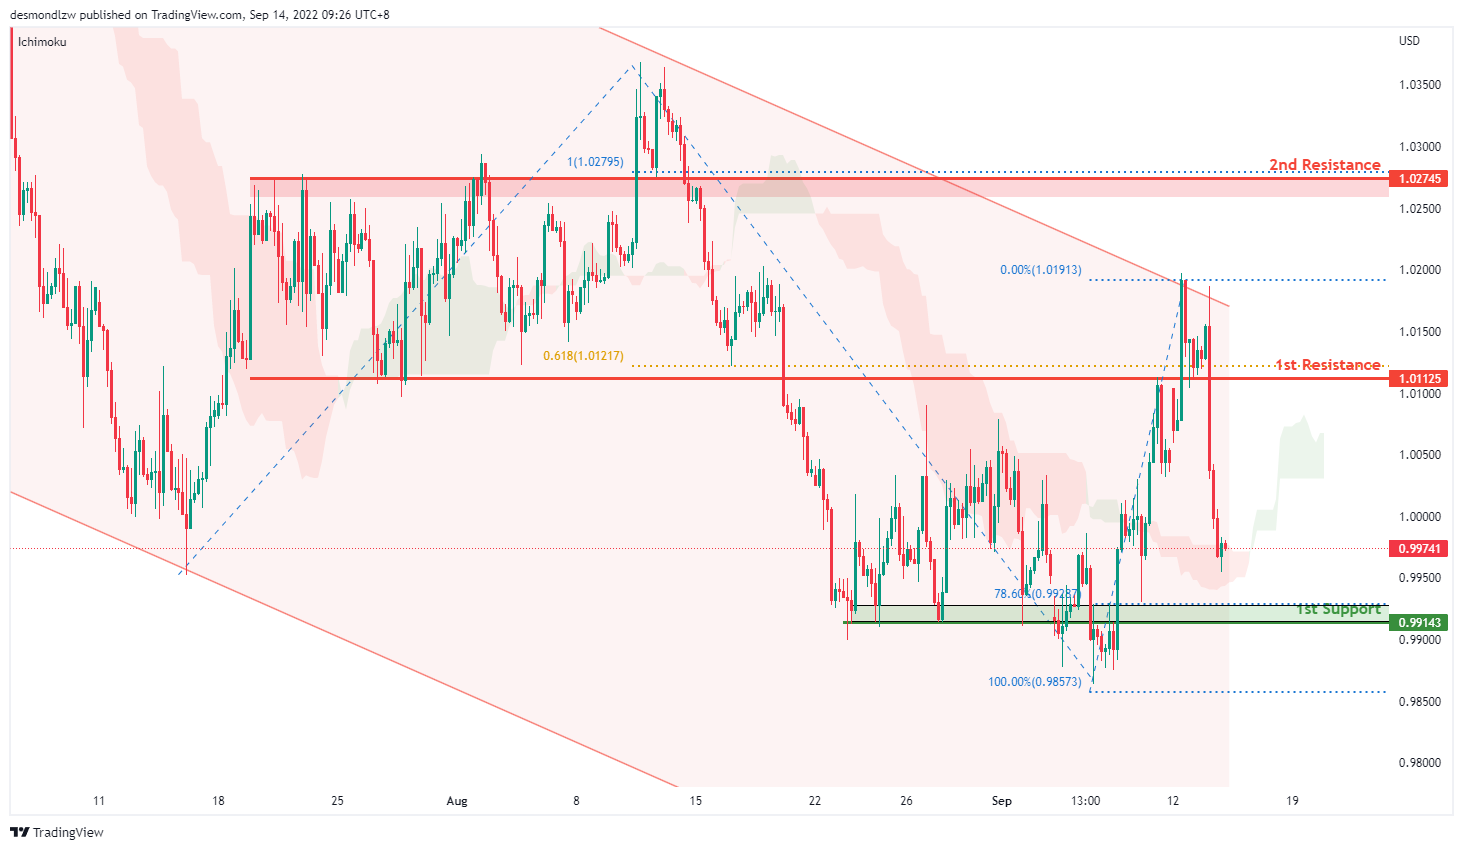
On the H4, price is moving within the channel, we are currently bearish bias. Price seems like its moving to the first support at 0.9914 where the 7836% retracement and previous swing low sits. Alternatively, if price pulls back it should test the first resistance at 1.0112 level where the 61.8% projection and previous swing low sits then the second resistance at 1.0274 where the previous swing high sits
Areas of consideration :
- H4 1st resistance at 1.0112
- H4 1st support at 0.9914
GBP/USD:
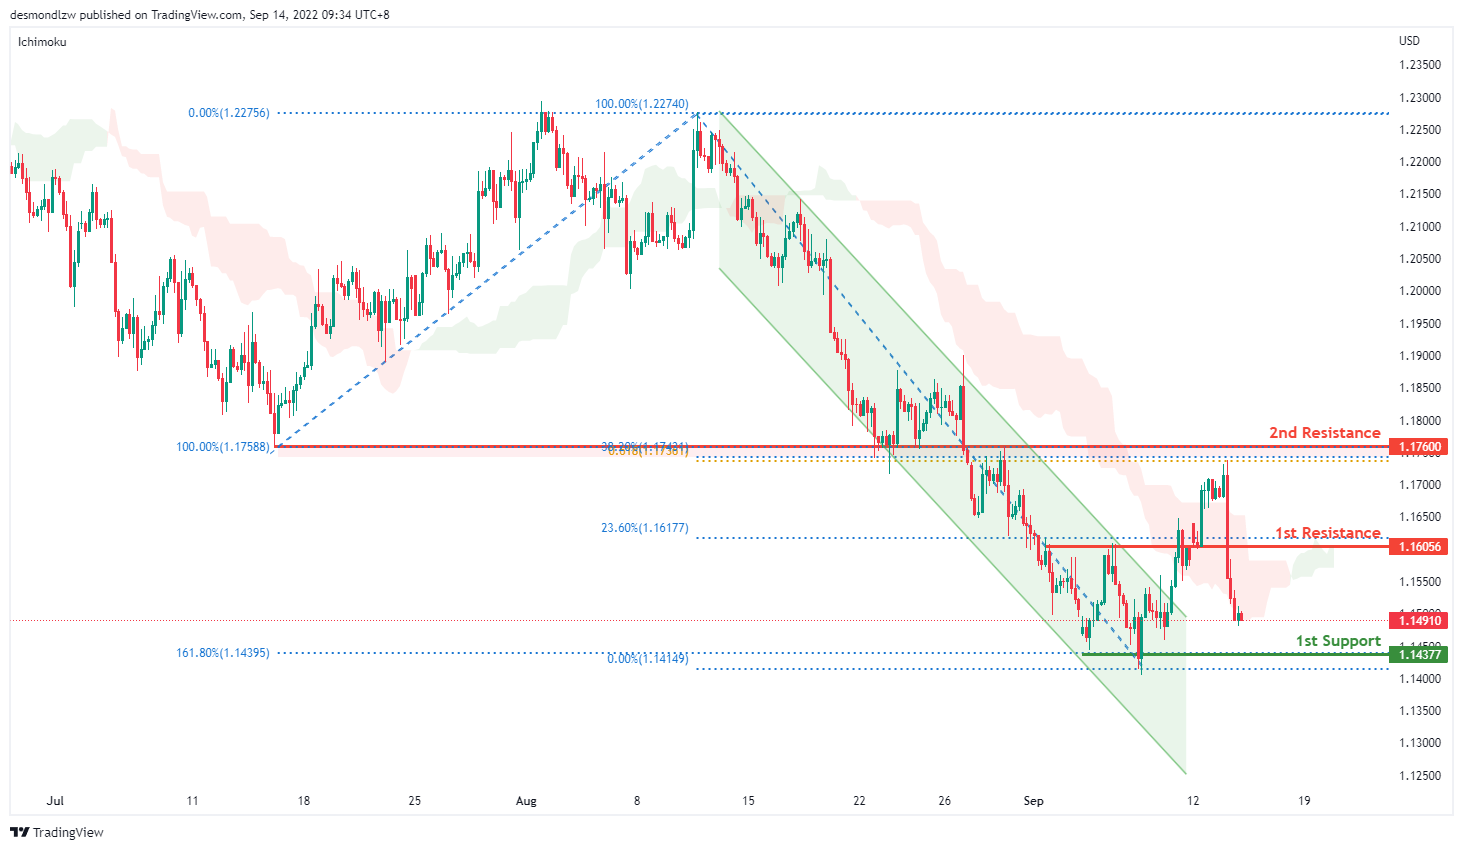
On the H4, prices are still moving in a bearish momentum hence we are bearish biassed. Prices seem to be moving toward the first support at 1.1442 where the 161.8% extension and previous swing low sits. Alternatively, price could pull back to test the first resistance at 1.1605 where the 23.6% retracement and overlapping support sits then the second support at 1.1760 where the 38.2% retracement and 61.8% projection sits.
Areas of consideration:
- H4 1st resistance at 1.1605
- H4 1st support at 1.1437
USD/CHF:
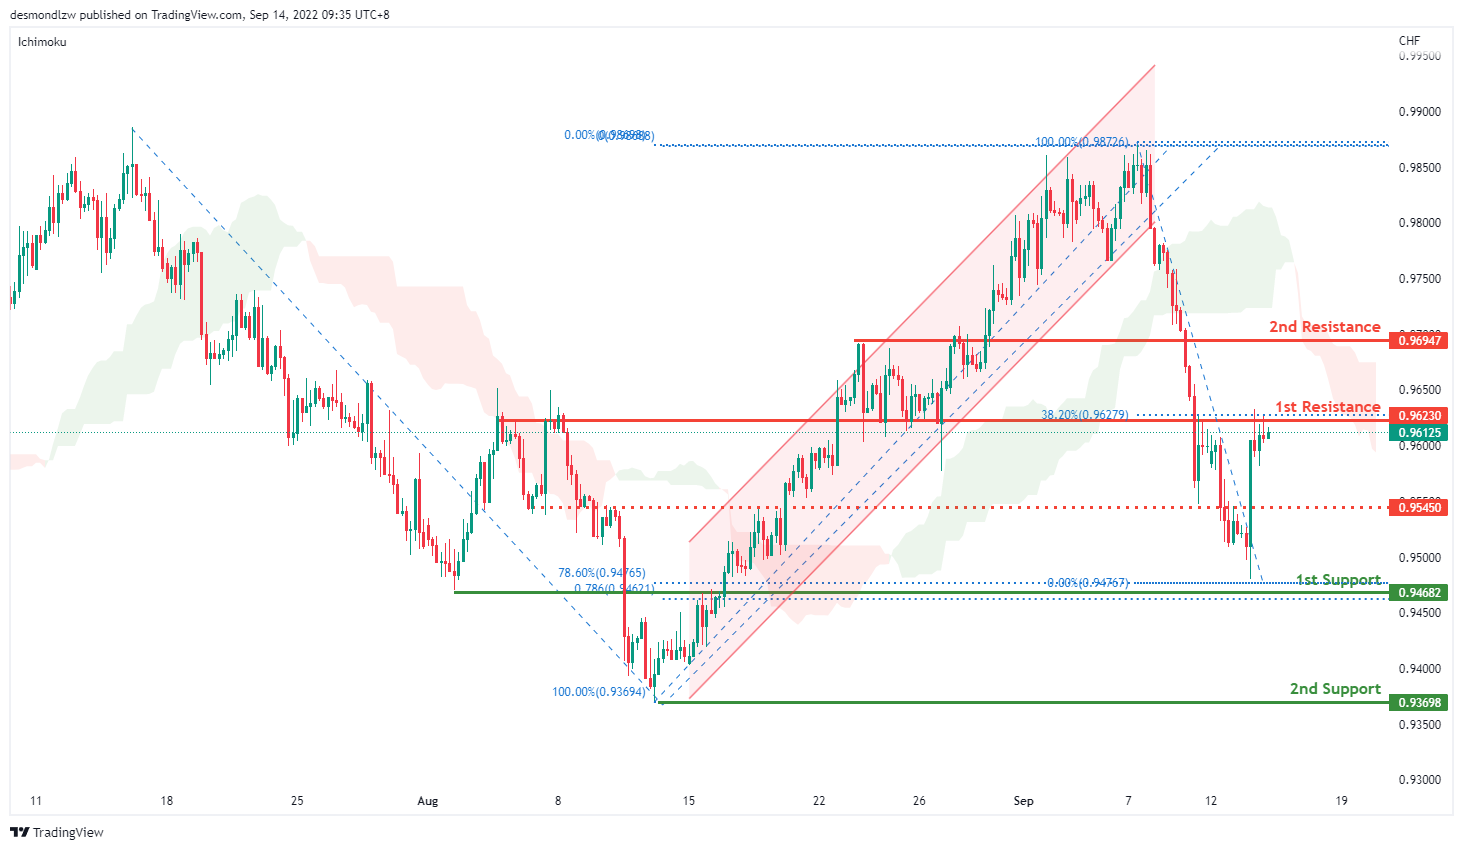
On the H4, prices have broken the ascending channel and we are currently bearish bias. Price is testing the first resistance at 0.9623 where the overlapping resistance and 50% retracement sit. If it breaks this level, it might test the second resistance at 0.9694 where the 38.2% retracement sits. Alternatively, price could pull back to test the first support at 0.9468 where the 78.6% retracement sit and then second support at 0.9369 where the previous swing low sits
Areas of consideration
- H4 1st support at 0.9468
- H4 1st resistance at 0.9623
XAU/USD (GOLD):
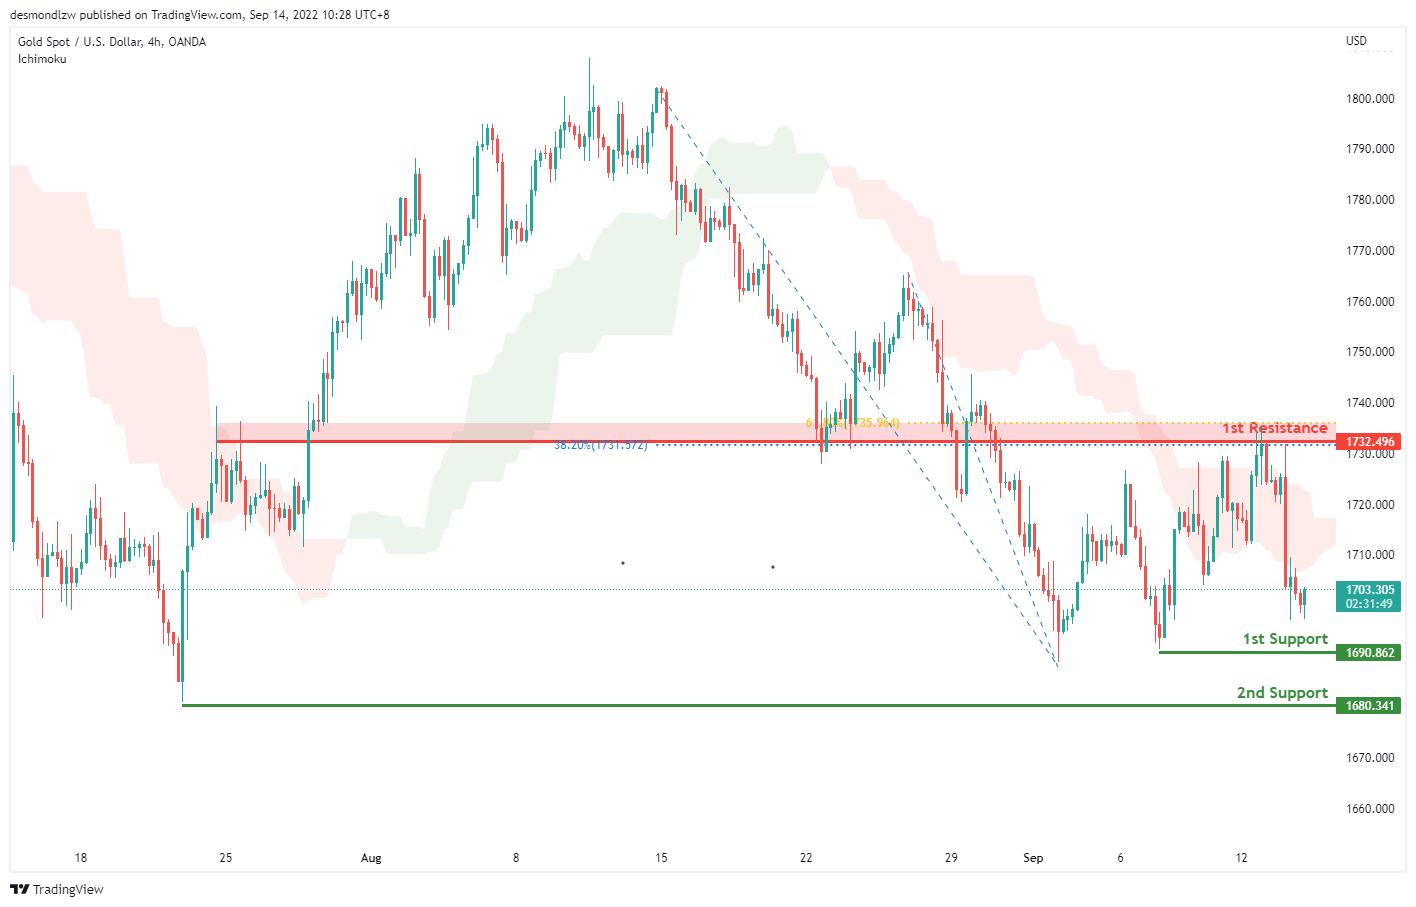
On the H4, with the price dropping from the 1st resistance and below ichimoku cloud, we have a bearish bias that the price may drop to the 1st support at 1690.862, which is in line with the swing low to the 2nd support at 1680.341, where the previous significant swing low is. Alternatively, the price may rise to the 1st resistance at 1732.496, which is in line with the 61.8% and 38.2% fibonacci retracement and overlap resistance.
Areas of consideration:
- H4 time frame, 1st support at 1690.862
- H4 time frame, 2nd support at 1680.341
AUD/USD:
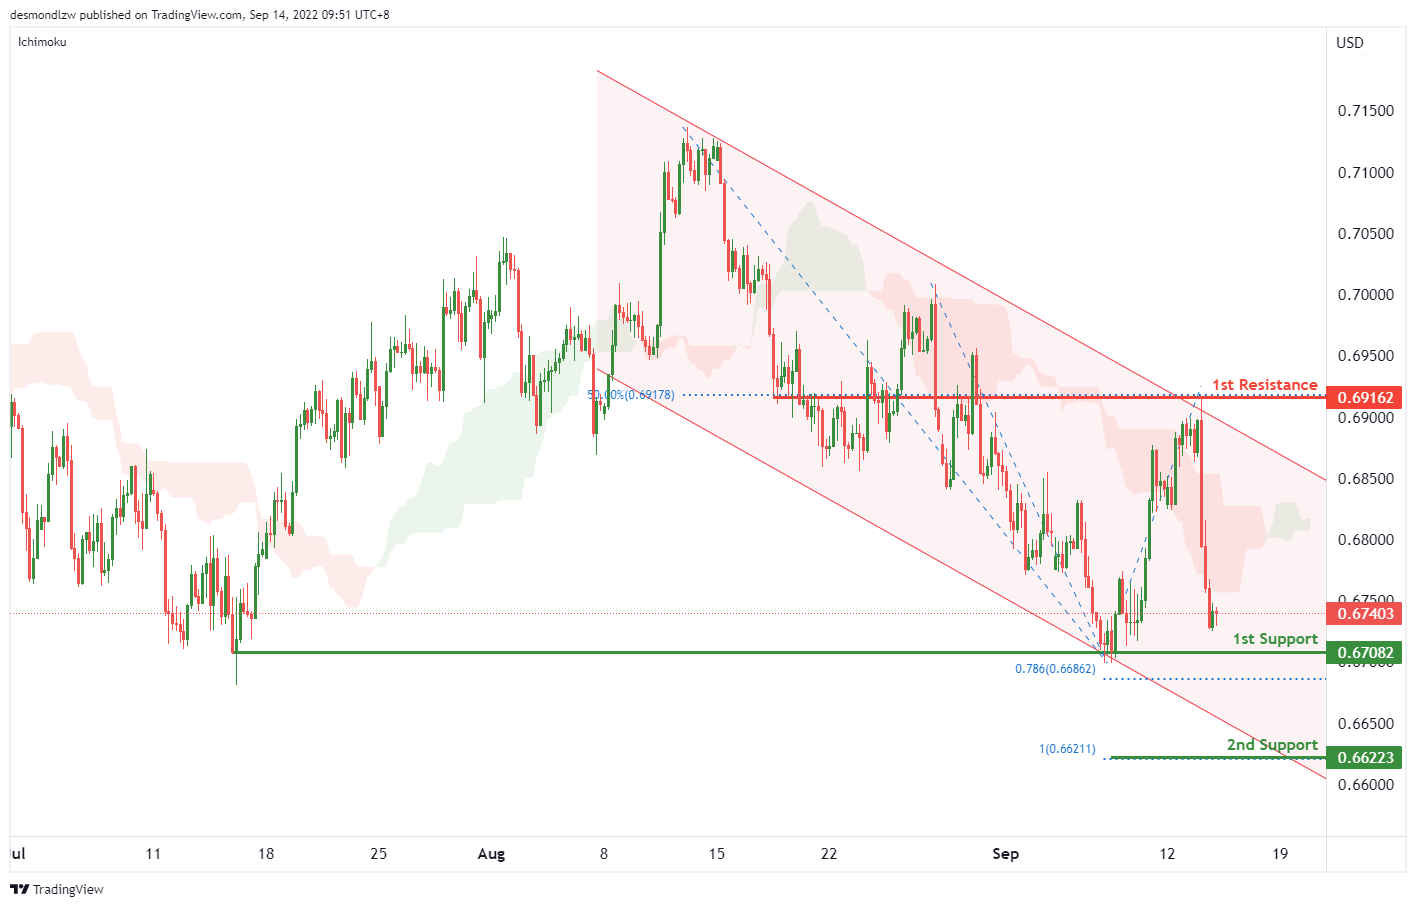
On the H4, with the price moving within the descending channel and below ichimoku cloud, we have a bearish bias that the price may drop to the 1st support at 0.67082, which is in line with the previous swing lows and 78.6% fibonacci projection. If the 1st support level is broken, the 2nd support could be at 0.6623, where the 100% fibonacci projection is. Al;ternatively, the price may rise to the 1st resistance at 0.69162, which is in line with the 50% fibonacci retracement and swing high.
Areas of consideration
- H4 1st support at 0.67082
- H4 2nd support at 0.6623
NZD/USD:
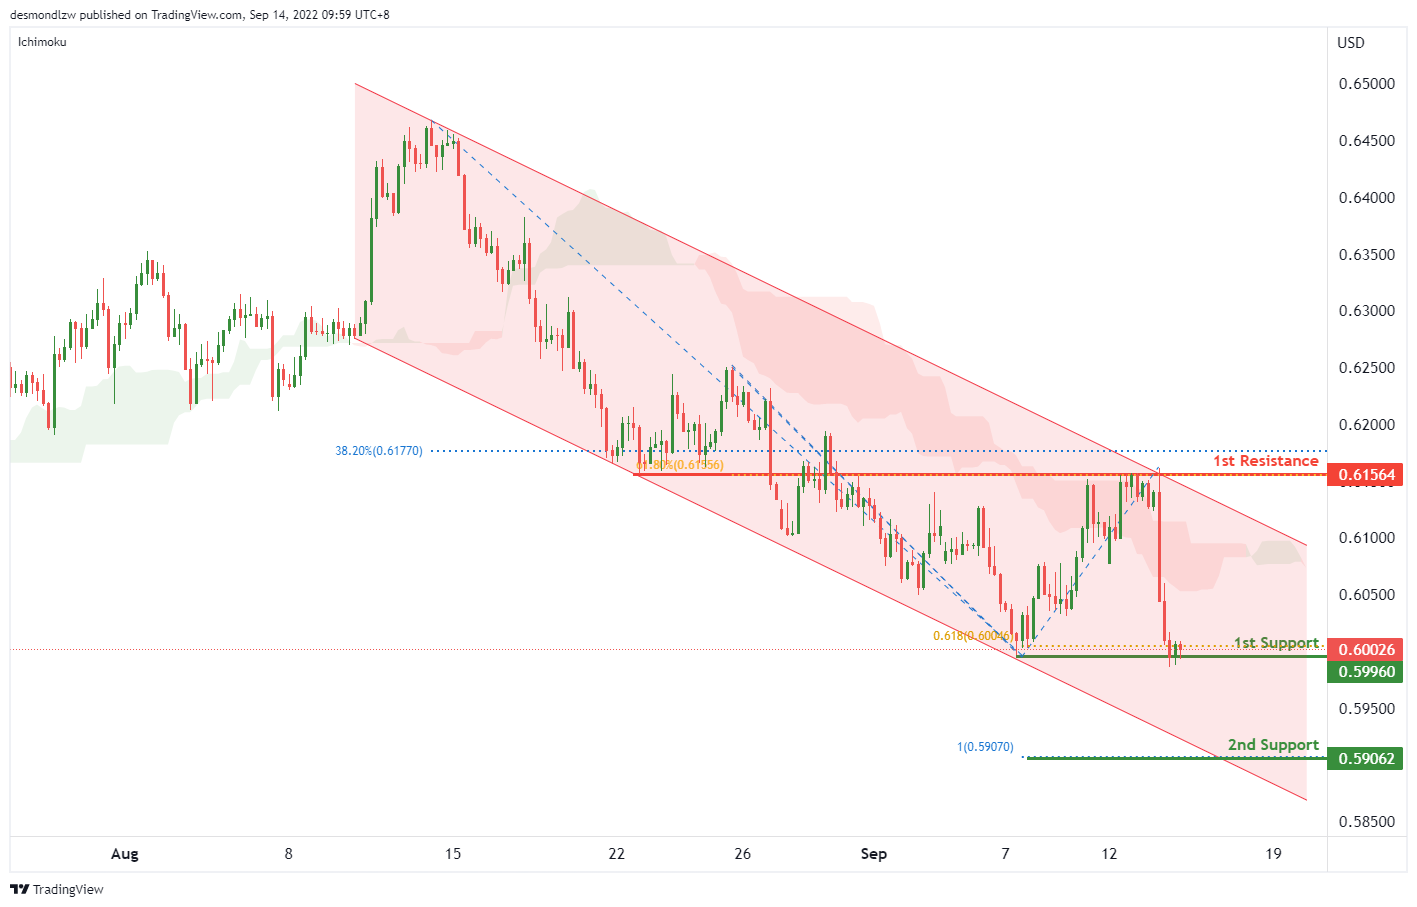
On the H4, with the price moving within the descending channel and below ichimoku cloud, we have a bearish bias that the price may drop from the 1st support at 0.59960, which is in line with the swing low and 61.8% fibonacci projection to the 2nd support at 0.59062, where the 100% fibonacci projection is. Alternatively, the price may rise to the 1st resistance at 0.61564, which is in line with the overlap resistance, 61.8% fibonacci retracement and 38.2% fibonacci retracement.
Areas of consideration:
- H4 time frame, 1st support at 0.59960
- H4 time frame, 2nd support at 0.59062
USD/CAD:
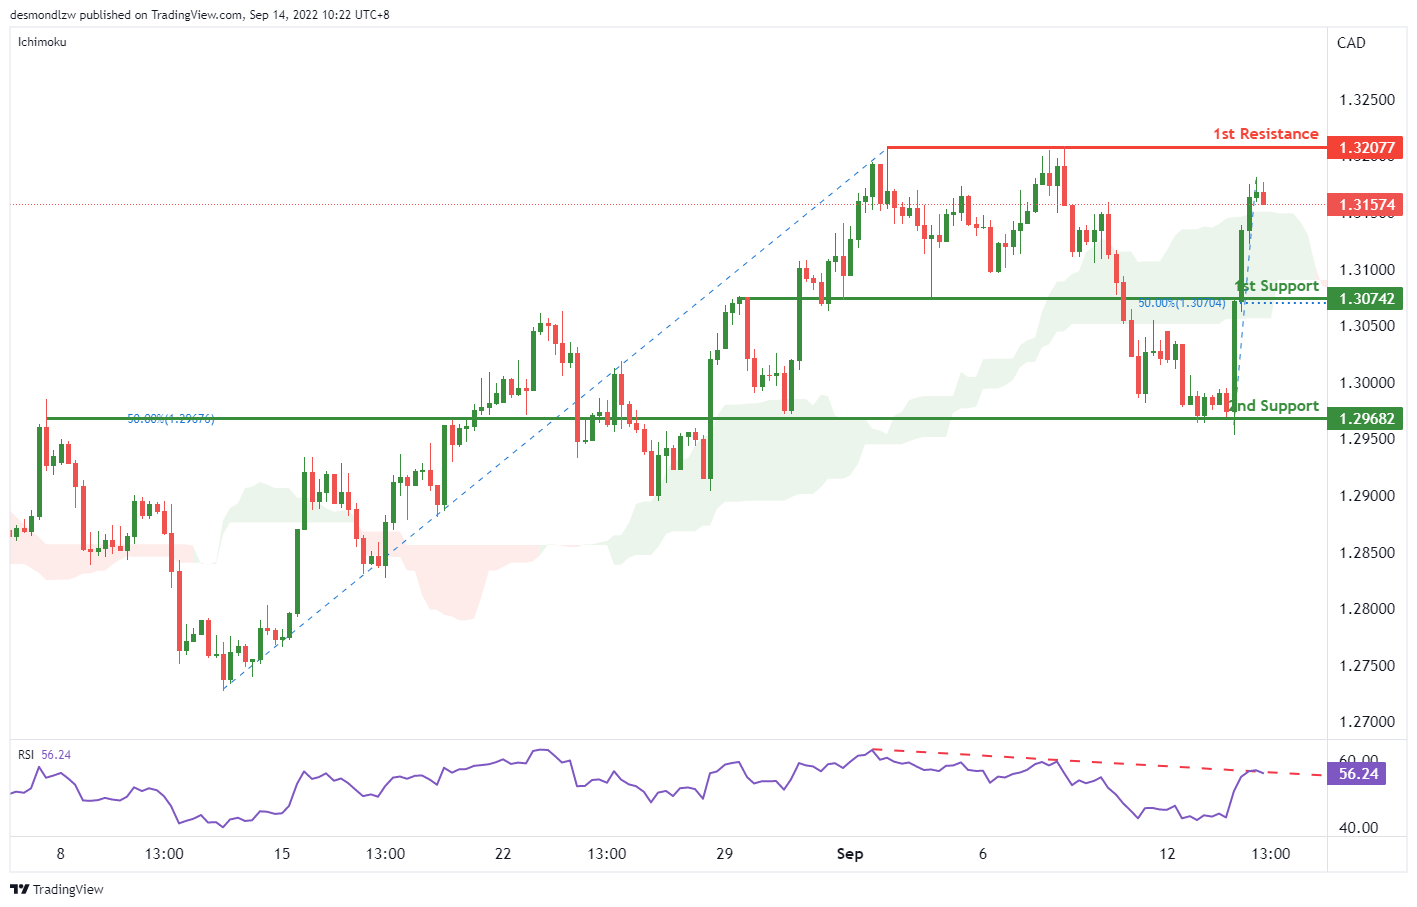
On the H4, the price is rising from the 2nd support and breaking the ichimoku cloud, if the price continues rising, the next resistance level could be at 1.32077, which is in line with the previous swing high. Alternatively, as the RSI is testing the descending trendline, the price may pull back and drop to the 1st support at 1.30742, which is in line with the 50% fibonacci retracement and overlap support. If the 1st support is broken, the next support level could be at 1.29682, where the 50% fibonacci retracement and overlap support are.
Areas of consideration:
- H4 time frame, 1st resistance at 1.30277
- H4 time frame, 1st support at 1.30742
OIL:
On the H4, with price below ichimoku and breaking the ascending trendline, we have a bearish bias that the price may drop to the 1st support at 93.239, where the overlap resistance and 38.2% fibonacci retracement are. If the price can break this resistance level, the next support level could be at 88.332, which is in line with the swing low. Alternatively, the price may rise to the 1st resistance at 98.753, which is in line with the 61.8% fibonacci retracement and overlap resistance. Take note the intermediate resistance could be at 96.188, which is in line with the 78.6% fibonacci retracement.
Areas of consideration:
- H4 time frame, 1st resistance at 98.753
- H4 time frame, 1st support at 93.235

Dow Jones Industrial Average:
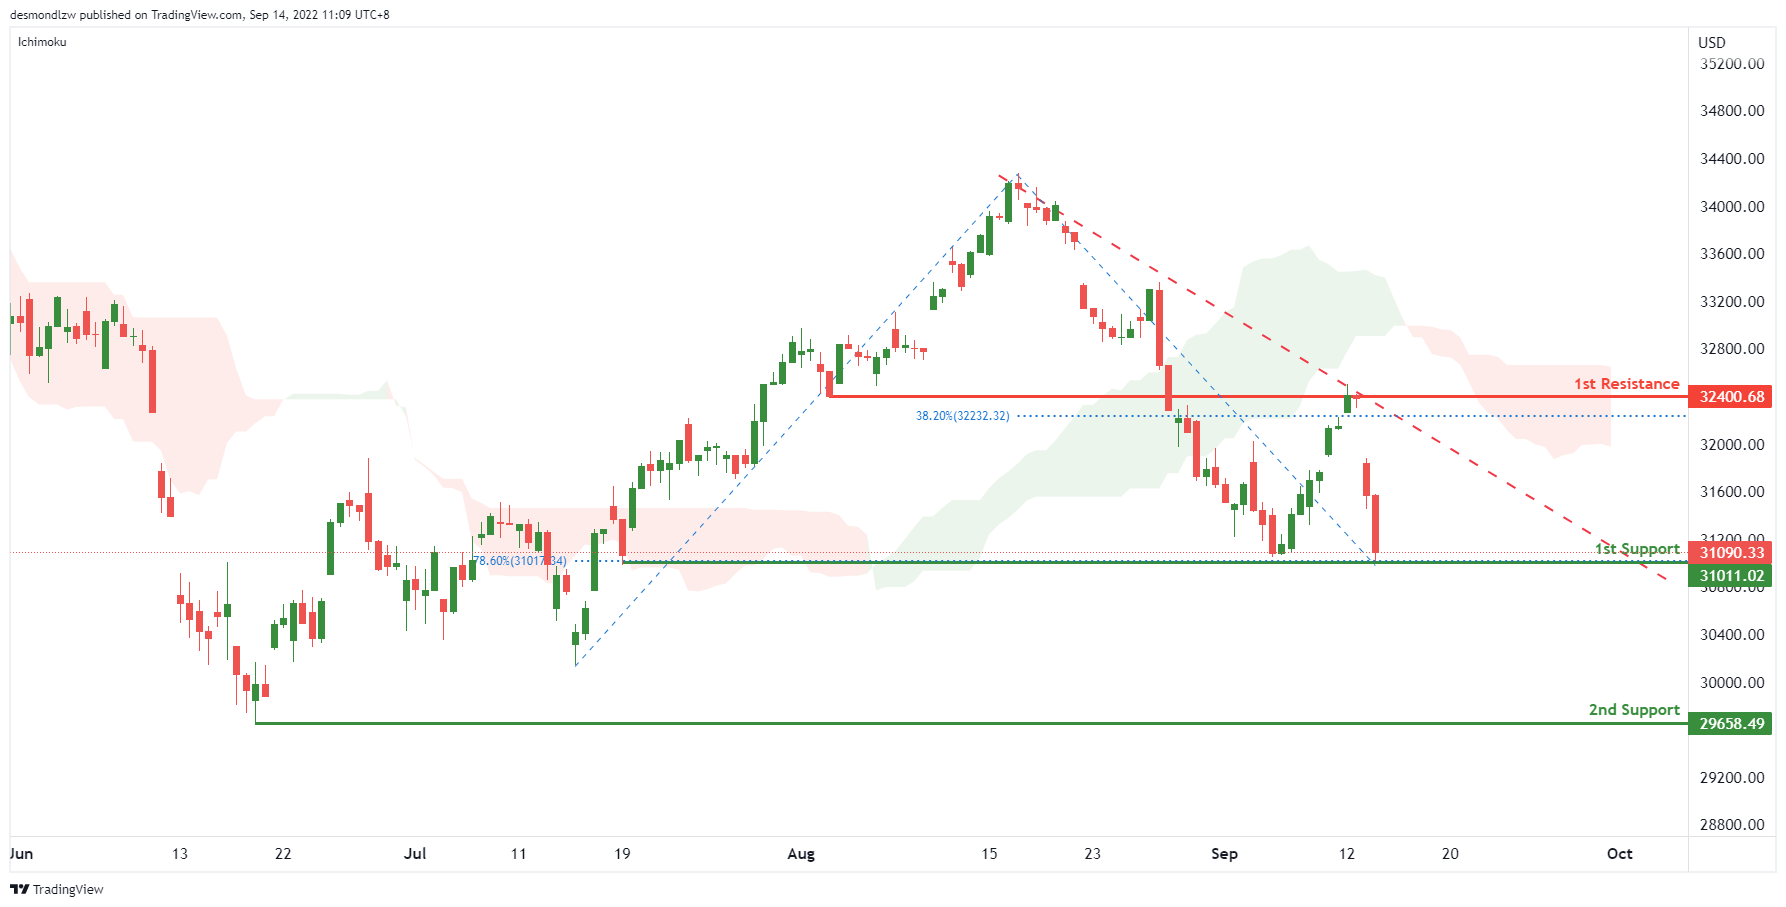
On the H4, with price moving within the descending trendline and below ichimoku cloud, we have a bearish bias that the price may drop to the 1st support at 31011.02, where the pullback support and 78.6% fibonacci retracement are . If the 1st support is broken, the 2nd support could be at 29658.49, which is in line with the swing low. Alternatively, the price may break the descending trendline and rise to the 1st resistance at 32400.68, which is in line with the overlap resistance and 38.2% fibonacci retracement.
Areas of consideration:
- H4 time frame, 1st support at 31011.02
- H4 time frame, 2nd support at 29658.49
DAX:
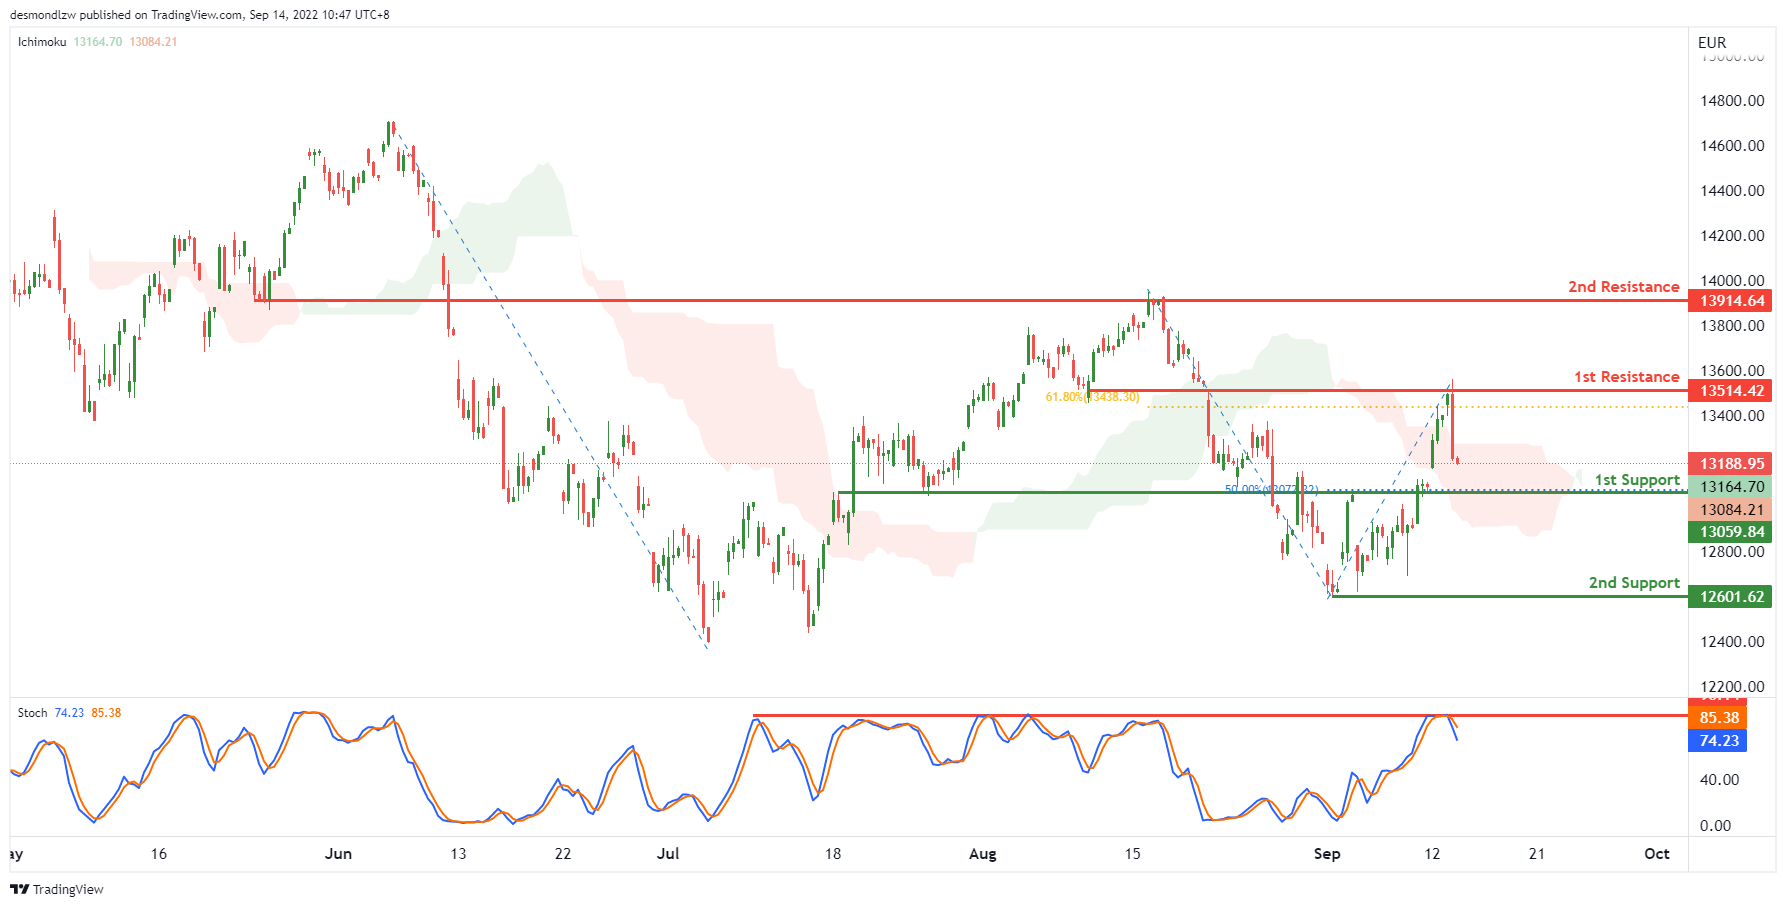
On the H4, with the stoch is pulling back from the resistance at 85.38, and price is breaking the ichimoku cloud, we have a bearish bias that the price may drop to the 1st support at 13059.84, which is in line with the 50% fibonacci retracement and overlap support. If the 1st support is broken, the next support could be at 12601.62, which is in line with the swing low. Alternatively, the price may rise to the 1st resistance at 13514.42, which is in line with the overlap resistance and 61.8% fibonacci retracement.
Areas of consideration:
- H4 time frame, 1st support at 13059.84
- H4 time frame, 2nd support at 12601.62
ETHUSD:
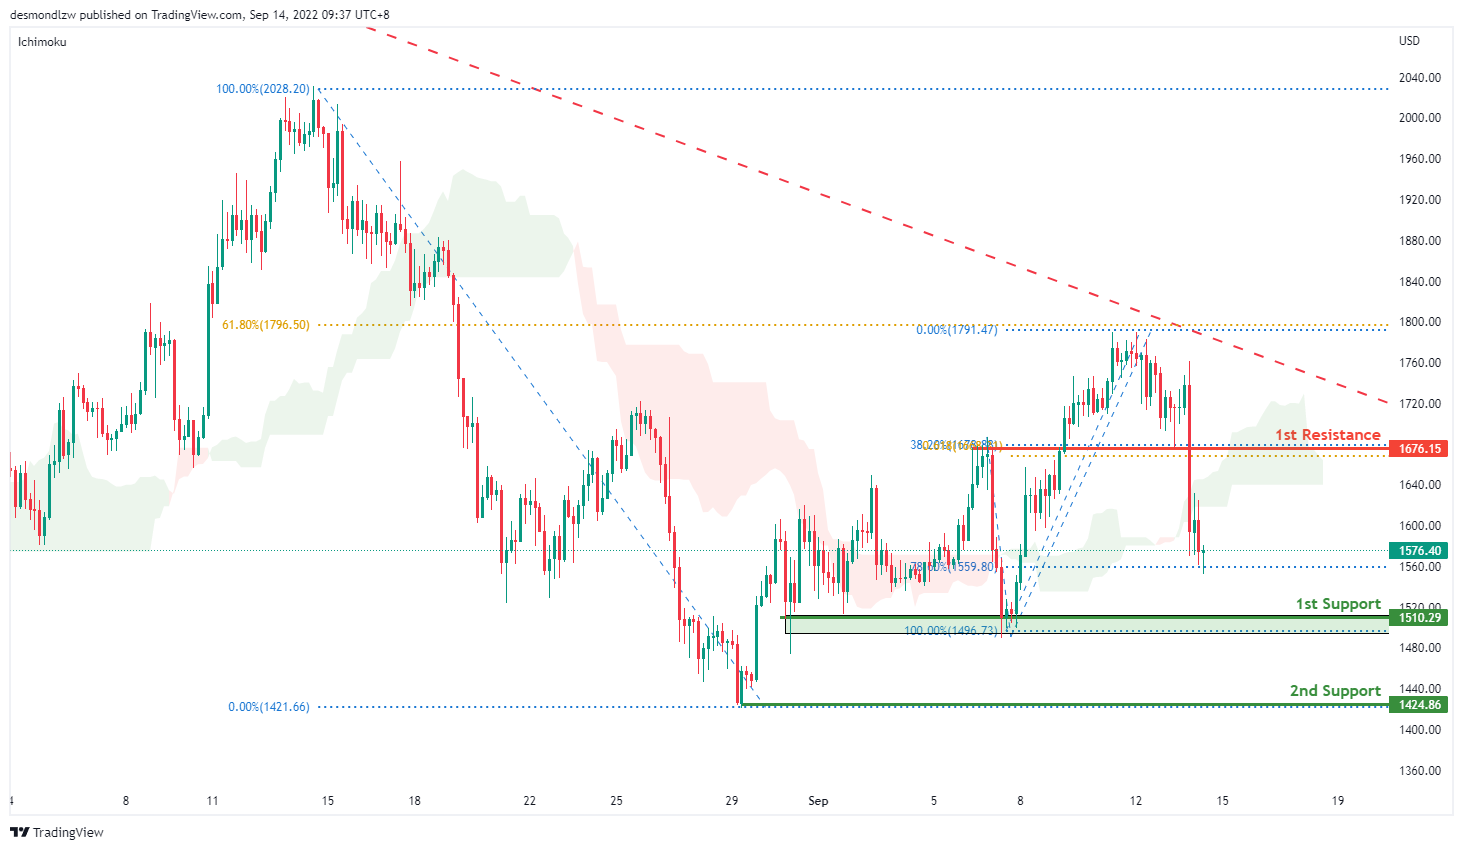
On the H4, price look like it has pulled back slightly hence we are currently bearish bias. Price look like it’s moving toward the first support at 1510.29 where the 100% projection sits. If bearish momentum continues it should bring price to the second support at 1424.86 where the previous swing low sits. Alternatively price could bounce back to test the first resistance at 1676.15 where the 38.2% retracement at 61.8% projection sits
Areas of consideration:
- H4 time frame, 1st resistance of 1676.15
- H4 time frame, 1st support at 1510.29
BTCUSD:
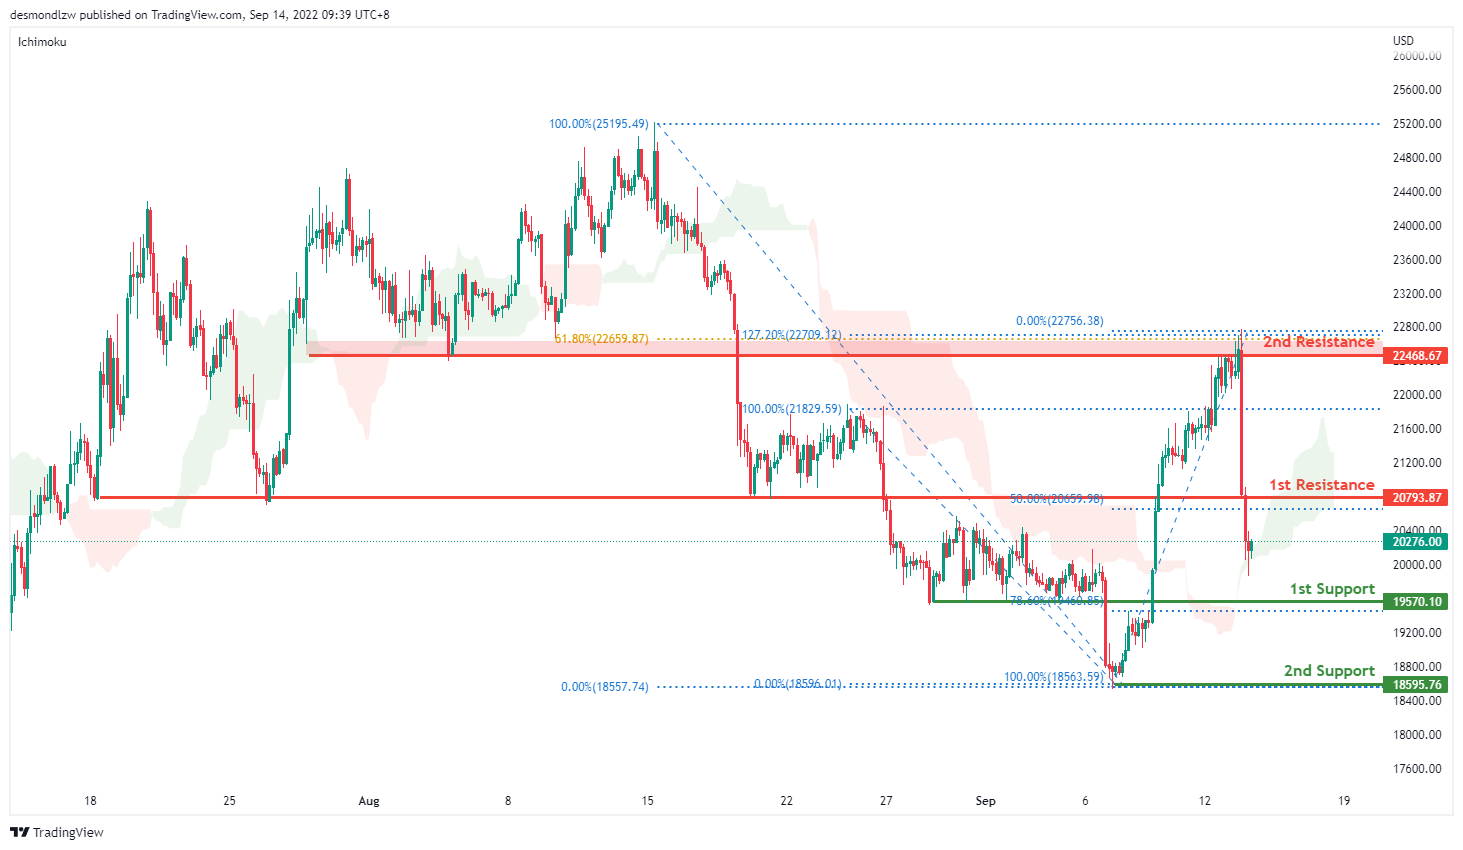
On the H4, price is moving in a bearish momentum hence we are bearish. Price is moving toward the first support at 19570.10 where the 78.6% retracement sits. If bearish momentum continues, it should bring price to the second support 18595.76 where the previous swing low sits. Alternatively, price could pull back to test the first resistance at 20793.87 where the 50% retracement and previous swing low sits then the second resistance at 22468.67 where the 61.8% retracement and 127.2% extension sits
Areas of consideration:
- H4 time frame, 1st resistance of 20793.87
- H4 time frame, 1st support at 19570.10
S&P 500:
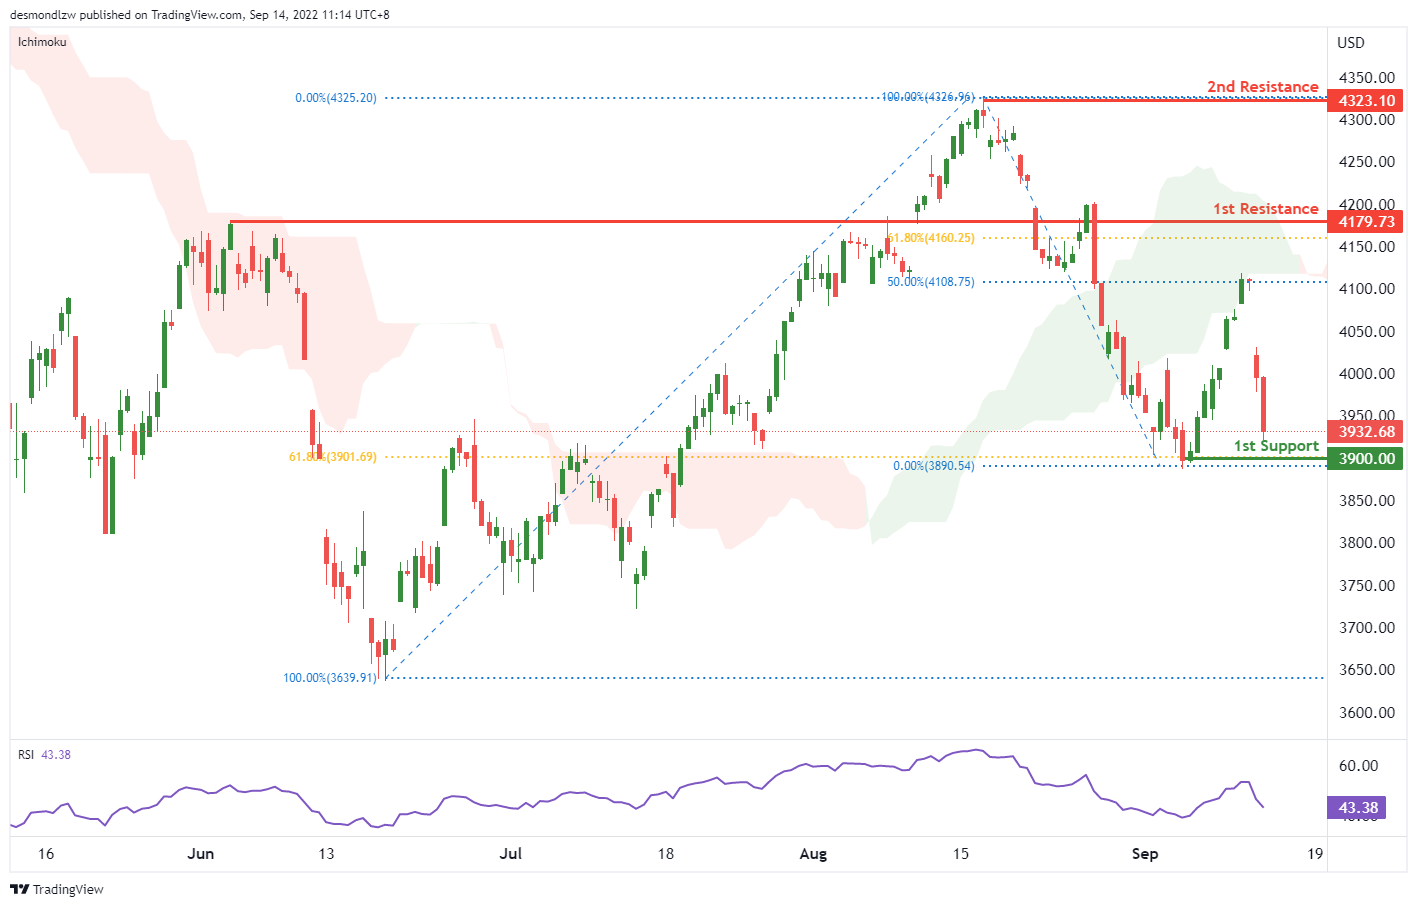
On the H4, price reversed from the 4100 price area forming a bearish channel, with price falling towards the 1st support of 3900. With our bearish bias still valid, as price trades below the ichimoku indicator, look for price to test the pullback support and the 61.8% fibonacci retracement. If price breaks below the support level, price could fall towards the 2nd support of 3648.55 where swing low is. As price falls towards the 2nd support, it could find some brief consolidation at the 78.6% fibonacci retracement pullback support area.
Areas of consideration:
- H4 time frame, 1st support at 3900
- H4 time frame, 2nd support at 3648.55
Markets pricing in 35% chance of 100bps Fed hike next week
US stock tumbled sharply overnight as traders added bets on another aggressive rate hike by Fed on September 21, next Wednesday. The moves came after stronger than expected consumer inflation data. DOW ended down -1276 pts, or -3.94% while S&P 500 fell -4.32%. NASDAQ suffered most by closing -5.16% lower.
Fed fund futures are now fully pricing a 75bps hike, comparing to 91% a day ago, and 73% a month ago. Indeed, there is even 35% chance of a 100bps hike.
10-year yield surged to as high as 3.458 before closing at 3.422. It's still more likely than not for 3.483 high to exert strong resistance to limit upside. Break of 3.176 support will suggest that TNX is extending the corrective pattern from 3.483 with another falling leg. However, strong break of 3.483 will resume medium term up trend. And that could take USD/JPY through 144.98 towards 1998 high at 147.68.