

Sample Category Title
EUR/GBP Daily Outlook
Daily Pivots: (S1) 0.8649; (P) 0.8672; (R1) 0.8695; More...
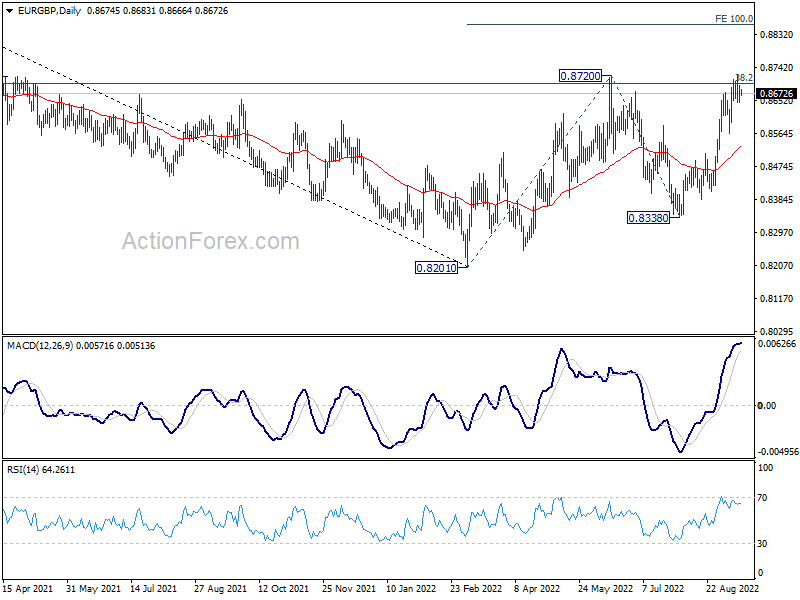
Intraday bias in EUR/GBP remains neutral for the moment. On the upside, firm break of 0.8720 resistance will indicate resumption of whole rise from 0.8201. Intraday bias will be back on the upside for 100% projection of 0.8201 to 0.8720 from 0.8338 at 0.8857. On the downside, however, break of 0.8565 support will indicate rejection by 0.8720 and turn bias back to the downside.
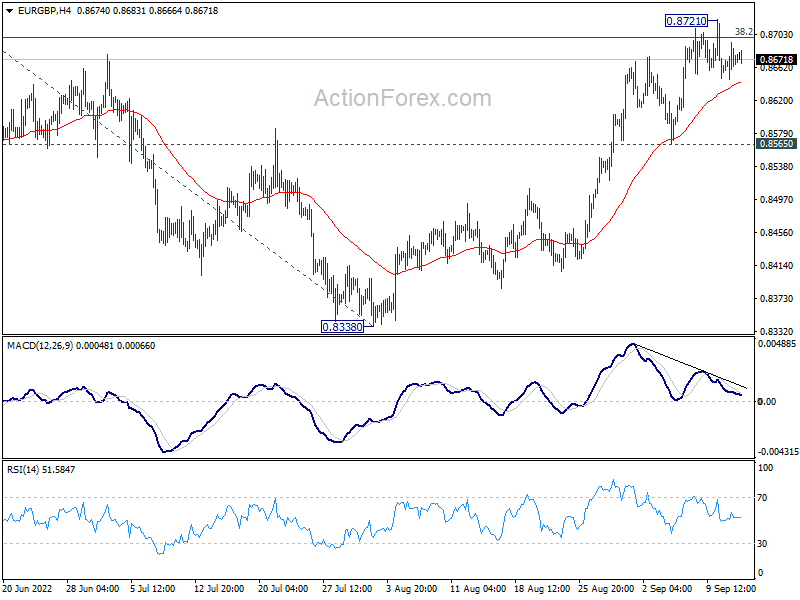
In the bigger picture, focus is back on 38.2% retracement of 0.9499 to 0.8201 at 0.8697. Sustained break there will argue that rise from 0.8201 is a medium term up trend, rather than a correction. Next target is 61.8% retracement at 0.9003. Rejection by 0.8697 again will maintain medium term bearishness, for extending the down trend from 0.9499 (2020 high) at a later stage.
EUR/CHF Daily Outlook
Daily Pivots: (S1) 0.9554; (P) 0.9620; (R1) 0.9655; More....
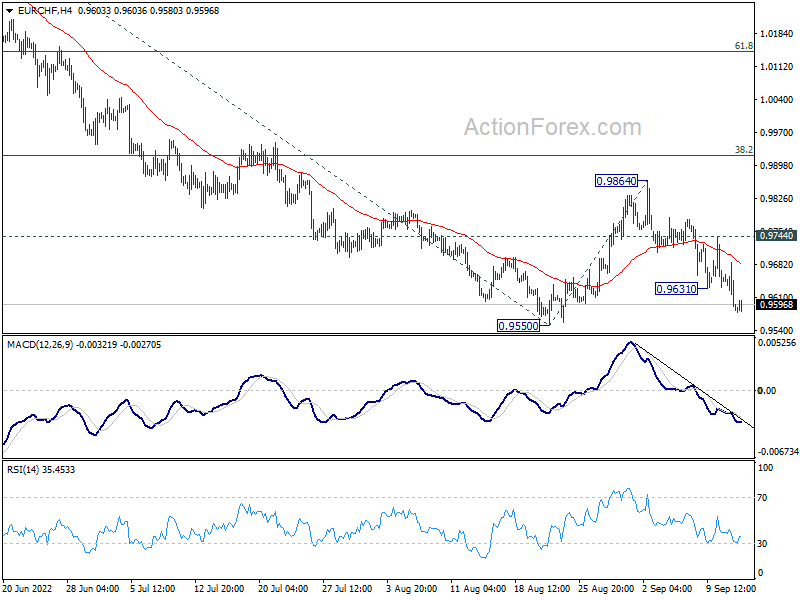
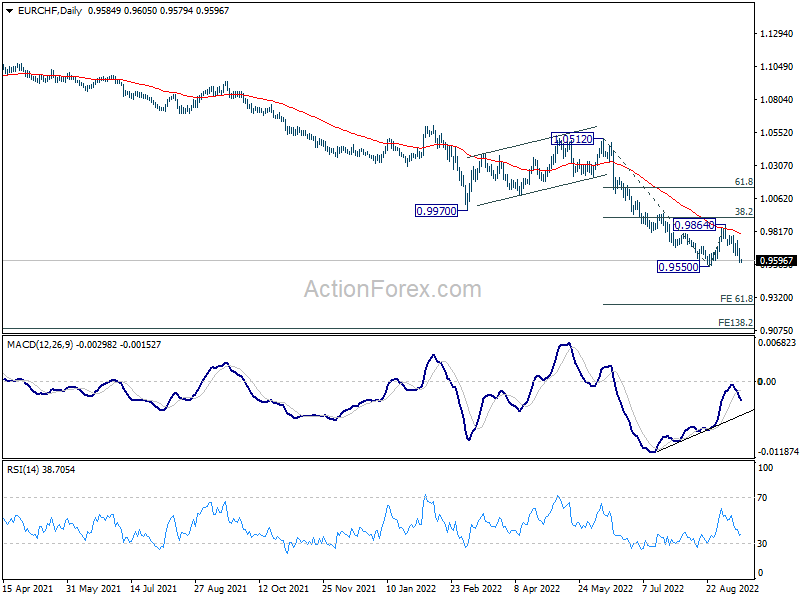
EUR/CHF's fall from 0.9864 resumed by breaking 0.9631 and intraday bias is back on the downside. Retest of 0.9550 low should be seen first. Decisive break there will resume larger down trend. Next target is 61.8% projection of 1.0512 to 0.9550 from 0.9864 at 0.9269. On the upside, above 0.9744 minor resistance will extend the corrective pattern from 0.9550 with another rising leg.
In the bigger picture, long term down trend from 1.2004 (2018 high) is still in progress. Next target is 138.2% projection of 1.2004 to 1.0505 to 1.1149 at 0.9033. On the upside, break of 0.9970 support turned resistance is needed to be the first sign of medium term bottoming. Otherwise, outlook will stay bearish in case of strong rebound.
NZDUSD Plummets to Fresh 28-month Low Below 0.6000
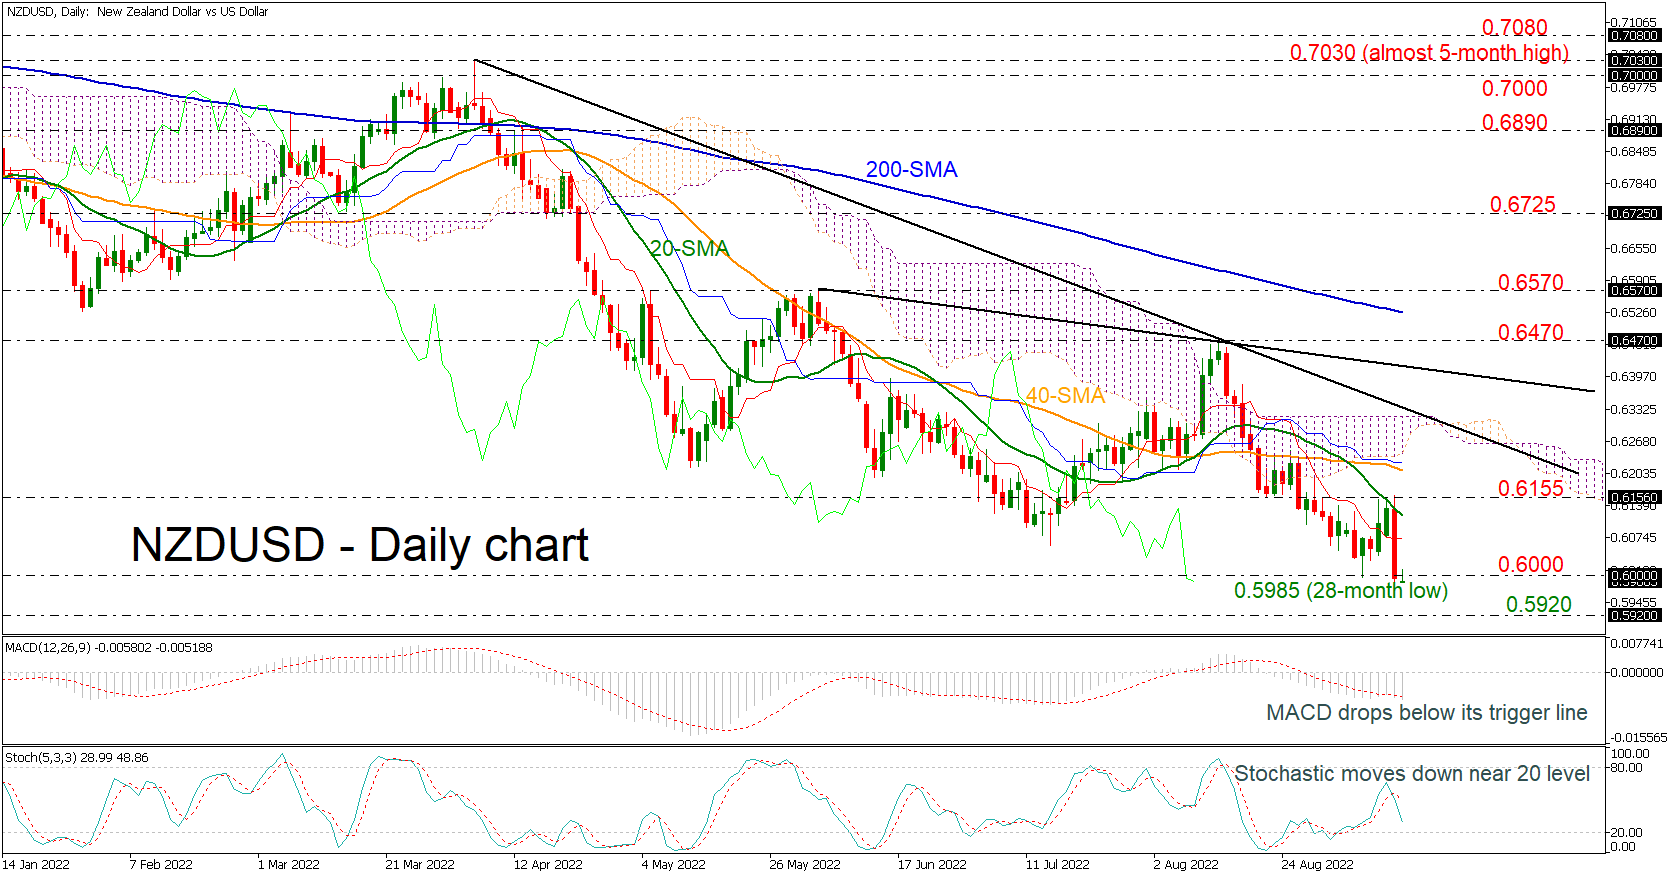
NZDUSD plunged to a new 28-month low of 0.5985 during yesterday’s session after it found strong resistance near the 20-day simple moving average (SMA). The price is holding well below the Ichimoku cloud as well as the short- and long-term descending trend lines.
Technically, the MACD oscillator has dived beneath its trigger line in the negative region, while the stochastic is approaching the 20 level following the bearish crossover within its %K and %D lines.
As the price falls beneath the 0.6000 psychological level, the next support to have in mind is the 0.5920 barrier, taken from the bottoms in May 2020. Even lower, the market may meet the trough at 0.5468, registered in March 2020.
On the flipside, if there is a successful climb beyond the 0.6000 mark, the price may run towards the 20-day SMA at 0.6117 ahead of the 0.6155 barrier. Above that, traders may turn their focus on the 40-day SMA at 0.6210, which overlaps with the lower boundary of the cloud and the blue Kijun-sen line. Higher up, the short-term downtrend line at 0.6320 may halt the bullish actions.
All in all, NZDUSD has been developing within a descending move since April 5, and only an advance above the long-term diagonal line may change this outlook.
USD/CNH: Global Corrective Movement Likely to Complete in the Next Coming Trading Days
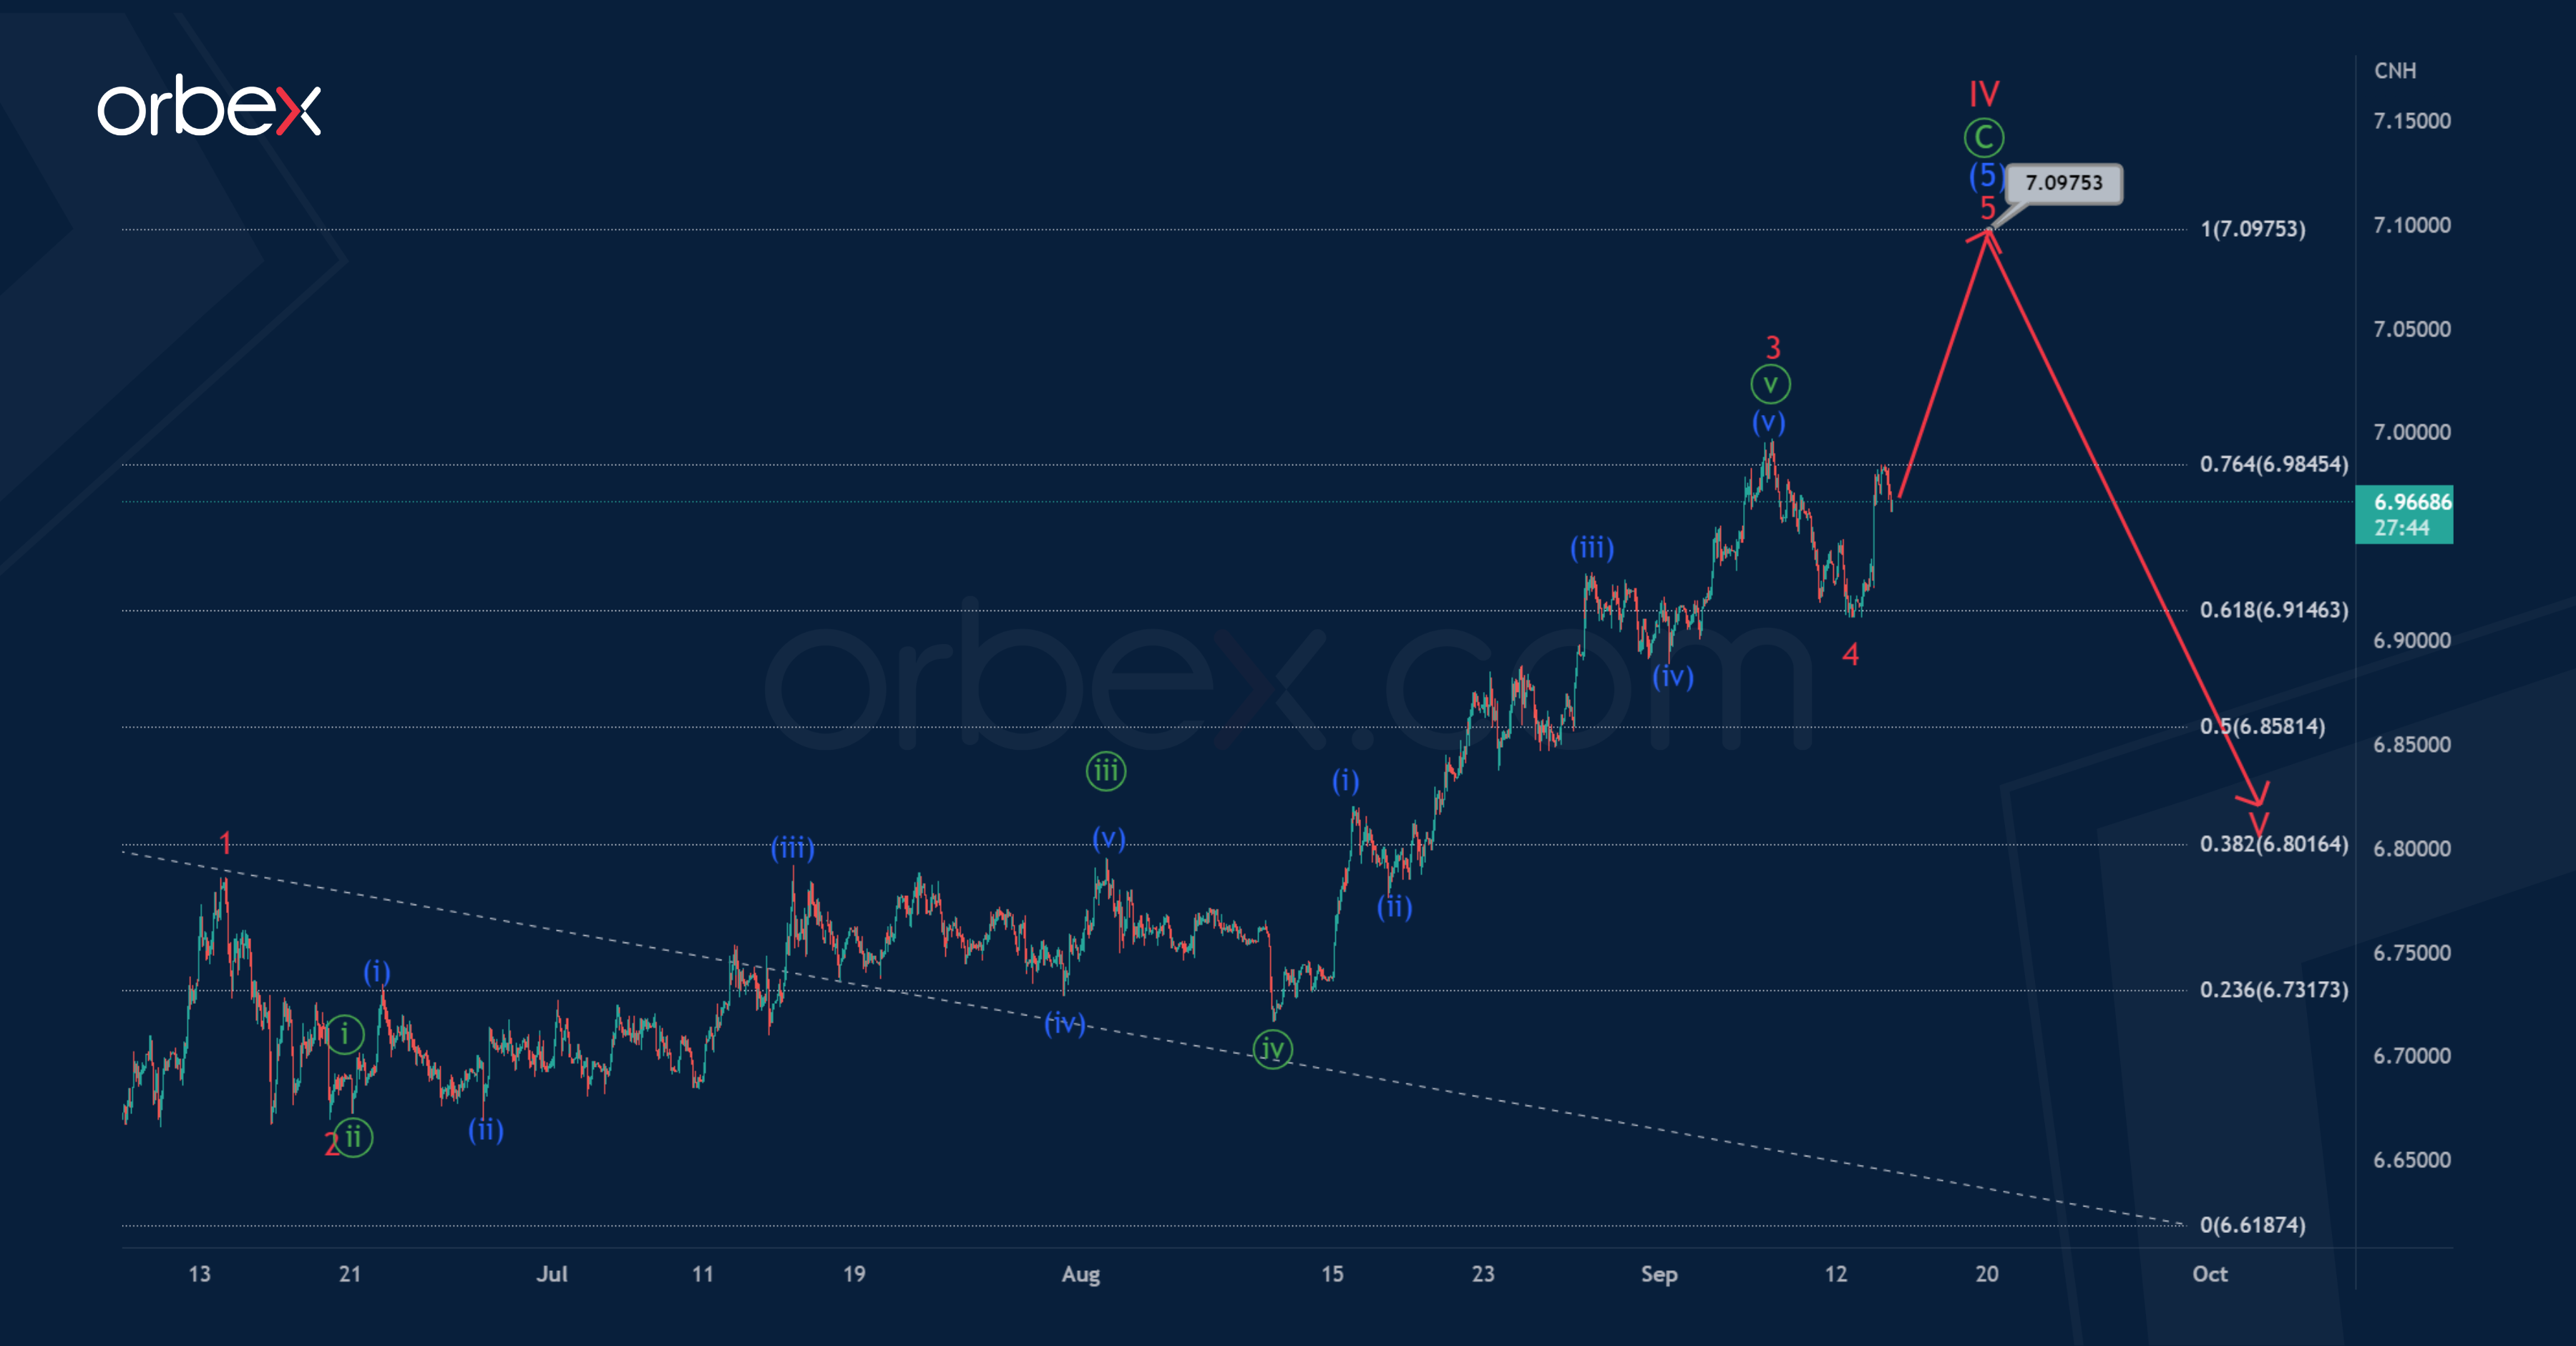
The current formation of the USDCNH shows the primary zigzag pattern Ⓐ-Ⓑ-Ⓒ, which in the long term seems to be forming a large correction IV of the cycle degree. This pattern today looks completed in two parts out of three.
The last primary wave Ⓒ takes the form of an intermediate 5-wave impulse (1)-(2)-(3)-(4)- (5).
Perhaps the last intermediate wave (5) is currently under development. It is assumed that it will take the form of a minor impulse 1-2-3-4-5. For its full completion, a sub-wave 5 is needed. The growth in this wave may continue to 7.097.
At that level, sub-wave (5) will be at 100% of wave (3).
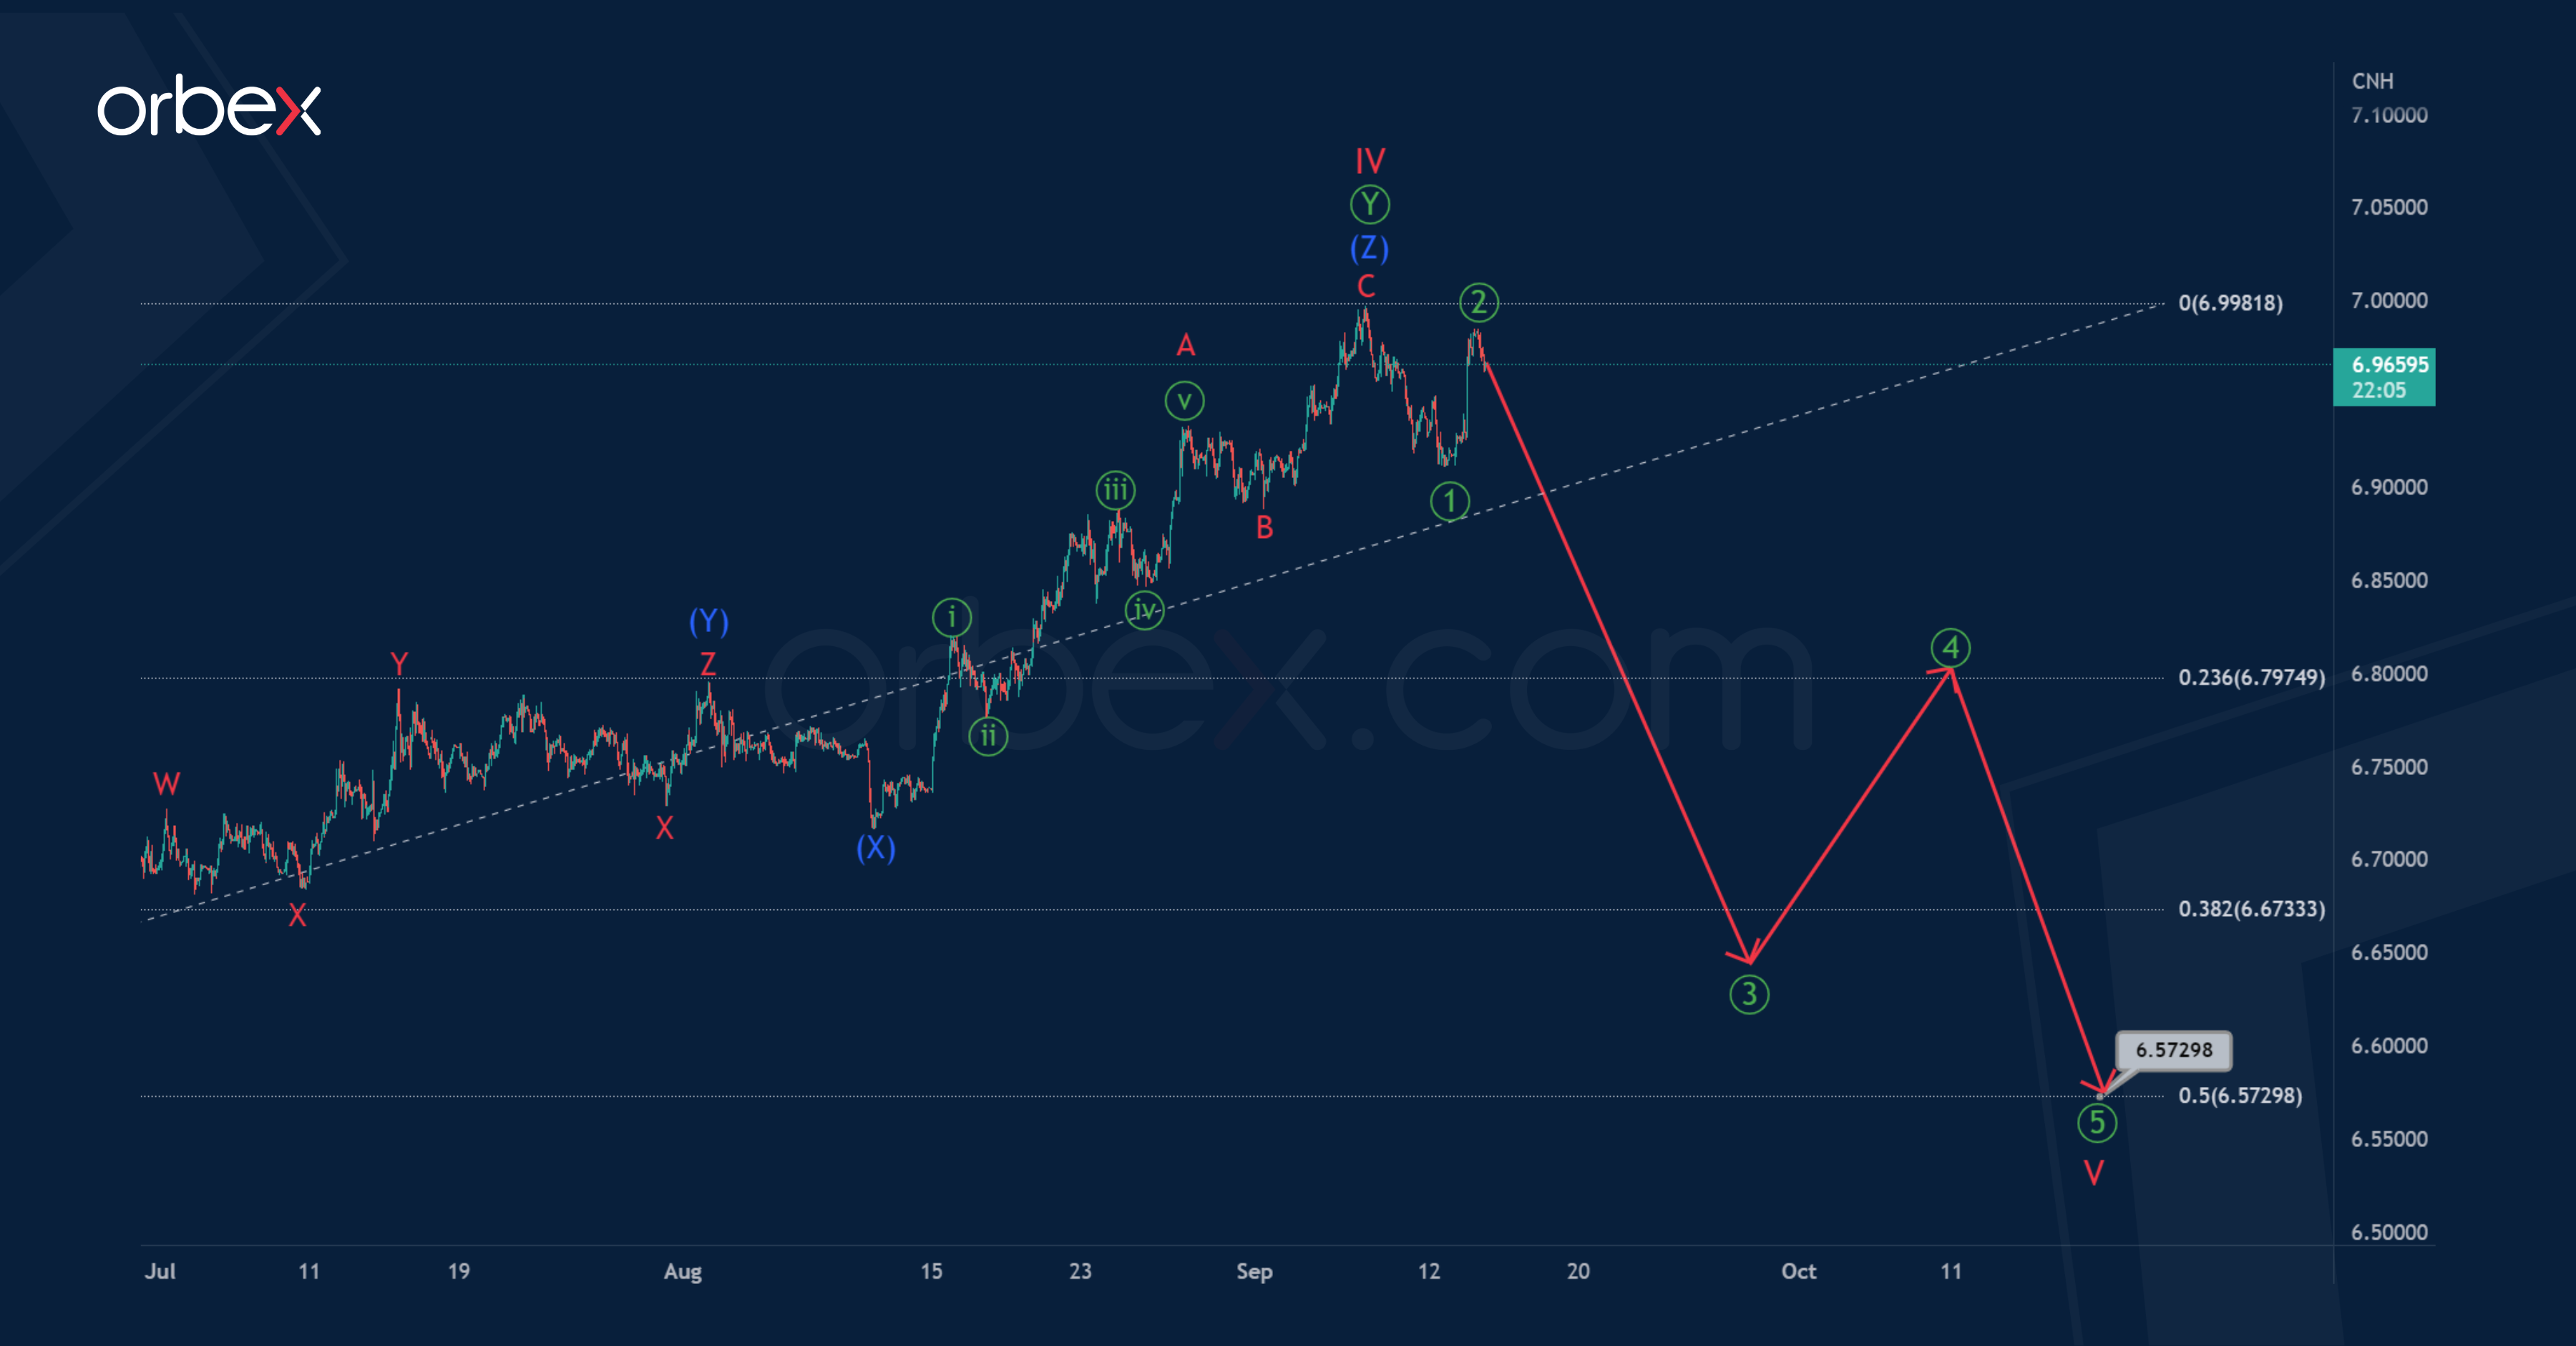
An alternative scenario shows that the construction of the entire cycle correction IV has already been fully completed. It took the form not of a simple zigzag, but of a double zigzag consisting of primary sub-waves Ⓦ-Ⓧ-Ⓨ.
If this assumption is correct, then the market may begin to move in a downward direction, forming the final cycle wave V.
Most likely, the wave V will have the form of a primary impulse, as shown in the chart. And it will finish its pattern near 6.572. At that level, sub-wave V will be at 50% of impulse III.
Daily Technical Analysis
EUR/USD
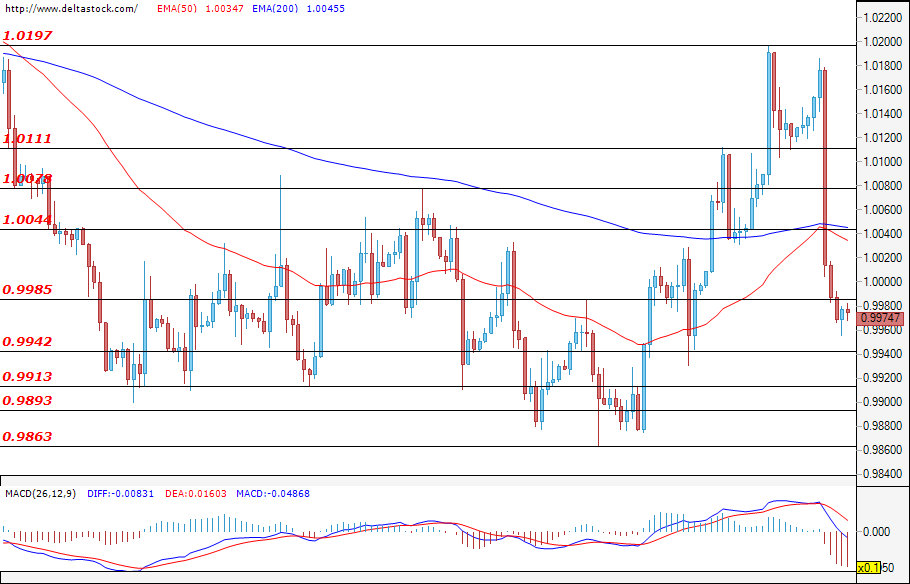
The Common European currency lost quite a bit of ground against the dollar and the rate dropped and tested the support zone at 0.9985. This result came after the CPI print did not align with the market’s expectations, fueling speculations for а 100 bps rate hike by the Fed in November. During the early hours of today`s trading, the pair continued to trade just below the mentioned zone, but if the bearish attack continues, then a test of the lower target at 0.9942 would be a highly probable scenario. A successful violation here could easily deepen the decline and could pave the way towards the major zone at 0.9913. If the bulls prevail, then their first target can be found at 0.9985, followed by the upper resistance at 1.0044. Only a breach of the level at 1.0078 and a follow-up breach of the next zone at 1.0111 could draw a more bullish picture for the currency pair.
USD/JPY
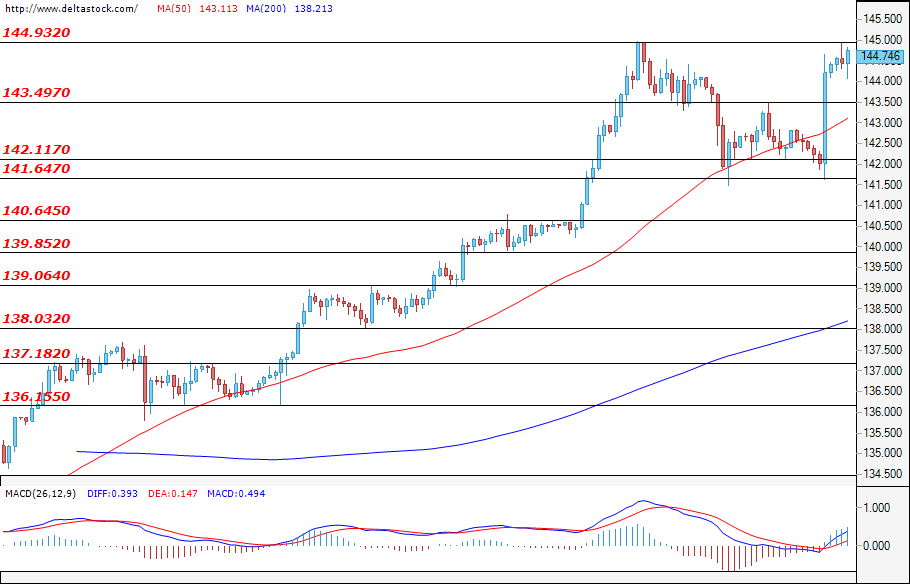
The bulls prevailed and the dollar recovered most of its recent losses against the yen. The Ninja rallied, and during the time of writing the analysis, the pair is heading for a test of the major resistance at 144.93. A successful violation here could easily lead to a more sustained rally, strengthening the positive expectations for the future path of the USD/JPY. If the bullish momentum fades instead, then the first support for the bears would be the zone at 143.49. A breach of the lower target at 142.11, followed by a violation of the local lows at 141.64, could deepen the correction towards the important level at 140.64.
GBP/USD
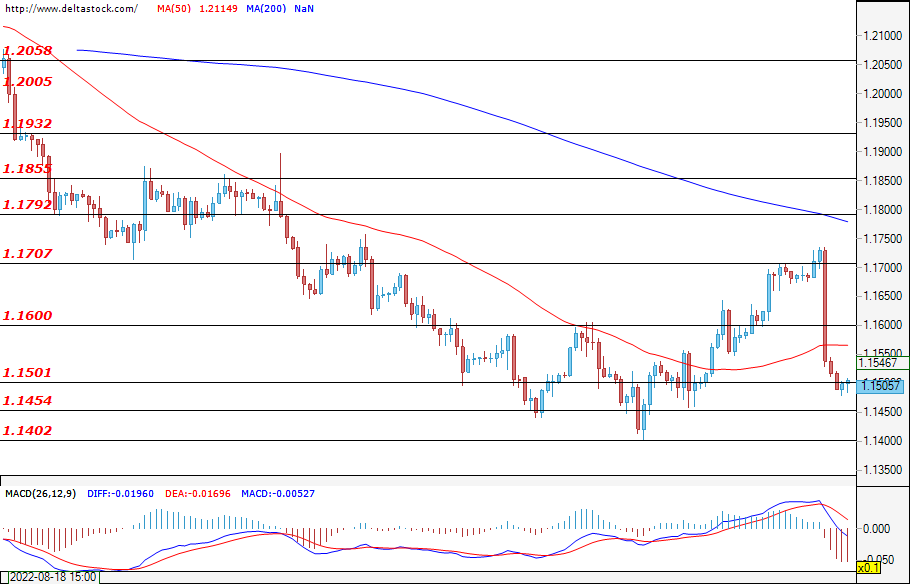
The recovery of the Cable was limited to the resistance at 1.1707 where the bears entered the market. The following breach at the support at 1.1600 led to a deeper decline, and during the early hours of today`s trading, the pair is testing the lower zone at 1.1501. A violation of the important support at 1.1454, followed by a breach of the local low at 1.1402, could lead to new losses for the GBP against the USD and could easily continue the sell-off. Better-than-expected UK data for its CPI (today; 06:00 GMT) could help the bulls to take control. A successful attack on the zone at 1.1600, followed by a breach of the high at 1.1707, could form the current move as corrective and could strengthen the positive expectations for the future path of the pair.
EUGERMANY40
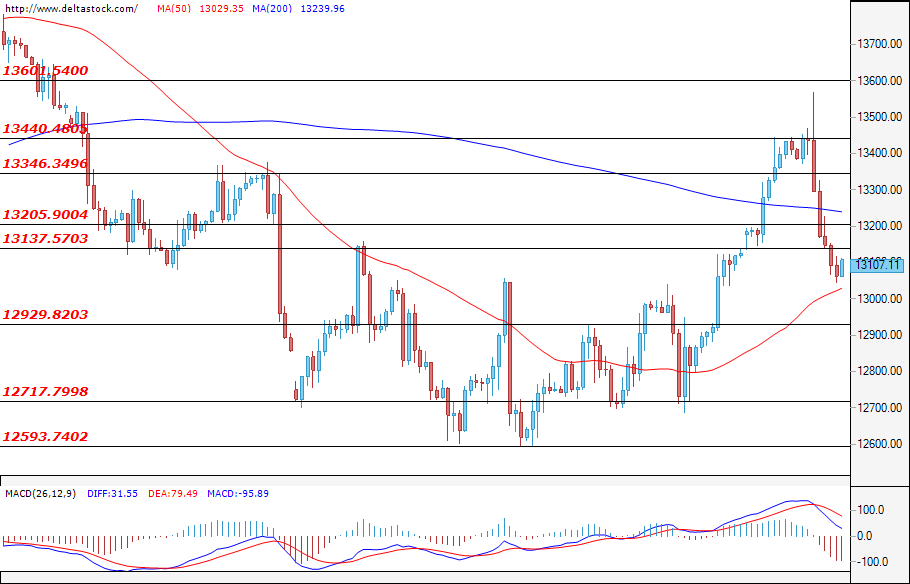
Just like its counterparts across the world, the German index tumbled and stabilised just under the support at 13137. If the bearish prevalence continues, then a successful violation of the next support at 19929 could easily deepen the sell-off and lead the index towards the lower zone at 12717. First target for the bulls is the mentioned level at 13137, which is now acting as resistance, followed by the upper one at 13205.
US30
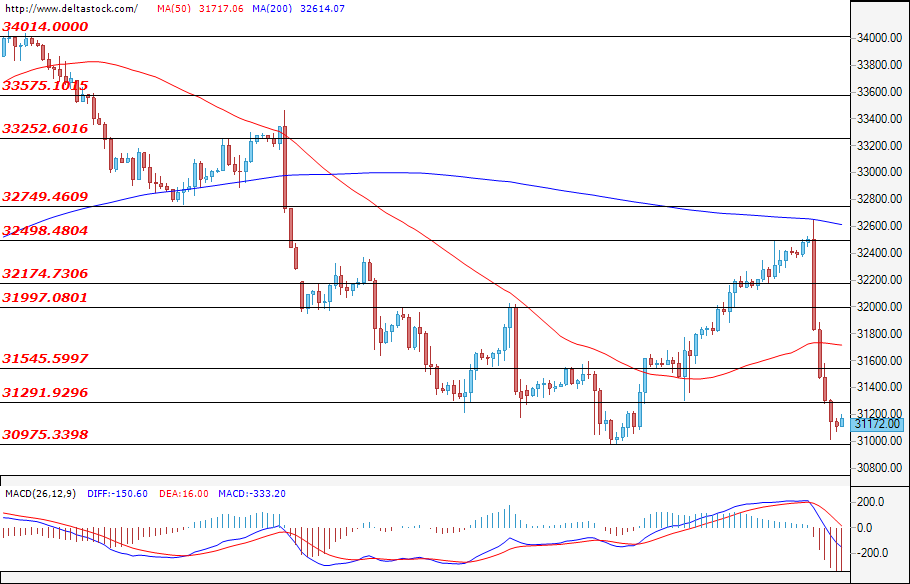
Yesterday’s worse-than-expected U.S. CPI data led to a sell-off for the US30 and the index erased all of its recently recovered positions. During the early hours of today, the price is hovering above the local low at 30975, and a test of the mentioned zone could be the most probable scenario. A successful breach here could strengthen the negative expectations and could easily deepen the decline towards 30700. If the bulls re-enter the market and manage to violate the level at 31291, then а breach of the upper target at 31545 could lead to a correction towards the zone at 31997.
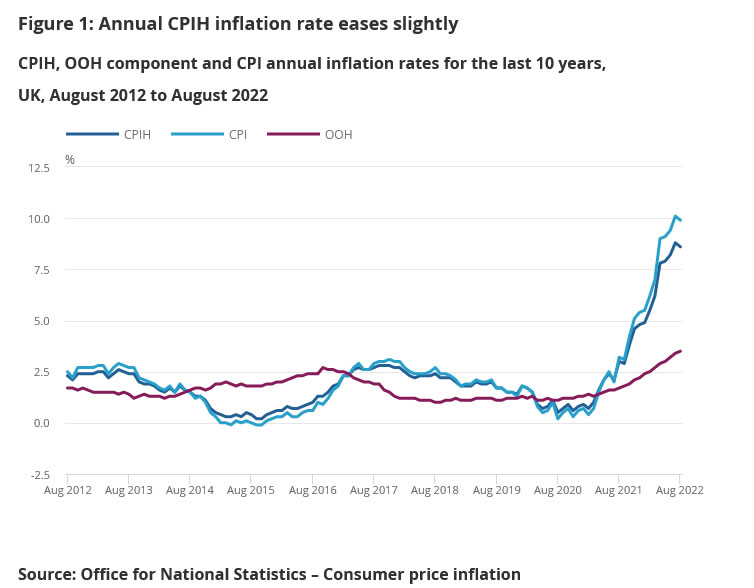
UK CPI slowed to 9.9% yoy in Aug, core CPI ticked up to 6.3% yoy
UK CPI slowed from 10.1% yoy to 9.9% yoy in August, below expectation of 10.2% yoy. CPI core rose from 6.2% yoy to 6.3% yoy, matched expectations. The largest contributions to the annual rate in August are from housing and household services, transport, and food and non-alcoholic beverages. July's figure was the highest since 1982 based on indicative model.
On monthly basis, CPI rose 0.5% mom, slowed from prior 0.6% mom. Food and non-alcoholic beverages made the largest upward contribution to the monthly rates, while falling prices for motor fuels resulted in a large offsetting downward contribution.
Also released, RPI came in at 0.6% mom, 12.3% yoy, below expectation of 0.7% mom, 12.4% yoy. PPI input was at -1.2% mom, 20.5% yoy, versus expectation of 1.2% mom, 21.0% yoy. PPI output was at -0.1% mom, 116.1% yoy, versus expectation of 1.6% mom, 17.8% yoy. PPI core output was at 0.3% mom, 13.7% yoy, versus expectation of 1.5% yoy.
FTSE 100 Hits Major Resistance
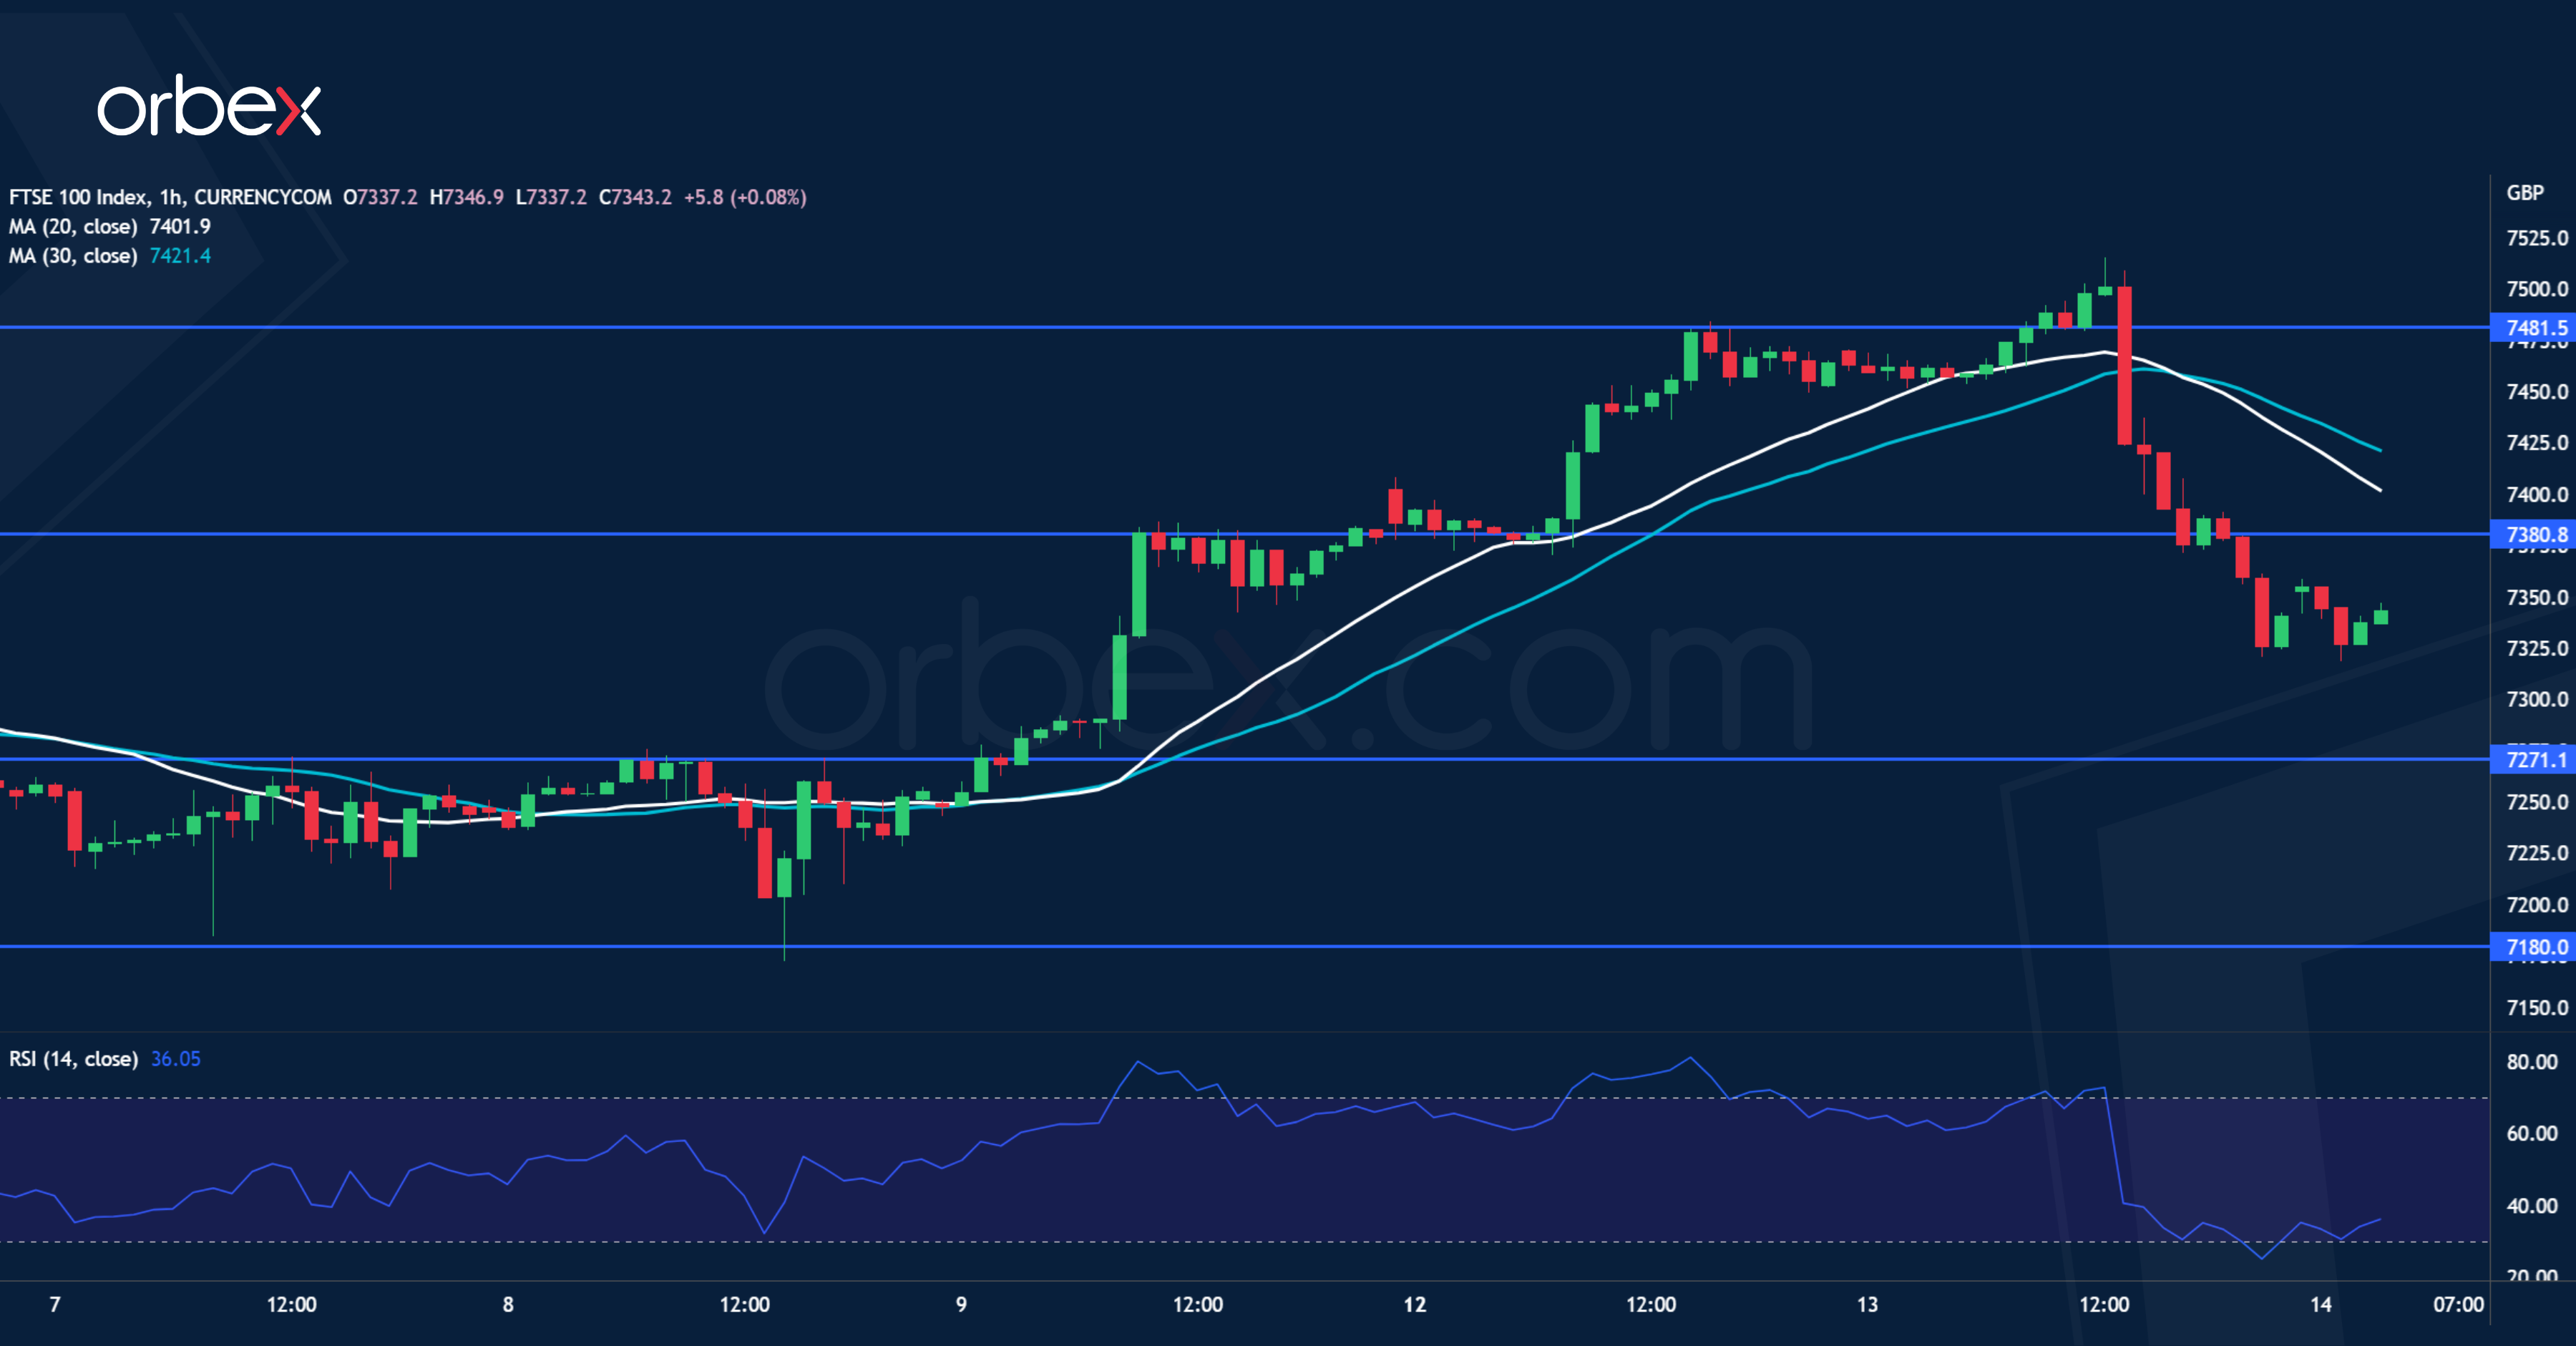
Global equities tumbled after being wrongfooted by inflation data. The FTSE 100 had recouped most of the losses from the mid-August liquidation but turned south near the previous peak at 7570. Strong selling below 7370 forced more buyers to bail out. 7270 at the origin of a bullish breakout is a key level to see whether there is strong enough interest in keeping the rebound intact. Or 7180 could be the last level to keep the index afloat. 7380 is the first resistance as an oversold RSI may cause a limited bounce.
XAU/USD Tests Key Support
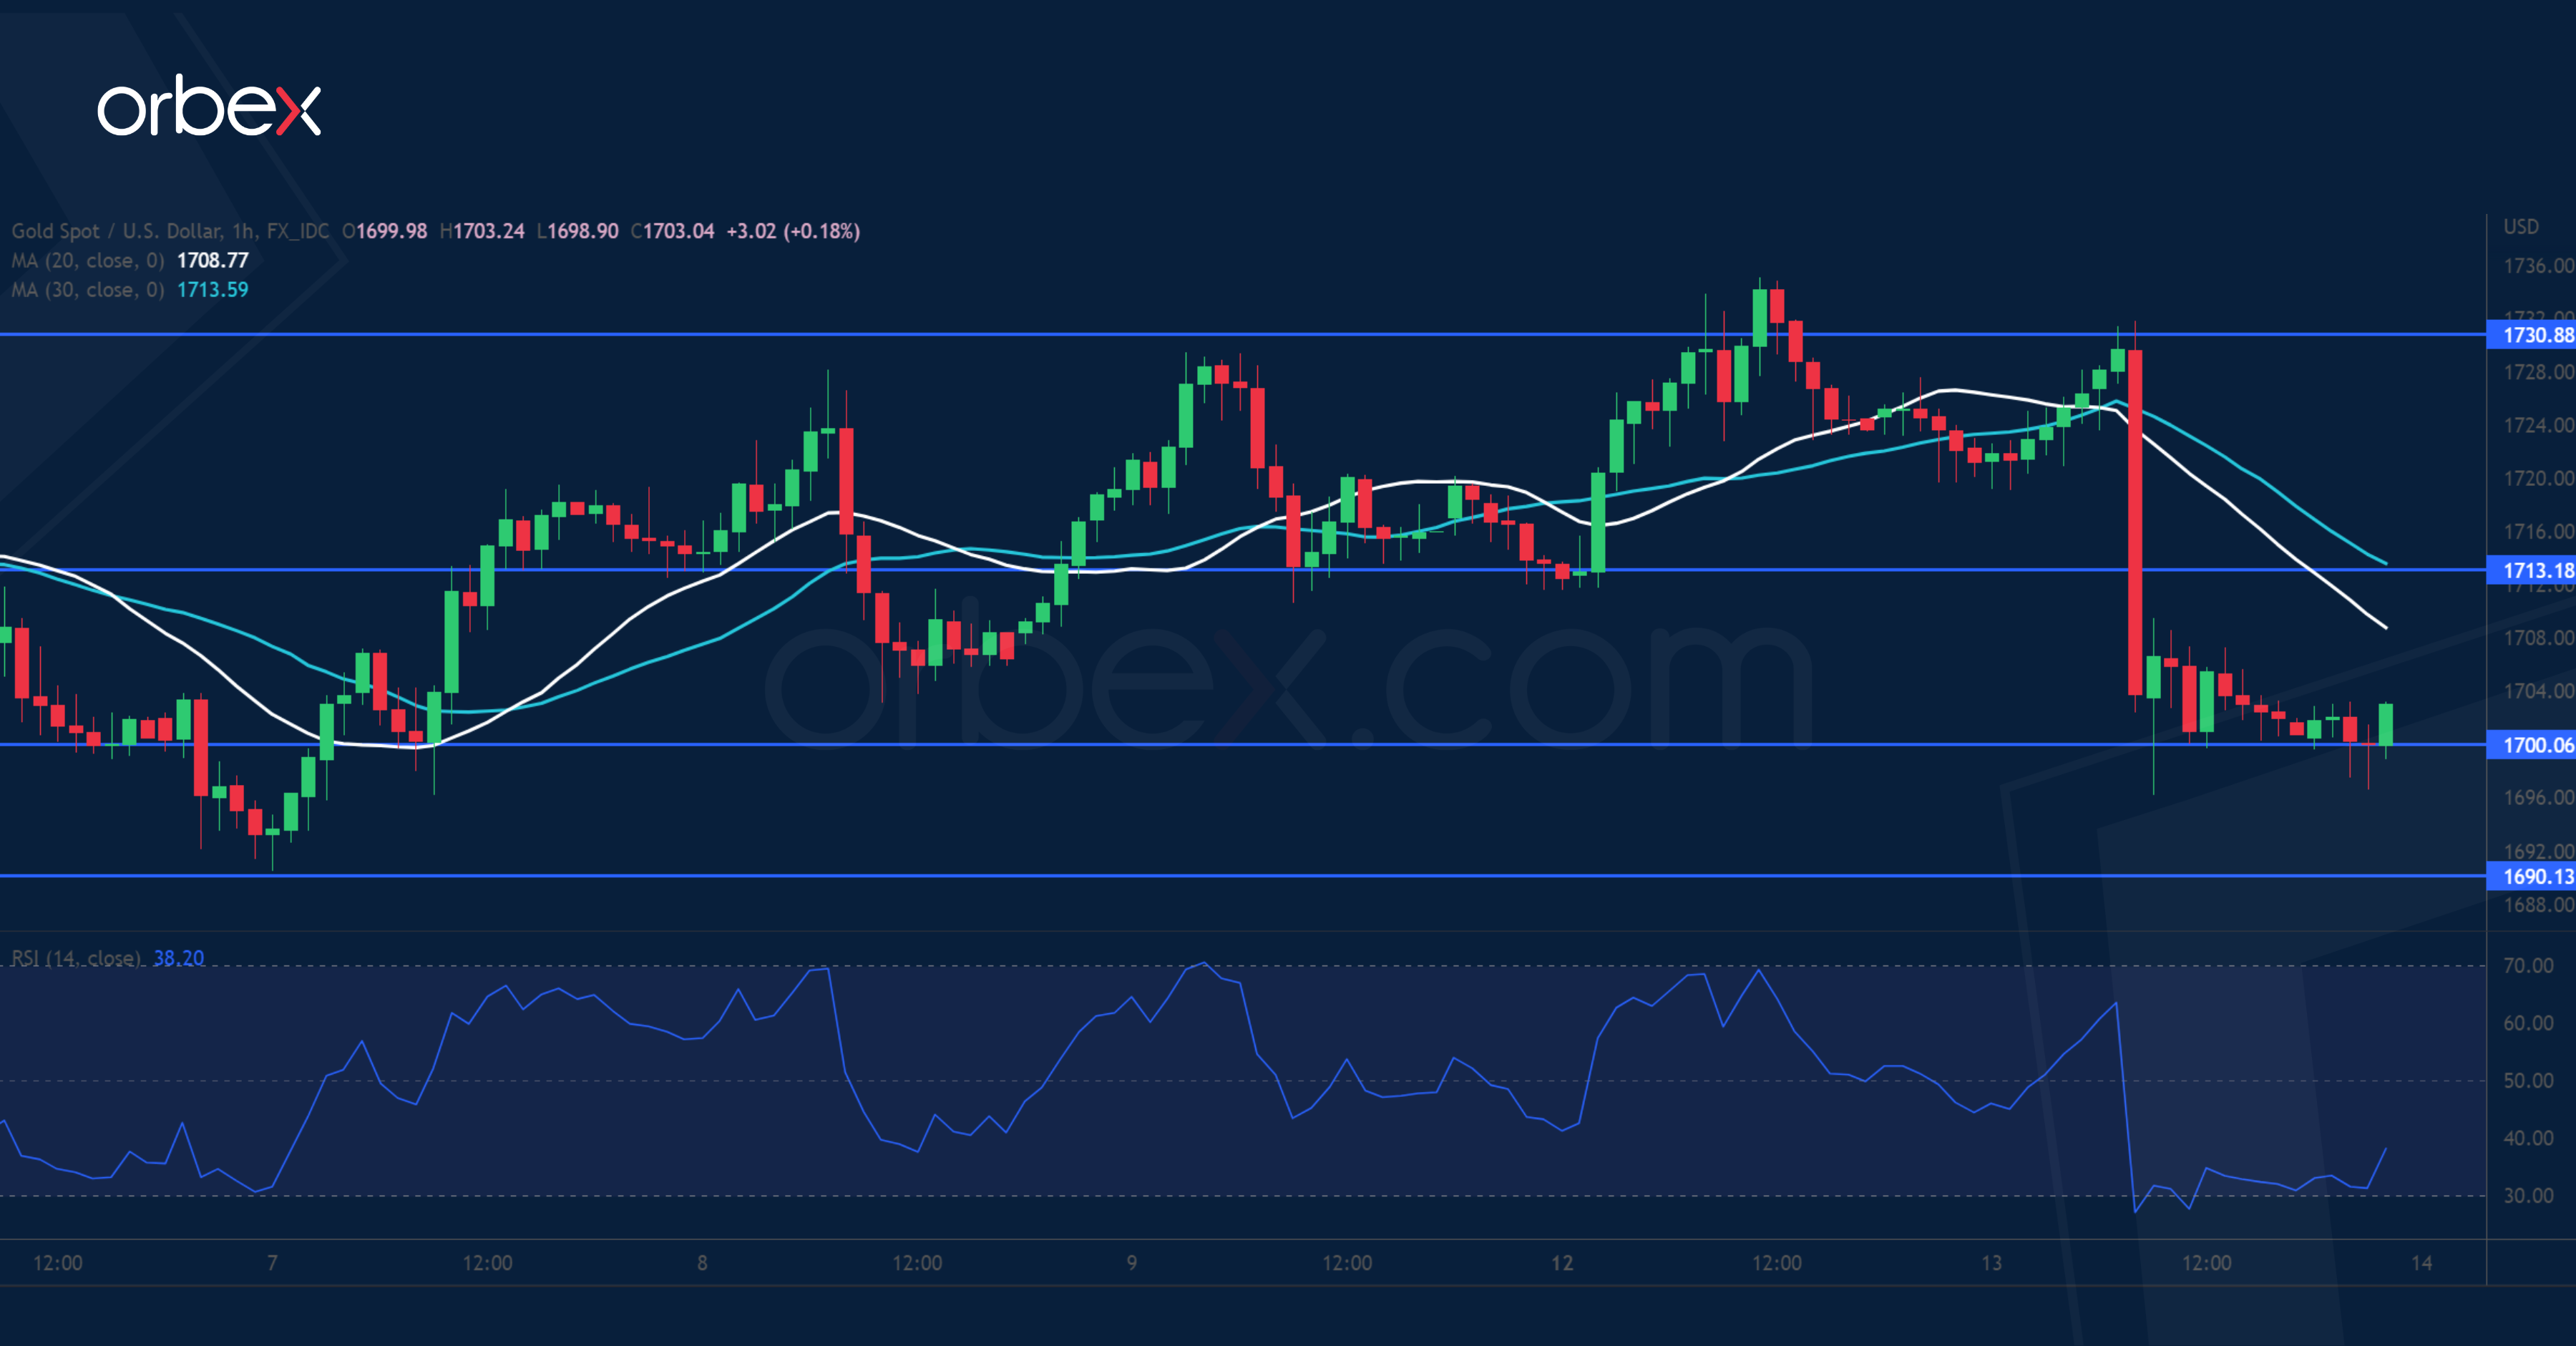
Gold tumbled after hotter US inflation propelled the greenback across the board. The precious metal has been grinding its way up after it stabilised next to the major support 1690. Though it gave up its latest gains and came to a rest on the psychological tag of 1700. The price action is now at a crossroads. A lack of follow-up bids could shift the direction to the sell side. A drop below 1690 might seal its fate and cause an extended sell-off. 1713 is the first hurdle and the bulls need to clear 1730 before they can regain control.
EUR/USD Seeks Support
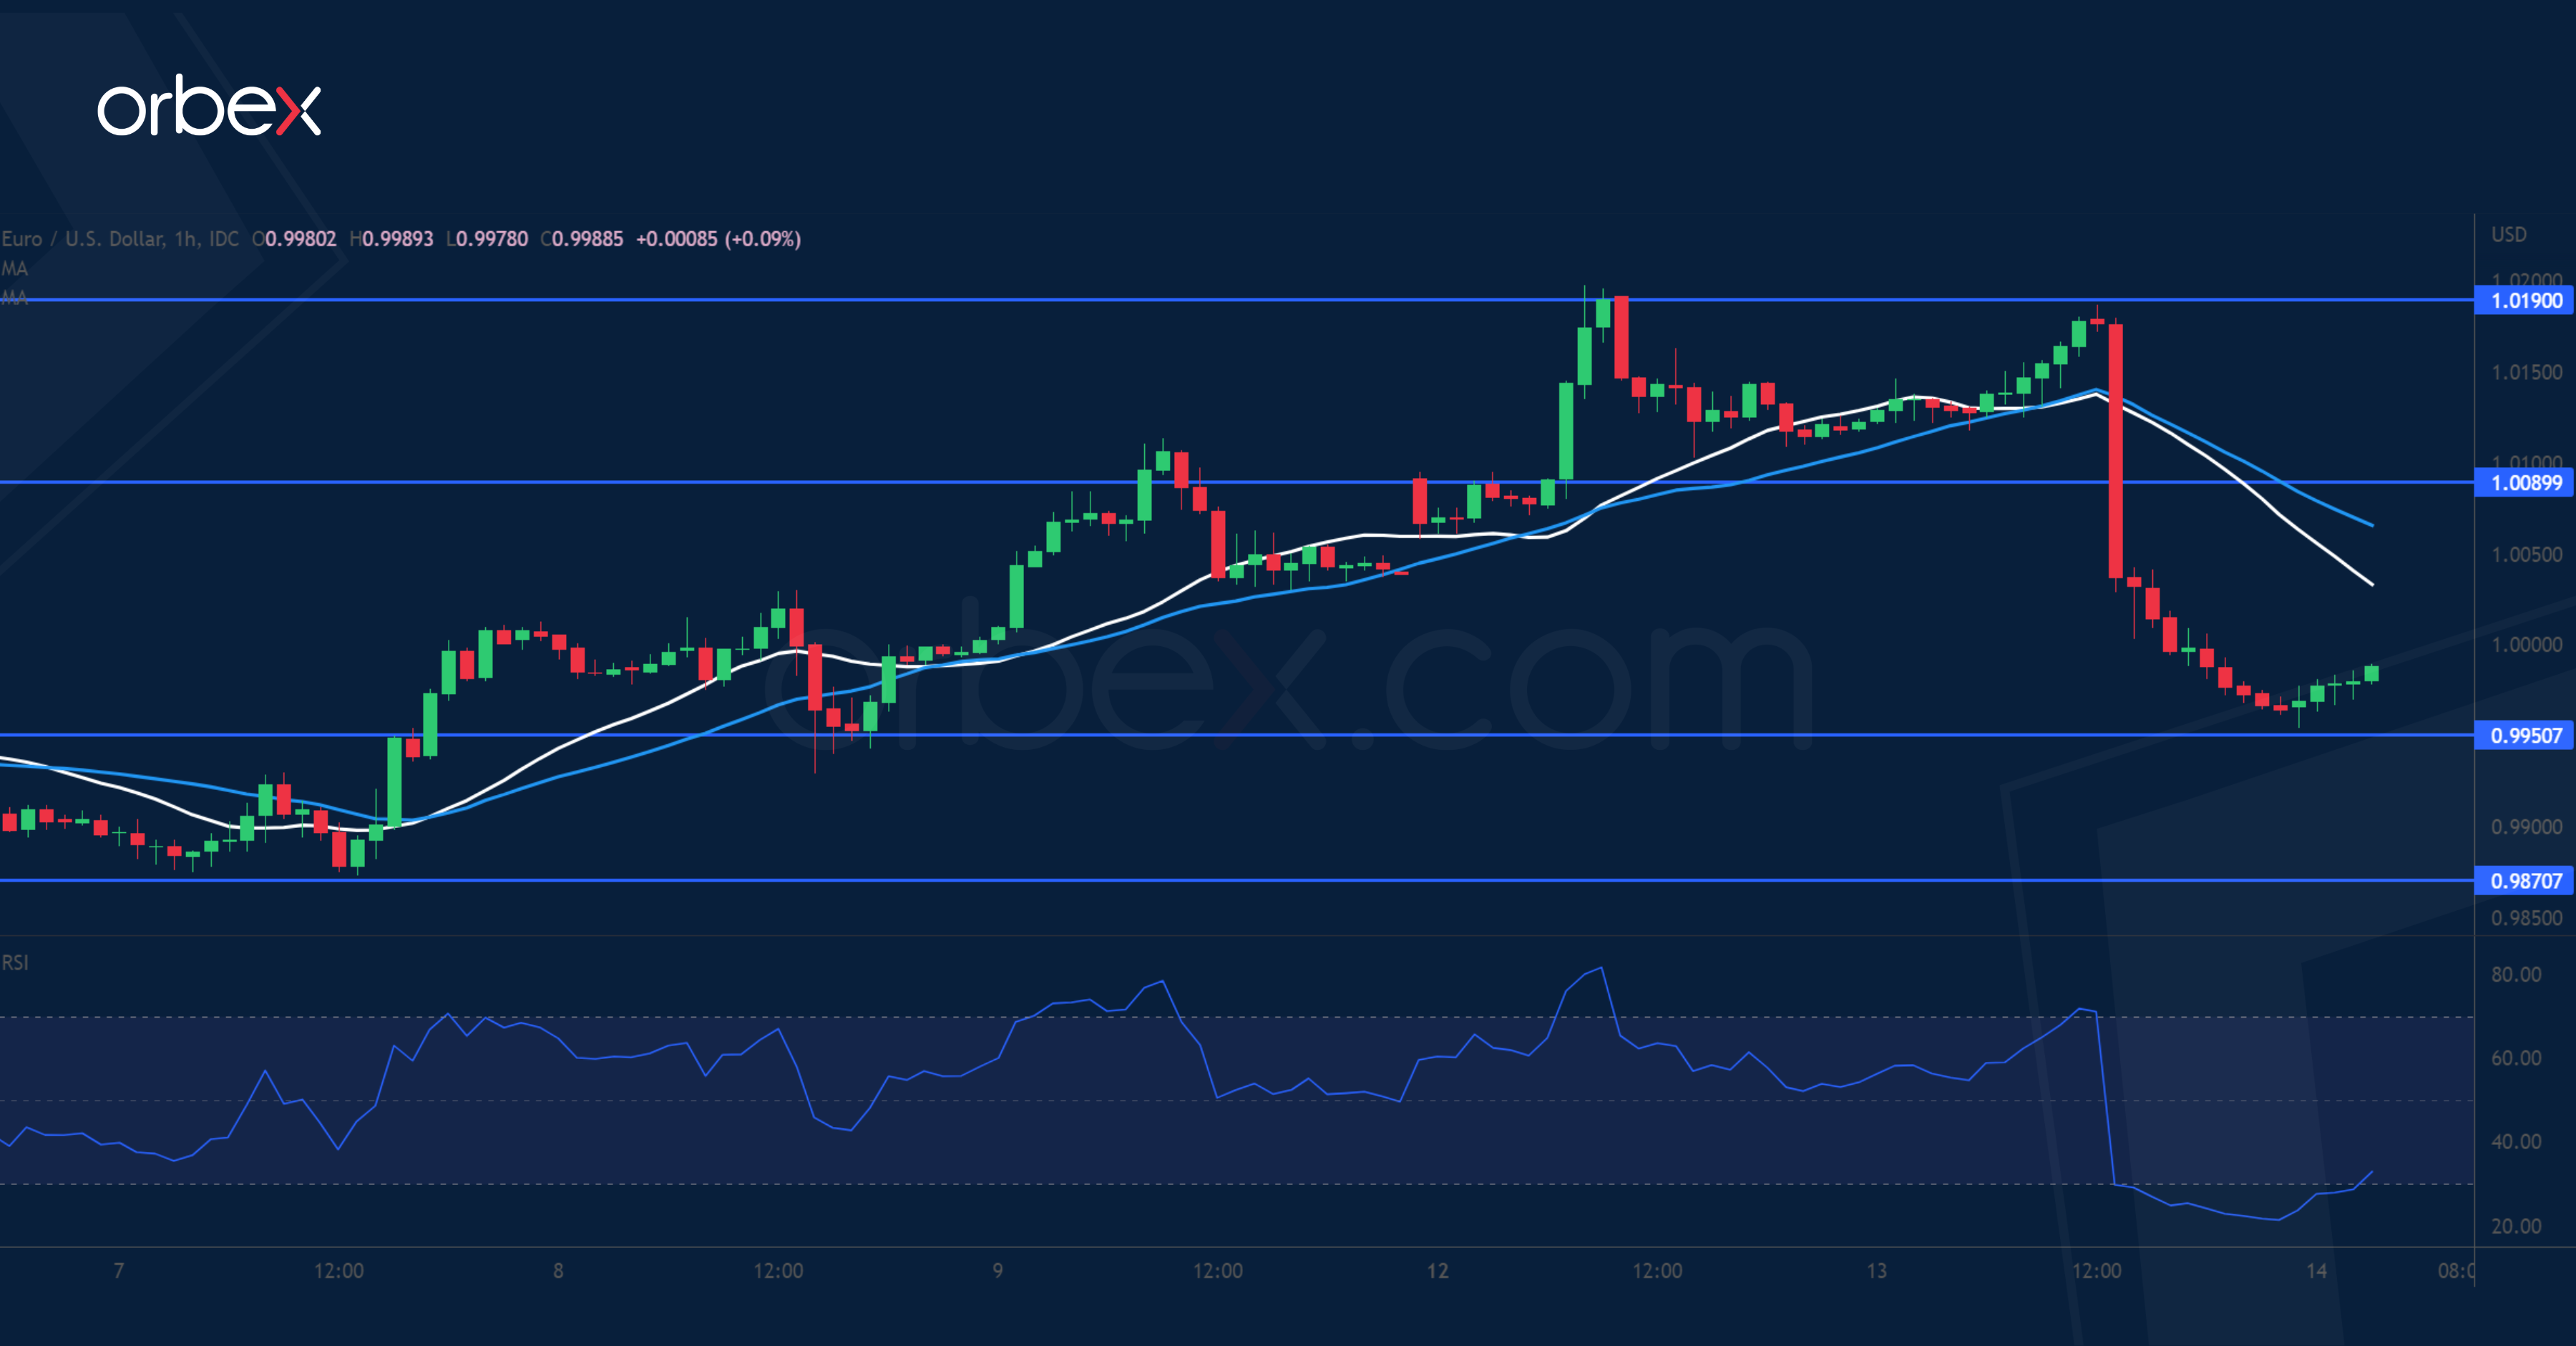
The US dollar surged after consumer prices rose faster than expected last month. The euro’s rally came to a halt in the supply zone around 1.0190, then a fall below 1.0090 forced leveraged short-term long positions to close out. After the RSI sank into oversold territory, some traders could be tempted to buy the dip between 0.9950 and the parity level. 0.9870 is a critical floor and its breach would invalidate the current rebound and send the single currency below 0.9800. On the upside, 1.0090 has turned into a resistance.
Cost of Prematurely Crying Victory
Ouch! The US inflation data release didn’t go according to the plan yesterday. The headline figure printed 8.3% inflation in August, higher than the 8.1% expected by analysts, and happily, slightly lower than last month’s 8.5%.
Yet, the US food price inflation accelerated to 11.4%, from 10.9% printed a month earlier due to high energy prices, the war in Ukraine – which disrupted the wheat supply, a drought in Brazil that put a severe upside pressure on coffee costs and a bird flu outbreak in January that pushed chicken and egg prices higher.
Plus, the core inflation, which doesn’t take into account the volatile food and energy prices accelerated faster than expected to 6.3%, whereas the expectation was a slight rise from 5.9% to 6.1%.
To say the least about the most, the latest US CPI data hasn’t been as soft as investors hoped it to be, nor has it been as optimistic as investors priced it to be. The 10% fall in energy prices was compensated by higher rents, medical care and food prices. All items excluding energy rose 7.4% in the past three months. That was faster than the figures printed last spring.
It’s needless to say that the hope of seeing a dovish pivot regarding the Federal Reserve (Fed) policy is clearly dashed. Activity in Fed funds futures price in a 100% chance for at least a 75bp rate hike at the FOMC’s meeting next week, while there is 34% chance of a 100bp hike next week.
Bets that the Fed’s target rate will go above 4% by the end of this year spiked to 80% from 25% before the CPI data yesterday. The US benchmark rate is seen at around 4.3% in early 2023.
And the chatter of a possible rail strike in the US - which would send another supply chain shock throughout the economy - is a fresh factor that could prevent inflation from falling this month, and adds to the hawkish Fed expectations.
Market reaction to the cocktail of bad news and data was wild yesterday
The US 2-year yield spiked more than 5% to 3.80%, the US dollar index jumped 1.50%, and equities slumped. The S&P500 futures fell free as soon as we saw the inflation print come in, and the index closed the session 4.30% lower, having slipped below the 4000 mark.
Two major catalyzers of the two bullish price actions since summer have now both fallen.
- The summer rally was due to the softening Fed expectations due to recession chatter. Jerome Powell killed that hope at his Jackson Hole speech, saying that the Fed will tighten to fight inflation despite damages to the economy. That was the first hit.
- Then, the markets got back on feet on hope that inflation may have slowed enough to allow the Fed to soften its tone later this year. And yesterday’s inflation data shot that hope to the ground, as well.
In summary, both the recession, and the softer inflation catalyzers are both gone now. What that means for the market is: the S&P500 could continue its journey to the south, and we could see the index fall to 3800 mark in the coming weeks.
Oil down, then up
The strong inflation data, which boosted the Fed hawks, also weighed on the global growth prospects sending the barrel of American crude down to $81 first. But oil managed to recover losses on news that the US would refill the Strategic Oil Reserves at prices below $80 per barrel. The latter gave a boost to the bulls and pushed the price of a barrel to $88 mark. We are around $87 this morning, with however, topside seen capped into the $90 psychological resistance.
Every news is bad news for gold
Gold tipped a toe below the $1700 level posterior to the US inflation data and is trying to find ground around this level this morning.
Prospects for gold are soft for both the hawkish and dovish Fed expectations. The hawkish Fed expectations boost the dollar and the US yields and weigh on gold appetite. Dovish Fed expectations, on the other hand, boost the risk appetite, and drive capital to riskier, and better yielding assets – like equities, leaving gold behind. So, the risks in gold remain tilted to the downside, and a further fall toward $1650 is on the cards.
Due today: More inflation data
The UK just revealed its latest inflation figure this morning. Inflation in Britain came in 9.9% in August, below the 10% mark, and below 10.2% expected by analysts. How great!
The softer than expected figure didn’t do any good to the pound, however. Cable, which was doing just fine above 1.17 before the US inflation data punched the pair to the ground yesterday, slipped below 1.15 after the CPI release.
Across the Channel, the strong dollar abated the EURUSD bulls and pushed the pair below parity, yet again. News that Ukraine is pushing back the Russian troops are positive for the euro, but there is little chance that the optimistic war news would take the upper hand, when the dollar is so strong at the wake of such a disappointing US inflation data.
Later today, the US will reveal the latest producer price index. The PPI is expected to have eased from 9.8% to 8.8% in August. A sufficiently soft figure could spray some water on fire, but will hardly reverse the bad mood. The dollar will likely remain strong, equities, gold and cryptocurrencies will likely remain under pressure until investors find another glimpse of hope, somewhere in the dark.