Sample Category Title
EUR/JPY Continues to Recover
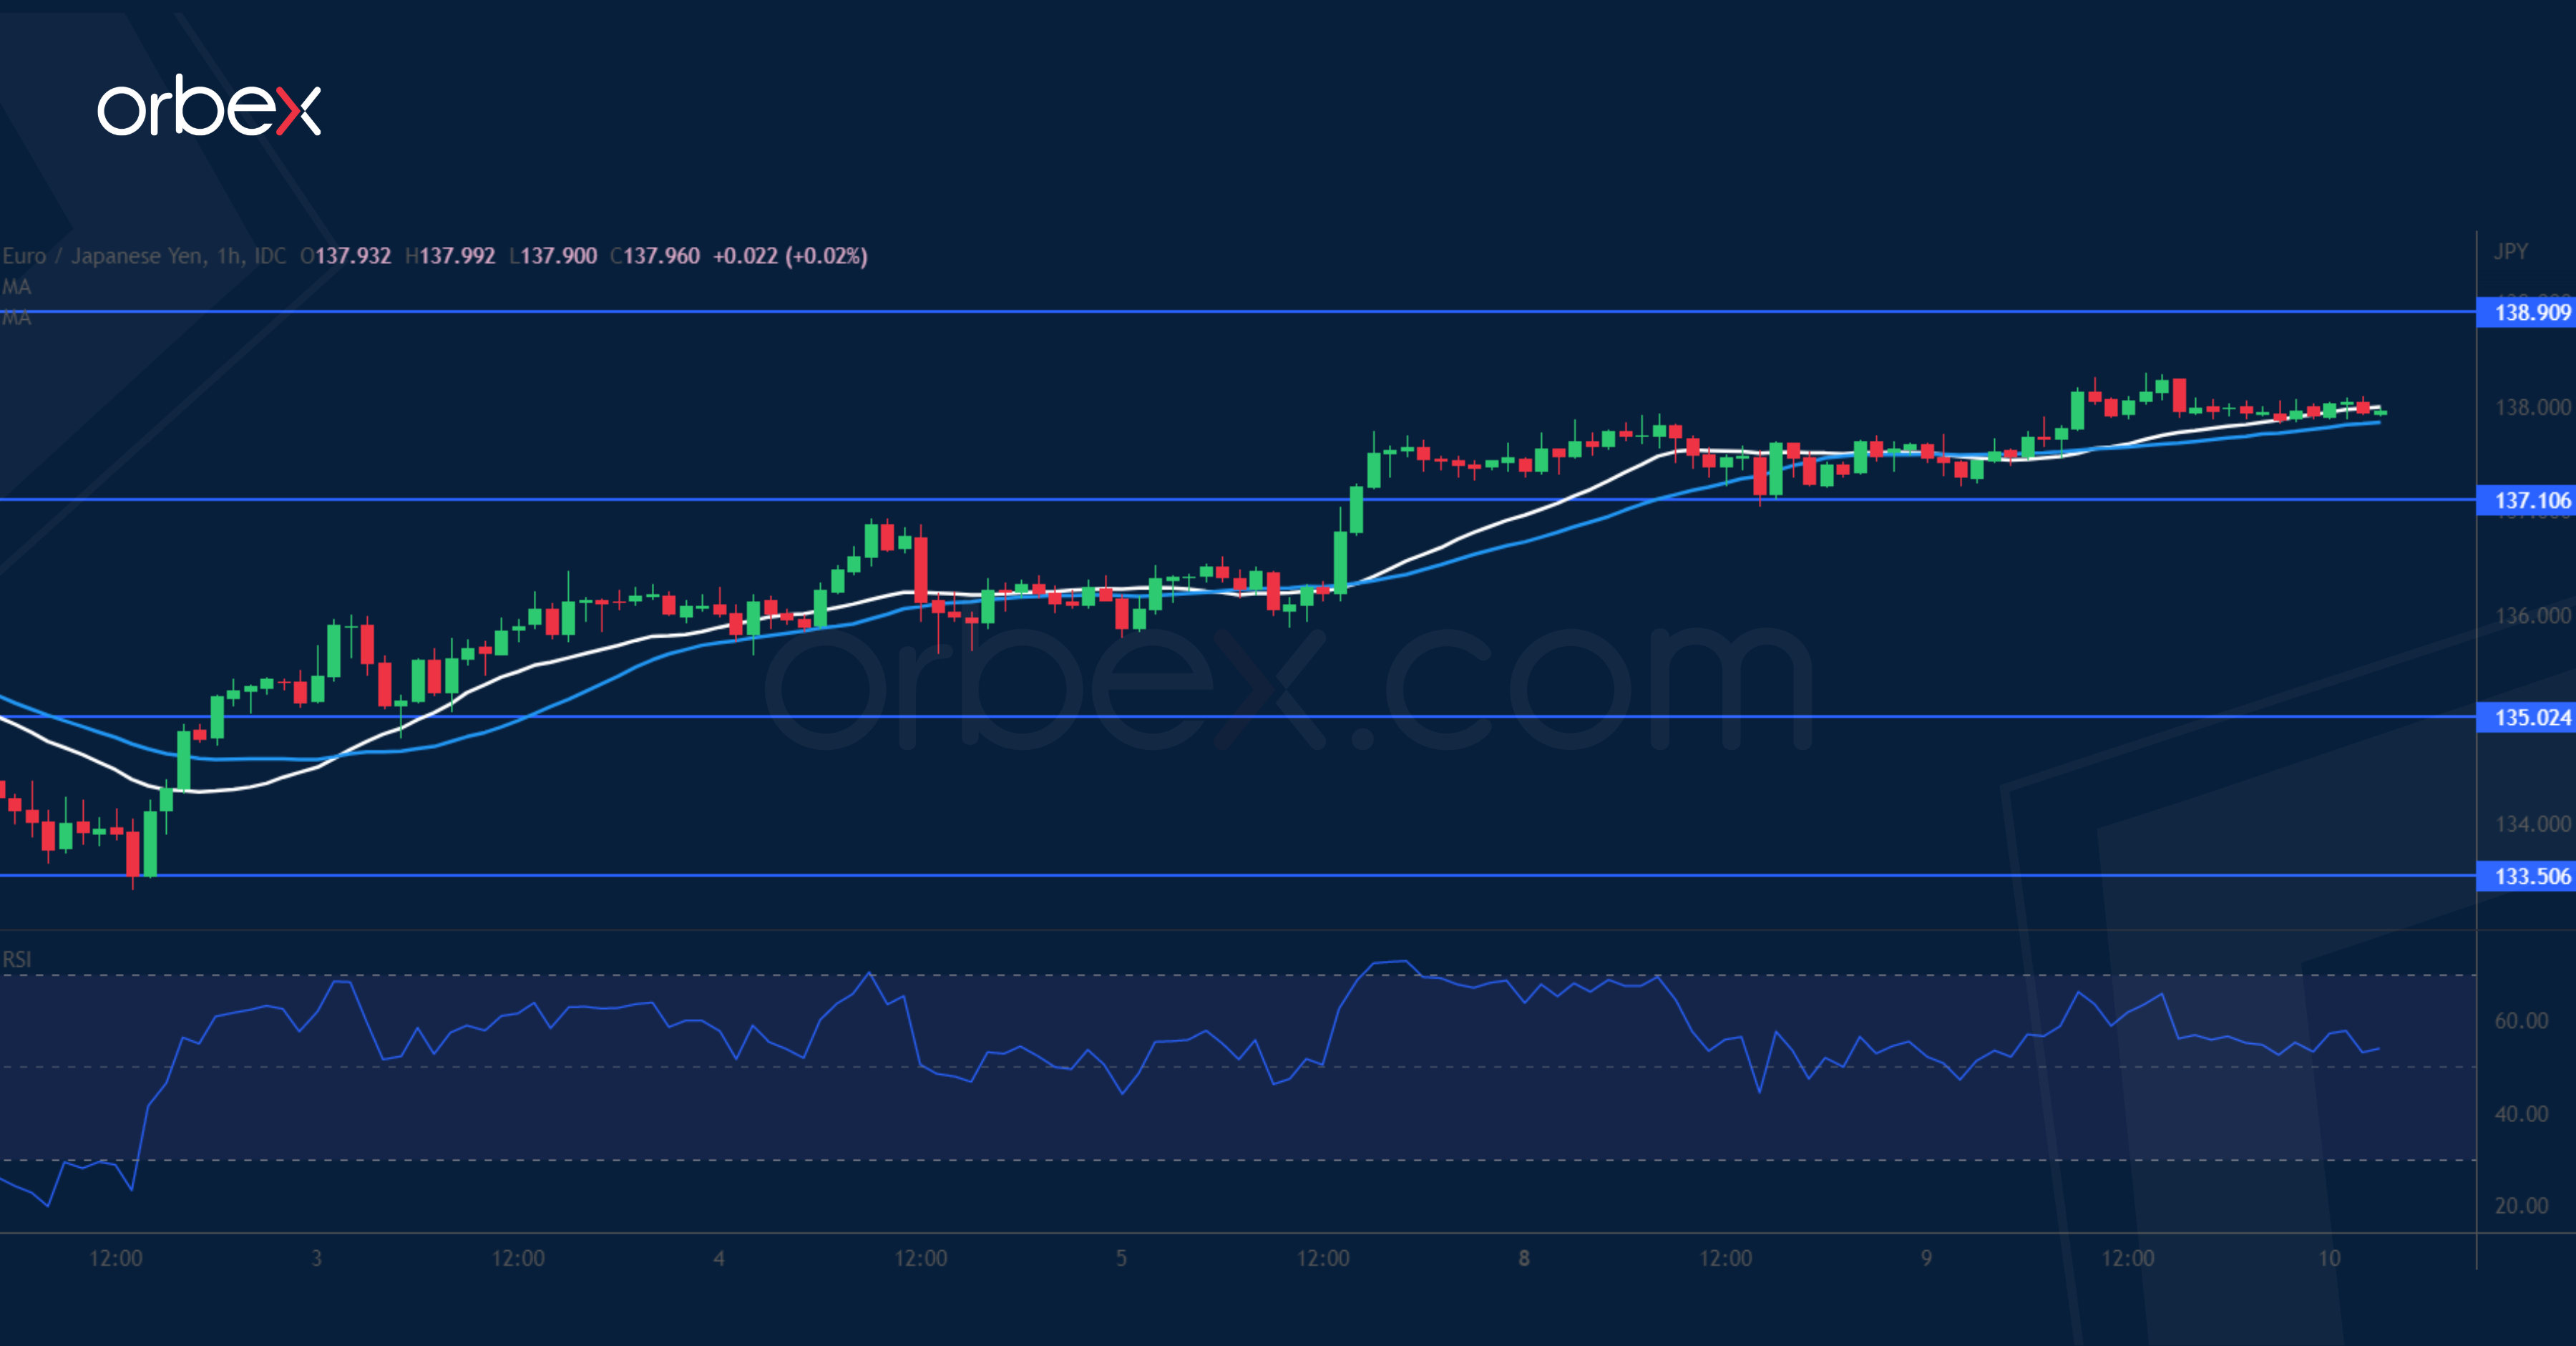
The euro climbs as traders bet on a 50bp move by the ECB in September. On the daily chart, the directional bias is still up after it bounced off the floor at 133.50. A break above 137.30 forced some sellers out, leaving the door open for an extended rally. 138.90 on the 30-day moving average is the next hurdle and its breach could attract more followers in an attempt to push towards the recent peak at 142.00. 137.10 has turned into a demand zone and the psychological level of 135.00 would be a second line of defence.
XAU/USD Grinds Rising Trendline
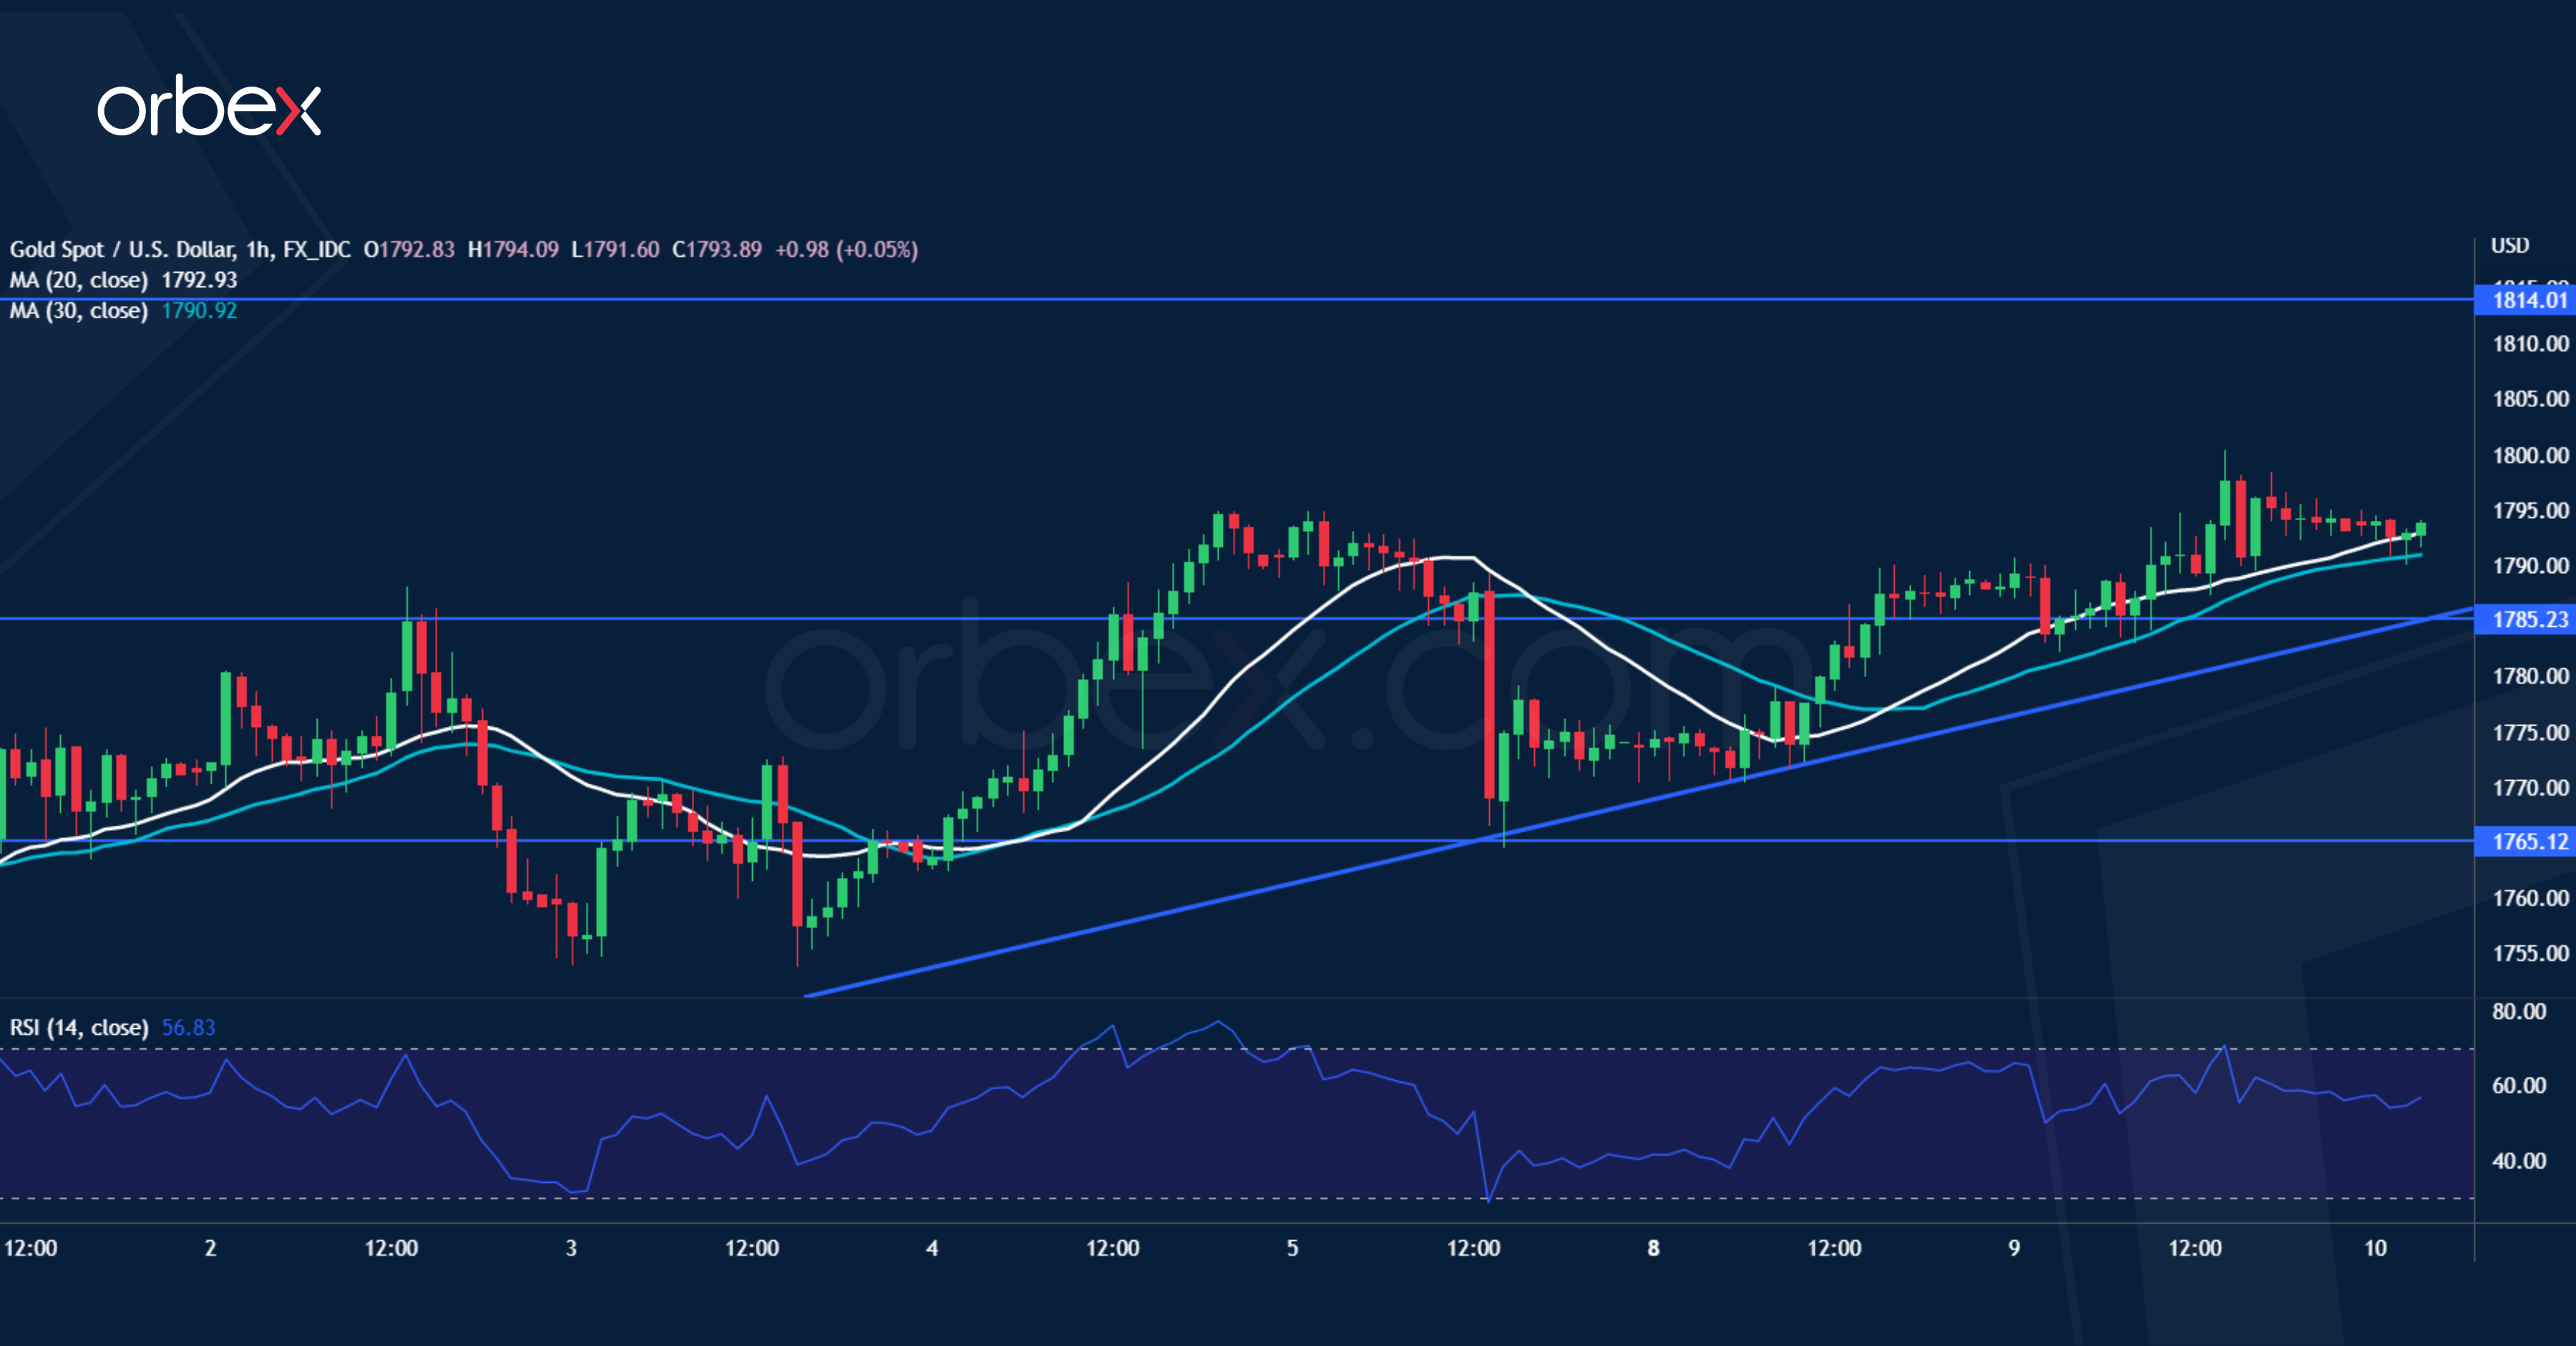
Gold rallies as the market awaits US inflation data. A break above the 30-day moving average has helped the recovery gain traction. A rising trendline from late July indicates a bullish bias. The latest pullback found support over 1765, confirming that short-term sentiment remains upbeat. A break above 1795 could bring back momentum buyers and push the bid towards 1814. 1855 at the start of the June sell-off is a major level where the bears could be expected to double down. 1785 is the first support in case of a retracement.
Nerves ahead of US Inflation
We're seeing plenty of apprehension ahead of the US inflation report on Wednesday, with Asia in the red and Europe following suit.
It's impossible to get away from the fact that the inflation report has held the markets back this week. There's clearly a desperate desire to be more optimistic about the outlook; that's evident from the scale of the recovery already seen in equity markets despite there being seemingly little to celebrate.
But the jobs report on Friday following on from the Fed commentary in the days running up to it has left investors fearing they've got carried away too soon and that data dependency and aggressive tightening can go hand in hand.
I don't think it's an exaggeration to say that today's inflation number could set the tone for the markets for the rest of the month. A lower than expected number could be a major tailwind for the markets while anything around or above the June reading could trigger a big risk reversal in the markets as the debate shifts to 75 or 100 basis points, with 50 left in the rearview mirror.
Encouraging inflation data from China
China is one of the few countries without an inflation problem as was evident in today's CPI and PPI numbers. The headline CPI fell a little short of expectations, with higher pork and vegetable prices largely behind the increase to 2.7%. Core inflation remains subdued as domestic demand remains soft following lockdowns this year that are weighing on activity and putting the growth target further out of reach. Lower fuel and commodity prices contributed to the sharper decline in the PPI number, keeping the pressure off the PBOC to tighten monetary policy and even leaving room for further easing.
Oil slips amid positive nuclear talks and a surprise inventory build
Oil prices are slipping again on Wednesday with WTI dropping back below $90 a barrel amid positive noises coming from the Iran nuclear talks. I don't think we're at the optimistic stage yet as we've seen talks break down before when a deal appears close but it's looking more promising than it has for many months. And those involved have an extra incentive to get a deal over the line.
The inventory data may have given crude another nudge lower, with API reporting a surprise increase of 2.156 million barrels last week. Data from EIA today was expected to show a 100,000 barrel increase so we could be in for another upside surprise which could further weigh on the price. A higher inflation reading could be another downside risk as traders price in further tightening and increased recession risk.
Gold driving higher ahead of inflation data
Gold has been well supported going into the inflation data this week. The prospect of a nasty surprise that has driven caution elsewhere doesn't appear to be holding gold back, with the yellow metal testing $1,800 yesterday and taking another run in that direction today.
A softer inflation reading could be just what it needs to break through the resistance barrier and establish itself above $1,800 once more, something it hasn't managed to do since earlier in the summer. A stronger figure on the other hand could strengthen the resistance and trigger profit-taking after a decent run over the last few weeks.
Momentum fades on approach to $25,000
Even bitcoin is looking a little nervy ahead of the inflation report. As odd as that sounds, bitcoin has shown itself to be very resilient of late, recovering quicker and seemingly not being as phased by setbacks. It will be interesting to see how it responds to any setback today or how well it capitalises on a favourable report. We have seen fading momentum in the run-up to $25,000 but a softer inflation number could be just the catalyst bitcoin needs to turn that around.
Oil Resists to Russian Supply Cut, US CPI in Focus
Russia halted crude flows to Hungary, Slovakia, and Czech Republic yesterday because sanctions prevented payment of a transit fee. The news didn’t trigger a bull run in crude oil yesterday, though pushed the price of American crude above the $90 mark, warning once again that upside risks prevail to the down-trending oil prices. Good news was that the US oil inventories rose by more than 2 million barrels last week, versus a decline around 400’000 barrels expected by analysts.
Oil bulls are also quite this week, as US and Iran could finally reach a nuclear agreement, which would then unlock the Iranian oil and give a certain relief to the tight-supply market.
Chip stocks in trouble?
Micron Technology was the latest US chipmaker to warn of a significant slowdown in chip demand, yesterday. The stock tumbled 3.74% and sent Nasdaq’s semiconductor index 5% lower at some point. A Citi analyst said that they believe ‘we are entering the worst semiconductor downturn in at least a decade, and possibly since 2001 given the expectation of a recession and inventory build’.
Yes, but Micron also announced it would invest $40 billion in US plants relying on the government’s $52 billion bill, and to counter the growing Chinese competition. However, the disappointing quarterly results, and warnings of a slower industry demand could kill the Chips Act rally that was triggered at the beginning of last month.
Elsewhere, Coinbase announced a $1.1 billion loss and missed the revenue expectations in Q2 as the tumbling cryptocurrency prices battered earnings. Coinbase shares plunged 10%, Bitcoin slipped below the $23K mark, along with the selloff in Nasdaq stocks.
US inflation is crucial for sentiment
Today is probably the most important day of the week in terms of economic data, as the US will reveal its latest CPI data, and investors have high expectations of seeing a softer figure in July.
The US CPI data is expected to have slowed to 8.7% in July, from 9.1% printed a month earlier. The recent downside correction in energy and commodity prices, the sharp fall in inflation expectations, as released by the NY Fed yesterday, and deflation in online goods prices point that we may see some relief on consumer prices of last month. Rising wages, and high rents remain factors that could keep inflation sticky at high levels.
A CPI figure in line with expectations, or ideally softer will certainly temper the hawkish Federal Reserve (Fed) expectations, pull US yields lower and trigger a relief rally across stock markets. We could then see the S&P500 make another attempt on the critical 4200 resistance.
Looking at the gold chart, a further downside correction in the US yields, along with geopolitical tensions in Ukraine and Taiwan, could push the price of an ounce higher, and lead to a cup and handle formation, paving the way for a positive breakout above the $1800 mark in the coming sessions.
However, a higher-than-expected CPI print, or worse, a number above last month’s 9.1% print would revive the expectations that the Fed would continue hiking rates by big chunks – especially given that the jobs market seems surprisingly resilient to the Fed tightening so far. That would send the US yields higher and encourage a downside correction of the July stock rally. We could see the S&P500 pullback to the 50-DMA, around 3950 mark.
Cheaper Gasoline Will Not Solve Fed’s Inflation Problem
Market movers today
The most important data release of the day will be the US July CPI. Following the recent decline in gasoline prices, consensus is expecting headline CPI growth to ease to 0.2% m/m (8.7% y/y). Fed will focus especially on the core inflation, where consensus is looking for a slight moderation to 0.5% m/m as fading supply chain challenges have likely eased price pressures on goods. Even though headline inflation is likely to moderate over the coming months, we continue to see risks tilted towards inflation surprising to the upside.
Inflation data will also be released for Norway and Denmark, and the revised final CPI will be released for Germany. Fed's Evans and Kashkari will be on the wires in the evening.
The 60 second overview
Natural gas: The UK government prepares for a worst case scenario of power shortfall over the winter. In this scenario, which builds on assumptions of lower than normal temperatures and reduced imports from Norway and France, UK could see a shortfall of around one sixth of peak demand.
China: Inflation in China rose to 2.7% in July - the highest level of inflation in two years.
Equities: Oil prices continued to dictate the way for equity markets on Tuesday. As Russia said oil flows from the Druzhba pipeline had been suspended, oil prices turned volatile. This also sent equity markets into a risk-off rotation. Investors bought into value defensives and selling the July winning growth cyclicals. Volatile session ending with Dow -0.2%, S&P 500 -0.4%, Nasdaq -1.2% and Russell 2000 -1.5%.
FI: It is big inflation day today with the release of US CPI for July, final CPI-data for Germany as well as inflation data from both Denmark and Norway.
Inflation in the US is expected to decline modestly, but not enough to dampen the speculation regarding a 75bp rate hike at the Fed meeting in September after the strong labour market report last week. Hence, the curve flattening is likely to continue.
FX: CHF and EUR rose vis-à-vis CAD, JPY and AUD yesterday in a relatively steady FX market. EUR/USD rose back above 1.02, EUR/NOK stayed below 10.00 and EUR/SEK below 10.40.
Credit: Credit spreads widened slightly yesterday in response to the overall weaker risk sentiment. iTraxx Main was wider by 3bp to 103bp, while Crossover widened 14bp to 519bp. The primary market saw modest issuance activity in USD and GBP yesterday, while the EUR market remains quiet reflecting the usual seasonal pattern.
Nordic macro
Denmark. We expect Danish July CPI inflation declined slightly in July to 8.0% from 8.2% in June. The decline comes from the falling oil prices we have seen through July, which have pulled gasoline prices lower. Other energy prices such as gas and electricity on the other hand have continued to increase. In July we have several jokers which increases uncertainty. Food prices is a big joker every month. We expect another large increase, although smaller than in the previous months. Global food prices have declined over the summer, which could stop the consumer price surge later this year. Besides food, vacation related prices and the size of the summer clothing sale are the biggest July jokers.
Norway. Norwegian core inflation continues to rise on a combination of higher imported prices for everything from food to furniture, and domestic prices driven by higher labour costs, transport costs, energy costs, etc. In recent months, the seasonally adjusted core inflation has been around 0.3-0.4% m/m, and at the same time we know that food prices presumably rose abnormally much as a result of the agricultural settlement and that air fares were strongly affected by the strike in SAS. Hence, we expect that core inflation accelerated slightly in July, and was somewhat higher than last year. We therefore believe that core inflation rose further to 3.8% y/y in July. In that case, it is well above Norges Bank's estimate of 3.2% from the monetary policy report in June, and will thus provide ammunition to the market, which is currently pricing in around 42bp at the rate meeting next week.
Sweden. Production value index (PVI) and data on household consumption for the month of June is due for release today. Both are important inputs to the GDP estimate for Q2, which Statistics Sweden's GDP-indicator estimates at 1.4% q/q. As Swedish manufacturing still holds up well according to survey-based indicators the former could corroborate the GDP-indicator's estimate. As for household consumption, retail sales fell 1.2% m/m during June, so risks might be tilted towards a weaker print.
AUD/USD Daily Report
Daily Pivots: (S1) 0.6946; (P) 0.6970; (R1) 0.6987; More...
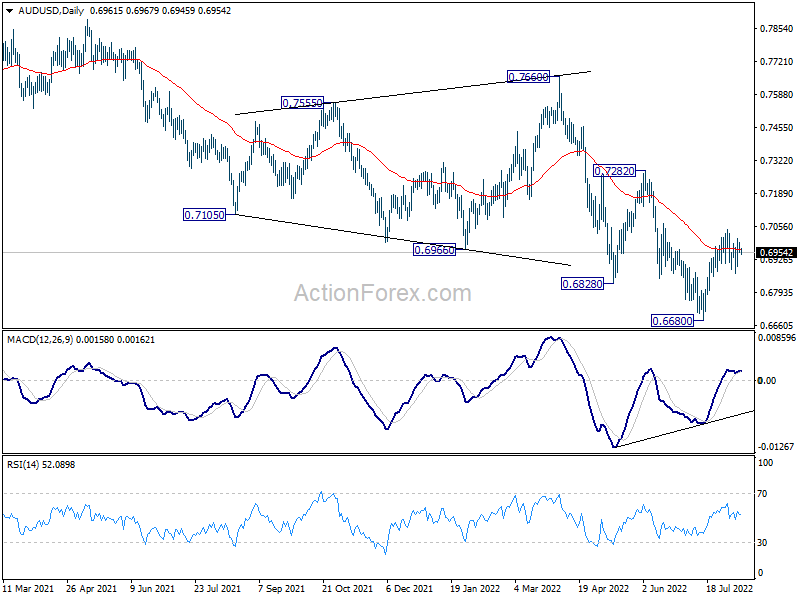
Range trading continues in AUD/USD and intraday bias remains neutral. On the upside, break of 0.7045 will resume the rebound from 0.6680 to 0.7282 key resistance next. On the downside, however, break of 0.6858 minor support will argue that the rebound is over. Intraday bias will then be back on the downside for retesting 0.6680 low.
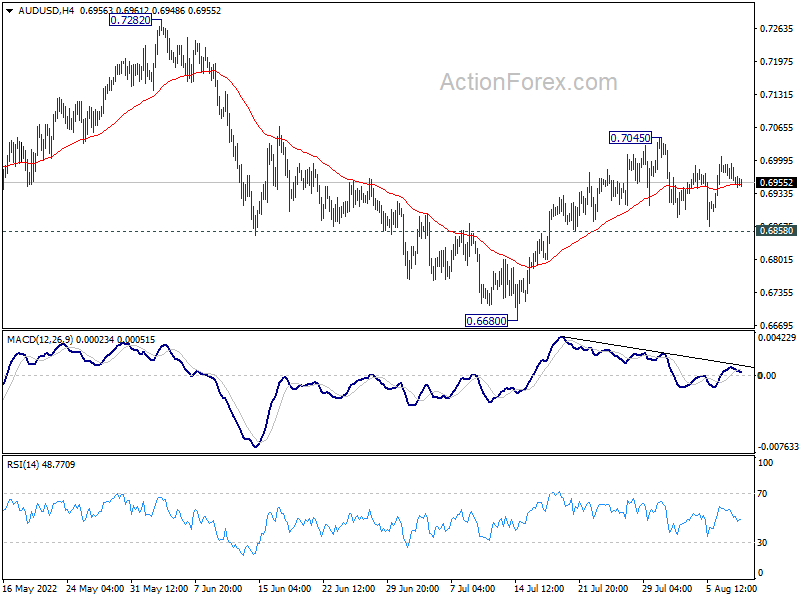
In the bigger picture, price actions from 0.8006 (2021 high) is seen more as a corrective pattern to rise from 0.5506 (2020 low). Or it could be a bearish impulsive move. In either case, outlook will remain bearish as long as 0.7282 resistance holds. Next target is 61.8% retracement of 0.5506 to 0.8006 at 0.6461.
Markets in Hibernation as US CPI Awaited
The forex markets are somewhat in hibernation mode this week. Dollar is currently the weakest one, followed Yen. Commodity currencies are generally firm. But Swiss Franc is the strongest, thanks to buying against the weakening Euro and Sterling. But overall, with the exception of a few Yen pairs, major pairs and crosses are staying inside last week's range. Hopefully, the markets will wake up after today's US CPI release.
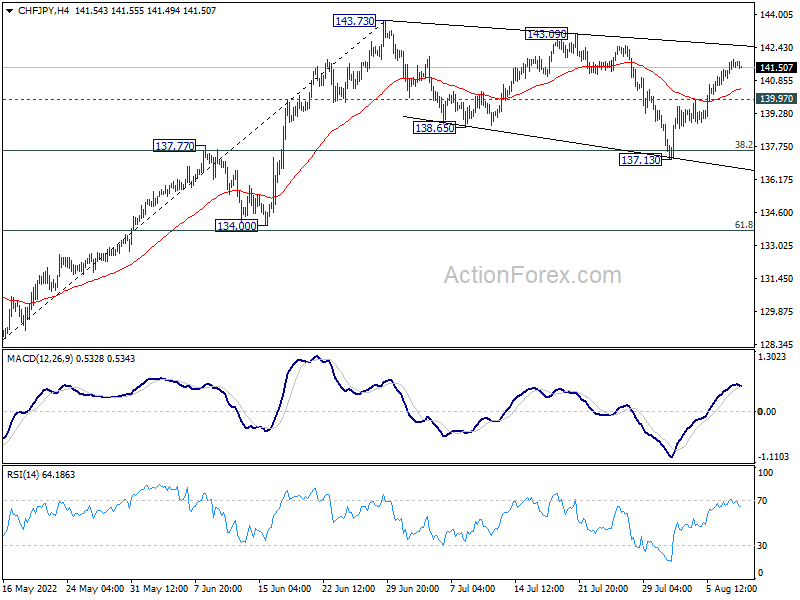
Technically, CHF/JPY is currently the top mover for the week, up 0.86%. While it may be losing some upside momentum, further rally is expected as long as 139.97 support holds. Corrective pattern from 143.73 is tentatively seen as completed with three waves down to 137.13. Retest of 143.73 high should be seen in the near term and firm break there will resume larger up trend.
In Asia, at the time of writing, Nikkei is down -0.71%. Hong Kong HSI is down -2.23%. China Shanghai SSE is down -0.62%. Singapore Strait Times is up 0.38%. Japan 10-year JGB yield is up 0.0244 at 0.191. Overnight, DOW dropped -0.18%. S&P 500 dropped -0.42%. NASDAQ dropped -1.19%. 10-year yield rose 0.032 to 2.797.
Fed Bullard: Too early to claim inflation has peaked
St. Louis Fed President James Bullard said in an MNI interview, "we may see some relief in the headline CPI tomorrow but the reason we tend to track core PCE inflation is exactly because we ignore the energy price movement on the way up but also on the way down."
"I would like to see improvements across a range of indicators of inflation, not just one measure ticking down a little bit but clear and convincing evidence," he said, adding that it's going to be "much harder" to get core factors to turn around.
Bullard still wants to get interest rates to 3.75-4.00% range by the end of the year. "I think the destination is a little bit higher than what I would have thought even a couple months ago because inflation has continued to broaden out and doesn't look like it's turning the corner at least based on the evidence we have today... I think it's too early to make the claim that inflation has peaked."
S&P 500 pressing key resistance ahead of US CPI
It's been a very quiet week in the markets so far, and today's US consumer inflation release should bring trading back to life. Economists are expecting headline CPI to slow from 9.1% yoy to 8.7% yoy in July. But core CPI is expected to rise from 5.9% yoy to 6.1% yoy. While one data point is definitely insufficient to tell the trend, traders are still eager to get hints on whether inflation is still climbing, plateauing, or starting to reverse.
The next move in Dollar would very likely be driven by overall risk sentiment after the CPI release. The greenback tends to weaken in risk-on markets, and strengthen in risk-off markets. For now, as benchmark treasury yield is stuck in consolidation, reactions in stocks are more dollar-moving.
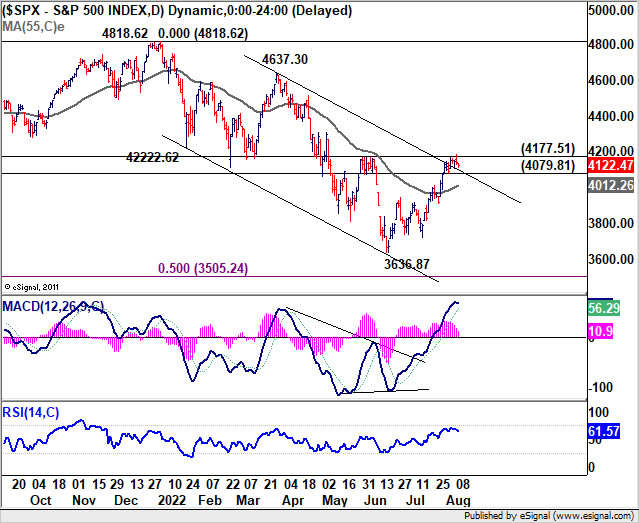
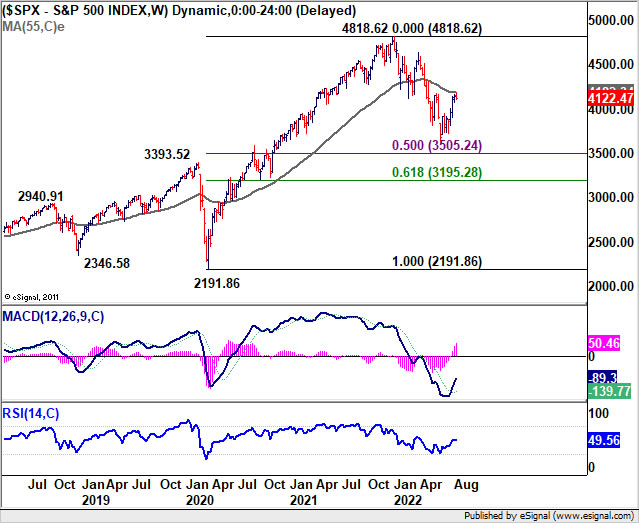
S&P 500 is pressing and important cluster resistance level of 4177.51, as well as 55 week EMA (now at 4182.34). Sustained trading above this 4177/82 zone will add much credence to the case that whole correction from 4818.62 has completed with three waves down to 3636.87. That would set the stage for further rally towards 4818.62 high later in the year, subject to upcoming data release of course. Nevertheless, break of last week low at 4079.891 will tentatively indicate short term topping and bring deeper pull back to 55 day EMA (now at 4012.26) in the near term.
Elsewhere
Japan PPI slowed from 9.4% yoy to 8.6% yoy in July, above expectation of 8.4% yoy. China CPI rose from 2.5% yoy to 2.7% yoy, below expectation of 2.9% yoy. PPI dropped from 6.1% yoy to 4.2% yoy, below expectation of 4.9% yoy.
AUD/USD Daily Report
Daily Pivots: (S1) 0.6946; (P) 0.6970; (R1) 0.6987; More...
Range trading continues in AUD/USD and intraday bias remains neutral. On the upside, break of 0.7045 will resume the rebound from 0.6680 to 0.7282 key resistance next. On the downside, however, break of 0.6858 minor support will argue that the rebound is over. Intraday bias will then be back on the downside for retesting 0.6680 low.
In the bigger picture, price actions from 0.8006 (2021 high) is seen more as a corrective pattern to rise from 0.5506 (2020 low). Or it could be a bearish impulsive move. In either case, outlook will remain bearish as long as 0.7282 resistance holds. Next target is 61.8% retracement of 0.5506 to 0.8006 at 0.6461.
Economic Indicators Update
| GMT | Ccy | Events | Actual | Forecast | Previous | Revised |
|---|---|---|---|---|---|---|
| 23:50 | JPY | PPI Y/Y Jul | 8.60% | 8.40% | 9.20% | 9.40% |
| 01:30 | CNY | CPI Y/Y Jul | 2.70% | 2.90% | 2.50% | |
| 01:30 | CNY | PPI Y/Y Jul | 4.20% | 4.90% | 6.10% | |
| 06:00 | EUR | Germany CPI M/M Jul F | 0.90% | 0.90% | ||
| 06:00 | EUR | Germany CPI Y/Y Jul F | 7.50% | 7.50% | ||
| 12:30 | USD | CPI M/M Jul | 0.20% | 1.30% | ||
| 12:30 | USD | CPI Y/Y Jul | 8.70% | 9.10% | ||
| 12:30 | USD | CPI Core M/M Jul | 0.50% | 0.70% | ||
| 12:30 | USD | CPI Core Y/Y Jul | 6.10% | 5.90% | ||
| 14:00 | USD | Wholesale Inventories Jun F | 1.90% | 1.90% | ||
| 14:30 | USD | Crude Oil Inventories | 0.1M | 4.5M |
S&P 500 pressing key resistance ahead of US CPI
It's been a very quiet week in the markets so far, and today's US consumer inflation release should bring trading back to life. Economists are expecting headline CPI to slow from 9.1% yoy to 8.7% yoy in July. But core CPI is expected to rise from 5.9% yoy to 6.1% yoy. While one data point is definitely insufficient to tell the trend, traders are still eager to get hints on whether inflation is still climbing, plateauing, or starting to reverse.
The next move in Dollar would very likely be driven by overall risk sentiment after the CPI release. The greenback tends to weaken in risk-on markets, and strengthen in risk-off markets. For now, as benchmark treasury yield is stuck in consolidation, reactions in stocks are more dollar-moving.
S&P 500 is pressing and important cluster resistance level of 4177.51, as well as 55 week EMA (now at 4182.34). Sustained trading above this 4177/82 zone will add much credence to the case that whole correction from 4818.62 has completed with three waves down to 3636.87. That would set the stage for further rally towards 4818.62 high later in the year, subject to upcoming data release of course. Nevertheless, break of last week low at 4079.891 will tentatively indicate short term topping and bring deeper pull back to 55 day EMA (now at 4012.26) in the near term.
Fed Bullard: Too early to claim inflation has peaked
St. Louis Fed President James Bullard said in an MNI interview, "we may see some relief in the headline CPI tomorrow but the reason we tend to track core PCE inflation is exactly because we ignore the energy price movement on the way up but also on the way down."
"I would like to see improvements across a range of indicators of inflation, not just one measure ticking down a little bit but clear and convincing evidence," he said, adding that it's going to be "much harder" to get core factors to turn around.
Bullard still wants to get interest rates to 3.75-4.00% range by the end of the year. "I think the destination is a little bit higher than what I would have thought even a couple months ago because inflation has continued to broaden out and doesn't look like it's turning the corner at least based on the evidence we have today... I think it's too early to make the claim that inflation has peaked."
Technical Outlook and Review
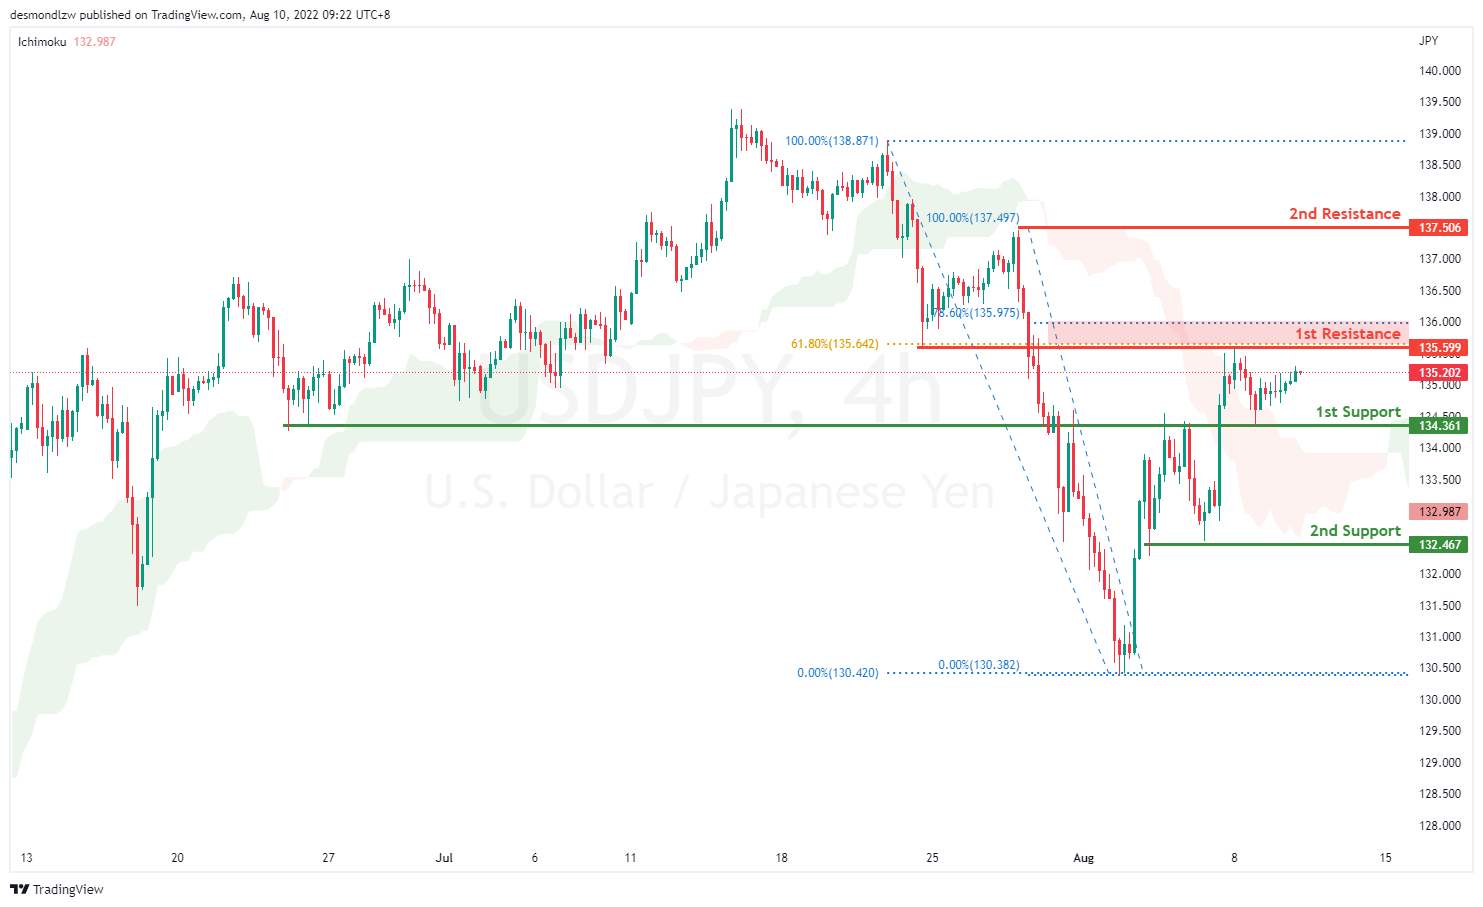
USD/JPY:
On the H4, price is still bullish biased as it fails to pull back to the first support the previous session. It is currently moving towards the first resistance at 135.599 which coincides with the 61.8% Fibonacci retracement and the previous swing low. If price breaks this level, it will move up to test at the second resistance which is the previous swing high at 137.506. Alternatively, price could pull back to test at the first support 134.361 which is the previous swing low
Areas of consideration:
- H4 time frame, 1st resistance at 135.599
- H4 time frame, 1st support at 134.361
DXY:
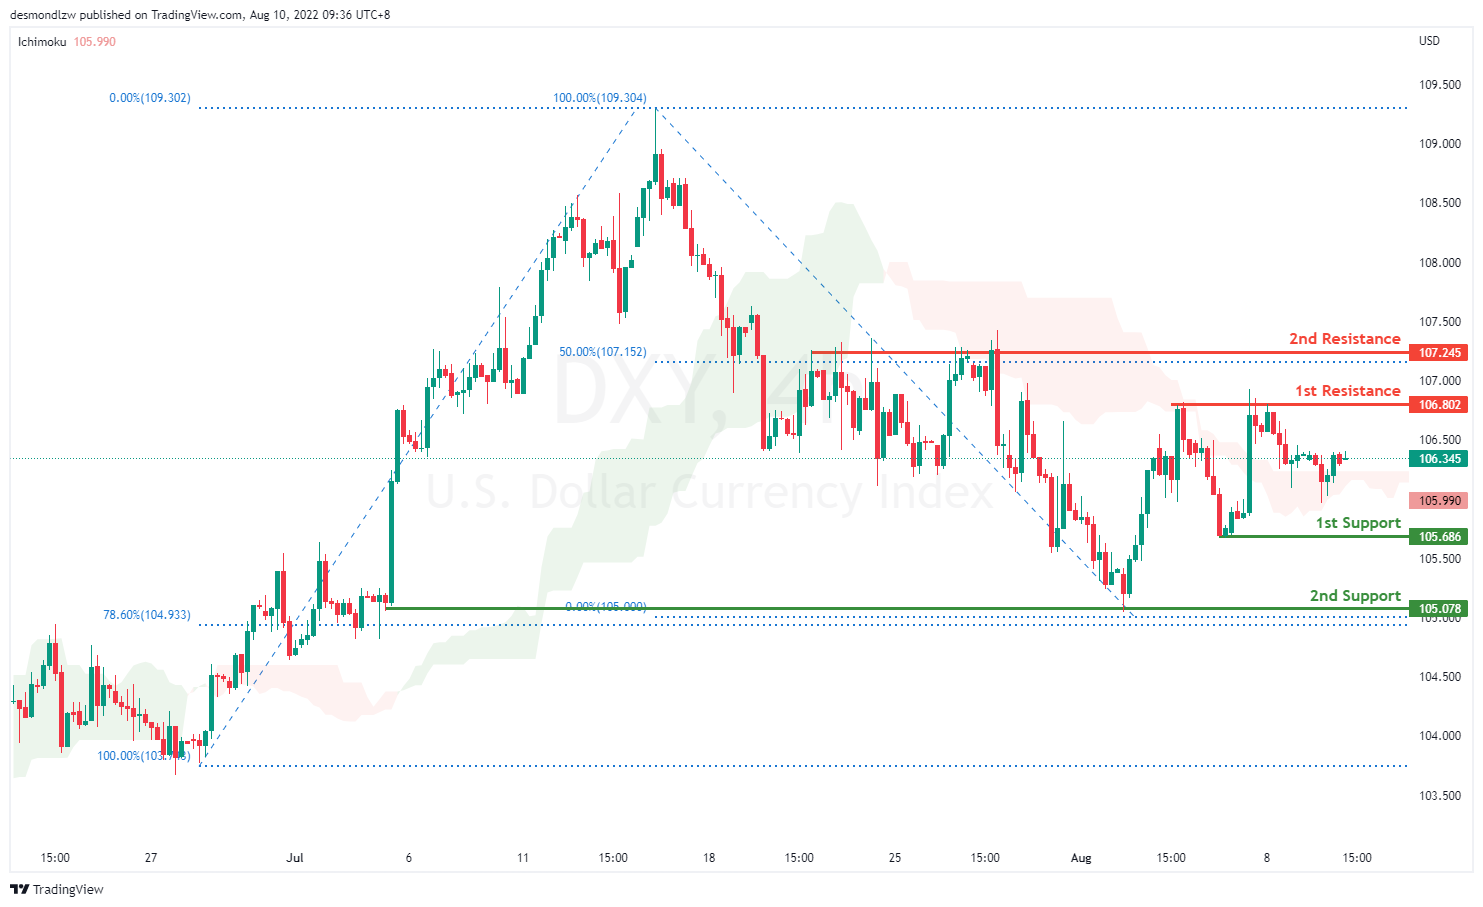
On the H4, prices have broken the descending trend into a bullish biased trend. Prices look like it’s going to test at the first resistance 106.802 where the previous swing high sits. If prices break the first resistance it will confirm a bullish momentum and prices will continue to move in an ascending trend towards the second resistance at 107.245 where the 50% fibonacci retracement sits. If prices rejects the first resistance and continues in the descending trend, it will test at the first support 105.686 and then the second support at previous swing low 105.078
Areas of consideration:
- H4 time frame, 1st resistance at 106.802
- H4 time frame, 1st support at 105.686
EUR/USD :
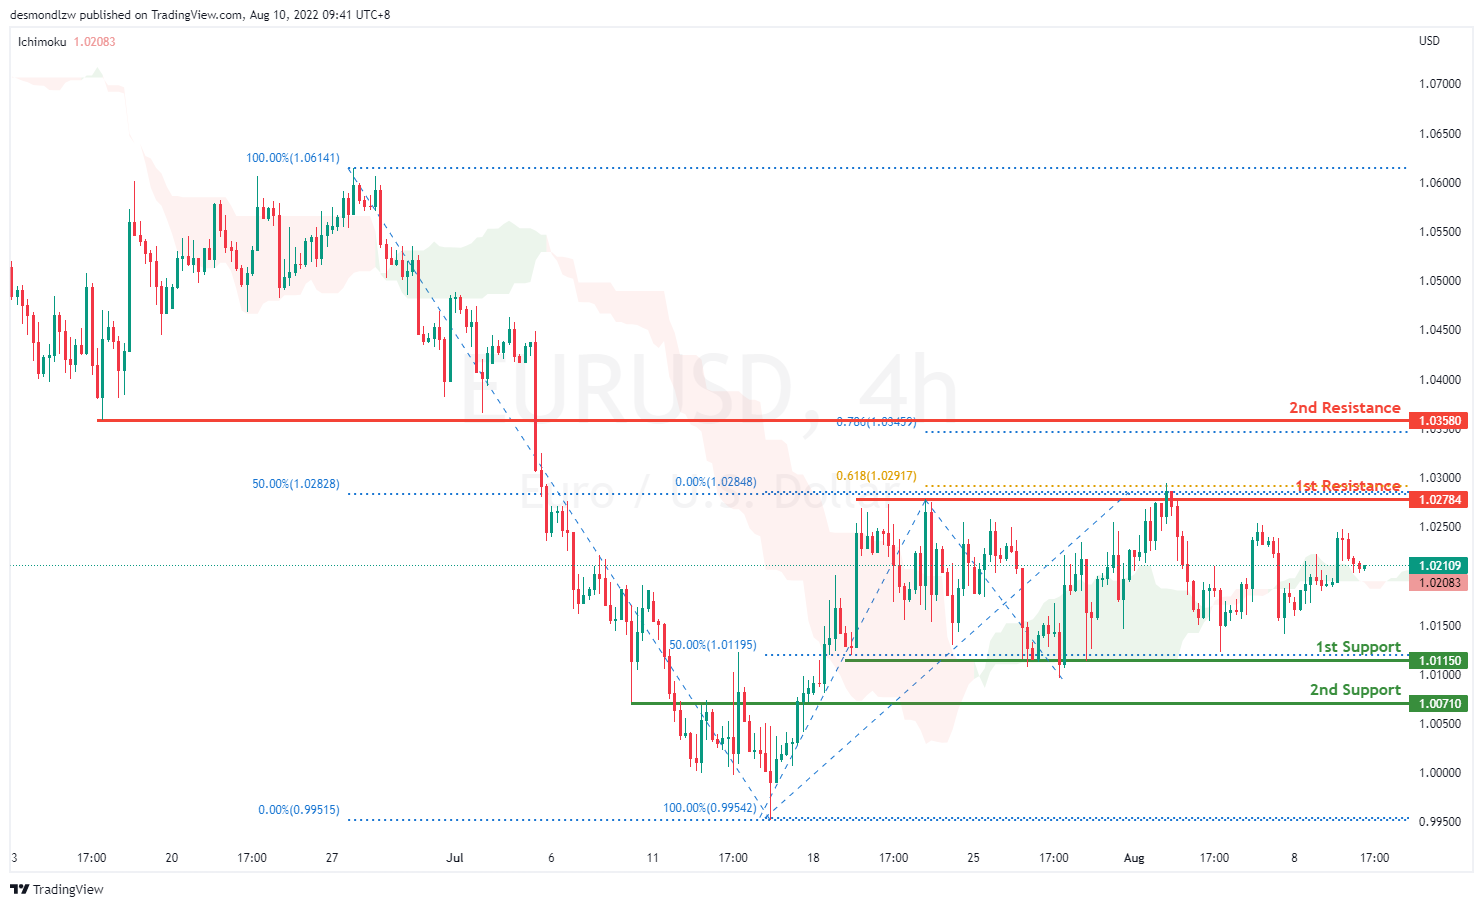
On the H4, prices have broken the bearish trend moving into a slightly bullish biased trend. Price is ranging and it seems like it’s going back to test the first resistance at 1.02784 where the 61.8% fibonacci projection and 50% retracement sits. If prices break the first resistance, it will pull back further to test at the second resistance at 1.035. Alternatively, price might test the 1st support at 1.011
Areas of consideration :
- H4 1st resistance at 1.027
- H4 1st support at 1.011
GBP/USD:
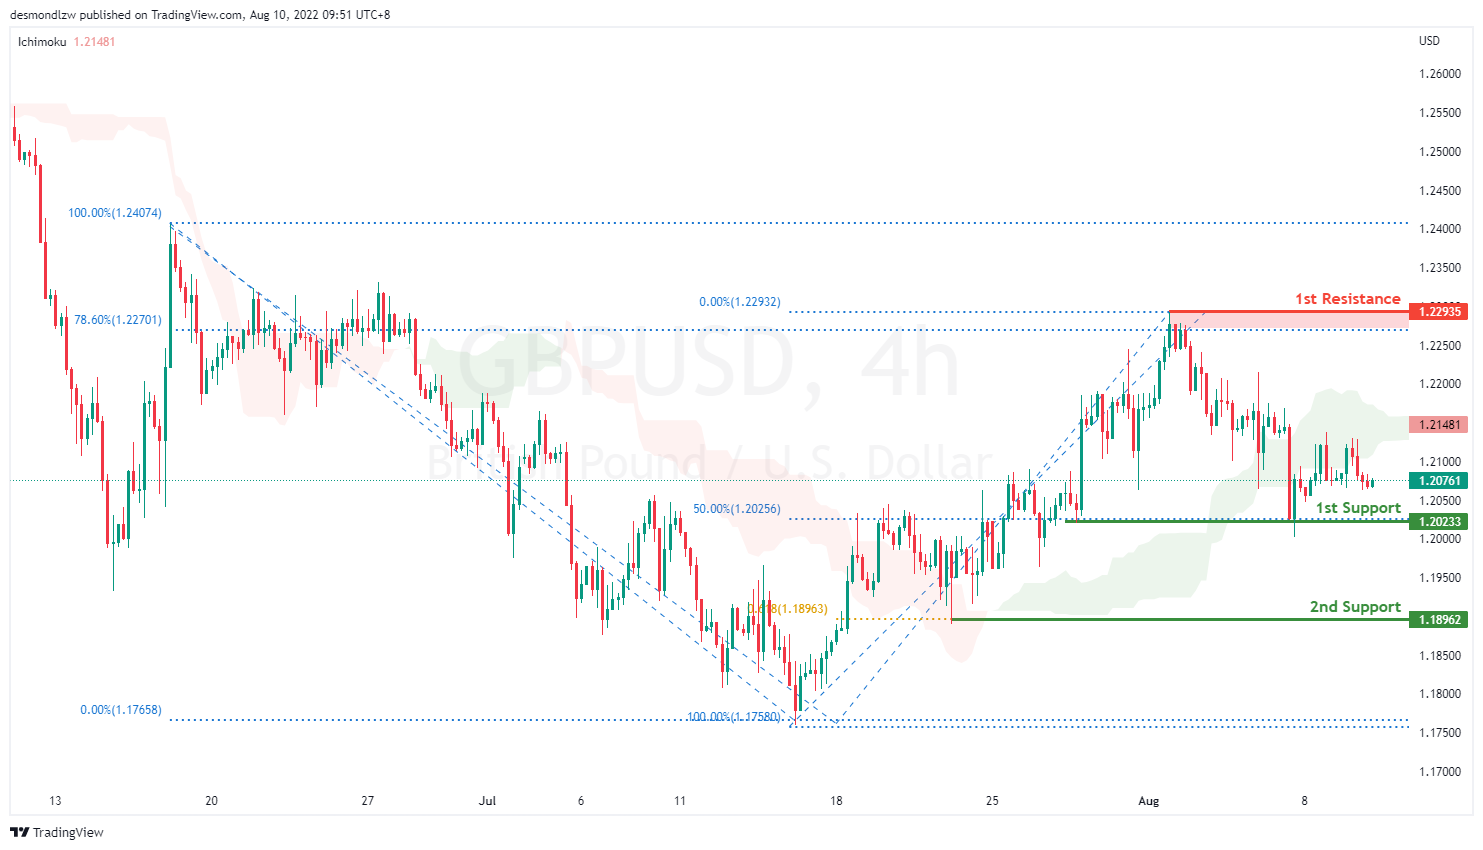
On the H4, with prices breaking the ascending channel we are now slightly bearish biased. Price is now moving toward the first support at 1.202 which coincides with 50% Fibonacci retracement. If price break supports and confirms downside trend, we would expect downside momentum to carry price to 2nd support at 1.189 61.8% Fibonacci projection. Alternatively, price could bounce back to test at 78.6% Fibonacci retracement at 1.229
Areas of consideration:
- H4 1st resistance at 1.229
- H4 1st support at 1.202
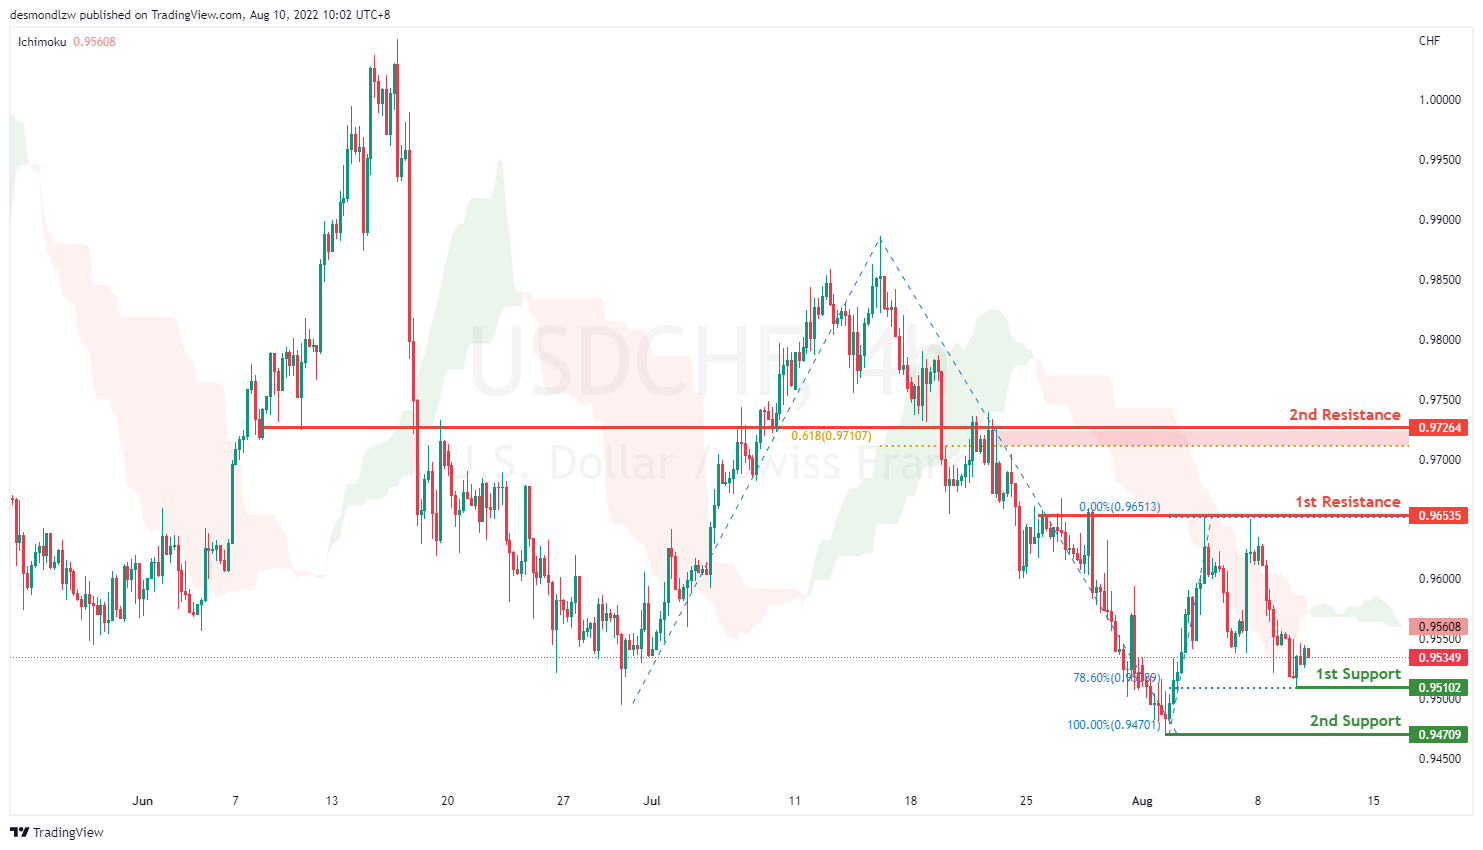
USD/CHF:
On the H4, prices have signalled a slightly bearish momentum as it rejected the 1st resistance at 0.965 which is also the precious swing highs. Prices are moving toward the first support at 0.951 where the 78.6% fibonacci retracement sits. If price continues with the downward momentum, it will bring price to the previous swing low at 0.947. 50% Fibonacci retracement to test at the 1st support 0.955 23.6% fibonacci retracement. If prices break this key level, it will pull back further to test at the second support at 0.947. Alternatively price could test 1st resistance 0.963 subsequently the second resistance at 0.972 where the 61.8% fibonacci projection and previous swing low levels sit
Areas of consideration
- H4 1st resistance at 0.963
- H4 1st support at 0.951
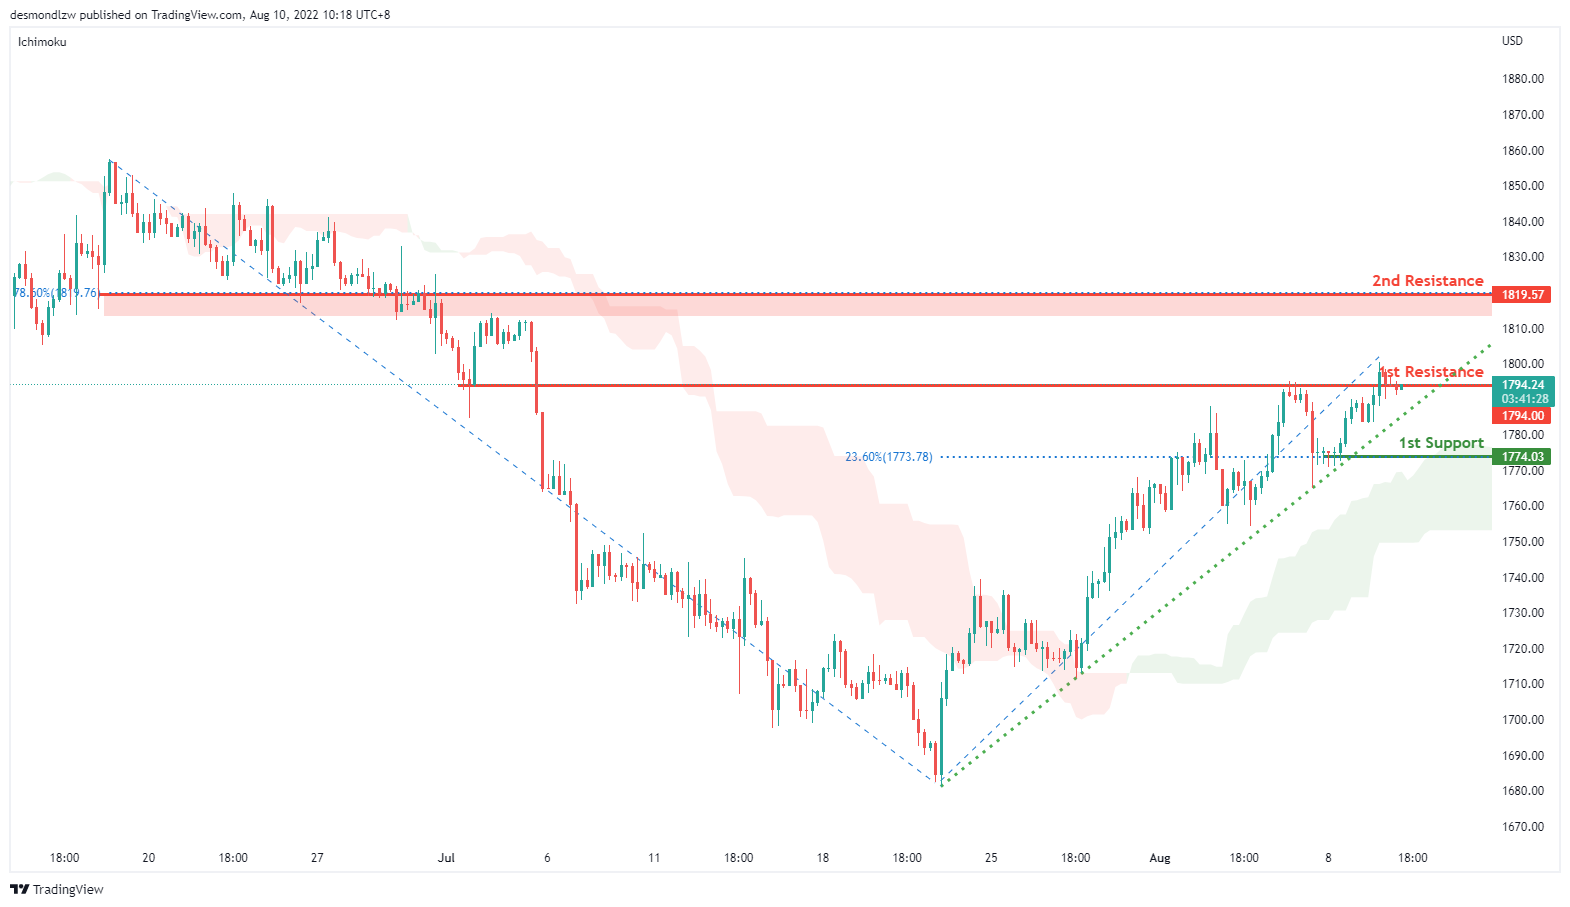
XAU/USD (GOLD):
On the H4, with prices moving along the ascending trendline and above the ichimoku cloud, we have a bullish bias that the price may rise from the 1st resistance at 1794.00, which is in line with the overlap support to the 2nd resistance at 1819.57, which is in line with the 78.6% fibonacci retracement. Alternatively, prices may drop to 1st support at 1774.03,which is in line with the pullback support.
Areas of consideration:
- H4 time frame, 1st resistance at 1794.00
- H4 time frame, 2nd resistance at 1819.57
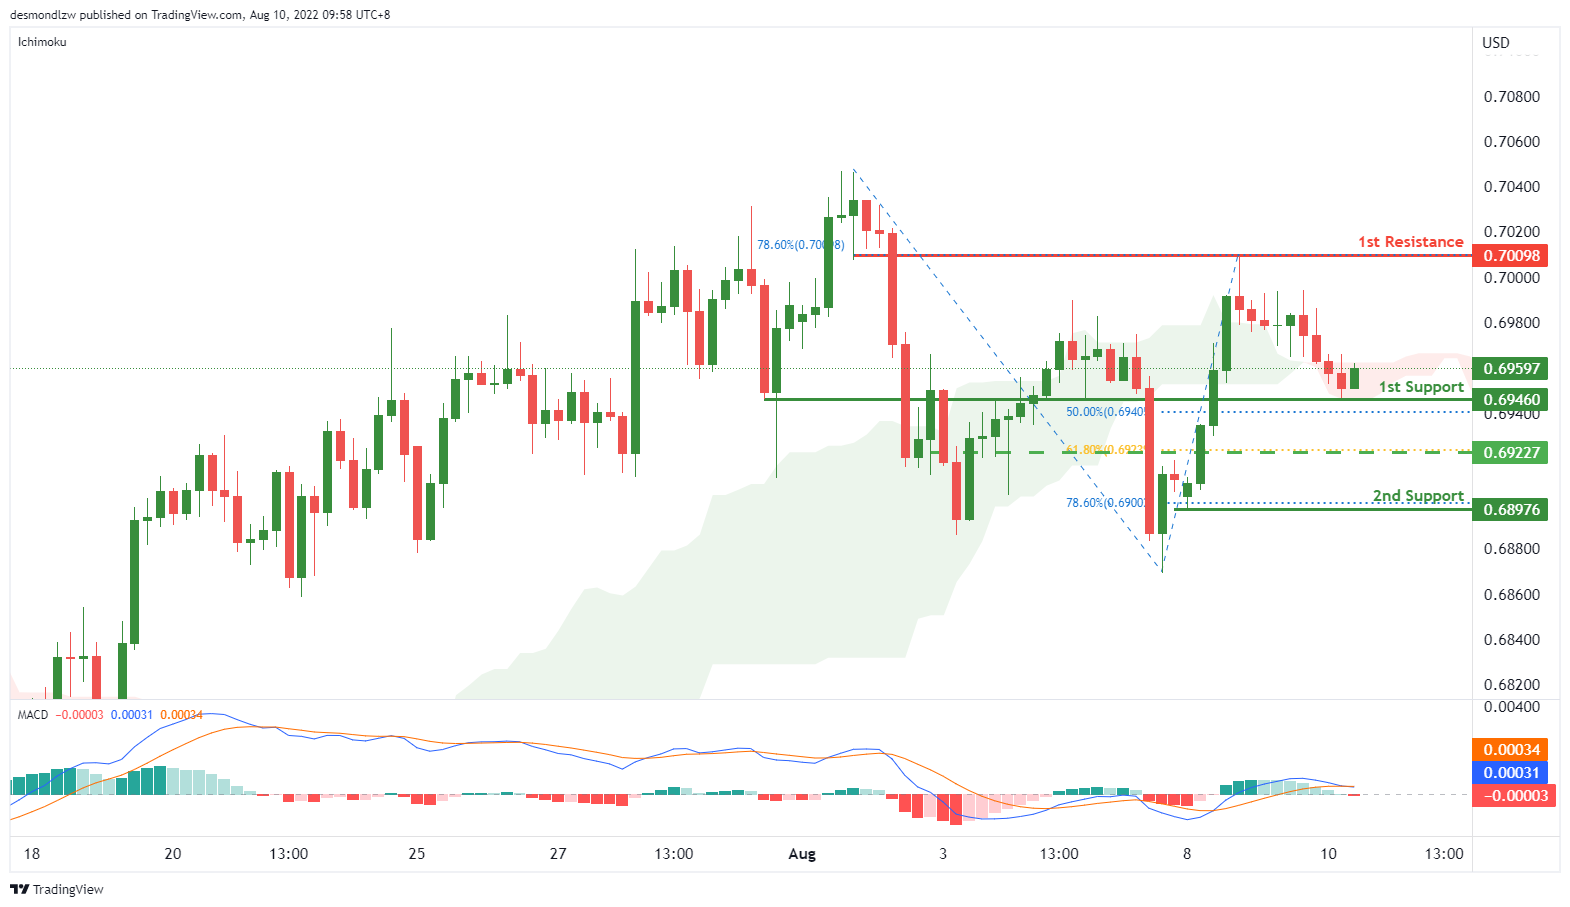
AUD/USD:
On the H4, with the DIF line is breaking below the signal line in MACD, we have a bearish bias that price may drop from the 1st support at 0.69460, where the swing low and 50% fibonacci retracement are to the 2nd support at 0.68976 where the 78.6% fibonacci retracement is. Alternatively, price may rise to the 1st resistance at 0.70098 which is in line with 78.6% fibonacci retracement and swing high. Take note the 0.69227 could be our intermediate support, which is in line with 61.8% fibonacci retracement.
Areas of consideration
- H4 1st support at 0.69460
- H4 2nd support at0.68976
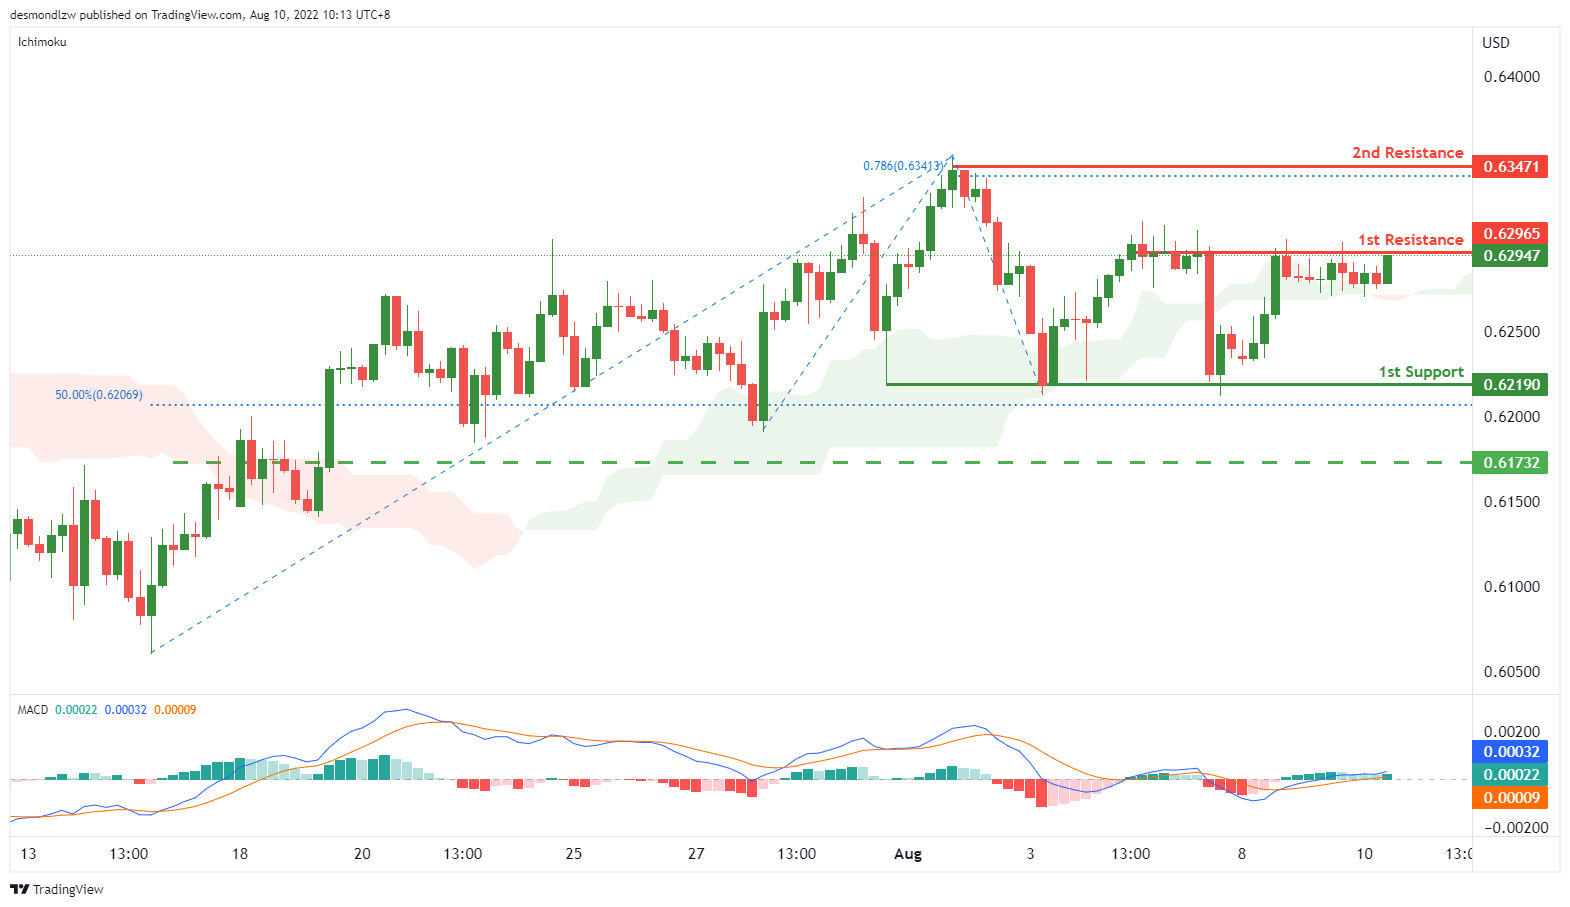
NZD/USD:
On the H4, with price moving above the ichimoku cloud and the histogram is above zero axis, we have a bullish bias that price may rise from the 1st resistance at 0.62965 where overlap resistance is to the 2nd resistance at 0.63471 where 78.6% fibonacci projection is. Alternatively, price may reverse off the 1st resistance and drop to 1st support at 0.62190 where the swing low support is.
Areas of consideration:
- H4 time frame, 1st resistance at 0.62965
- H4 time frame,2nd resistance at 0.63471
USD/CAD:
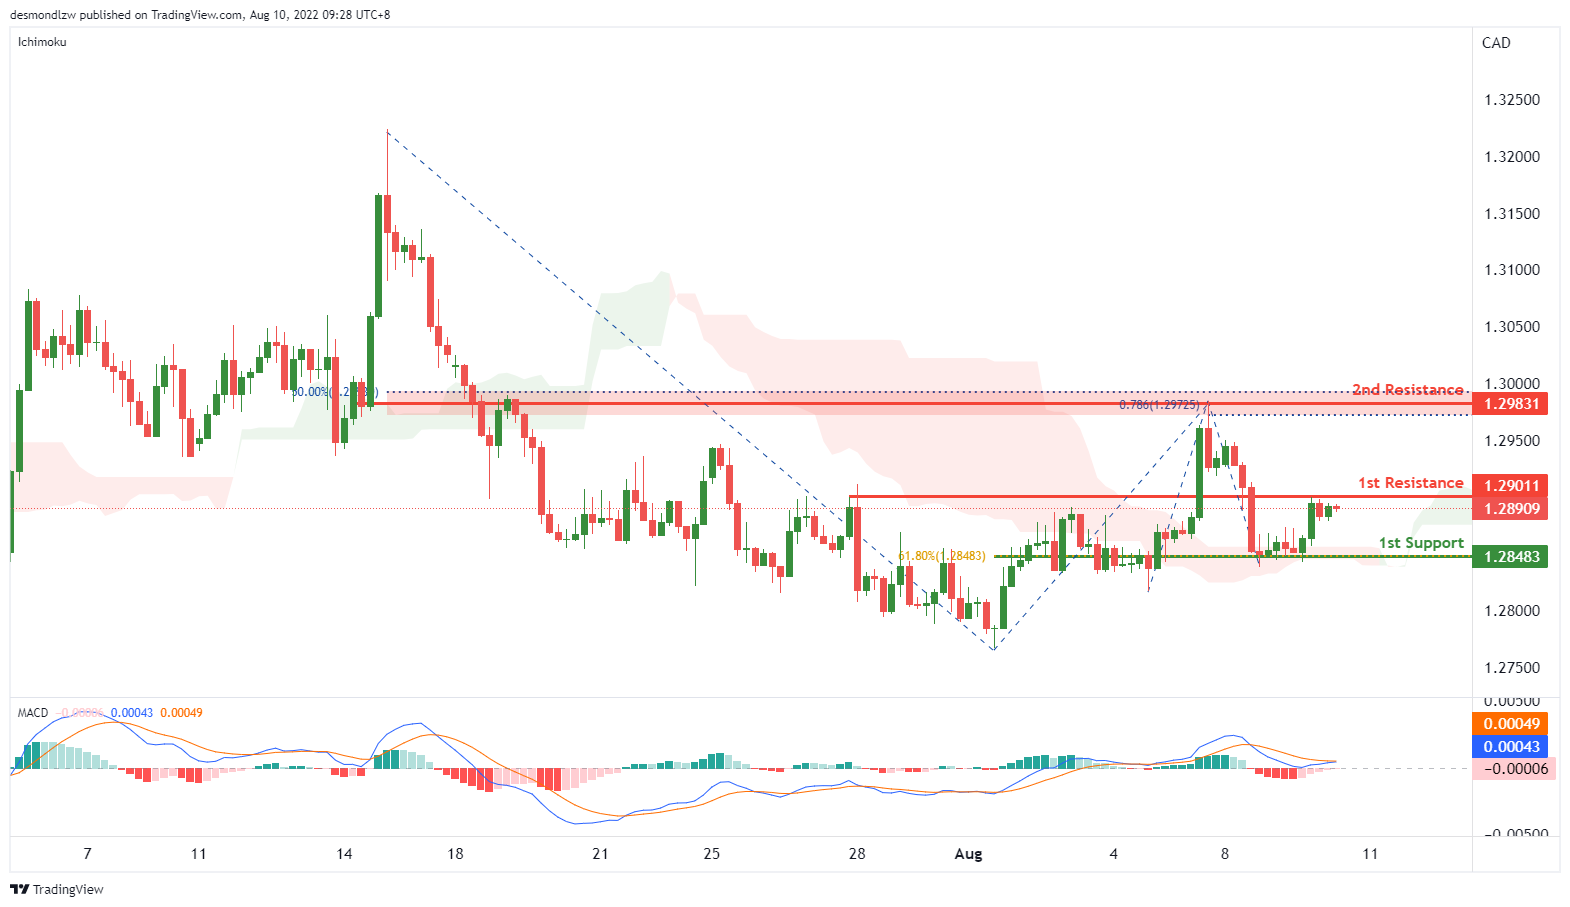
On the H4, with the price going above ichimoku cloud, and DIF is breaking the signal line in MACD, we have a bullish bias that the price may rise from our 1st resistance at 1.29011, which is in line with previous swing high to our 2nd resistance at 1.29831, which is in line with the 78.6% fibonacci projection and 50% fibonacci retracement. Alternatively, the price may drop to the 1st support at 1.28483, which is in line with 61.8% fibonacci retracement and pullback support.
Areas of consideration:
- H4 time frame, 1st resistance at 1.29011
- H4 time frame, 2nd resistance at 1.29831
OIL:
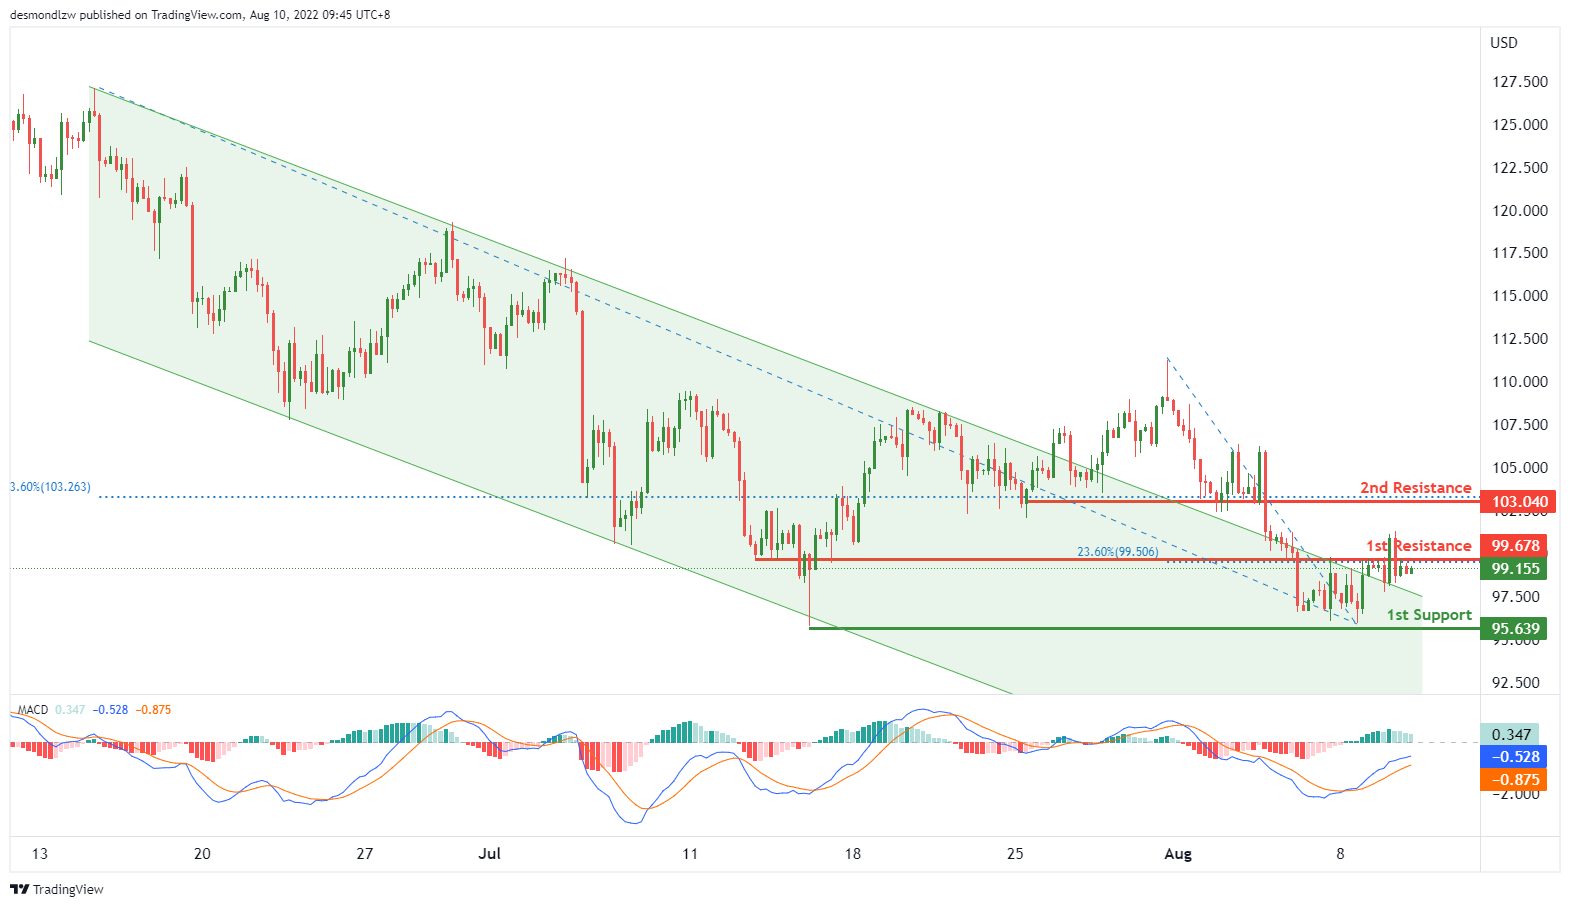
On the H4, with price braking the descending trendline, and the histogram of MACD is above zero axis, we have a bullish bias that the price may rise from our 1st resistance at 99.678, which is in line with the 23.6% fibonacci retracement to the 2nd resistance at 103.040, which is in line with the 23.6% fibonacci retracement and overlap resistance. Otherwise, the price may drop to our 1st support at 95.639, where the swing low support is.
Areas of consideration:
- H4 time frame, 1st resistance at 99.678
- H4 time frame, 2nd resistance at 103.04
Dow Jones Industrial Average:
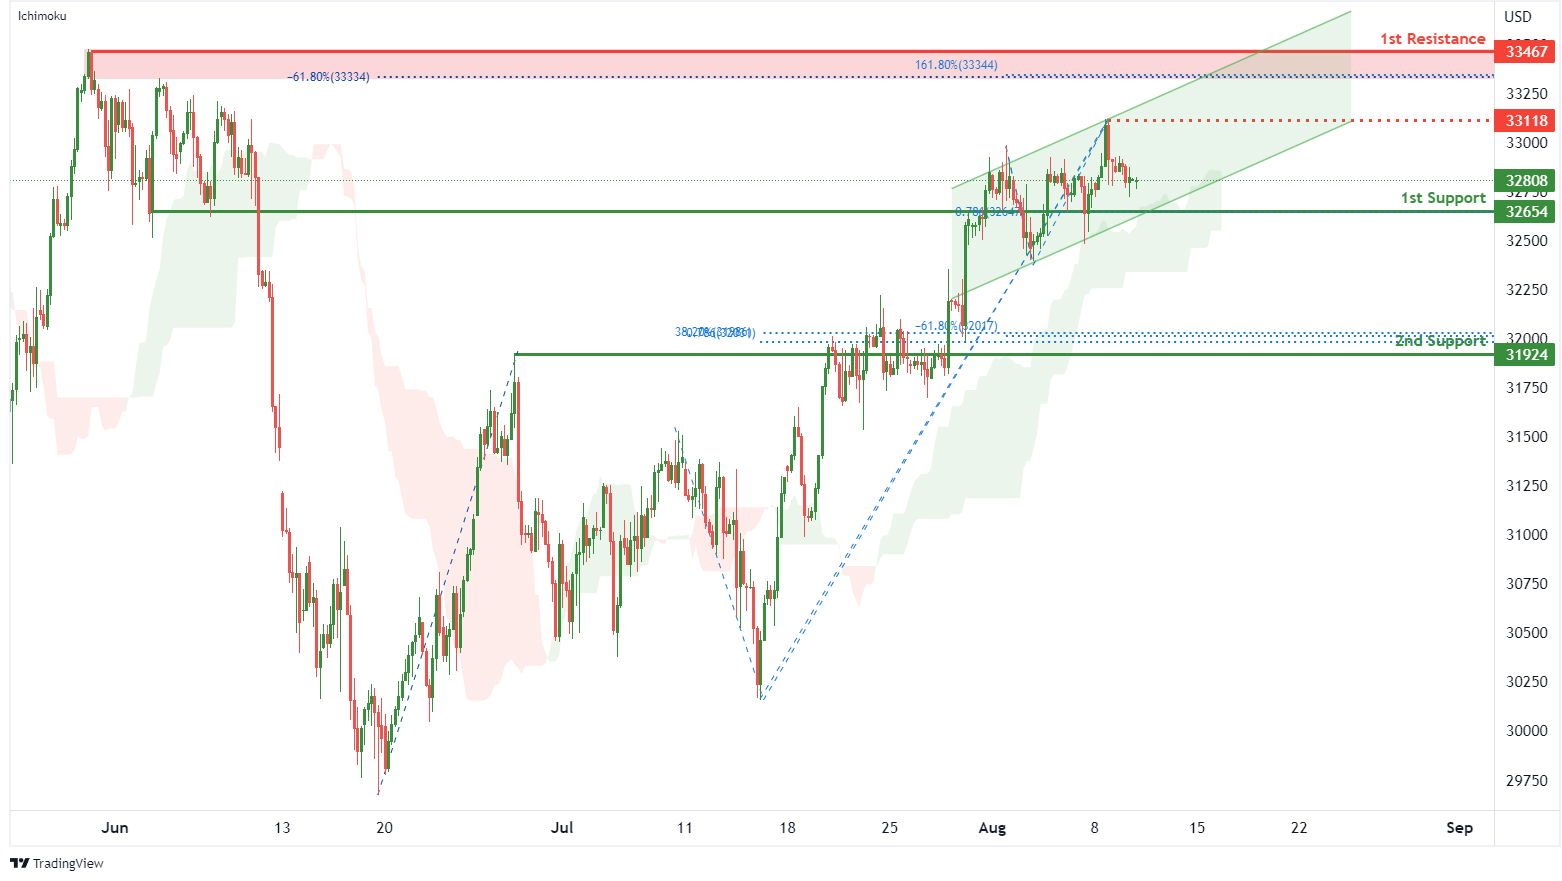
On the H4, with price moving above the ichimoku indicator and within an ascending channel, we have a bullish bias that price will rise from the 1st support at 32654 where the pullback support and 78.6% fibonacci projection are to the 1st resistance at 33467 where the swing high resistance, 161.8% fibonacci extension and -61.8% fibonacci expansion are. Take note of intermediate resistance at 33118 where the swing high resistance is. Alternatively, price could break 1st support structure and drop to 2nd support at 31924 where the pullback support, -61.8% fibonacci expansion, 38.2% fibonacci retracement and 78.6% fibonacci projection are.
Areas of consideration:
- H4 time frame, 1st resistance of 33467
- H4 time frame, 1st support at 32654
DAX:
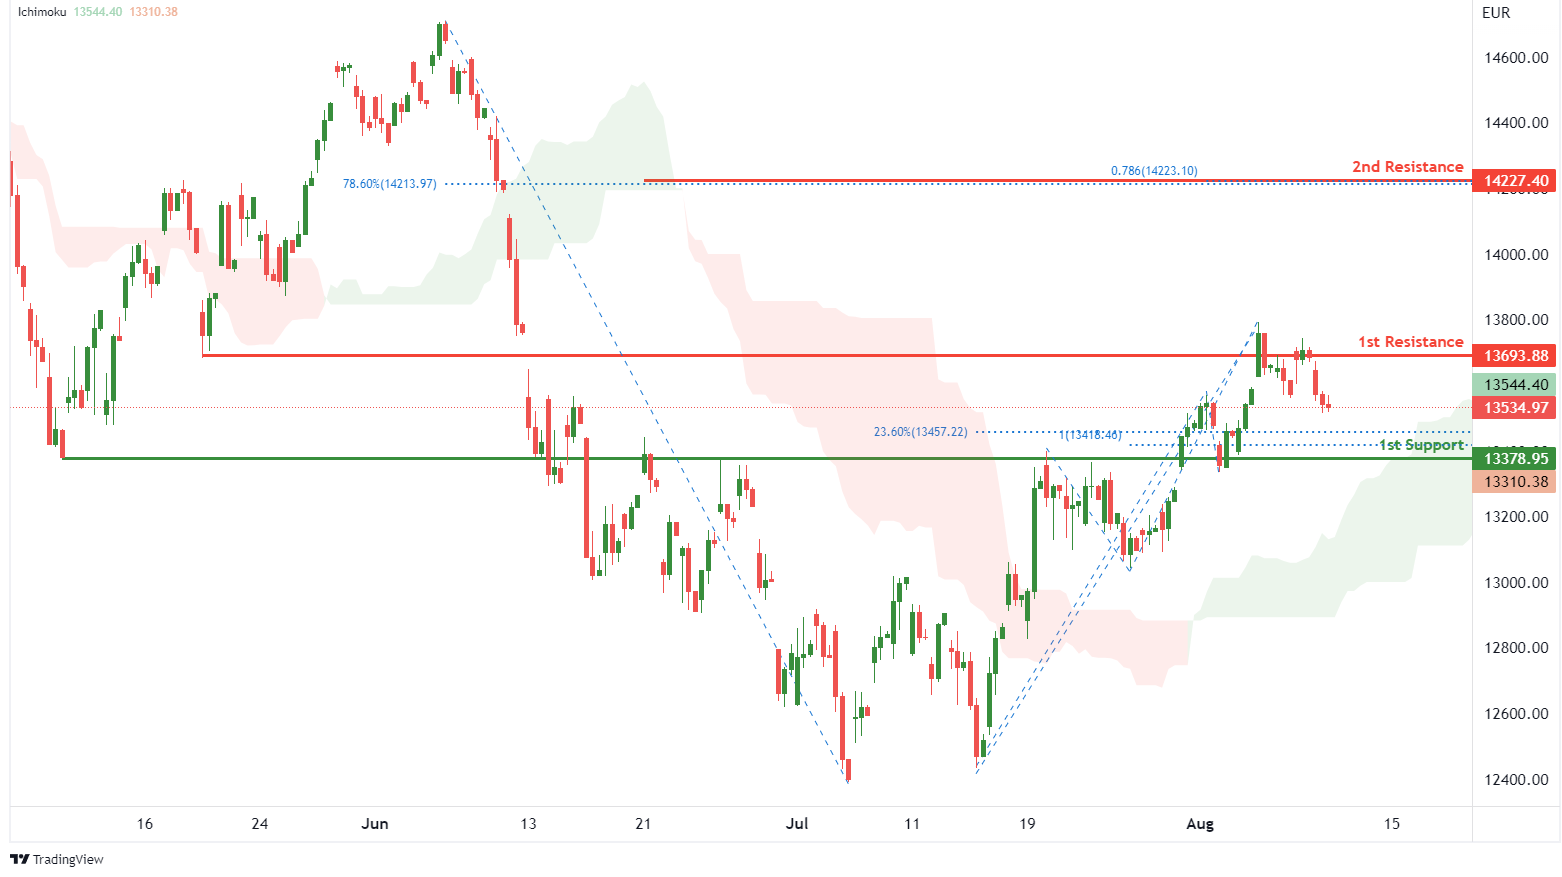
On the H4, with price moving above the ichimoku indicator, we have a bullish bias that price will rise to 1st resistance at 13693.88 where the pullback resistance is. Once there is upside confirmation of price breaking 1st resistance structure, we would expect bullish momentum to carry price to 2nd resistance at 14227.40 in line with 78.6% fibonacci projection and 78.6% fibonacci retracement. Alternatively, price could drop to 1st support at 13378.95 where the overlap support, 100% fibonacci projection and 23.6% fibonacci retracement are.
Areas of consideration:
- H4 time frame, 1st resistance of 13693.88
- H4 time frame, 1st support at 13378.95
ETHUSD:
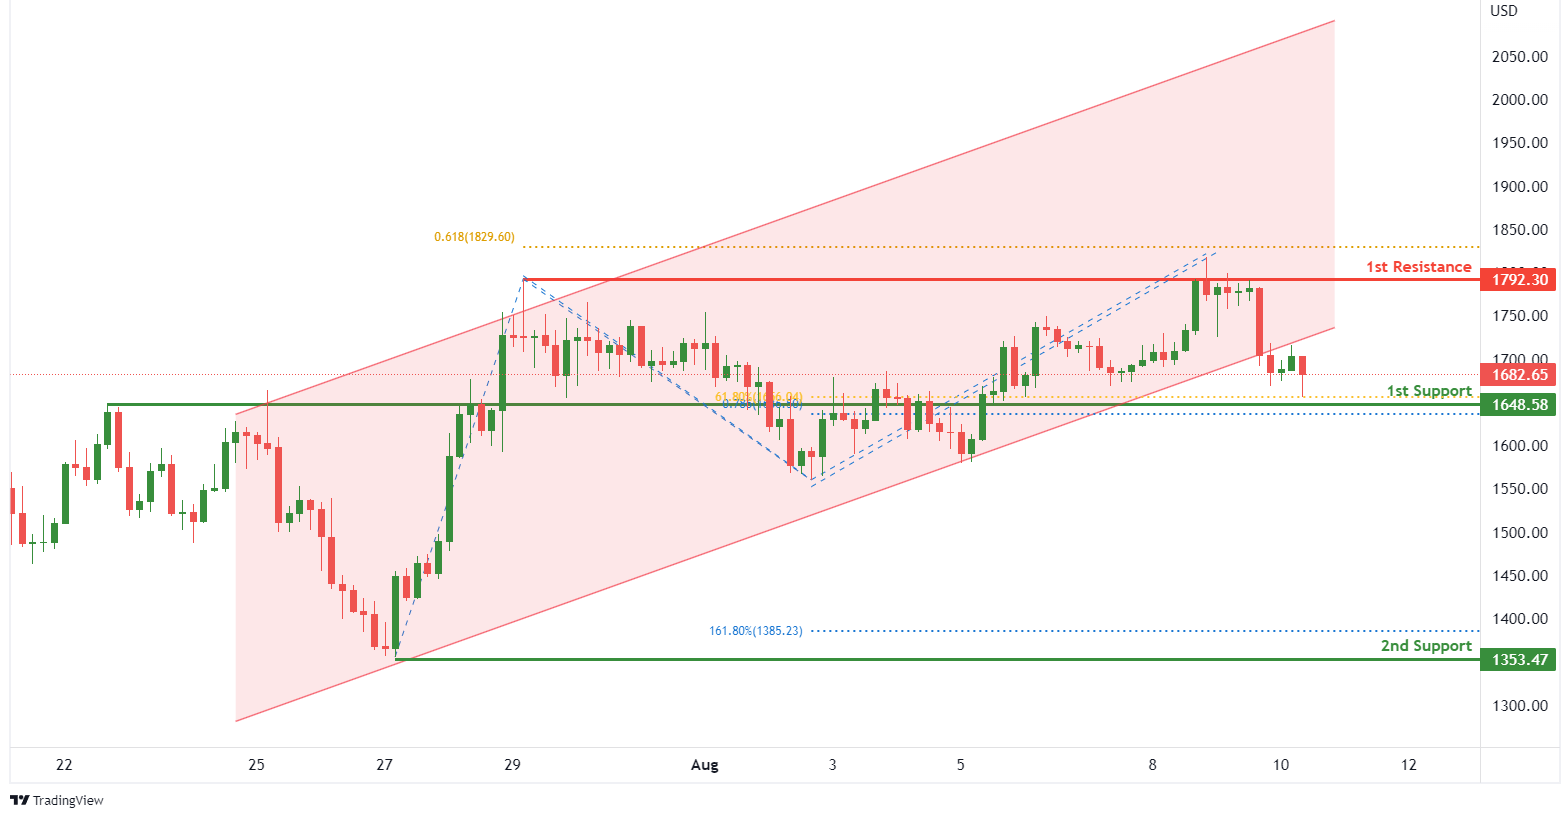
On the H4, with price breaking out of an ascending channel, we have a bearish bias that price will drop to 1st support at 1648.58 where the overlap support, 61.8% fibonacci retracement and 78.6% fibonacci projection are. Once there is downside confirmation that price has broken the 1st support structure, we would expect bearish momentum to carry price to 2nd support at 1353.47 where the swing low support and 161.8% fibonacci extension are. Alternatively,price could rise to 1st resistance at 1792.30 where the swing high resistance and 61.8% fibonacci projection are.
Areas of consideration:
- H4 time frame, 1st resistance of 1792.30
- H4 time frame, 1st support at 1648.58
BTCUSD:
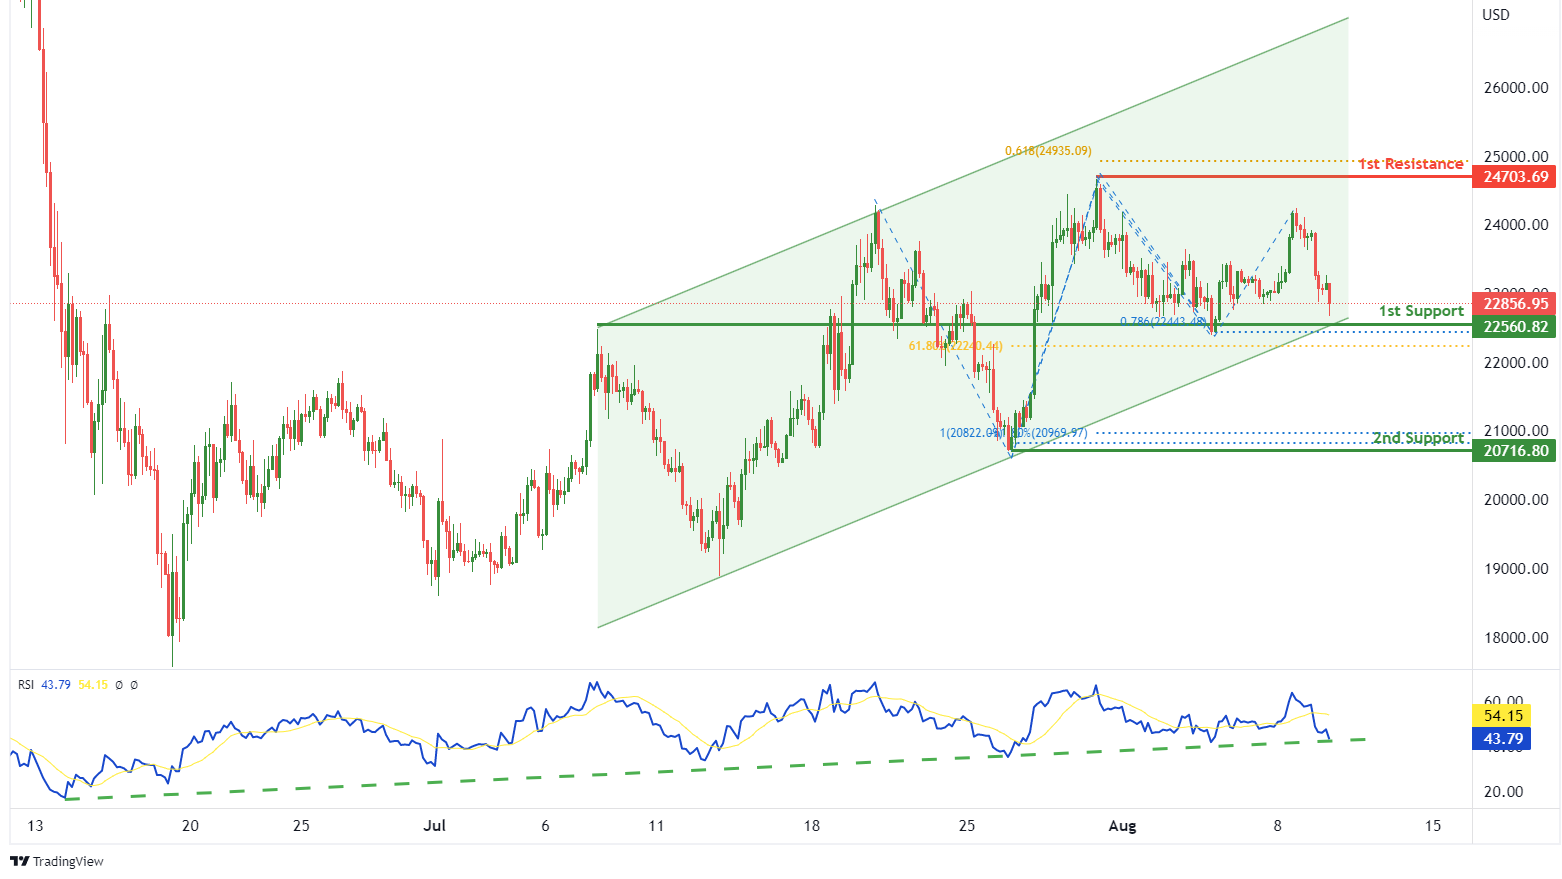
On the H4, with price moving within a bullish channel and RSI moving along an ascending trendline, we have a bullish bias that price will rise from our 1st support at 22560.82 where the pullback support, 61.8% fibonacci retracement and 78.6% fibonacci projection are to the 1st resistance at 24703.69 where the swing high resistance and 61.8% fibonacci projection are. Alternatively, price could break 1st support structure and drop to 2nd support at 20716.80 where the swing low support, -61.8% fibonacci expansion and 100% fibonacci projection are.
Areas of consideration:
- H4 time frame, 1st resistance of 24703.69
- H4 time frame, 1st support at 22560.82
S&P 500:
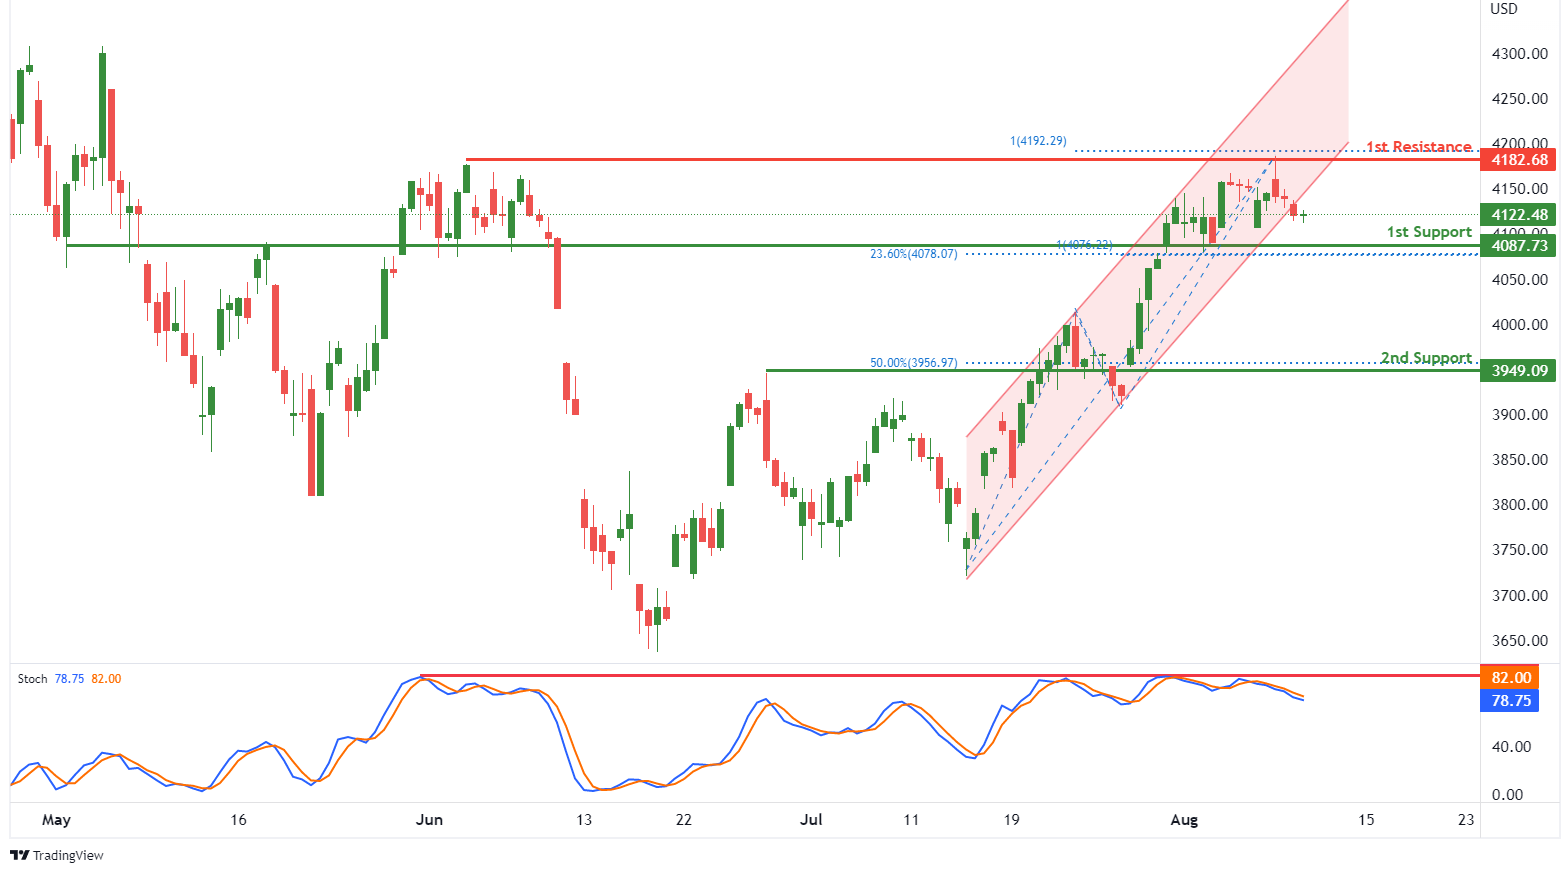
On the H4, with price breaking out of the ascending channel and reversing off the stochastic resistance, we have a bearish bias that price will drop to our 1st support at 4087.73 where the overlap support, 23.6% fibonacci retracement and 100% fibonacci projection are. Once there is downside confirmation that price has broken the 1st support structure, we would expect bearish momentum to carry price to 2nd support at 3949.09 where the pullback support and 50% fibonacci retracement is. Alternatively, price could rise to 1st resistance at 4182.68 where the swing high resistance and 100% fibonacci projection are.
Areas of consideration:
- H4 time frame, 1st resistance of 4182.68
- H4 time frame, 1st support at 4087.73